Attached files
| file | filename |
|---|---|
| 8-K - 8-K - CYNERGISTEK, INC | ctek_8k.htm |
CynergisTek Reports Third Quarter 2017 Financial Results
Taps Industry Veterans to Drive Growth
Mission Viejo, California – (November 9, 2017) – CynergisTek, Inc. (NYSE AMERICAN: CTEK), a leader in healthcare cybersecurity and information management, today announced financial results for the third quarter ended September 30, 2017.
Financial and operational highlights for the third quarter of 2017 include:
·Revenues for the third quarter were $17.9 million, an increase of 25% from $14.3 million in the third quarter of 2016
·GAAP net income for the third quarter was $1.1 million, or $0.11 per basic and diluted share compared to net income of $0.7 million, or $0.08 per basic and diluted share in the same period of 2016.
·Non-GAAP adjusted earnings per share for the third quarter was $0.26 per basic share and $0.25 per diluted share compared to $0.11 per basic and diluted share for the same period of 2016.
·Non-GAAP adjusted EBITDA was $3.0 million in the third quarter of 2017, compared to $1 million for the same period in 2016
Recent operational highlights include:
·Experienced demand for new professional services offerings, including adding resources in hospitals for short and long-term remediation and program development projects.
·Announced multi-million-dollar managed document services (MDS) contract with a prestigious southern children’s hospital.
·Realized first cross-selling revenues since merger integration efforts initiated; currently in proposal stage for long-term MDS contract with security customer.
·Strengthened senior operations team with additions of newly appointed Executive VP of Operations, Angela Rivera, formerly with Computer Task Group, Inc.; and Executive VP of Strategic Innovation, David Finn, formerly with Symantec.
·Created an enhanced vendor security management offering with the integration of RiskSonar, a risk assessment tool from the Delphiis acquisition.
“We made a great deal of progress during the quarter as we continued our expansion of high margin security services with the addition of several new lines, restructured our pricing model within our MDS business with the goal of enhancing future profitability, generated our first cross-selling revenues, and of greatest importance, made several high-profile additions to our management team,” said Mac McMillan, President and CEO of CynergisTek. “We continue diversifying our revenue base and performing profitability enhancing measures across the enterprise, which will partially offset client turnover we have experienced recently in our MDS offering. Client turnover is a normal part of the MDS business and traditionally this would not be an issue, but with the uncertainty in Washington regarding the Affordable Care Act, we continue to see extended sales cycles in that segment. We are adjusting to these challenges, by restructuring the way we deliver these services to customers with the goal of
1
enhancing profitability through more efficient delivery processes. Our goal is to maximize the shareholder value of this business model and we continue to make considerable progress doing exactly that while working through some short-term variability in our financial results.”
Financial results for the three and nine months ended September 30, 2017
For the three months ended September 30, 2017, the Company’s revenues increased by approximately $3.6 million to $17.9 million, as compared to the same period in 2016. This increase is largely attributable to the growth in our professional services as a result of the acquisition of CynergisTek in January 2017. Equipment sales for the third quarter of 2017 were approximately $0.7 million as compared to approximately $0.2 million in 2016. Equipment revenues are primarily from copier fleet refresh activities at customers. These fleet refreshes are sporadic since they are typically done every five years at any one customer facility.
Cost of revenue consists of salaries and expenses of direct labor and indirect support staff as well as document imaging equipment, parts and supplies. Cost of revenue was $11.7 million for the three months ended September 30, 2017, as compared to $11.1 million for the same period in 2016. Gross margin increased to 34% of revenue for the three months ended September 30, 2017 as compared to 23% for the same period in 2016. The increase is attributable to higher gross margins attained from professional services rendered through the newly acquired CynergisTek business and the benefit from the maturation of a couple large managed document services accounts. Over the next few quarters we expect gross margins to come down due to the recent turnover we experienced in managed document services with partial offset as we grow professional services.
Sales and marketing expenses were $1.3 million for the three months ended September 30, 2017, as compared to $0.6 million for the same period in 2016. The increase is attributable to the CynergisTek acquisition and building out of the sales and marketing teams which is expected to continue into 2018. General and administrative expenses increased by $0.2 million to $1.8 million for 2017, as compared to $1.6 million for the previous year. The increase in G&A was also attributed to the CynergisTek acquisition, and the absorption of this business. Amortization of acquisition-related intangibles increased to $0.5 for the three months ended September 30, 2017 compared to $0.1 million for the same period in 2016 due to the acquisition of CynergisTek.
The Company reported income from operations of $2.4 million for the three months ended September 30, 2017 compared to $0.8 million in the same period of the prior year.
Net income was $1.1 million for the three months ended September 30, 2017, or $0.11 per basic and diluted share, compared to net income of $0.7 million, or $0.08 per basic and diluted share in the same period of 2016.
The reconciliation of GAAP to non-GAAP information can be found in the tables at the end of this release and provide the details of the Company’s non-GAAP disclosures and the reconciliation of non-GAAP information.
Non-GAAP adjusted EBITDA, when adding back stock-based comp was $3.0 million in the third quarter of 2017, compared to $1 million for the same period in 2016.
2
Non-GAAP adjusted earnings for the third quarter of 2017 was $2.4 million or $0.26 per basic and $0.25 per diluted share after adjusting for estimated cash tax adjustment, amortization of intangibles, stock based compensation and depreciation of $1.3 million, compared $0.9 million or $0.11 per basic and diluted share after adjusting for amortization of intangibles, stock based compensation and depreciation of $0.2 million, for the same period of 2016.
For the nine months ended September 30, 2017, the Company reported revenues of $53.0 million, an increase of 20% compared to $44.0 million reported in the same period of 2016.
Cost of revenue for the nine months ended September 30, 2017 was $37.8 million compared to $35.4 million in 2016, representing an increase of $2.4 million. Gross profit for the nine months ended September 30, 2017, was $15.1 million, or 29% of revenues, compared to $8.6 million, or 20% of revenues, for the same period in 2016.
Operating expenses for the nine months ended September 30, 2017, was $11.8 million, an increase of 62% from $7.3 million in the same period of 2016.
Net income for the nine months ended September 30, 2017 was $1.2 million, or $0.12 per basic and diluted share, compared to net income of $1.2 million, or $0.14 per basic and diluted share, in the same period of 2016. Non-GAAP adjusted earnings for the nine months ended September 30, 2017 was $3.9 million or $0.42 per basic share and $0.40 per diluted share after adjusting for estimated cash tax adjustment, amortization of intangibles, stock based compensation, and depreciation of $2.7 million, compared to $1.9 million or $0.23 per basic and diluted share after adjusting for amortization of intangibles, stock based compensation, and depreciation of $0.7 million for the same period of 2016.
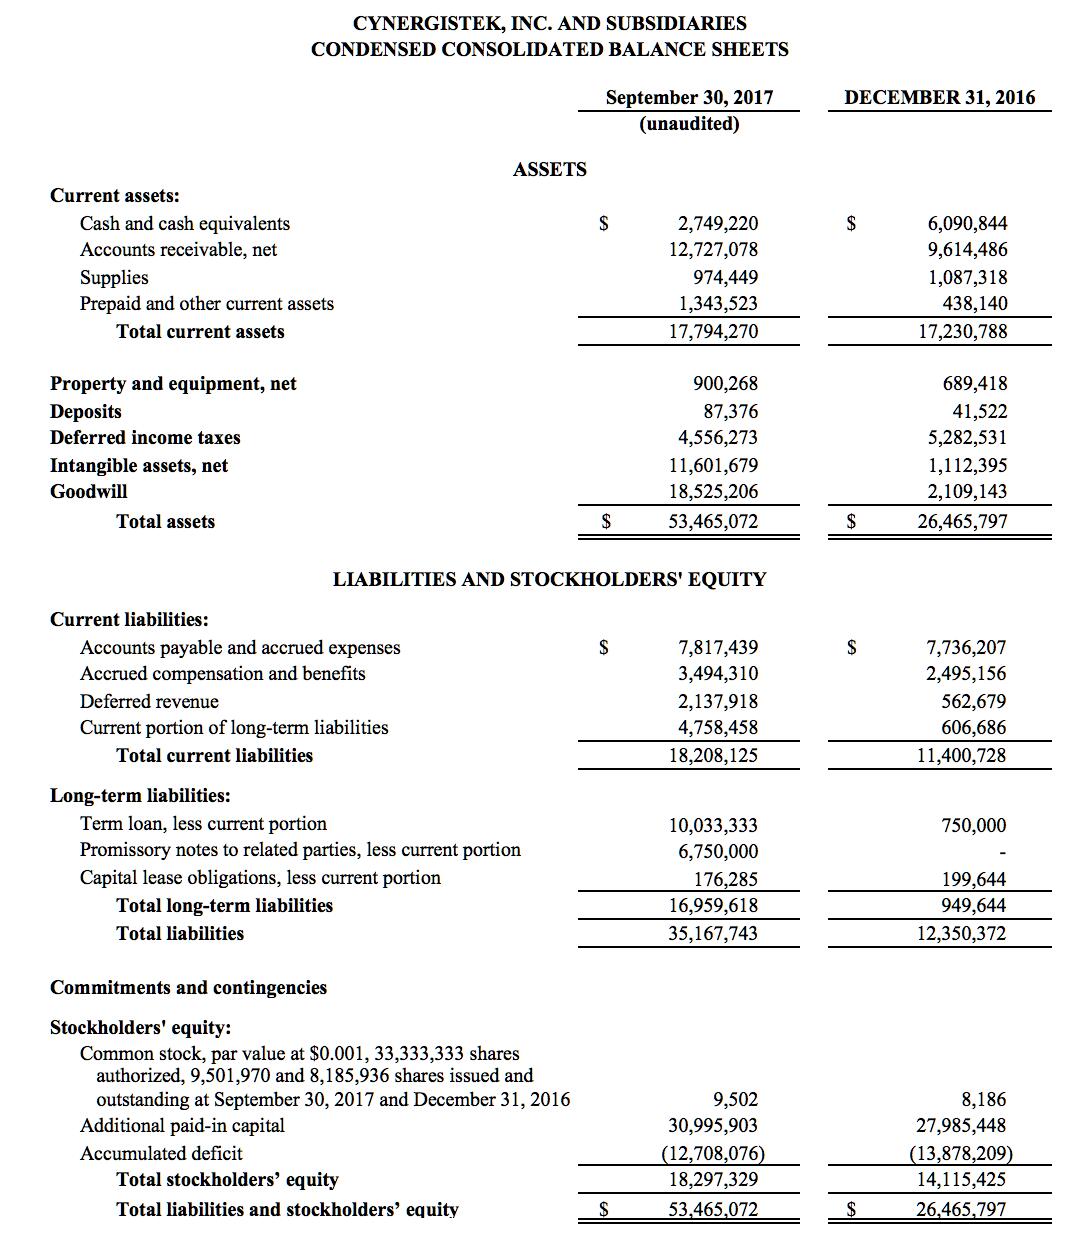
The Company had $2.7 million of cash and cash equivalents at the end of the quarter. The Company maintains a line of credit with a commercial bank for up to $5 million subject to borrowing base limitations. The credit line currently has no outstanding balance.
“We are happy with the 34% margin achievement this quarter and we expected some margin improvement year over year with the addition of CynergisTek’s business”, said Paul Anthony, CFO for CynergisTek. “This quarter we also got a lift from a couple of large accounts nearing finalization of their implementations. We don’t expect to maintain this margin percentage over the next few quarters due to the recent turnover in the MDS offering. As we grow the professional services offerings we do expect to see margins rebound.”
3
4
CYNERGISTEK, INC. AND SUBSIDIARIES
CONDENSED CONSOLIDATED STATEMENTS OF OPERATIONS
(UNAUDITED)
| Three Months | Nine Months | ||
| Ended September 30, | Ended September 30, | ||
| 2017 | 2016 | 2017 | 2016 |
Revenues | $ 17,897,076 | $ 14,326,382 | $ 52,950,678 | $ 44,004,091 |
Cost of revenues | 11,743,838 | 11,082,739 | 37,847,138 | 35,359,229 |
|
|
|
|
|
Gross profit | 6,153,238 | 3,243,643 | 15,103,540 | 8,644,862 |
|
|
|
|
|
Operating expenses: |
|
|
|
|
Sales and marketing | 1,329,909 | 636,120 | 4,070,765 | 1,981,282 |
General and administrative expenses | 1,849,164 | 1,624,259 | 5,876,895 | 4,719,933 |
Depreciation | 97,568 | 111,827 | 287,727 | 302,014 |
Amortization of acquisition-related intangibles | 520,030 | 91,250 | 1,560,716 | 273,750 |
|
|
|
|
|
Total operating expenses | 3,796,671 | 2,463,456 | 11,796,103 | 7,276,979 |
|
|
|
|
|
Income from operations | 2,356,567 | 780,187 | 3,307,437 | 1,367,883 |
|
|
|
|
|
Other income (expense): |
|
|
|
|
Other income | 1,862 | - | 1,884 | - |
Interest expense | (373,408) | (21,714) | (1,162,289) | (70,968) |
|
|
|
|
|
Total other income (expense) | (371,546) | (21,714) | (1,160,405) | (70,968) |
|
|
|
|
|
Income before provision for income taxes | 1,985,021 | 758,473 | 2,147,032 | 1,296,915 |
|
|
|
|
|
Income tax expense | (895,360) | (84,113) | (976,899) | (128,113) |
|
|
|
|
|
Net income | $ 1,089,661 | $ 674,360 | $ 1,170,133 | $ 1,168,802 |
|
|
|
|
|
Net income per share: |
|
|
|
|
Basic | $ .11 | $ .08 | $ .12 | $ .14 |
Diluted | $ .11 | $ .08 | $ .12 | $ .14 |
|
|
|
|
|
Number of weighted average shares: |
|
|
|
|
Basic | 9,501,760 | 8,185,741 | 9,387,264 | 8,168,978 |
Diluted | 9,881,236 | 8,272,202 | 9,835,428 | 8,287,664 |
5
Reconciliation of GAAP Income from Operations to Non-GAAP Adjusted EBITDA | ||||
| Three Months | Nine Months | ||
| Ended September 30, | Ended September 30, | ||
| 2017 | 2016 | 2017 | 2016 |
GAAP Income from operation | $2,356,567 | $780,187 | $3,307,437 | $1,367,883 |
Adjustments: |
|
|
|
|
Depreciation | 97,568 | 111,827 | 287,727 | 302,014 |
Amortization | 520,030 | 91,250 | 1,560,716 | 273,750 |
Stock-Based Compensation | 69,872 | 48,251 | 173,320 | 150,443 |
Non-GAAP Adjusted EBITDA | $3,044,037 | $1,031,515 | $5,329,200 | $2,094,090 |
|
|
|
|
|
Non-GAAP Adjusted EBITDA per share |
|
|
|
|
Basic | $0.32 | $0.13 | $0.57 | $0.26 |
Diluted | $0.31 | $0.12 | $0.54 | $0.25 |
|
|
|
|
|
Reconciliation of GAAP Net Income to Non-GAAP Adjusted Earnings | ||||
| Three Months | Nine Months | ||
| Ended September 30, | Ended September 30, | ||
| 2017 | 2016 | 2017 | 2016 |
GAAP Net Income | $1,089,661 | $674,360 | $1,170,133 | $1,168,802 |
Adjustments: |
|
|
|
|
Cash Tax Adjustment | 665,360 | - | 725,899 | - |
Depreciation | 97,568 | 111,827 | 287,727 | 302,014 |
Amortization | 520,030 | 91,250 | 1,560,716 | 273,750 |
Stock-Based Compensation | 69,872 | 48,251 | 173,320 | 150,443 |
Non-GAAP adjusted earnings | $2,442,491 | $925,688 | $3,917,795 | $1,895,009 |
|
|
|
|
|
Non-GAAP adjusted earnings per share |
|
|
|
|
Basic | $0.26 | $0.11 | $0.42 | $0.23 |
Diluted | $0.25 | $0.11 | $0.40 | $0.23 |
Conference Call Information
Date: Thursday, November 9, 2017
Time: 1:30pm PT, 4:30 pm ET
US: 1-800-756-4697
International: 1-913-905-3180
Conference ID: 7935223
Webcast: http://public.viavid.com/index.php?id=126985
A replay of the call will be available from 7:30 pm ET on November 9, 2017 to 11:59 pm ET on November 23, 2017. To access the replay, please dial 1-844-512-2921 from the U.S. and 1-412-317-6671 from outside the U.S. The PIN is 7935223.
6
About CynergisTek, Inc.
CynergisTek is a top-ranked cybersecurity and information management consulting firm dedicated to serving the healthcare industry. CynergisTek offers specialized services and solutions to help organizations achieve privacy, security, compliance, and document output management goals. Since 2004, the company has served as a partner to hundreds of healthcare organizations and is dedicated to supporting and educating the industry by contributing to relevant industry associations. The company has been named in numerous research reports as one of the top firms that provider organizations turn to for privacy and security, and won the 2017 Best in KLAS award for Cyber Security Advisory Services.
Forward Looking Statements
This release contains certain forward-looking statements relating to the business of CynergisTek that can be identified by the use of forward-looking terminology such as “believes,” “expects,” “anticipates,” “may” or similar expressions. Such forward-looking statements involve known and unknown risks and uncertainties, including uncertainties relating to product/services development, long and uncertain sales cycles, the ability to obtain or maintain patent or other proprietary intellectual property protection, market acceptance, future capital requirements, competition from other providers, the ability of our vendors to continue supplying the company with equipment, parts, supplies and services at comparable terms and prices and other factors that may cause actual results to be materially different from those described herein as anticipated, believed, estimated or expected. Certain of these risks and uncertainties are or will be described in greater detail in our Form 10-K and Form 10-Q filings with the Securities and Exchange Commission, which are available at http://www.sec.gov. CynergisTek is under no obligation (and expressly disclaims any such obligation) to update or alter its forward-looking statements whether as a result of new information, future events or otherwise.
Investor Relations Contact:
Bryan Flynn
(949) 357-3914
InvestorRelations@CynergisTek.com
Media Contact:
Danielle Johns
Senior Account Executive
Aria Marketing
(617) 332-9999 x241
djohns@ariamarketing.com
7