Attached files
| file | filename |
|---|---|
| EX-32 - EX-32 - WisdomTree Investments, Inc. | d443878dex32.htm |
| EX-31.2 - EX-31.2 - WisdomTree Investments, Inc. | d443878dex312.htm |
| EX-31.1 - EX-31.1 - WisdomTree Investments, Inc. | d443878dex311.htm |
Table of Contents
UNITED STATES
SECURITIES AND EXCHANGE COMMISSION
Washington, D.C. 20549
Form 10-Q
(Mark One)
| ☒ | QUARTERLY REPORT PURSUANT TO SECTION 13 OR 15(d) OF THE SECURITIES EXCHANGE ACT OF 1934 |
For the quarterly period ended September 30, 2017
or
| ☐ | TRANSITION REPORT PURSUANT TO SECTION 13 OR 15(d) OF THE SECURITIES EXCHANGE ACT OF 1934 |
For the transition period from to .
Commission File Number 001-10932
WisdomTree Investments, Inc.
(Exact name of registrant as specified in its charter)
| Delaware | 13-3487784 | |
| (State or other jurisdiction of incorporation or organization) |
(IRS Employer Identification No.) | |
| 245 Park Avenue, 35th Floor New York, New York |
10167 | |
| (Address of principal executive officers) | (Zip Code) | |
212-801-2080
(Registrant’s Telephone Number, Including Area Code)
Indicate by check mark whether the registrant (1) has filed all reports required to be filed by Section 13 or 15(d) of the Securities Exchange Act of 1934, as amended (the “Exchange Act”) during the preceding 12 months (or for such shorter period that the registrant was required to file such reports), and (2) has been subject to such filing requirements for the past 90 days. Yes ☒ No ☐
Indicate by check mark whether the registrant has submitted electronically and posted on its corporate Web site, if any, every Interactive Data File required to be submitted and posted pursuant to Rule 405 of Regulation S-T (§232.405 of this chapter) during the preceding 12 months (or for such shorter period that the registrant was required to submit and post such files). ☒ Yes ☐ No
Indicate by check mark whether the registrant is a large accelerated filer, an accelerated filer, a non-accelerated filer or a smaller reporting company. See definitions of “large accelerated filer,” “accelerated filer” and “smaller reporting company” in Rule 12b-2 of the Exchange Act.
| Large accelerated filer | ☒ | Accelerated filer | ☐ | |||
| Non-accelerated filer | ☐ | Smaller reporting company | ☐ | |||
Indicate by check mark whether the registrant is a shell company (as defined in Rule 12b-2 of the Exchange Act). Yes ☐ No ☒
Indicate by check mark whether the registrant is an emerging growth company as defined in Rule 405 of the Securities Act of 1933 (§230.405 of this chapter) or Rule 12b-2 of the Securities Exchange Act of 1934 (§240.12b-2 of this chapter).
Emerging growth company ☐
If an emerging growth company, indicate by check mark if the registrant has elected not to use the extended transition period for complying with any new or revised financial accounting standards provided pursuant to Section 13(a) of the Exchange Act. ☐
As of October 30, 2017, there were 136,911,671 shares of the registrant’s Common Stock, $0.01 par value per share, outstanding.
Table of Contents
WISDOMTREE INVESTMENTS, INC.
Form 10-Q
For the Quarterly Period Ended September 30, 2017
2
Table of Contents
CAUTIONARY NOTE REGARDING FORWARD-LOOKING STATEMENTS
This Quarterly Report on Form 10-Q contains forward-looking statements that are based on our management’s beliefs and assumptions and on information currently available to our management. Although we believe that the expectations reflected in these forward-looking statements are reasonable, these statements relate to future events or our future financial performance, and involve known and unknown risks, uncertainties and other factors that may cause our actual results, levels of activity, performance or achievements to be materially different from any future results, levels of activity, performance or achievements expressed or implied by these forward-looking statements.
In some cases, you can identify forward-looking statements by terminology such as “may,” “will,” “should,” “expects,” “intends,” “plans,” “anticipates,” “believes,” “estimates,” “predicts,” “potential,” “continue” or the negative of these terms or other comparable terminology. These statements are only predictions. You should not place undue reliance on forward-looking statements because they involve known and unknown risks, uncertainties and other factors, which are, in some cases, beyond our control and which could materially affect results. Factors that may cause actual results to differ materially from current expectations include, among other things, those listed in the section entitled “Risk Factors” included in our Annual Report on Form 10-K for the fiscal year ended December 31, 2016. If one or more of these or other risks or uncertainties occur, or if our underlying assumptions prove to be incorrect, actual events or results may vary significantly from those implied or projected by the forward-looking statements. No forward-looking statement is a guarantee of future performance. You should read this Report and the documents that we reference in this Report and have filed with the Securities and Exchange Commission, or the SEC, as exhibits to this Report, completely and with the understanding that our actual future results may be materially different from any future results expressed or implied by these forward-looking statements.
In particular, forward-looking statements in this Report may include statements about:
| • | anticipated trends, conditions and investor sentiment in the global markets and exchange traded products, or ETPs, which include exchange traded funds, or ETFs; |
| • | anticipated levels of inflows into and outflows out of our ETPs; |
| • | our ability to deliver favorable rates of return to investors; |
| • | our ability to develop new products and services; |
| • | our ability to maintain current vendors or find new vendors to provide services to us at favorable costs; |
| • | our ability to successfully expand our business into non-U.S. markets; |
| • | competition in our business; and |
| • | the effect of laws and regulations that apply to our business. |
The forward-looking statements in this Report represent our views as of the date of this Report. We anticipate that subsequent events and developments may cause our views to change. However, while we may elect to update these forward-looking statements at some point in the future, we have no current intention of doing so except to the extent required by applicable law. Therefore, these forward-looking statements do not represent our views as of any date other than the date of this Report.
3
Table of Contents
| ITEM 1. | FINANCIAL STATEMENTS |
WisdomTree Investments, Inc. and Subsidiaries
Consolidated Balance Sheets
(In Thousands, Except Per Share Amounts)
| September 30, 2017 |
December 31, 2016 |
|||||||
| (Unaudited) | ||||||||
| Assets: |
||||||||
| Current assets: |
||||||||
| Cash and cash equivalents |
$ | 70,221 | $ | 92,722 | ||||
| Securities owned, at fair value |
68,412 | 58,907 | ||||||
| Securities held-to-maturity |
2,999 | 3,994 | ||||||
| Accounts receivable |
19,734 | 17,668 | ||||||
| Prepaid expenses |
3,707 | 3,346 | ||||||
| Other current assets |
625 | 555 | ||||||
|
|
|
|
|
|||||
| Total current assets |
165,698 | 177,192 | ||||||
| Fixed assets, net |
11,004 | 11,748 | ||||||
| Securities held-to-maturity |
20,334 | 18,502 | ||||||
| Deferred tax asset, net |
6,151 | 9,826 | ||||||
| Investments, carried at cost |
31,909 | 20,000 | ||||||
| Goodwill |
1,799 | 1,799 | ||||||
| Intangible asset |
9,953 | 9,953 | ||||||
| Other noncurrent assets |
800 | 747 | ||||||
|
|
|
|
|
|||||
| Total assets |
$ | 247,648 | $ | 249,767 | ||||
|
|
|
|
|
|||||
| Liabilities and stockholders’ equity |
||||||||
| Liabilities: |
||||||||
| Current liabilities: |
||||||||
| Fund management and administration payable |
$ | 14,416 | $ | 13,584 | ||||
| Compensation and benefits payable |
14,990 | 14,652 | ||||||
| Income taxes payable |
3,608 | 4,700 | ||||||
| Acquisition payable |
— | 3,537 | ||||||
| Securities sold, but not yet purchased, at fair value |
— | 1,248 | ||||||
| Accounts payable and other liabilities |
6,922 | 5,806 | ||||||
|
|
|
|
|
|||||
| Total current liabilities: |
39,936 | 43,527 | ||||||
| Deferred rent payable |
4,736 | 4,896 | ||||||
|
|
|
|
|
|||||
| Total liabilities |
44,672 | 48,423 | ||||||
|
|
|
|
|
|||||
| Commitments and Contingencies (Note 8) |
||||||||
| Stockholders’ equity: |
||||||||
| Preferred stock, par value $0.01; 2,000 shares authorized: |
— | — | ||||||
| Common stock, par value $0.01; 250,000 shares authorized; issued and outstanding: 136,923 and 136,475 at September 30, 2017 and December 31, 2016, respectively |
1,369 | 1,365 | ||||||
| Additional paid-in capital |
225,795 | 224,739 | ||||||
| Accumulated other comprehensive income/(loss) |
528 | (44 | ) | |||||
| Accumulated deficit |
(24,716 | ) | (24,716 | ) | ||||
|
|
|
|
|
|||||
| Total stockholders’ equity |
202,976 | 201,344 | ||||||
|
|
|
|
|
|||||
| Total liabilities and stockholders’ equity |
$ | 247,648 | $ | 249,767 | ||||
|
|
|
|
|
|||||
The accompanying notes are an integral part of these consolidated financial statements
4
Table of Contents
WisdomTree Investments, Inc. and Subsidiaries
Consolidated Statements of Operations
(In Thousands, Except Per Share Amounts)
(Unaudited)
| Three Months Ended September 30, |
Nine Months Ended September 30, |
|||||||||||||||
| 2017 | 2016 | 2017 | 2016 | |||||||||||||
| Revenues: |
||||||||||||||||
| Advisory fees |
$ | 57,574 | $ | 51,553 | $ | 166,950 | $ | 168,099 | ||||||||
| Settlement gain (Note 8) |
— | — | 6,909 | — | ||||||||||||
| Other income |
412 | 236 | 2,154 | 549 | ||||||||||||
|
|
|
|
|
|
|
|
|
|||||||||
| Total revenues |
57,986 | 51,789 | 176,013 | 168,648 | ||||||||||||
| Expenses: |
||||||||||||||||
| Compensation and benefits |
19,492 | 15,328 | 55,787 | 44,897 | ||||||||||||
| Fund management and administration |
10,862 | 10,372 | 30,574 | 31,037 | ||||||||||||
| Marketing and advertising |
3,314 | 3,600 | 10,676 | 11,998 | ||||||||||||
| Sales and business development |
3,617 | 3,075 | 9,968 | 9,356 | ||||||||||||
| Professional and consulting fees |
1,035 | 1,035 | 3,814 | 5,235 | ||||||||||||
| Occupancy, communications and equipment |
1,378 | 1,469 | 4,102 | 3,932 | ||||||||||||
| Depreciation and amortization |
353 | 332 | 1,042 | 978 | ||||||||||||
| Third-party sharing arrangements |
710 | 622 | 2,312 | 2,238 | ||||||||||||
| Acquisition payment |
— | — | — | 6,738 | ||||||||||||
| Other |
1,729 | 1,731 | 5,195 | 5,186 | ||||||||||||
|
|
|
|
|
|
|
|
|
|||||||||
| Total expenses |
42,490 | 37,564 | 123,470 | 121,595 | ||||||||||||
|
|
|
|
|
|
|
|
|
|||||||||
| Income before taxes |
15,496 | 14,225 | 52,543 | 47,053 | ||||||||||||
| Income tax expense |
7,520 | 6,270 | 25,582 | 23,375 | ||||||||||||
|
|
|
|
|
|
|
|
|
|||||||||
| Net income |
$ | 7,976 | $ | 7,955 | $ | 26,961 | $ | 23,678 | ||||||||
|
|
|
|
|
|
|
|
|
|||||||||
| Net income per share—basic |
$ | 0.06 | $ | 0.06 | $ | 0.20 | $ | 0.17 | ||||||||
|
|
|
|
|
|
|
|
|
|||||||||
| Net income per share—diluted |
$ | 0.06 | $ | 0.06 | $ | 0.20 | $ | 0.17 | ||||||||
|
|
|
|
|
|
|
|
|
|||||||||
| Weighted-average common shares—basic |
134,709 | 134,046 | 134,552 | 134,541 | ||||||||||||
|
|
|
|
|
|
|
|
|
|||||||||
| Weighted-average common shares—diluted |
135,933 | 135,190 | 135,768 | 135,583 | ||||||||||||
|
|
|
|
|
|
|
|
|
|||||||||
| Cash dividends declared per common share |
$ | 0.08 | $ | 0.08 | $ | 0.24 | $ | 0.24 | ||||||||
|
|
|
|
|
|
|
|
|
|||||||||
The accompanying notes are an integral part of these consolidated financial statements
5
Table of Contents
WisdomTree Investments, Inc. and Subsidiaries
Consolidated Statements of Comprehensive Income
(In Thousands)
(Unaudited)
| Three Months Ended September 30, |
Nine Months Ended September 30, |
|||||||||||||||
| 2017 | 2016 | 2017 | 2016 | |||||||||||||
| Net income |
$ | 7,976 | $ | 7,955 | $ | 26,961 | $ | 23,678 | ||||||||
| Other comprehensive income |
||||||||||||||||
| Unrealized losses on available-for-sale securities, net of tax |
(96 | ) | — | (230 | ) | — | ||||||||||
| Foreign currency translation adjustment |
363 | 106 | 802 | 1,026 | ||||||||||||
|
|
|
|
|
|
|
|
|
|||||||||
| Other comprehensive income |
267 | 106 | 572 | 1,026 | ||||||||||||
|
|
|
|
|
|
|
|
|
|||||||||
| Comprehensive income |
$ | 8,243 | $ | 8,061 | $ | 27,533 | $ | 24,704 | ||||||||
|
|
|
|
|
|
|
|
|
|||||||||
The accompanying notes are an integral part of these consolidated financial statements
6
Table of Contents
WisdomTree Investments, Inc. and Subsidiaries
Consolidated Statements of Cash Flows
(In Thousands)
(Unaudited)
| Nine Months Ended September 30, |
||||||||
| 2017 | 2016 | |||||||
| Cash flows from operating activities: |
||||||||
| Net income |
$ | 26,961 | $ | 23,678 | ||||
| Adjustments to reconcile net income to net cash provided by operating activities: |
||||||||
| Settlement gain |
(6,909 | ) | — | |||||
| Deferred income taxes |
3,823 | 14,761 | ||||||
| Stock-based compensation |
10,558 | 11,092 | ||||||
| Depreciation and amortization |
1,042 | 978 | ||||||
| Other |
524 | (248 | ) | |||||
| Changes in operating assets and liabilities: |
||||||||
| Securities owned, at fair value |
1,146 | — | ||||||
| Accounts receivable |
(1,969 | ) | 10,207 | |||||
| Prepaid expenses |
(361 | ) | (1,370 | ) | ||||
| Other assets |
(31 | ) | (1 | ) | ||||
| Acquisition payable |
(3,545 | ) | (218 | ) | ||||
| Fund management and administration payable |
561 | 414 | ||||||
| Compensation and benefits payable |
115 | (18,944 | ) | |||||
| Income taxes payable |
(628 | ) | 2,260 | |||||
| Securities sold, but not yet purchased, at fair value |
(1,249 | ) | — | |||||
| Accounts payable and other liabilities |
1,041 | 1,336 | ||||||
|
|
|
|
|
|||||
| Net cash provided by operating activities |
31,079 | 43,945 | ||||||
|
|
|
|
|
|||||
| Cash flows from investing activities: |
||||||||
| Purchase of fixed assets |
(253 | ) | (654 | ) | ||||
| Purchase of securities held-to-maturity |
(3,009 | ) | (6,048 | ) | ||||
| Purchase of securities available-for-sale |
(76,776 | ) | — | |||||
| Purchase of investment |
(5,000 | ) | — | |||||
| Proceeds from held-to-maturity securities maturing or called prior to maturity |
2,162 | 13,579 | ||||||
| Proceeds from sales and maturities of securities available-for-sale |
65,067 | — | ||||||
| Acquisition less cash acquired |
— | (11,818 | ) | |||||
|
|
|
|
|
|||||
| Net cash used in investing activities |
(17,809 | ) | (4,941 | ) | ||||
|
|
|
|
|
|||||
| Cash flows from financing activities: |
||||||||
| Dividends paid |
(32,825 | ) | (32,748 | ) | ||||
| Shares repurchased |
(4,178 | ) | (39,116 | ) | ||||
| Proceeds from exercise of stock options |
53 | 107 | ||||||
|
|
|
|
|
|||||
| Net cash used in financing activities |
(36,950 | ) | (71,757 | ) | ||||
|
|
|
|
|
|||||
| Increase in cash flow due to changes in foreign exchange rate |
1,179 | 815 | ||||||
|
|
|
|
|
|||||
| Net decrease in cash and cash equivalents |
(22,501 | ) | (31,938 | ) | ||||
| Cash and cash equivalents—beginning of period |
92,722 | 210,070 | ||||||
|
|
|
|
|
|||||
| Cash and cash equivalents—end of period |
$ | 70,221 | $ | 178,132 | ||||
|
|
|
|
|
|||||
| Supplemental disclosure of cash flow information: |
||||||||
| Cash paid for taxes |
$ | 22,130 | $ | 6,664 | ||||
|
|
|
|
|
|||||
NON-CASH INVESTING ACTIVITY
On June 20, 2017, the Company was issued newly authorized preferred stock of Tradeworx, Inc. and a warrant to purchase additional preferred stock in connection with the resolution of a dispute related to the Company’s ownership stake in Tradeworx, Inc. The fair value of the preferred stock was $6,909 and is included in Investments on the Consolidated Balance Sheets. The fair value of the warrant was determined to be insignificant (See Note 6).
The accompanying notes are an integral part of these consolidated financial statements
7
Table of Contents
WisdomTree Investments, Inc. and Subsidiaries
Notes to Consolidated Financial Statements
(In Thousands, Except Share and Per Share Amounts)
1. Organization and Description of Business
WisdomTree Investments, Inc., through its global subsidiaries (collectively, “WisdomTree” or the “Company”), is an exchange traded product (“ETP”) sponsor and asset manager headquartered in New York. WisdomTree offers ETPs covering equity, fixed income, currency, alternative and commodity asset classes. The Company has the following wholly-owned operating subsidiaries:
| • | WisdomTree Asset Management, Inc. (“WTAM”) is a New York based investment adviser registered with the SEC providing investment advisory and other management services to the WisdomTree Trust (“WTT”) and WisdomTree exchange traded funds (“ETFs”). |
| • | Boost Management Limited (“BML”) is a Jersey based management company providing investment and other management services to Boost Issuer PLC (“BI”) and Boost ETPs. |
| • | WisdomTree Europe Limited (“WisdomTree Europe”) is a U.K. based company registered with the Financial Conduct Authority providing management and other services to BML and WisdomTree Management Limited. |
| • | WisdomTree Management Limited (“WTML”) is an Ireland based management company providing investment and other management services to WisdomTree Issuer plc (“WTI”) and WisdomTree UCITS ETFs. |
| • | WisdomTree Japan Inc. (“WTJ”) is a Japan based company that is registered with Japan’s Ministry of Finance and serves the institutional market selling U.S. listed WisdomTree ETFs in Japan. |
| • | WisdomTree Commodity Services, LLC (“WTCS”) is a New York based company that serves as the managing owner and commodity pool operator of the WisdomTree Continuous Commodity Index Fund. WTCS is registered with the Commodity Futures Trading Commission (“CFTC”) and is a member of the National Futures Association (“NFA”). |
| • | WisdomTree Asset Management Canada, Inc. (“WTAMC”) is a Canada based investment fund manager registered with the Ontario Securities Commission providing fund management services to locally-listed WisdomTree ETFs. |
The WisdomTree ETFs are issued in the U.S. by WTT. WTT, a non-consolidated third party, is a Delaware statutory trust registered with the SEC as an open-end management investment company. The Company has licensed to WTT the use of certain of its own indexes on an exclusive basis for the WisdomTree ETFs in the U.S. The Boost ETPs are issued by BI. BI, a non-consolidated third party, is a public limited company domiciled in Ireland. The WisdomTree UCITS ETFs are issued by WTI. WTI, a non-consolidated third party, is a public limited company domiciled in Ireland.
The Board of Trustees and Board of Directors of WTT, BI and WTI, respectively, are separate from the Board of Directors of the Company. The respective Trustees and Directors of WTT, BI and WTI, as applicable, are primarily responsible for overseeing the management and affairs of the WisdomTree ETFs, Boost ETPs and the WisdomTree UCITS ETFs for the benefit of the WisdomTree ETF, Boost ETP and the WisdomTree UCITS ETF shareholders, respectively, and have contracted with the Company to provide for general management and administration services. The Company, in turn, has contracted with third parties to provide the majority of these administration services. In addition, certain officers of the Company provide general management services for WTT, BI and WTI.
2. Significant Accounting Policies
Basis of Presentation
These consolidated financial statements have been prepared in conformity with U.S. generally accepted accounting principles (“GAAP”) and in the opinion of management reflect all adjustments, consisting of only normal recurring adjustments, necessary for a fair statement of financial condition, results of operations, and cash flows for the periods presented. The consolidated financial statements include the accounts of the Company’s wholly-owned subsidiaries.
All intercompany accounts and transactions have been eliminated in consolidation. Certain accounts in the prior years’ consolidated financial statements have been reclassified to conform to the current year’s consolidated financial statements presentation. These reclassifications had no effect on the previously reported operating results.
8
Table of Contents
Consolidation
The Company consolidates entities in which it has a controlling financial interest. The Company determines whether it has a controlling financial interest in an entity by first evaluating whether the entity is a voting interest entity (“VOE”) or a variable interest entity (“VIE”). The usual condition for a controlling financial interest in a VOE is ownership of a majority voting interest. If the Company has a majority voting interest in a VOE, the entity is consolidated. The Company has a controlling financial interest in a VIE when the Company has a variable interest that provides it with (i) the power to direct the activities of the VIE that most significantly impact the VIE’s economic performance and (ii) the obligation to absorb losses of the VIE or the right to receive benefits from the VIE that could potentially be significant to the VIE.
The Company had no variable interests in any VIEs at September 30, 2017 and December 31, 2016.
Segment and Geographic Information
The Company operates as an ETP sponsor and asset manager providing investment advisory services in the U.S., Europe, Canada and Japan. These activities are reported in the Company’s U.S. Business and International Business reportable segments. The U.S. Business segment includes the results of the Company’s U.S. operations and Japan sales office, which primarily engages in selling U.S. listed ETFs to Japanese institutional clients. The results of the Company’s European and Canadian operations are reported as the International Business segment.
Revenues are primarily derived in the U.S. and the vast majority of the Company’s AUM is currently located in the U.S.
Foreign Currency Translation
Assets and liabilities of subsidiaries whose functional currency is not the U.S. dollar are translated based on the end of period exchange rates from local currency to U.S. dollars. Results of operations are translated at the average exchange rates in effect during the period.
Use of Estimates
The preparation of the Company’s consolidated financial statements in conformity with U.S. GAAP requires management to make estimates and assumptions that affect the reported amounts of assets and liabilities as of the balance sheet dates and the reported amounts of revenues and expenses for the periods presented. Actual results could differ materially from those estimates.
Revenue Recognition
The Company earns investment advisory fees from its ETPs, as well as licensing fees from third parties. ETP advisory fees are based on a percentage of the ETPs’ average daily net assets and recognized over the period the related service is provided. Licensing fees are based on a percentage of the average monthly net assets and recognized over the period the related service is provided.
Depreciation and Amortization
Depreciation is provided for using the straight-line method over the estimated useful lives of the related assets as follows:
| Equipment |
5 years | |||
| Furniture and fixtures |
15 years |
Leasehold improvements are amortized over the term of their respective leases or service lives of the improvements, whichever is shorter. Fixed assets are recorded at cost less accumulated depreciation and amortization.
Occupancy
The Company accounts for its office lease facilities as operating leases, which may include free rent periods and escalation clauses. The Company expenses the lease payments associated with operating leases on a straight-line basis over the lease term.
Marketing and Advertising
Advertising costs, including media advertising and production costs, are expensed when incurred.
Cash and Cash Equivalents
The Company considers all highly liquid investments with an original maturity of 90 days or less at the time of purchase to be classified as cash equivalents.
9
Table of Contents
Accounts Receivable and Allowance for Doubtful Accounts
Accounts receivable are customer and other obligations due under normal trade terms. An allowance for doubtful accounts is not provided since, in the opinion of management, all accounts receivable recorded are deemed collectible.
Impairment of Long-Lived Assets
The Company performs a review for the impairment of long-lived assets when events or changes in circumstances indicate that the estimated undiscounted future cash flows expected to be generated by the assets are less than their carrying amounts or when other events occur which may indicate that the carrying amount of an asset may not be recoverable.
Earnings per Share
Basic earnings per share (“EPS”) is computed by dividing net income available to common stockholders by the weighted-average number of common shares outstanding for the period. Net income available to common stockholders represents net income of the Company reduced by an allocation of earnings to participating securities. Unvested share-based payment awards that contain non-forfeitable rights to dividends or dividend equivalents (whether paid or unpaid) are participating securities and are included in the computation of EPS pursuant to the two-class method. Share-based payment awards that do not contain such rights are not deemed participating securities and are included in diluted shares outstanding (if dilutive) under the treasury stock method. Diluted EPS reflects the reduction in earnings per share assuming dilutive options or other dilutive contracts to issue common stock were exercised or converted into common stock. Diluted EPS is calculated under both the treasury stock method and two-class method. The calculation that results in the most dilutive EPS amount for the common stock is reported in the Company’s consolidated financial statements.
Securities Owned and Securities Sold, but not yet Purchased (at fair value)
Securities owned and securities sold, but not yet purchased are securities classified as either trading or available-for-sale (“AFS”). These securities are recorded on their trade date and are measured at fair value. The Company classifies these financial instruments based primarily on the Company’s intent to hold or sell the security. Changes in the fair value of securities classified as trading are reported in other income in the period the change occurs. Unrealized gains and losses of securities classified as AFS are included in other comprehensive income. Once sold, amounts reclassified out of accumulated other comprehensive income and into earnings are determined using the specific identification method. AFS securities are assessed for impairment on a quarterly basis.
Securities Held-to-Maturity
The Company accounts for certain of its investments as held-to-maturity on a trade date basis, which are recorded at amortized cost. For held-to-maturity investments, the Company has the intent and ability to hold investments to maturity and it is not more-likely-than-not that the Company will be required to sell the investments before recovery of their amortized cost bases, which may be maturity. On a quarterly basis, the Company reviews its portfolio of investments for impairment. If a decline in fair value is deemed to be other-than-temporary, the security is written down to its fair value through earnings.
Investments, Carried at Cost
The Company accounts for equity securities that do not have a readily determinable fair value as cost method investments to the extent such investments are not subject to consolidation or the equity method. Income is recognized when dividends are received only to the extent they are distributed from net accumulated earnings of the investee. Otherwise, such distributions are considered returns of investment and are recorded as a reduction of the cost of the investment.
Cost method investments held by the Company are assessed for impairment on a quarterly basis.
Goodwill
Goodwill is the excess of the fair value of the purchase price over the fair values of the identifiable net assets at the acquisition date. The Company tests its goodwill for impairment at least annually and at the time of a triggering event requiring re-evaluation, if one were to occur. In accordance with Accounting Standards Update (“ASU”) 2017-04, Intangibles-Goodwill and Other (Topic 350): Simplifying the Test for Goodwill Impairment, which was early adopted by the Company, goodwill is impaired when the estimated fair value of the reporting unit that was allocated the goodwill is less than its carrying value. If the estimated fair value of such reporting unit is less than its carrying value, goodwill impairment is recognized based on that difference. A reporting unit is an operating segment or a component of an operating segment provided that the component constitutes a business for which discrete financial information is available and management regularly reviews the operating results of that component.
For impairment testing purposes, goodwill has been allocated to the Company’s U.S. Business reporting unit (See Note 14). The Company has designated April 30th as its annual goodwill impairment testing date. When performing its goodwill impairment test, the Company considers a qualitative assessment, when appropriate, and the income approach, market approach and its market capitalization when determining the fair value of its reporting units.
10
Table of Contents
Intangible Assets
Indefinite-lived intangible assets are tested for impairment at least annually and are reviewed for impairment whenever events or changes in circumstances indicate that the carrying amount of an asset may not be recoverable. Indefinite-lived intangible assets are impaired if their estimated fair values are less than their carrying values.
Finite-lived intangible assets, if any, are amortized over their estimated useful life, which is the period over which the assets are expected to contribute directly or indirectly to the future cash flows of the Company. These intangible assets are tested for impairment at the time of a triggering event, if one were to occur. Finite-lived intangible assets may be impaired when the estimated undiscounted future cash flows generated from the assets are less than their carrying amounts.
The Company may rely on a qualitative assessment when performing its intangible asset impairment test. Otherwise, the impairment evaluation is performed at the lowest level of identifiable cash flows independent of other assets. The Company has designated November 30th as its annual impairment testing date for its indefinite-lived intangible assets.
Stock-Based Awards
Accounting for stock-based compensation requires the measurement and recognition of compensation expense for all equity awards based on estimated fair values. Stock-based compensation is measured based on the grant-date fair value of the award and is amortized over the relevant service period.
Income Taxes
The Company accounts for income taxes using the liability method, which requires the determination of deferred tax assets and liabilities based on the differences between the financial and tax basis of assets and liabilities using the enacted tax rates in effect for the year in which differences are expected to reverse. Deferred tax assets are adjusted by a valuation allowance if, based on the weight of available evidence, it is more-likely-than-not that some portion or all the deferred tax assets will not be realized.
In order to recognize and measure any unrecognized tax benefits, management evaluates and determines whether any of its tax positions are more-likely-than-not to be sustained upon examination, including resolution of any related appeals or litigation processes, based on the technical merits of the position. Once it is determined that a position meets this recognition threshold, the position is measured to determine the amount of benefit to be recognized in the consolidated financial statements. The Company records interest expense and penalties related to tax expenses as income tax expense.
Non-income based taxes are recorded as part of other liabilities and other expenses.
Third Party Sharing Arrangements
The Company pays a percentage of its advisory fee revenues based on incremental growth in AUM, subject to caps or minimums, to marketing agents to sell WisdomTree ETFs and for including WisdomTree ETFs on third party customer platforms.
Recently Issued Accounting Pronouncements
In June 2016, the Financial Accounting Standards Board (“FASB”) issued ASU 2016-13, Financial Instruments-Credit Losses (Topic 326) – Measurement of Credit Losses on Financial Instruments (ASU 2016-13). The main objective of the standard is to provide financial statement users with more decision-useful information about the expected credit losses on financial instruments and other commitments to extend credit held by a reporting entity at each reporting date. To achieve this objective, the amendments in the standard replace the incurred loss impairment methodology with a methodology that reflects expected credit losses and requires consideration of a broader range of reasonable and supportable information to inform credit loss estimates. The standard is applicable to loans, accounts receivable, trade receivables, and other financial assets measured at amortized cost, loan commitments and certain other off-balance sheet credit exposures, debt securities (including those held-to-maturity) and other financial assets measured at fair value through other comprehensive income, and beneficial interests in securitized financial assets. Accordingly, the new methodology will be utilized when assessing the Company’s securities classified as AFS and held-to-maturity for impairment. ASU 2016-13 is effective for years beginning after December 15, 2019, including interim periods within those fiscal years under a modified retrospective approach. Early adoption is permitted for periods beginning after December 15, 2018. The Company is currently evaluating the impact that the standard will have on its consolidated financial statements.
In March 2016, the FASB issued ASU 2016-09, Compensation—Stock Compensation (Topic 718): Improvements to Employee Share-Based Payment Accounting (ASU 2016-09). The standard is intended to simplify several areas of accounting for share-based compensation arrangements, including the income tax impact, classification on the statement of cash flows and forfeitures. ASU 2016-09 is effective for fiscal years, and interim periods within those years, beginning after December 15, 2016, and early adoption is
11
Table of Contents
permitted. The Company adopted this standard prospectively on January 1, 2017. The adoption of the standard increased volatility reported in income tax expense as income tax windfalls and shortfalls associated with the vesting of stock-based compensation is now recorded in income tax expense, rather than additional paid-in capital, when applicable. This new guidance resulted in the Company recognizing approximately $248 and $1,338 of income tax expense for tax shortfalls related to stock-based compensation vesting occurring during the three and nine months ended September 30, 2017, respectively. This had the effect of reducing basic EPS by $0.01 for the nine months ended September 30, 2017 (See Notes 11 and 12).
In February 2016, the FASB issued ASU 2016-02, Leases (ASU 2016-02), which requires lessees to include most leases on the balance sheet. ASU 2016-02 is effective for fiscal years (and interim reporting periods within those years) beginning after December 15, 2018 and early adoption is permitted. The Company is currently evaluating the impact that the standard will have on its consolidated financial statements and expects, at a minimum, that its implementation will result in a gross-up on the consolidated balance sheets upon recognition of right-of-use assets and lease liabilities associated with the future minimum payments required under operating leases as disclosed in Note 8.
In January 2016, the FASB issued ASU 2016-01, Financial Instruments – Recognition and Measurement of Financial Assets and Financial Liabilities (ASU 2016-01). The main objective of the standard is to enhance the reporting model for financial instruments to provide users of financial statements with more decision-useful information. The amendments in the update make targeted improvements to generally accepted accounting principles. These include requiring equity investments (except those accounted for under the equity method of accounting or those that result in consolidation of the investee) to be measured at fair value with changes in fair value recognized in net income. Available-for-sale classification for equity investments with readily determinable fair values will no longer be permissible. However, an entity may choose to measure equity investments that do not have readily determinable fair values at cost minus impairment, if any, plus or minus changes resulting from observable price changes in orderly transactions for the identical or similar investment of the same issuer. The update also simplifies the impairment assessment of equity investments without readily determinable fair values by requiring a qualitative assessment to identify impairment. When a qualitative assessment indicates that impairment exists, an entity is required to measure the investment at fair value. ASU 2016-01 is effective for fiscal years beginning after December 15, 2017, including interim periods within those fiscal years. Early adoption is not permitted for the updates currently applicable to the Company. The Company’s equity investments with readily determinable fair values are all currently measured at fair value with changes in fair value recognized in net income. Upon adoption, the Company will apply the amendments in this update when assessing the carrying value of its investments, held at cost.
In May 2014, the FASB issued ASU 2014-09, Revenue from Contracts with Customers (ASU 2014-09), which is a new comprehensive revenue recognition standard on the financial reporting requirements for revenue from contracts entered into with customers. In July 2015, the FASB deferred this ASU’s effective date by one year, to interim and annual periods beginning after December 15, 2017. The deferral allows early adoption at the original effective date. During 2016, the FASB issued ASU 2016-08, which clarifies principal versus agent considerations, ASU 2016-10, which clarifies identifying performance obligations and the licensing implementation guidance, and ASU 2016-12, which amends certain aspects of the new revenue recognition standard pursuant to ASU 2014-09. ASU 2014-09 allows for the use of either the retrospective or modified retrospective adoption method. The Company will implement this standard under the modified retrospective method and has determined the standard will not have a material impact on the Company’s consolidated financial statements.
3. Cash and Cash Equivalents
Cash and cash equivalents of approximately $42,635 and $56,484 at September 30, 2017 and December 31, 2016, respectively, were held at one financial institution. At September 30, 2017 and December 31, 2016, cash equivalents were approximately $10,317 and $55,619, respectively.
4. Securities Owned and Securities Sold, but not yet Purchased (and Fair Value Measurement)
Securities owned and securities sold, but not yet purchased are measured at fair value. The fair value of securities is defined as the price that would be received to sell an asset or paid to transfer a liability (i.e., “the exit price”) in an orderly transaction between market participants at the measurement date. ASC 820, Fair Value Measurements, establishes a hierarchy for inputs used in measuring fair value that maximizes the use of observable inputs and minimizes the use of unobservable inputs by requiring that the most observable inputs be used when available. Observable inputs are inputs that market participants would use in pricing the asset or liability developed based on market data obtained from independent sources. Unobservable inputs reflect assumptions that market participants would use in pricing the asset or liability developed based on the best information available in the circumstances. The hierarchy is broken down into three levels based on the transparency of inputs as follows:
| Level 1 | – | Quoted prices for identical instruments in active markets. | ||
| Level 2 | – | Quoted prices for similar instruments in active markets; quoted prices for identical or similar instruments in markets that are not active; and model-derived valuations whose inputs are observable or whose significant value drivers are observable. | ||
| Level 3 | – | Instruments whose significant drivers are unobservable. | ||
12
Table of Contents
The availability of observable inputs can vary from product to product and is effected by a wide variety of factors, including, for example, the type of product, whether the product is new and not yet established in the marketplace, and other characteristics particular to the transaction. To the extent that valuation is based on models or inputs that are less observable or unobservable in the market, the determination of fair value requires more judgment. Accordingly, the degree of judgment exercised by management in determining fair value is greatest for instruments categorized in Level 3. In certain cases, the inputs used to measure fair value may fall into different levels of the fair value hierarchy. In such cases, for disclosure purposes, the level in the fair value hierarchy within which the fair value measurement in its entirety falls is determined based on the lowest level input that is significant to the fair value measurement in its entirety.
Fair Valuation Methodology
Cash and Cash Equivalents – These financial assets represent cash in banks or cash invested in highly liquid investments with original maturities less than 90 days. These investments are valued at par, which approximates fair value, and are considered Level 1 (See Note 3).
Securities (Held-to-Maturity) – These securities are Federal agency debt instruments which are instruments that are generally traded in active, quoted and highly liquid markets and are therefore classified as Level 1 within the fair value hierarchy (See Note 5).
Securities Owned/Sold But Not Yet Purchased – These securities consist of securities classified as trading and AFS, as follows:
| September 30, 2017 |
December 31, 2016 |
|||||||
| Securities Owned |
||||||||
| Trading securities |
$ | 410 | $ | 1,556 | ||||
| Available-for-sale securities |
68,002 | 57,351 | ||||||
|
|
|
|
|
|||||
| Total |
$ | 68,412 | $ | 58,907 | ||||
|
|
|
|
|
|||||
| Securities Sold, but not yet Purchased |
||||||||
| Trading securities |
$ | — | $ | 1,248 | ||||
| Available-for-sale securities |
— | — | ||||||
|
|
|
|
|
|||||
| Total |
$ | — | $ | 1,248 | ||||
|
|
|
|
|
|||||
Trading securities are investments in ETFs. These instruments are generally traded in active, quoted and highly liquid markets and are therefore classified as Level 1 within the fair value hierarchy. AFS securities are investments in short-term investment grade corporate bonds and are classified as Level 2. Fair value is generally derived from observable bids for these Level 2 financial instruments.
AFS Securities
The following table summarizes unrealized gains, losses and fair value of the AFS securities:
| September 30, 2017 |
December 31, 2016 |
|||||||
| Cost |
$ | 68,637 | $ | 57,615 | ||||
| Gross unrealized gains in other comprehensive income |
— | — | ||||||
| Gross unrealized losses in other comprehensive income |
(635 | ) | (264 | ) | ||||
|
|
|
|
|
|||||
| Fair value |
$ | 68,002 | $ | 57,351 | ||||
|
|
|
|
|
|||||
All the Company’s AFS securities are due within one year. The Company assesses the AFS securities for other-than-temporary impairment on a quarterly basis. No AFS securities were determined to be other-than-temporarily impaired at September 30, 2017 or December 31, 2016.
During the three and nine months ended September 30, 2017, the Company received $19,003 and $65,067, respectively, of proceeds from the sale and maturity of available-for-sale securities and recognized gross realized losses of $277 and $687, respectively. These losses have been reclassified out of accumulated other comprehensive income and into other income in the Consolidated Statements of Operations.
13
Table of Contents
Interests Held in Tradeworx, Inc.
On June 20, 2017, the Company was issued newly authorized preferred stock of Tradeworx, Inc. (“Tradeworx”) and a warrant to purchase additional preferred stock in connection with the resolution of a dispute related to the Company’s ownership stake in Tradeworx. The fair value of the preferred stock was $6,909 and is included in Investments on the Consolidated Balance Sheets (See Note 6). The fair value of the warrant was determined to be insignificant.
The fair value of these interests held were derived from an enterprise valuation of Tradeworx prepared as of April 30, 2017. The Tradeworx enterprise valuation was determined through a combination of a market approach (Guideline Public Company Method) and income approach (discounted cash flow analyses) applied to its business lines. These approaches are predominantly based on unobservable inputs and therefore the valuation of these interests held are classified as Level 3. The table below presents the ranges and weighted averages of significant unobservable inputs used in these approaches to determine the enterprise value of Tradeworx.
| Market Approach(1) |
Range (Weighted Average) | |
| Revenue multiple |
0.9x | |
| Income Approach(1) |
Range (Weighted Average) | |
| Weighted average cost of capital (“WACC”) |
11.5% – 14.5% (12.6%) | |
| (1) | The approach and inputs selected varied, based upon the Tradeworx business line being valued. |
An increase in the revenue multiple would result in a higher enterprise value, whereas, an increase in the WACC would reduce fair value.
5. Securities Held-to-Maturity
The following table is a summary of the Company’s securities held-to-maturity:
| September 30, 2017 |
December 31, 2016 |
|||||||
| Federal agency debt instruments (at amortized cost) |
$ | 23,333 | $ | 22,496 | ||||
|
|
|
|
|
|||||
The following table summarizes unrealized gains, losses, and fair value of securities held-to-maturity:
| September 30, 2017 |
December 31, 2016 |
|||||||
| Cost/amortized cost |
$ | 23,333 | $ | 22,496 | ||||
| Gross unrealized gains |
12 | 13 | ||||||
| Gross unrealized losses |
(1,234 | ) | (1,353 | ) | ||||
|
|
|
|
|
|||||
| Fair value |
$ | 22,111 | $ | 21,156 | ||||
|
|
|
|
|
|||||
The Company assesses these securities for other-than-temporary impairment on a quarterly basis. No securities were determined to be other-than-temporarily impaired at September 30, 2017 or December 31, 2016. The Company does not intend to sell these securities and it is not more likely than not that the Company will be required to sell the securities before recovery of their amortized cost bases, which may be at maturity.
The following table sets forth the maturity profile of the securities held-to-maturity; however, these securities may be called prior to maturity date:
| September 30, 2017 |
December 31, 2016 |
|||||||
| Due within one year |
$ | 2,999 | $ | 3,994 | ||||
| Due one year through five years |
13 | 1,023 | ||||||
| Due five years through ten years |
6,028 | 4,031 | ||||||
| Due over ten years |
14,293 | 13,448 | ||||||
|
|
|
|
|
|||||
| Total |
$ | 23,333 | $ | 22,496 | ||||
|
|
|
|
|
|||||
14
Table of Contents
6. Investments, Carried at Cost
The following table sets forth the Company’s investments, carried at cost:
| September 30, 2017 |
December 31, 2016 |
|||||||
| AdvisorEngine Inc. |
$ | 25,000 | $ | 20,000 | ||||
| Tradeworx, Inc. |
6,909 | — | ||||||
|
|
|
|
|
|||||
| Total |
$ | 31,909 | $ | 20,000 | ||||
|
|
|
|
|
|||||
AdvisorEngine Inc.
On November 18, 2016, the Company made a $20,000 strategic investment in AdvisorEngine Inc. (“AdvisorEngine”), an end-to-end wealth management platform which enables individual customization of investment philosophies. The Company and AdvisorEngine also entered into an agreement whereby the Company’s asset allocation models are made available through AdvisorEngine’s open architecture platform and the Company actively introduces the platform to its distribution network. In consideration of its investment, the Company received 11,811,856 shares of Series A convertible preferred shares (“Series A Preferred”).
The Series A Preferred is convertible into common stock at the option of the Company and contains various rights and protections including a non-cumulative 6.0% dividend, payable if and when declared by the board of directors, and a liquidation preference that is senior to all other holders of capital stock of AdvisorEngine.
On April 27, 2017, the Company invested an additional $5,000 in AdvisorEngine to help facilitate AdvisorEngine’s acquisition of Kredible Technologies, Inc., a technology enabled, research-driven practice management firm designed to help advisors acquire new clients, and to continue to fuel AdvisorEngine’s growth, leadership and innovation in the advisor solutions space. The Company received 2,646,062 shares of Series A-1 convertible preferred stock which has substantially the same terms as the Series A Preferred.
The Company’s aggregate equity ownership interest in AdvisorEngine is approximately 47% (or 41% on a fully-diluted basis). The investment is accounted for under the cost method of accounting as it is not considered to be in-substance common stock and is assessed for impairment on a quarterly basis. No impairment existed at September 30, 2017 or December 31, 2016.
Tradeworx
On June 20, 2017, the Company was issued 7,797,533 newly authorized shares of Series Y preferred stock (“Series Y Preferred”) of Tradeworx in connection with the resolution of a dispute related to the Company’s ownership stake in Tradeworx (See Note 8). The Series Y Preferred represents ownership of 19.99% of Tradeworx on a fully diluted basis (excluding certain reserved shares). In addition, the Company was issued a warrant to purchase 3,898,766 shares of Series Y Preferred.
The Series Y Preferred ranks pari passu in priority with Tradeworx’s current preferred stockholders, has a liquidation preference of $0.231 per share, contains various rights and protections and is convertible into common stock at the option of the Company. The warrant is exercisable for five years after closing, at varying exercise prices that increase over time and set at multiples of a pre-determined Tradeworx valuation (or new valuation if Tradeworx completes a qualified financing, as defined, within two years). If a claim is brought against Tradeworx or the Company relating to the settlement, the warrant will be exercisable for 100% of the number of shares of Series Y Preferred issued to the Company at closing.
The Company recorded the Series Y Preferred at its fair value of $6,909 (See Note 4). The Series Y Preferred is not considered to be in-substance common stock and is therefore accounted for under the cost method of accounting and is assessed for impairment on a quarterly basis. The fair value of the warrant was determined to be insignificant. The warrant is not accounted for as a derivative as it cannot be net settled and is not readily convertible to cash.
7. Fixed Assets
The following table summarizes fixed assets:
| September 30, 2017 |
December 31, 2016 |
|||||||
| Equipment |
$ | 1,870 | $ | 1,739 | ||||
| Furniture and fixtures |
2,435 | 2,393 | ||||||
| Leasehold improvements |
11,017 | 10,877 | ||||||
| Less: Accumulated depreciation and amortization |
(4,318 | ) | (3,261 | ) | ||||
|
|
|
|
|
|||||
| Total |
$ | 11,004 | $ | 11,748 | ||||
|
|
|
|
|
|||||
15
Table of Contents
8. Commitments and Contingencies
Contractual Obligations
The Company has entered into obligations under operating leases with initial non-cancelable terms in excess of one year for office space, telephone and data services. Expenses recorded under these agreements for the three months ended September 30, 2017 and 2016 were approximately $1,177 and $1,203, respectively, and for the nine months ended September 30, 2017 and 2016 were approximately $3,327 and $3,221, respectively.
Future minimum lease payments with respect to non-cancelable operating leases at September 30, 2017 were approximately as follows:
| Remainder of 2017 |
$ | 1,059 | ||
| 2018 |
3,762 | |||
| 2019 |
3,139 | |||
| 2020 |
2,873 | |||
| 2021 and thereafter |
24,079 | |||
|
|
|
|||
| Total |
$ | 34,912 | ||
|
|
|
Letter of Credit
The Company collateralized its U.S. office lease through a standby letter of credit totaling $1,384. The collateral is included in cash and cash equivalents on the Company’s Consolidated Balance Sheets.
Questrade Wealth Management Inc. (“Questrade”) Purchase and Sale Agreement
On July 26, 2017 the Company and WTAMC entered into a purchase and sale agreement with Questrade pursuant to which WTAMC has agreed to acquire and become the trustee and manager for, a suite of eight Canadian registered ETFs currently sponsored and managed by Questrade with approximately CAD $104,504 (USD $83,670) in AUM at September 30, 2017. The closing of the transaction is subject to obtaining unitholder and regulatory approvals. The purchase price is formulaic which takes into consideration the AUM of the Questrade ETFs at closing, and is estimated to be approximately CAD $2,821 (USD $2,260) based upon the AUM of the Questrade ETFs at September 30, 2017. The Company has agreed to guarantee the indemnification obligations of WTAMC.
Settlement – Tradeworx
A few years ago, a dispute arose related to the Company’s ownership stake in Tradeworx. In March 2015, the Company was named a party in a lawsuit in the Delaware Court of Chancery pursuant to which a stockholder of Tradeworx sought to have the shares held by the Company invalidated. In August 2016, the court dismissed the claims brought against the Company and Tradeworx (as a nominal defendant), but the number of shares of Tradeworx owned by the Company remained in dispute. On June 20, 2017, the Company, Tradeworx and certain material stockholders of Tradeworx reached an agreement related to the dispute, pursuant to which (i) the litigation was dismissed; (ii) the parties released and agreed not to sue each other with respect to the related claims in the lawsuit; (iii) Tradeworx agreed to indemnify the Company against any such claims; (iv) the Company exchanged its current shares in Tradeworx for new shares of Tradeworx stock and a warrant in accordance with the terms of an equity exchange agreement as described below; and (v) the Company and Tradeworx entered into a stockholders agreement providing for certain rights and obligations of the Company and Tradeworx as described below.
Pursuant to the equity exchange agreement, the Company was issued shares of newly authorized preferred stock reflecting ownership of 19.99% of Tradeworx on a fully diluted basis (excluding certain reserved shares). The shares of preferred stock rank pari passu in priority with Tradeworx’s current preferred stockholders. In addition, Tradeworx issued the Company a warrant to purchase up to an additional 50% of the number of shares of preferred stock issued to the Company at closing, exercisable for five years after the closing, at varying exercise prices that increase over time and set at multiples of a pre-determined Tradeworx valuation (or a new valuation if Tradeworx completes a qualified financing, as defined, within two years). If a claim is brought against Tradeworx or the Company relating to the settlement, the warrant will be exercisable for 100% of the number of shares of preferred stock issued to the Company at closing. Pursuant to the stockholders agreement, the Company has the right to appoint one of five directors to Tradeworx’s board of directors, as well as additional customary rights, including (i) consent rights on certain transactions (e.g., related-party transactions and certain changes to organizational documents); (ii) pre-emptive rights on future issuances of shares, subject to customary carve-outs; (iii) information rights; and (iv) registration rights.
16
Table of Contents
During the three months ended June 30, 2017, the Company recorded a pre-tax gain of $6,909 representing the fair value of the Tradeworx preferred stock it received in connection with this settlement (See Note 4). The fair value of the warrant was determined to be insignificant. This amount has been recorded as settlement gain on the Consolidated Statements of Operations.
Contingencies
The Company may be subject to reviews, inspections and investigations by regulatory authorities as well as legal proceedings arising in the ordinary course of business. The Company is not currently party to any litigation that is expected to have a material adverse impact on its business, financial position, results of operations or cash flows.
9. Related Party Transactions
The Company’s revenues are derived primarily from investment advisory agreements with related parties. Under these agreements, the Company has licensed to related parties the use of certain of its own indexes for the U.S. and Canadian WisdomTree ETFs and WisdomTree UCITS ETFs. The Board of Trustees and Board of Directors of the related parties are primarily responsible for overseeing the management and affairs of the U.S. and Canadian WisdomTree ETFs, Boost ETPs and WisdomTree UCITS ETFs for the benefit of their shareholders and have contracted with the Company to provide for general management and administration services. The Company is also responsible for certain expenses of the related parties, including the cost of transfer agency, custody, fund administration and accounting, legal, audit, and other non-distribution services, excluding extraordinary expenses, taxes and certain other expenses, which is included in fund management and administration on the Company’s Consolidated Statements of Operations. In exchange, the Company receives fees based on a percentage of the ETF average daily net assets. The advisory agreements may be terminated by the related parties upon notice. Certain officers of the Company also provide general management oversight of the related parties; however, these officers have no material decision making responsibilities and primarily implement the decisions of the Board of Trustees and Board of Directors of the related parties.
The following table summarizes accounts receivable from related parties which are included as a component of Accounts receivable on the Company’s Consolidated Balance Sheets:
| September 30, 2017 |
December 31, 2016 |
|||||||
| Receivable from WTT |
$ | 17,827 | $ | 16,506 | ||||
| Receivable from BI and WTI |
1,067 | 645 | ||||||
| Receivable from WTCS |
101 | 158 | ||||||
| Receivable from WTAMC |
41 | 40 | ||||||
|
|
|
|
|
|||||
| Total |
$ | 19,036 | $ | 17,349 | ||||
|
|
|
|
|
|||||
The following table summarizes revenues from advisory services provided to related parties:
| Three Months Ended September 30, |
Nine Months Ended September 30, |
|||||||||||||||
| 2017 | 2016 | 2017 | 2016 | |||||||||||||
| Advisory services provided to WTT |
$ | 54,439 | $ | 49,087 | $ | 158,206 | $ | 161,316 | ||||||||
| Advisory services provided to BI and WTI |
2,733 | 1,915 | 7,271 | 5,308 | ||||||||||||
| Advisory services provided to WTCS |
310 | 482 | 1,210 | 1,406 | ||||||||||||
| Advisory services provided to WTAMC |
92 | 69 | 263 | 69 | ||||||||||||
|
|
|
|
|
|
|
|
|
|||||||||
| Total |
$ | 57,574 | $ | 51,553 | $ | 166,950 | $ | 168,099 | ||||||||
|
|
|
|
|
|
|
|
|
|||||||||
10. Stock-Based Awards
The Company grants equity awards to employees and directors which include restricted stock awards, restricted stock units and stock options. Stock options may be issued for terms of ten years and may vest after at least one year and have an exercise price equal to the Company’s stock price on the grant date. Restricted stock awards and restricted stock units are generally valued based on the Company’s stock price on the grant date. The Company estimates the fair value for stock options using the Black-Scholes option pricing model. All restricted stock awards, restricted stock units and stock option awards require future service as a condition of vesting with certain awards subject to acceleration under certain conditions.
On June 20, 2016, the Company’s stockholders approved a new equity award plan under which the Company can issue up to 10,000,000 shares of common stock (less one share for every share granted under prior plans since March 31, 2016 and inclusive of shares available under the prior plans as of March 31, 2016) in the form of stock options and other stock-based awards. The Company also has issued from time to time stock-based awards outside a plan.
17
Table of Contents
Stock-based compensation expense for the three months ended September 30, 2017 and 2016 was approximately $3,607 and $3,822, respectively, and for the nine months ended September 30, 2017 and 2016 was approximately $10,558 and $11,092, respectively.
A summary of unrecognized stock-based compensation expense and average remaining vesting period is as follows:
| September 30, 2017 | ||||||||
| Unrecognized Stock- Based Compensation |
Average Remaining Vesting Period |
|||||||
| Employees and directors |
$ | 18,272 | 1.61 | |||||
A summary of stock options, restricted stock and restricted stock unit activity for the three months ended September 30, 2017 is as follows:
| Stock Options |
Restricted Stock Awards |
Restricted Stock Units |
||||||||||
| Balance at July 1, 2017 |
1,325,947 | 2,241,633 | 2,276 | |||||||||
| Granted |
— | 96,598 | 3,472 | |||||||||
| Exercised/vested |
(10,370 | ) | (150,454 | ) | — | |||||||
| Forfeitures |
— | (10,948 | ) | — | ||||||||
|
|
|
|
|
|
|
|||||||
| Balance at September 30, 2017 |
1,315,577 | 2,176,829 | 5,748 | |||||||||
|
|
|
|
|
|
|
|||||||
11. Earnings Per Share
The following is a reconciliation of the basic and diluted earnings per share computation:
| Three Months Ended September 30, |
Nine Months Ended September 30, |
|||||||||||||||
| 2017 | 2016 | 2017 | 2016 | |||||||||||||
| Net income |
$ | 7,976 | $ | 7,955 | $ | 26,961 | $ | 23,678 | ||||||||
|
|
|
|
|
|
|
|
|
|||||||||
| (shares in thousands) | (shares in thousands) | |||||||||||||||
| Shares of common stock and common stock equivalents: |
||||||||||||||||
| Weighted average common shares used in basic computation |
134,709 | 134,046 | 134,552 | 134,541 | ||||||||||||
| Dilutive effect of common stock equivalents |
1,224 | 1,144 | 1,216 | 1,042 | ||||||||||||
|
|
|
|
|
|
|
|
|
|||||||||
| Weighted average common shares used in dilutive computation |
135,933 | 135,190 | 135,768 | 135,583 | ||||||||||||
|
|
|
|
|
|
|
|
|
|||||||||
| Basic earnings per share |
$ | 0.06 | $ | 0.06 | $ | 0.20 | $ | 0.17 | ||||||||
| Diluted earnings per share |
$ | 0.06 | $ | 0.06 | $ | 0.20 | $ | 0.17 | ||||||||
In the table above, unvested share-based awards that have non-forfeitable rights to dividends or dividend equivalents are treated as a separate class of securities in calculating earnings per share under the two-class method. The impact of applying this methodology was a reduction in basic earnings per share of $0.01 for the nine months ended September 30, 2016.
Diluted earnings per share is calculated under both the treasury stock and two-class method and reflects the reduction in earnings per share assuming options or other contracts to issue common stock were exercised or converted into common stock (if dilutive). The calculation that results in the most dilutive earnings per share amount for the common stock is reported in the Company’s consolidated financial statements. The Company excluded 337,682 and 516,630 common stock equivalents from its computation of diluted earnings per share for the three months ended September 30, 2017 and 2016, respectively, and 1,745,469 and 909,118 common stock equivalents from its computation of diluted earnings per share for the nine months ended September 30, 2017 and 2016, respectively, as they were determined to be anti-dilutive.
As further discussed in Note 12, the Company adopted ASU 2016-09 prospectively effective January 1, 2017 which had the effect of reducing basic earnings per share by $0.01 for the nine months ended September 30, 2017.
18
Table of Contents
12. Income Taxes
Effective Income Tax Rate – Three and Nine Months Ended September 30, 2017
The Company’s estimated effective income tax rate for the three months ended September 30, 2017 of 48.5% resulted in income tax expense of $7,520. The Company’s tax rate differs from the federal statutory tax rate of 35% primarily due to a valuation allowance on foreign net operating losses and state and local income taxes.
The Company’s estimated effective income tax rate for the nine months ended September 30, 2017 of 48.7% resulted in income tax expense of $25,582. The Company’s tax rate differs from the federal statutory tax rate of 35% primarily due to a valuation allowance on foreign net operating losses, tax shortfalls associated with the vesting of stock-based compensation awards and state and local income taxes.
Effective January 1, 2017, US GAAP was amended with the intention to simplify the accounting for stock-based compensation. This includes the requirement to record the tax effects related to stock-based compensation within income tax expense, rather than additional paid-in capital, when applicable. Therefore, tax shortfalls (and tax windfalls) associated with the vesting of stock-based compensation awards are now included within income tax expense. This new guidance resulted in the recognition of $248 and $1,338 of income tax expense associated with tax shortfalls recognized upon vesting of stock-based compensation awards for the three and nine months ended September 30, 2017, respectively.
Effective Income Tax Rate – Three and Nine Months Ended September 30, 2016
The Company’s estimated effective income tax rate for the three months ended September 30, 2016 of 44.1% resulted in income tax expense of $6,270. The Company’s tax rate differs from the federal statutory tax rate of 35% primarily due to a valuation allowance on foreign net operating losses and state and local income taxes.
The Company’s estimated effective income tax rate for the nine months ended September 30, 2016 of 49.7% resulted in income tax expense of $23,375. The Company’s tax rate differs from the federal statutory tax rate of 35% primarily due a valuation allowance on foreign net operating losses, the acquisition payment expense (which is non-deductible) and state and local income taxes.
Net Operating Losses – U.S.
The Company’s pre-tax federal net operating losses for tax purposes (“NOLs”) at September 30, 2017 was $3,671 which expire in 2024. The net operating loss carryforwards have been reduced by the impact of annual limitations described in the Internal Revenue Code Section 382 that arose as a result of an ownership change.
Net Operating Losses – International
The Company’s European and Canadian subsidiaries generated NOLs outside the U.S. These tax effected NOLs were $3,291 at September 30, 2017. The Company established a full valuation allowance related to these NOLs as it is more-likely-than-not that some portion, or all, of the deferred tax assets will not be realized.
Deferred Tax Assets
A summary of the components of the Company’s deferred tax asset is as follows:
| September 30, 2017 |
December 31, 2016 |
|||||||
| Deferred tax assets: |
||||||||
| Accrued expenses |
$ | 4,429 | $ | 4,552 | ||||
| Stock-based compensation |
3,688 | 5,382 | ||||||
| NOLs - Foreign |
3,291 | 4,551 | ||||||
| Deferred rent liability |
1,952 | 2,024 | ||||||
| NOLs – U.S. |
1,398 | 1,611 | ||||||
| Unrealized losses, net |
242 | 101 | ||||||
| Other |
329 | 227 | ||||||
|
|
|
|
|
|||||
| Deferred tax assets |
15,329 | 18,448 | ||||||
|
|
|
|
|
|||||
| Deferred tax liabilities: |
||||||||
| Fixed assets |
2,386 | 2,405 | ||||||
| Unrealized gains, net |
2,641 | — | ||||||
| Incentive compensation |
338 | 1,365 | ||||||
| Goodwill and intangible assets |
522 | 301 | ||||||
|
|
|
|
|
|||||
| Deferred tax liabilities |
5,887 | 4,071 | ||||||
|
|
|
|
|
|||||
| Total deferred tax assets less deferred tax liabilities |
9,442 | 14,377 | ||||||
| Less: valuation allowance |
(3,291 | ) | (4,551 | ) | ||||
|
|
|
|
|
|||||
| Deferred tax assets, net |
$ | 6,151 | $ | 9,826 | ||||
|
|
|
|
|
|||||
19
Table of Contents
13. Shares Repurchased
On October 29, 2014, the Company’s Board of Directors authorized a three-year share repurchase program of up to $100,000. On April 27, 2016, the Board of Directors approved a $60,000 increase to the Company’s share repurchase program and extended the term through April 27, 2019. Included under this program are purchases to offset future equity grants made under the Company’s equity plans and are made in open market or privately negotiated transactions. This authority may be exercised from time to time and in such amounts as market conditions warrant, and subject to regulatory considerations. The timing and actual number of shares repurchased depends on a variety of factors including price, corporate and regulatory requirements, market conditions and other corporate liquidity requirements and priorities. The repurchase program may be suspended or terminated at any time without prior notice. Shares repurchased under this program are returned to the status of authorized and unissued on the Company’s books and records.
During the three and nine months ended September 30, 2017, the Company repurchased 47,317 and 401,813 shares of its common stock, respectively, under this program for an aggregate cost of $484 and $4,178, respectively.
During the three and nine months ended September 30, 2016, the Company repurchased 337,824 and 3,753,147 shares of its common stock, respectively, under this program for an aggregate cost of $3,462 and $39,116, respectively.
As of September 30, 2017, $92,327 remains available under this program for future purchases.
14. Goodwill and Intangible Assets
Goodwill has been allocated to the Company’s U.S. Business reporting unit and is deductible for tax purposes. The Company has designated April 30th as its annual goodwill impairment testing date. The following table summarizes the goodwill activity during the period:
| U.S. Business Reporting Unit |
||||
| Balance at July 1, 2017 |
$ | 1,799 | ||
| Increases/(decreases) |
— | |||
|
|
|
|||
| Balance at September 30, 2017 |
$ | 1,799 | ||
|
|
|
|||
Goodwill was tested for impairment on April 30, 2017. The fair value of the reporting unit exceeded its carrying value and therefore no impairment was recognized.
Intangible Asset (Indefinite-Lived)
As part of the GreenHaven acquisition which occurred on January 1, 2016, the Company identified an intangible asset valued at $9,953 related to its customary advisory agreement with the GreenHaven Commodities ETF (renamed the WisdomTree Continuous Commodity Index Fund, or “GCC”). This intangible asset (which is deductible for tax purposes) was determined to have an indefinite useful life. The Company has designated November 30th as its annual impairment testing date for this indefinite-lived intangible asset.
| Total | ||||
| Balance at July 1, 2017 |
$ | 9,953 | ||
| Increases/(decreases) |
— | |||
|
|
|
|||
| Balance at September 30, 2017 |
$ | 9,953 | ||
|
|
|
|||
20
Table of Contents
15. Segment Reporting
The Company operates as an ETP sponsor and asset manager providing investment advisory services in the U.S., Europe, Canada and Japan. These activities are reported in the Company’s U.S. Business and International Business reportable segments. The U.S. Business segment includes the results of the Company’s U.S. operations and Japan sales office. The results of the Company’s European and Canadian operations are reported as the International Business segment.
Information concerning these reportable segments are as follows:
| Three Months Ended September 30, |
Nine Months Ended September 30, |
|||||||||||||||
| 2017 | 2016 | 2017 | 2016 | |||||||||||||
| Revenues (U.S. Business segment) |
||||||||||||||||
| Advisory fees |
$ | 54,749 | $ | 49,568 | $ | 159,416 | $ | 162,721 | ||||||||
| Settlement gain |
— | — | 6,909 | — | ||||||||||||
| Other income |
590 | 323 | 2,410 | 931 | ||||||||||||
|
|
|
|
|
|
|
|
|
|||||||||
| Total revenues (U.S. Business segment) |
$ | 55,339 | $ | 49,891 | $ | 168,735 | $ | 163,652 | ||||||||
|
|
|
|
|
|
|
|
|
|||||||||
| Revenues (International Business segment) |
||||||||||||||||
| Advisory fees |
$ | 2,825 | $ | 1,985 | $ | 7,534 | $ | 5,378 | ||||||||
| Other loss |
(178 | ) | (87 | ) | (256 | ) | (382 | ) | ||||||||
|
|
|
|
|
|
|
|
|
|||||||||
| Total revenues (International Business segment) |
$ | 2,647 | $ | 1,898 | $ | 7,278 | $ | 4,996 | ||||||||
|
|
|
|
|
|
|
|
|
|||||||||
| Total revenues |
$ | 57,986 | $ | 51,789 | $ | 176,013 | $ | 168,648 | ||||||||
|
|
|
|
|
|
|
|
|
|||||||||
| Income/(loss) before taxes |
||||||||||||||||
| U.S. Business segment |
$ | 18,493 | $ | 17,032 | $ | 61,712 | $ | 61,326 | ||||||||
| International Business segment |
(2,997 | ) | (2,807 | ) | (9,169 | ) | (14,273 | ) | ||||||||
|
|
|
|
|
|
|
|
|
|||||||||
| Total income before taxes |
$ | 15,496 | $ | 14,225 | $ | 52,543 | $ | 47,053 | ||||||||
|
|
|
|
|
|
|
|
|
|||||||||
Assets are not reported by segment as such information is not utilized by the chief operating decision maker. The vast majority of the Company’s assets are located in the U.S.
16. Subsequent Events
The Company has evaluated subsequent events through the date of issuance of the accompanying consolidated financial statements. There were no events requiring disclosure.
21
Table of Contents
ITEM 2. MANAGEMENT’S DISCUSSION AND ANALYSIS OF FINANCIAL CONDITION AND RESULTS OF OPERATIONS
The following discussion and analysis of our financial condition and results of operations should be read together with our consolidated financial statements and the related notes and the other financial information included elsewhere in this Report. In addition to historical consolidated financial information, the following discussion contains forward-looking statements that reflect our plans, estimates and beliefs. Our actual results could differ materially from those discussed in the forward-looking statements. Factors that could cause or contribute to these differences include those discussed below. For a more complete description of the risks noted above and other risks that could cause our actual results to materially differ from our current expectations, please see Item 1A “Risk Factors” in our Annual Report on Form 10-K for the fiscal year ended December 31, 2016. We assume no obligation to update or revise publicly any forward-looking statements, whether as a result of new information, future events or otherwise, unless required by law.
Executive Summary
Introduction
We are one of the leading ETP sponsors in the world (based on AUM), with AUM of $46.4 billion globally as of September 30, 2017. An ETP is a pooled investment vehicle that holds a basket of financial instruments, securities or other assets and generally seeks to track (index-based) or outperform (actively managed) the performance of a broad or specific equity, fixed income or alternatives market segment, commodity or currency (or an inverse or multiple thereof). ETPs are listed on an exchange with their shares traded in the secondary market at market prices, generally at approximately the same price as the net asset value of their underlying components. ETP is an umbrella term that includes ETFs, exchange-traded notes and exchange-traded commodities.
Through our operating subsidiaries, we provide investment advisory and other management services to the WisdomTree ETFs and Boost ETPs collectively offering ETPs covering equity, fixed income, currency, alternatives and commodity asset classes. In exchange for providing these services, we receive advisory fee revenues based on a percentage of the ETPs’ average daily AUM. Our expenses are predominantly related to selling, operating and marketing our ETPs. We have contracted with third parties to provide certain operational services for the ETPs. We distribute our ETPs through all major channels within the asset management industry, including brokerage firms, registered investment advisers, institutional investors, private wealth managers and discount brokers primarily through our sales force. Our sales efforts are not directed towards the retail segment but rather are directed towards financial or investment advisers that act as intermediaries between the end-client and us. Recent investments in technology-enabled services including portfolio construction, asset allocation, practice management services and the AdvisorEngine platform have been made in order to differentiate us in the market, expand our distribution and further enhance our relationships with financial advisors.
A significant portion of our AUM is invested in securities issued outside of the U.S. Therefore, our AUM and revenues are affected by movements in global capital market levels and the strengthening or weakening of the U.S. dollar against other currencies. As the chart below reflects, as of September 30, 2017, 39% of our U.S. AUM was concentrated in two products with similar strategies – HEDJ, our European equity ETF which hedges exposure to the Euro, and DXJ, our Japanese equity ETF which hedges exposure to the Yen. The strengthening of the Euro or Yen against the U.S. dollar, or the decline in European or Japanese equity markets, may have an adverse effect on our results.
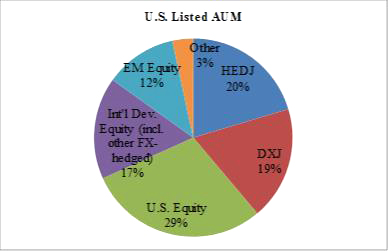
22
Table of Contents
Market Environment
The global equity markets performed well during the third quarter of 2017. The U.S. economy grew at a healthy rate and the dollar continued to weaken, leading to record highs in the U.S. equity markets. In the Eurozone and Japan, market sentiment was favorable as various economic indicators continued to improve, while the Eurozone also remained focused on whether the European Central Bank may slow its stimulus programs. Emerging markets benefitted from steady global growth, the weakening of the U.S. dollar and modest inflation.
The S&P 500 rose 4.5%, MSCI EAFE (local currency) rose 3.4% and MSCI Emerging Markets Index (U.S. dollar) rose 8.0% in the third quarter. In addition, the European and Japan equity markets appreciated with the MSCI EMU Index rising 4.4% and MSCI Japan Index rising 4.3%, both in local currency terms. Also, the U.S. dollar weakened 3.5% versus the Euro and was essentially unchanged versus the Yen during the third quarter.
The vast majority of our global AUM is in U.S. listed ETFs. As the charts below reflect, industry flows for the third quarter of 2017 reached $83.6 billion. Fixed income, U.S. equities, international equities and emerging markets equities gathered the majority of those flows.
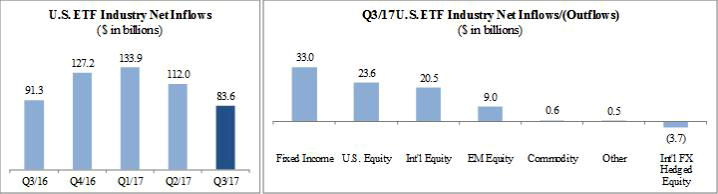
Source: Investment Company Institute, WisdomTree
Business Segments
We operate as an ETP sponsor and asset manager providing investment advisory services in the U.S., Europe, Canada and Japan. These activities are reported in our U.S. Business and International Business segments, as follows:
| • | U.S. Business segment: Our U.S. business and Japan sales office, which primarily engages in selling our U.S. listed ETFs to Japanese institutional clients; and |
| • | International Business segment: Our European business which commenced in April 2014 in connection with our acquisition of U.K. based ETP sponsor Boost ETP, LLP (“Boost”) and our Canadian business which launched its first six ETFs in July 2016. |
23
Table of Contents
Our Operating and Financial Results
U.S. Business Segment
Our U.S. listed ETFs’ AUM increased from $43.2 billion as of June 30, 2017 to $44.4 billion as of September 30, 2017 due to market appreciation and partly offset by net outflows. We experienced net outflows primarily from our two largest ETFs and our U.S. equity ETFs which were partly offset by inflows into our international equity and emerging markets ETFs.
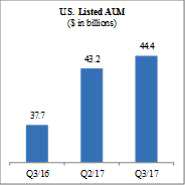
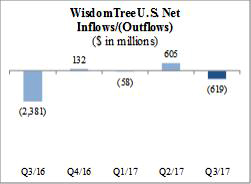
| ||
|
| ||
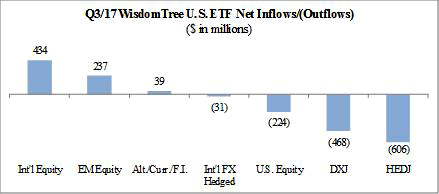
International Business Segment
Our International ETFs had net inflows of $332.0 million in the third quarter of 2017. This was a result of inflows of $129.7 million into our European listed ETPs, $105.5 million into our UCITS ETFs and $96.7 million into our Canadian listed ETFs. Our International AUM increased from $1.5 billion as of June 30, 2017 to $2.0 billion as of September 30, 2017 primarily due to net inflows, and to a less extent market appreciation.
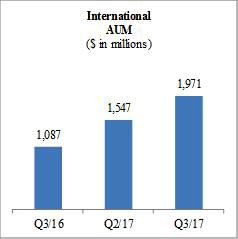
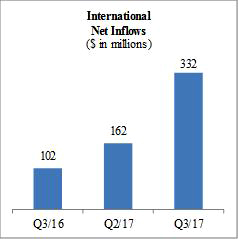
| ||
24
Table of Contents
Consolidated Operating Results
Our revenues, expenses and net income are as follows:
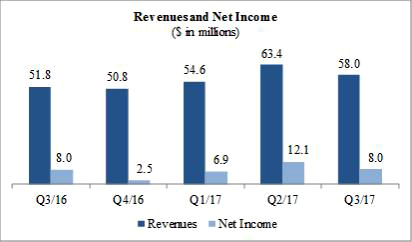
| • | Revenues – We recorded revenues of $58.0 million in the three months ended September 30, 2017, up 12.0% from the three months ended September 30, 2016 primarily due to higher advisory fees. |
| • | Expenses – Total expenses increased 13.1% from the three months ended September 30, 2016 to $42.5 million primarily due to higher compensation costs. |
| • | Net income – Net income was essentially unchanged from the three months ended September 30, 2016. |
25
Table of Contents
Key Operating Statistics
The following table presents key operating statistics that serve as indicators for the performance of our business:
| Three Months Ended | Nine Months Ended | |||||||||||||||||||
| September 30, 2017 |
June 30, 2017 |
September 30, 2016 |
September 30, 2017 |
September 30, 2016 |
||||||||||||||||
| U.S. LISTED ETFs (in millions) |
||||||||||||||||||||
| Beginning of period assets |
$ | 43,183 | $ | 41,940 | $ | 38,046 | $ | 40,164 | $ | 51,639 | ||||||||||
| Acquired assets |
— | — | — | — | 225 | |||||||||||||||
| Inflows/(outflows) |
(619 | ) | 605 | (2,381 | ) | (72 | ) | (12,689 | ) | |||||||||||
| Market appreciation/(depreciation) |
1,834 | 638 | 2,039 | 4,306 | (1,471 | ) | ||||||||||||||
|
|
|
|
|
|
|
|
|
|
|
|||||||||||
| End of period assets |
$ | 44,398 | $ | 43,183 | $ | 37,704 | $ | 44,398 | $ | 37,704 | ||||||||||
|
|
|
|
|
|
|
|
|
|
|
|||||||||||
| Average assets during the period |
$ | 43,523 | $ | 42,961 | $ | 38,710 | $ | 42,589 | $ | 42,005 | ||||||||||
| Revenue days |
92 | 91 | 92 | 273 | 274 | |||||||||||||||
| Number of ETFs – end of the period |
87 | 90 | 93 | 87 | 93 | |||||||||||||||
| ETF Industry and Market Share (in billions) |
||||||||||||||||||||
| ETF industry net inflows |
$ | 83.6 | $ | 112.0 | $ | 91.3 | $ | 329.5 | $ | 156.7 | ||||||||||
| WisdomTree market share of industry inflows |
n/a | 0.1 | % | n/a | n/a | n/a | ||||||||||||||
| Average ETF advisory fee during the period |
||||||||||||||||||||
| Alternative strategy ETFs |
0.57 | % | 0.60 | % | 0.78 | % | 0.61 | % | 0.84 | % | ||||||||||
| Emerging markets equity ETFs |
0.70 | % | 0.70 | % | 0.71 | % | 0.70 | % | 0.71 | % | ||||||||||
| International developed equity ETFs |
0.55 | % | 0.56 | % | 0.56 | % | 0.56 | % | 0.56 | % | ||||||||||
| International hedged equity ETFs |
0.53 | % | 0.53 | % | 0.54 | % | 0.53 | % | 0.54 | % | ||||||||||
| Currency ETFs |
0.50 | % | 0.50 | % | 0.50 | % | 0.50 | % | 0.50 | % | ||||||||||
| Fixed income ETFs |
0.40 | % | 0.42 | % | 0.47 | % | 0.41 | % | 0.48 | % | ||||||||||
| U.S. equity ETFs |
0.35 | % | 0.35 | % | 0.35 | % | 0.35 | % | 0.35 | % | ||||||||||
|
|
|
|
|
|
|
|
|
|
|
|||||||||||
| Blended total |
0.50 | % | 0.50 | % | 0.51 | % | 0.50 | % | 0.52 | % | ||||||||||
|
|
|
|
|
|
|
|
|
|
|
|||||||||||
| EUROPEAN LISTED ETPs |
||||||||||||||||||||
| Total ETPs (in thousands) |
||||||||||||||||||||
| Beginning of period assets |
$ | 812,604 | $ | 774,487 | $ | 560,063 | $ | 626,280 | $ | 437,934 | ||||||||||
| Inflows/(outflows) |
129,742 | 102,783 | 92,045 | 392,851 | 236,084 | |||||||||||||||
| Market appreciation/(depreciation) |
37,262 | (64,666 | ) | (4,611 | ) | (39,523 | ) | (26,521 | ) | |||||||||||
|
|
|
|
|
|
|
|
|
|
|
|||||||||||
| End of period assets |
$ | 979,608 | $ | 812,604 | $ | 647,497 | $ | 979,608 | $ | 647,497 | ||||||||||
|
|
|
|
|
|
|
|
|
|
|
|||||||||||
| Average assets during the period |
$ | 870,773 | $ | 735,295 | $ | 575,248 | $ | 770,725 | $ | 516,052 | ||||||||||
| Average ETP advisory fee during the period |
0.77 | % | 0.78 | % | 0.82 | % | 0.78 | % | 0.83 | % | ||||||||||
| Number of ETPs—end of period |
68 | 68 | 67 | 68 | 67 | |||||||||||||||
| Total UCITS ETFs (in thousands) |
||||||||||||||||||||
| Beginning of period assets |
$ | 643,199 | $ | 576,503 | $ | 391,900 | $ | 398,015 | $ | 335,938 | ||||||||||
| Inflows/(outflows) |
105,504 | 44,022 | (58,908 | ) | 309,300 | 39,463 | ||||||||||||||
| Market appreciation/(depreciation) |
37,196 | 22,674 | 38,315 | 78,584 | (4,094 | ) | ||||||||||||||
|
|
|
|
|
|
|
|
|
|
|
|||||||||||
| End of period assets |
$ | 785,899 | $ | 643,199 | $ | 371,307 | $ | 785,899 | $ | 371,307 | ||||||||||
|
|
|
|
|
|
|
|
|
|
|
|||||||||||
| Average assets during the period |
$ | 692,666 | $ | 626,177 | $ | 437,767 | $ | 607,097 | $ | 400,423 | ||||||||||
| Average UCITS ETF advisory fee during the period |
0.44 | % | 0.44 | % | 0.44 | % | 0.43 | % | 0.46 | % | ||||||||||
| Number of UCITS ETFs—end of period |
17 | 17 | 16 | 17 | 16 | |||||||||||||||
| CANADIAN LISTED ETFs* (in thousands) |
||||||||||||||||||||
| Beginning of period assets |
$ | 91,490 | $ | 72,927 | $ | — | $ | 68,618 | $ | — | ||||||||||
| Inflows/(outflows) |
96,745 | 15,280 | 68,531 | 112,024 | 68,531 | |||||||||||||||
| Market appreciation/(depreciation) |
17,234 | 3,283 | (104 | ) | 24,827 | (104 | ) | |||||||||||||
|
|
|
|
|
|
|
|
|
|
|
|||||||||||
| End of period assets |
$ | 205,469 | $ | 91,490 | $ | 68,427 | $ | 205,469 | $ | 68,427 | ||||||||||
|
|
|
|
|
|
|
|
|
|
|
|||||||||||
| Average assets during the period |
$ | 129,284 | $ | 84,879 | $ | 68,177 | $ | 92,021 | $ | 22,633 | ||||||||||
| Average ETF advisory fee during the period |
0.28 | %1 | 0.42 | % | 0.47 | % | 0.37 | % | 0.47 | % | ||||||||||
| Number of ETFs—end of period |
11 | 8 | 6 | 11 | 6 | |||||||||||||||
| Headcount: U.S. Business Segment |
165 | 166 | 159 | 165 | 159 | |||||||||||||||
| Headcount: International Business Segment |
43 | 46 | 43 | 43 | 43 | |||||||||||||||
| * | ETF inception date July 14, 2016 |
| 1 | Average ETF advisory fee for our Canadian listed ETFs declined from 0.42% at June 30, 2017 to 0.28% at September 30, 2017 due to management fee rebates provided to initial seed capital providers. |
Note: Previously issued statistics may be restated due to trade adjustments
Source: Investment Company Institute, Bloomberg, WisdomTree
26
Table of Contents
Three Months Ended September 30, 2017 Compared to Three Months Ended September 30, 2016
Selected Operating and Financial Information
| Three Months Ended September 30, |
Change | Percent Change |
||||||||||||||
| 2017 | 2016 | |||||||||||||||
| Global AUM (in millions) |
||||||||||||||||
| End of period assets |
$ | 46,369 | $ | 38,791 | ||||||||||||
|
|
|
|
|
|||||||||||||
| U.S. listed ETFs AUM (in millions) |
||||||||||||||||
| Beginning of period assets |
$ | 43,183 | $ | 38,046 | ||||||||||||
| Net inflows/(outflows) |
(619 | ) | (2,381 | ) | ||||||||||||
| Market appreciation/(depreciation) |
1,834 | 2,039 | ||||||||||||||
|
|
|
|
|
|||||||||||||
| End of period assets |
$ | 44,398 | $ | 37,704 | ||||||||||||
|
|
|
|
|
|||||||||||||
| Financial Results (in thousands) |
||||||||||||||||
| Total revenues |
$ | 57,986 | $ | 51,789 | $ | 6,197 | 12.0 | % | ||||||||
| Total expenses |
42,490 | 37,564 | 4,926 | 13.1 | % | |||||||||||
|
|
|
|
|
|
|
|||||||||||
| Pre-tax income |
$ | 15,496 | $ | 14,225 | $ | 1,271 | 8.9 | % | ||||||||
| Net income |
$ | 7,976 | $ | 7,955 | $ | 21 | 0.3 | % | ||||||||
Overview – Global AUM (September 30, 2017 and September 30, 2016)
Our global AUM increased 19.5% from $38.8 billion at September 30, 2016 to $46.4 billion at September 30, 2017. This was primarily due to market appreciation of our U.S. listed ETFs and net inflows into certain of our U.S. listed ETFs (including in our U.S. equity, international equity, emerging markets and alternative strategy ETFs), European listed ETPs and Canadian listed ETFs. These increases were partly offset by outflows primarily in our two largest ETFs, HEDJ and DXJ.
Overview – Three Months Ended September 30, 2017 and September 30, 2016
During the three months ended September 30, 2017, our U.S. listed ETF’s AUM increased 2.8%, from $43.2 billion at June 30, 2017 to $44.4 billion at September 30, 2017. This increase was primarily driven by market appreciation, partly offset by net outflows. We experienced net outflows primarily from our two largest ETFs and our U.S. equity ETFs which were partly offset by inflows into our international equity and emerging markets ETFs. Our U.S. listed ETFs’ AUM decreased 0.9% during the three months ended September 30, 2016, primarily due to net outflows from our two largest ETFs, HEDJ and DXJ and largely offset by market appreciation.
We reported pre-tax income of $15.5 million for the three months ended September 30, 2017, an increase of 8.9% from the three months ended September 30, 2016 due to higher revenues which were partly offset by higher expenses. Net income was $8.0 million for the three months ended September 30, 2017, which was essentially unchanged from the three months ended September 30, 2016.
Revenues
| Three Months Ended September 30, |
Change | Percent Change |
||||||||||||||
| 2017 | 2016 | |||||||||||||||
| Global AUM (in millions) |
||||||||||||||||
| Global - Average AUM |
$ | 45,216 | $ | 39,791 | $ | 5,425 | 13.6 | % | ||||||||
|
|
|
|
|
|||||||||||||
| U.S. listed ETF’s AUM (in millions) |
||||||||||||||||
| U.S. listed - Average AUM |
$ | 43,523 | $ | 38,710 | $ | 4,813 | 12.4 | % | ||||||||
| U.S. listed - Average ETF advisory fee |
0.50 | % | 0.51 | % | (0.01 | ) | (2.0 | %) | ||||||||
| Revenues (in thousands) |
||||||||||||||||
| Advisory fees |
$ | 57,574 | $ | 51,553 | $ | 6,021 | 11.7 | % | ||||||||
| Other income |
412 | 236 | 176 | 74.6 | % | |||||||||||
|
|
|
|
|
|
|
|||||||||||
| Total revenues |
$ | 57,986 | $ | 51,789 | $ | 6,197 | 12.0 | % | ||||||||
|
|
|
|
|
|
|
|||||||||||
27
Table of Contents
Advisory fees
Advisory fees of $57.6 million increased 11.7% from the three months ended September 30, 2016 due to an increase in our average global AUM, partly offset by lower average U.S. advisory fees due to a change in product mix. Our average global AUM increased primarily due to market appreciation of our U.S. listed ETFs and net inflows into certain of our U.S. listed ETFs (including in our U.S. equity, international equity, emerging markets and alternative strategy ETFs), European listed ETPs and Canadian listed ETFs. These increases were partly offset by outflows primarily in our two largest U.S. listed ETFs. The changes in product mix resulted in our average U.S. ETF advisory fee declining from 0.51% for the three months ended September 30, 2016 to 0.50% for the three months ended September 30, 2017.
Other income
Other income increased 74.6% from the third quarter of 2016 to $0.4 million primarily due to higher interest earned on our investments.
Expenses
| Three Months Ended September 30, |
Change | Percent Change |
||||||||||||||
| (in thousands) | 2017 | 2016 | ||||||||||||||
| Compensation and benefits |
$ | 19,492 | $ | 15,328 | $ | 4,164 | 27.2 | % | ||||||||
| Fund management and administration |
10,862 | 10,372 | 490 | 4.7 | % | |||||||||||
| Marketing and advertising |
3,314 | 3,600 | (286 | ) | (7.9 | %) | ||||||||||
| Sales and business development |
3,617 | 3,075 | 542 | 17.6 | % | |||||||||||
| Professional and consulting fees |
1,035 | 1,035 | — | 0.0 | % | |||||||||||
| Occupancy, communications and equipment |
1,378 | 1,469 | (91 | ) | (6.2 | %) | ||||||||||
| Depreciation and amortization |
353 | 332 | 21 | 6.3 | % | |||||||||||
| Third-party sharing arrangements |
710 | 622 | 88 | 14.1 | % | |||||||||||
| Other |
1,729 | 1,731 | (2 | ) | (0.1 | %) | ||||||||||
|
|
|
|
|
|
|
|
|
|||||||||
| Total expenses |
$ | 42,490 | $ | 37,564 | $ | 4,926 | 13.1 | % | ||||||||
|
|
|
|
|
|
|
|
|
|||||||||
| Three Months Ended September 30, |
||||||||
| As a Percent of Revenues: |
2017 | 2016 | ||||||
| Compensation and benefits |
33.6 | % | 29.6 | % | ||||
| Fund management and administration |
18.7 | % | 20.0 | % | ||||
| Marketing and advertising |
5.7 | % | 7.0 | % | ||||
| Sales and business development |
6.3 | % | 5.9 | % | ||||
| Professional and consulting fees |
1.8 | % | 2.0 | % | ||||
| Occupancy, communications and equipment |
2.4 | % | 2.8 | % | ||||
| Depreciation and amortization |
0.6 | % | 0.7 | % | ||||
| Third-party sharing arrangements |
1.2 | % | 1.2 | % | ||||
| Other |
3.0 | % | 3.3 | % | ||||
|
|
|
|
|
|||||
| Total expenses |
73.3 | % | 72.5 | % | ||||
|
|
|
|
|
|||||
Compensation and benefits
Compensation and benefits expense increased 27.2% from $15.3 million in the three months ended September 30, 2016 to $19.5 million in the comparable period in 2017 primarily due to higher accrued incentive compensation and other headcount related expenses. Headcount of our U.S. Business segment was 159 and our International Business segment was 43 at September 30, 2016 compared to 165 and 43, respectively, at September 30, 2017.
Fund management and administration
Fund management and administration expense increased 4.7% from $10.4 million in the three months ended September 30, 2016 to $10.9 million in the comparable period in 2017. This increase was primarily attributable to higher average global AUM partly offset by a lower number of U.S. listed ETFs. We had 93 U.S. listed ETFs, 83 European ETPs and 6 Canadian listed ETFs at September 30, 2016 compared to 87 U.S. listed ETFs, 85 European ETPs and 11 Canadian listed ETFs at September 30, 2017.
28
Table of Contents
Marketing and advertising
Marketing and advertising expense decreased 7.9% from $3.6 million in the three months ended September 30, 2016 to $3.3 million in the comparable period in 2017 primarily due to lower levels of advertising related activities in our U.S. Business segment.
Sales and business development
Sales and business development expense increased 17.6% from $3.1 million in the three months ended September 30, 2016 to $3.6 million in the comparable period in 2017 primarily due to higher spending on sales related activities in our U.S. Business segment.
Professional and consulting fees
Professional and consulting fees were unchanged from the three months ended September 30, 2016.
Occupancy, communications and equipment
Occupancy, communications and equipment expense was essentially unchanged from the three months ended September 30, 2016.
Depreciation and amortization
Depreciation and amortization expense was essentially unchanged from the three months ended September 30, 2016.
Third-party sharing arrangements
Third-party sharing arrangements increased 14.1% from $0.6 million in the three months ended September 30, 2016 to $0.7 million in the comparable period in 2017 primarily due to higher fees paid to our third-party marketing agents in Latin America and Australia, partly offset by lower fees paid to our marketing agent in the United States.
Other
Other expense was essentially unchanged from the three months ended September 30, 2016.
Income taxes
Our estimated effective income tax rate for the three months ended September 30, 2017 of 48.5% resulted in income tax expense of $7.5 million. Our tax rate differs from the federal statutory tax rate of 35% primarily due to a valuation allowance on foreign net operating losses and state and local income tax expense.
Our estimated effective income tax rate for the three months ended September 30, 2016 of 44.1% resulted in income tax expense of $6.3 million. Our tax rate differs from the federal statutory tax rate of 35% primarily due a valuation allowance on foreign net operating losses and state and local income tax expense.
29
Table of Contents
Nine Months Ended September 30, 2017 Compared to Nine Months Ended September 30, 2016
Selected Operating and Financial Information
| Nine Months Ended September 30, |
Change | Percent Change |
||||||||||||||
| 2017 | 2016 | |||||||||||||||
| Global AUM (in millions) |
||||||||||||||||
| End of period assets |
$ | 46,369 | $ | 38,791 | ||||||||||||
|
|
|
|
|
|||||||||||||
| U.S. listed ETFs AUM (in millions) |
||||||||||||||||
| Beginning of period assets |
$ | 40,164 | $ | 51,639 | ||||||||||||
| Assets acquired |
— | 225 | ||||||||||||||
| Net inflows/(outflows) |
(72 | ) | (12,689 | ) | ||||||||||||
| Market appreciation/(depreciation) |
4,306 | (1,471 | ) | |||||||||||||
|
|
|
|
|
|||||||||||||
| End of period assets |
$ | 44,398 | $ | 37,704 | ||||||||||||
|
|
|
|
|
|||||||||||||
| Financial Results (in thousands) |
||||||||||||||||
| Total revenues |
$ | 176,013 | $ | 168,648 | $ | 7,365 | 4.4 | % | ||||||||
| Total expenses |
123,470 | 121,595 | 1,875 | 1.5 | % | |||||||||||
|
|
|
|
|
|
|
|||||||||||
| Pre-tax income |
$ | 52,543 | $ | 47,053 | $ | 5,490 | 11.7 | % | ||||||||
| Net income |
$ | 26,961 | $ | 23,678 | $ | 3,283 | 13.9 | % | ||||||||
Overview – Nine Months Ended September 30, 2017 and September 30, 2016
Changes in our global AUM are primarily driven by changes in our U.S. listed ETF’s AUM, which increased 10.5% during the nine months ended September 30, 2017, from $40.2 billion at January 1, 2017 to $44.4 billion at September 30, 2017. This increase was driven primarily by market appreciation of $4.3 billion. Our U.S. listed ETFs’ AUM decreased 27.0% during the nine months ended September 30, 2016, primarily due to net outflows from our two largest ETFs, HEDJ and DXJ, as well as market depreciation.
We reported pre-tax income of $52.5 million for the nine months ended September 30, 2017, an increase of 11.7% from the nine months ended September 30, 2016 primarily due to higher revenues. Net income was $27.0 million for the nine months ended September 30, 2017 compared to $23.7 million for the nine months ended September 30, 2016.
Revenues
| Nine Months Ended September 30, |
Change | Percent Change |
||||||||||||||
| 2017 | 2016 | |||||||||||||||
| Global AUM (in millions) |
||||||||||||||||
| Global - Average AUM |
$ | 44,059 | $ | 42,944 | $ | 1,115 | 2.6 | % | ||||||||
|
|
|
|
|
|||||||||||||
| U.S. listed ETFs AUM (in millions) |
||||||||||||||||
| U.S. listed - Average AUM |
$ | 42,589 | $ | 42,005 | $ | 584 | 1.4 | % | ||||||||
| U.S. listed - Average ETF advisory fee |
0.50 | % | 0.52 | % | (0.02 | ) | (3.8 | %) | ||||||||
| Revenues (in thousands) |
||||||||||||||||
| Advisory fees |
$ | 166,950 | $ | 168,099 | $ | (1,149 | ) | (0.7 | %) | |||||||
| Settlement gain |
6,909 | — | 6,909 | n/a | ||||||||||||
| Other income |
2,154 | 549 | 1,605 | 292.3 | % | |||||||||||
|
|
|
|
|
|
|
|||||||||||
| Total revenues |
$ | 176,013 | $ | 168,648 | $ | 7,365 | 4.4 | % | ||||||||
|
|
|
|
|
|
|
|||||||||||
Advisory fees
Advisory fees revenues decreased 0.7% from $168.1 million in the nine months ended September 30, 2016 to $167.0 million in the comparable period in 2017 despite higher average global AUM as a result of a decline in our average U.S. ETF advisory fee. Our average U.S. ETF advisory fee declined from 0.52% for the nine months ended September 30, 2016 to 0.50% for the nine months ended September 30, 2017 due to changes in product mix.
30
Table of Contents
Settlement gain
A settlement gain of $6.9 million was recorded during the nine months ended September 30, 2017 representing the fair value of the preferred stock of Tradeworx that the Company received in connection with the resolution of a dispute regarding its ownership stake in Tradeworx, which occurred in June 2017. See Note 8 to our Consolidated Financial Statements.
Other income
Other income increased $1.6 million from $0.5 million in the nine months ended September 30, 2016 to $2.1 million in the comparable period in 2017. Included in other income for the nine months ended September 30, 2017 was a one-time reimbursement of fund-related costs for prior years of $0.8 million. In addition, other income increased due to higher interest earned on our securities owned, at fair value.
Expenses
| Nine Months Ended September 30, |
Change | Percent Change |
||||||||||||||
| (in thousands) | 2017 | 2016 | ||||||||||||||
| Compensation and benefits |
$ | 55,787 | $ | 44,897 | $ | 10,890 | 24.3 | % | ||||||||
| Fund management and administration |
30,574 | 31,037 | (463 | ) | (1.5 | %) | ||||||||||
| Marketing and advertising |
10,676 | 11,998 | (1,322 | ) | (11.0 | %) | ||||||||||
| Sales and business development |
9,968 | 9,356 | 612 | 6.5 | % | |||||||||||
| Professional and consulting fees |
3,814 | 5,235 | (1,421 | ) | (27.1 | %) | ||||||||||
| Occupancy, communications and equipment |
4,102 | 3,932 | 170 | 4.3 | % | |||||||||||
| Depreciation and amortization |
1,042 | 978 | 64 | 6.5 | % | |||||||||||
| Third-party sharing arrangements |
2,312 | 2,238 | 74 | 3.3 | % | |||||||||||
| Acquisition payment |
— | 6,738 | (6,738 | ) | n/a | |||||||||||
| Other |
5,195 | 5,186 | 9 | 0.2 | % | |||||||||||
|
|
|
|
|
|
|
|
|
|||||||||
| Total expenses |
$ | 123,470 | $ | 121,595 | $ | 1,875 | 1.5 | % | ||||||||
|
|
|
|
|
|
|
|
|
|||||||||
| Nine Months Ended September 30, |
||||||||
| As a Percent of Revenues: |
2017 | 2016 | ||||||
| Compensation and benefits |
31.7 | % | 26.6 | % | ||||
| Fund management and administration |
17.3 | % | 18.4 | % | ||||
| Marketing and advertising |
6.1 | % | 7.1 | % | ||||
| Sales and business development |
5.6 | % | 5.6 | % | ||||
| Professional and consulting fees |
2.2 | % | 3.1 | % | ||||
| Occupancy, communications and equipment |
2.3 | % | 2.3 | % | ||||
| Depreciation and amortization |
0.6 | % | 0.6 | % | ||||
| Third-party sharing arrangements |
1.3 | % | 1.3 | % | ||||
| Acquisition payment |
n/a | 4.0 | % | |||||
| Other |
3.0 | % | 3.1 | % | ||||
|
|
|
|
|
|||||
| Total expenses |
70.1 | % | 72.1 | % | ||||
|
|
|
|
|
|||||
Compensation and benefits
Compensation and benefits expense increased 24.3% from $44.9 million in the nine months ended September 30, 2016 to $55.8 million in the comparable period in 2017 primarily due to higher accrued incentive compensation and other headcount related expenses.
Fund management and administration
Fund management and administration expense decreased 1.5% from $31.0 million in the nine months ended September 30, 2016 to $30.6 million in the comparable period in 2017. This decrease was primarily due to lower fund costs for our U.S. Business segment attributable to a lower number of U.S. listed ETFs, partly offset by the higher number of ETPs of our International Business segment and higher average global AUM.
31
Table of Contents
Marketing and advertising
Marketing and advertising expense decreased 11.0% from $12.0 million in the nine months ended September 30, 2016 to $10.7 million in the comparable period in 2017 primarily due to lower levels of advertising related activities in our U.S. Business segment.
Sales and business development
Sales and business development expense increased 6.5% from $9.4 million in the nine months ended September 30, 2016 to $10.0 million in the comparable period in 2017 primarily due to sales related activities of our International Business segment.
Professional and consulting fees
Professional and consulting fees decreased 27.1% from $5.2 million in the nine months ended September 30, 2016 to $3.8 million in the comparable period in 2017 primarily due to lower advisory fees associated with our GreenHaven acquisition which occurred in the first quarter of 2016 as well as lower corporate consulting related expenses.
Occupancy, communications and equipment
Occupancy, communications and equipment expense was essentially unchanged from the nine months ended September 30, 2016.
Depreciation and amortization
Depreciation and amortization expense was essentially unchanged from the nine months ended September 30, 2016.
Third-party sharing arrangements
Third-party sharing arrangements was essentially unchanged from the nine months ended September 30, 2016.
Acquisition payment
Acquisition payment expense was $6.7 million in the nine months ended September 30, 2016 which included $6.0 million recognized in the second quarter of 2016 as a result of the acceleration of the buyout of the remaining minority interest in our European business.
Other
Other expense was essentially unchanged from the nine months ended September 30, 2016.
Income taxes
Our estimated effective income tax rate for the nine months ended September 30, 2017 of 48.7% resulted in income tax expense of $25.6 million. Effective January 1, 2017, as required, we adopted ASU 2016-09, Compensation – Stock Compensation (Topic 718): Improvements to Employee Share-Based Payment Accounting, which requires companies to record the tax effects related to stock-based compensation within income tax expense, rather than additional paid-in capital, when applicable. Therefore, tax shortfalls (and tax windfalls) associated with the vesting of stock-based compensation awards are now included within income tax expense. This guidance resulted in the recognition of $1.3 million of income tax expense associated with tax shortfalls recognized upon vesting of stock-based compensation awards during the nine months ended September 30, 2017 (substantially all of which was recorded during the first quarter of 2017). In addition, our tax rate differs from the federal statutory tax rate of 35% primarily due to a valuation allowance on foreign net operating losses and state and local income tax expense.
Our estimated effective income tax rate for the nine months ended September 30, 2016 of 49.7% resulted in income tax expense of $23.4 million. Our tax rate differs from the federal statutory tax rate of 35% primarily due a valuation allowance on foreign net operating losses, the acquisition payment expense (which is non-deductible) and state and local income tax expense.
32
Table of Contents
Segment Results
The table below presents the net revenues, operating expenses and income before taxes of our U.S. Business and International Business reportable segments.
| Three Months Ended September 30, |
Nine Months Ended September 30, |
|||||||||||||||
| 2017 | 2016 | 2017 | 2016 | |||||||||||||
| (in thousands) | ||||||||||||||||
| U.S. Business segment |
||||||||||||||||
| Revenues |
$ | 55,339 | $ | 49,891 | $ | 168,735 | $ | 163,652 | ||||||||
| Operating expenses |
(36,846 | ) | (32,859 | ) | (107,023 | ) | (102,326 | ) | ||||||||
|
|
|
|
|
|
|
|
|
|||||||||
| Income before taxes |
$ | 18,493 | $ | 17,032 | $ | 61,712 | $ | 61,326 | ||||||||
|
|
|
|
|
|
|
|
|
|||||||||
| Average assets during the period (in millions) |
$ | 43,523 | $ | 38,710 | $ | 42,589 | $ | 42,005 | ||||||||
| Average ETF advisory fee during the period |
0.50 | % | 0.51 | % | 0.50 | % | 0.52 | % | ||||||||
| International Business segment |
||||||||||||||||
| Revenues |
$ | 2,647 | $ | 1,898 | $ | 7,278 | $ | 4,996 | ||||||||
| Operating expenses |
(5,644 | ) | (4,705 | ) | (16,447 | ) | (19,269 | ) | ||||||||
|
|
|
|
|
|
|
|
|
|||||||||
| Loss before taxes |
$ | (2,997 | ) | $ | (2,807 | ) | $ | (9,169 | ) | $ | (14,273 | ) | ||||
|
|
|
|
|
|
|
|
|
|||||||||
| European ETPs – Average assets during the period (in millions) |
$ | 871 | $ | 575 | $ | 771 | $ | 516 | ||||||||
| UCITS ETFs – Average assets during the period (in millions) |
$ | 693 | $ | 438 | $ | 607 | $ | 400 | ||||||||
|
Canadian ETFs – Average assets during the period (in millions) |
$ | 129 | $ | 68 | $ | 92 | $ | 23 | ||||||||
| European ETPs – Average advisory fee during the period |
0.77 | % | 0.82 | % | 0.78 | % | 0.83 | % | ||||||||
| UCITS ETFs – Average advisory fee during the period |
0.44 | % | 0.44 | % | 0.43 | % | 0.46 | % | ||||||||
| Canadian ETFs – Average advisory fee during the period |
0.28 | %1 | 0.47 | % | 0.37 | % | 0.47 | % | ||||||||
| Totals |
||||||||||||||||
| Revenues |
$ | 57,986 | $ | 51,789 | $ | 176,013 | $ | 168,648 | ||||||||
| Operating expenses |
(42,490 | ) | (37,564 | ) | (123,470 | ) | (121,595 | ) | ||||||||
|
|
|
|
|
|
|
|
|
|||||||||
| Income before taxes |
$ | 15,496 | $ | 14,225 | $ | 52,543 | $ | 47,053 | ||||||||
|
|
|
|
|
|
|
|
|
|||||||||
| 1 | Average ETF advisory fee for our Canadian listed ETFs declined from 0.47% at September 30, 2016 to 0.28% at September 30, 2017 due to management fee rebates provided to initial seed capital providers. |
Three Months Ended September 30, 2017 Compared to Three Months Ended September 30, 2016
U.S. Business segment
Revenues of the U.S. Business segment increased 10.9% from $49.9 million in the three months ended September 30, 2016 to $55.3 million in the comparable period in 2017. This was attributable to an increase in our average AUM, partly offset by lower average U.S. ETF advisory fees due to a change in product mix. Our average AUM increased primarily due to market appreciation and net inflows (including in our U.S. equity, international equity, emerging markets and alternative strategy ETFs). These increases were partly offset by net outflows from our two largest ETFs, HEDJ and DXJ. The changes in product mix resulted in our average U.S. advisory fee declining from 0.51% in the three months ended September 30, 2016 to 0.50% in the comparable period in 2017.
Operating expenses of the U.S. Business segment increased 12.1% from $32.9 million in the three months ended September 30, 2016 to $36.8 million in the comparable period in 2017. The increase was primarily attributable to higher compensation expenses due to higher accrued incentive compensation and other headcount related expenses. Headcount of our U.S. Business segment was 159 and 165 at September 30, 2016 and 2017, respectively.
International Business segment
Revenues of the International Business segment increased 39.5% from $1.9 million in the three months ended September 30, 2016 to $2.6 million in the comparable period in 2017. This increase was attributable to higher average AUM which increased 56.6% from $1.1 billion in the three months ended September 30, 2016 to $1.7 billion in the comparable period in 2017 primarily due to net inflows, and to a lesser extent market appreciation.
33
Table of Contents
Operating expenses of the International Business segment increased 20.0% from $4.7 million in the three months ended September 30, 2016 to $5.6 million in the comparable period in 2017. The change was primarily due to an increase in compensation expense associated with higher accrued incentive compensation, higher spending on sales related activities and higher fund management and administration expenses due to higher average AUM and a higher number of ETPs.
Nine Months Ended September 30, 2017 Compared to Nine Months Ended September 30, 2016
U.S. Business segment
Revenues of the U.S. Business segment increased 3.1% from $163.7 million in the nine months ended September 30, 2016 to $168.7 million in the comparable period in 2017. Included in the nine months ended September 30, 2017 was a settlement gain of $6.9 million. In addition, revenues increased as compared to the prior period due to higher interest income on our securities owned, at fair value. Offsetting these items was lower advisory fee revenue which declined despite higher average AUM due to a decline in our average U.S. ETF advisory fee. Our average U.S. ETF advisory fee declined from 0.52% for the nine months ended September 30, 2016 to 0.50% for the nine months ended September 30, 2017 due to changes in product mix.
Operating expenses of the U.S. Business segment increased 4.6% from $102.3 million in the nine months ended September 30, 2016 to $107.0 million in the comparable period in 2017. The increase was attributable to higher compensation expenses primarily due to higher accrued incentive compensation and other headcount related expenses. This increase was offset by lower fund management and administration expenses due to a lower number of ETFs (partly offset by higher average AUM), lower marketing expenses and lower professional fees. Professional fees declined primarily as a result of fees incurred in the first quarter of 2016 associated with our GreenHaven acquisition as well as lower corporate consulting related expenses.
International Business segment
Revenues of the International Business segment increased 45.7% from $5.0 million in the nine months ended September 30, 2016 to $7.3 million in the comparable period in 2017. This increase was attributable to higher average AUM which increased 56.6% from $939.1 million in the nine months ended September 30, 2016 to $1.5 billion in the comparable period in 2017 primarily due to net inflows, and to a lesser extent market appreciation.
Operating expenses of the International Business segment decreased 14.6% from $19.3 million in the nine months ended September 30, 2016 to $16.4 million in the comparable period in 2017. Included in operating expenses for the nine months ended September 30, 2016 was acquisition payment expense of $6.7 million associated with the acceleration of the buyout of the remaining minority interest in our European business during the second quarter of 2016. Partly offsetting this item was an increase in compensation expense associated with higher average headcount and higher spending on sales related activities. In addition, fund management and administration expenses increased due to higher average AUM.
Liquidity and Capital Resources
The following tables summarize key data regarding our liquidity, capital resources and use of capital to fund our operations:
| September 30, 2017 |
December 31, 2016 |
|||||||
| Balance Sheet Data (in thousands): |
||||||||
| Cash and cash equivalents |
$ | 70,221 | $ | 92,722 | ||||
| Securities owned, at fair value |
68,412 | 58,907 | ||||||
| Securities held-to-maturity |
23,333 | 22,496 | ||||||
| Accounts receivable |
19,734 | 17,668 | ||||||
|
|
|
|
|
|||||
| Total: Liquid assets |
181,700 | 191,793 | ||||||
| Less: Total liabilities |
(44,672 | ) | (48,423 | ) | ||||
|
|
|
|
|
|||||
| Total: Available liquidity |
$ | 137,028 | $ | 143,370 | ||||
|
|
|
|
|
|||||
34
Table of Contents
| Nine Months Ended September 30, |
||||||||
| 2017 | 2016 | |||||||
| Cash Flow Data (in thousands): |
||||||||
| Operating cash flows |
$ | 31,079 | $ | 43,945 | ||||
| Investing cash flows |
(17,809 | ) | (4,941 | ) | ||||
| Financing cash flows |
(36,950 | ) | (71,757 | ) | ||||
| Foreign exchange rate effect |
1,179 | 815 | ||||||
|
|
|
|
|
|||||
| Decrease in cash and cash equivalents |
$ | (22,501 | ) | $ | (31,938 | ) | ||
|
|
|
|
|
|||||
Liquidity
We consider our available liquidity to be our liquid assets less our liabilities. Liquid assets consist of cash and cash equivalents, securities owned, at fair value, securities held-to-maturity and accounts receivable. Cash and cash equivalents include cash on hand with financial institutions and all highly liquid investments with an original maturity of 90 days or less at the time of purchase. Our securities owned, at fair value are highly liquid investments in a portfolio of short-duration investment grade corporate bonds. Certain securities are accounted for as held-to-maturity securities and we have the intention and ability to hold them to maturity. However, these securities are also readily traded and, if needed, could be sold for liquidity. Accounts receivable are current assets and primarily represent receivables from advisory fees we earn from our ETPs. Our liabilities consist primarily of payments owed to vendors and third parties in the normal course of business as well as accrued year end compensation for employees.
Cash and cash equivalents decreased $22.5 million in the nine months ended September 30, 2017 due to $76.8 million used to purchase securities available-for-sale, $32.8 million used to pay dividends on our common stock, $5.0 million invested in AdvisorEngine, $4.2 million used to repurchase our common stock and $3.0 million used to purchase securities held-to-maturity. These decreases were partly offset by $31.1 million of cash generated by our operating activities, $65.1 million from sales and maturities of securities available-for-sale, $2.2 million from held-to-maturity securities called or maturing during the period and $0.9 million for other activities.
Cash and cash equivalents decreased $31.9 million in the nine months ended September 30, 2016 due to $39.1 million used to repurchase our common stock, $32.7 million used to pay dividends on our common stock, $11.8 million used in connection with the GreenHaven acquisition which occurred on January 1, 2016 and $6.0 million used to purchase securities held-to-maturity. These decreases were partly offset by $43.9 million of cash flows generated by our operating activities, $13.6 million from held-to-maturity securities called or maturing during the period and $0.2 million of other activities.
Capital Resources
Our principal source of financing is our operating cash flow. We believe that current cash flows generated by our operating activities and existing cash balances should be sufficient for us to fund our operations for at least the next 12 months.
Use of Capital
Our business does not require us to maintain a significant cash position. We expect that our main uses of cash will be to fund the ongoing operations of our business, invest in strategic growth initiatives, expand our business through strategic acquisitions and fund our capital return program. As part of our capital management, we maintain a capital return program which includes a $0.08 per share quarterly cash dividend and authority to purchase our common stock through April 27, 2019, including purchases to offset future equity grants made under our equity plans. During the nine months ended September 30, 2017, we repurchased 401,813 shares of our common stock under the repurchase program for an aggregate cost of $4.2 million to cover taxes on vesting of restricted stock. As of September 30, 2017, $92.3 million remains under this program for future purchases.
Contractual Obligations
The following table summarizes our future cash payments associated with contractual obligations as of September 30, 2017:
| Payments Due by Period | ||||||||||||||||||||
| (in thousands) | ||||||||||||||||||||
| Total | Less than 1 year |
1 to 3 years | 3 to 5 years | More than 5 years |
||||||||||||||||
| Operating leases |
$ | 34,912 | $ | 1,059 | $ | 6,901 | $ | 8,429 | $ | 18,523 | ||||||||||
| Questrade purchase and sale agreement |
2,260 | 2,260 | — | — | — | |||||||||||||||
|
|
|
|
|
|
|
|
|
|
|
|||||||||||
| $ | 37,172 | $ | 3,319 | $ | 6,901 | $ | 8,429 | $ | 18,523 | |||||||||||
|
|
|
|
|
|
|
|
|
|
|
|||||||||||
35
Table of Contents
Questrade Wealth Management, Inc. (“Questrade”) Purchase and Sale Agreement
On July 26, 2017 the Company and WTAMC entered into a purchase and sale agreement with Questrade pursuant to which WTAMC has agreed to acquire and become the trustee and manager for, a suite of eight Canadian registered ETFs currently sponsored and managed by Questrade with approximately CAD $104,504 (USD $83,670) in AUM at September 30, 2017. The closing of the transaction is subject to obtaining unitholder and regulatory approvals. The purchase price is formulaic which takes into consideration the AUM of the Questrade ETFs at closing, and is estimated to be approximately CAD $2,821 (USD $2,260) based upon the AUM of the Questrade ETFs at September 30, 2017. The Company has agreed to guarantee the indemnification obligations of WTAMC.
Off-Balance Sheet Arrangements
Other than operating leases, which are included in the table above, we do not have any off-balance sheet financing or other arrangements. We have neither created nor are party to any special-purpose or off-balance sheet entities for the purpose of raising capital, incurring debt or operating our business.
Critical Accounting Policies
Goodwill and Intangible Assets
Goodwill is the excess of the fair value of the purchase price over the fair values of the identifiable net assets at the acquisition date. The Company tests its goodwill for impairment at least annually and at the time of a triggering event requiring re-evaluation, if one were to occur. In accordance with ASU 2017-04 Intangibles-Goodwill and Other (Topic 350): Simplifying the Test for Goodwill Impairment, which was early adopted by the Company, goodwill is impaired when the estimated fair value of the reporting unit that was allocated the goodwill is less than its carrying value. If the estimated fair value of such reporting unit is less than its carrying value, goodwill impairment is recognized based on that difference. A reporting unit is an operating segment or a component of an operating segment provided that the component constitutes a business for which discrete financial information is available and management regularly reviews the operating results of that component.
For impairment testing purposes, goodwill has been allocated to our U.S. Business reporting unit. When performing our goodwill impairment test, we consider a qualitative assessment, when appropriate, and the income approach, market approach and our market capitalization when determining the fair value of our reporting units. We have designated April 30th as our annual impairment testing date.
Indefinite-lived intangible assets are tested for impairment at least annually and are reviewed for impairment whenever events or changes in circumstances indicate that the carrying amount of an asset may not be recoverable. Indefinite-lived intangible assets are impaired if their estimated fair value is less than their carrying value. We may rely on a qualitative assessment when performing our intangible asset impairment test. Otherwise, the impairment evaluation is performed at the lowest level of identifiable cash flows independent of other assets. We have designated November 30th as our annual impairment testing date for our indefinite-lived intangible assets.
Revenue Recognition
We earn investment advisory fees from ETPs, as well as licensing fees from third parties. ETP advisory fees are based on a percentage of the ETPs’ average daily net assets and recognized over the period the related service is provided. Licensing fees are based on a percentage of the average monthly net assets and recognized over the period the related service is provided.
Recently Issued Accounting Pronouncements
In June 2016, the Financial Accounting Standards Board (“FASB”) issued ASU 2016-13, Financial Instruments-Credit Losses (Topic 326) – Measurement of Credit Losses on Financial Instruments (ASU 2016-13). The main objective of the standard is to provide financial statement users with more decision-useful information about the expected credit losses on financial instruments and other commitments to extend credit held by a reporting entity at each reporting date. To achieve this objective, the amendments in the standard replace the incurred loss impairment methodology with a methodology that reflects expected credit losses and requires consideration of a broader range of reasonable and supportable information to inform credit loss estimates. The standard is applicable to loans, accounts receivable, trade receivables, and other financial assets measured at amortized cost, loan commitments and certain other off-balance sheet credit exposures, debt securities (including those held-to-maturity) and other financial assets measured at fair value through other comprehensive income, and beneficial interests in securitized financial assets. Accordingly, the new methodology will be utilized when assessing our securities classified as available-for-sale and held-to-maturity for impairment. ASU 2016-13 is effective for years beginning after December 15, 2019, including interim periods within those fiscal years under a modified retrospective approach. Early adoption is permitted for periods beginning after December 15, 2018. We are currently evaluating the impact that the standard will have on our consolidated financial statements.
36
Table of Contents
In March 2016, the FASB issued ASU 2016-09, Compensation—Stock Compensation (Topic 718): Improvements to Employee Share-Based Payment Accounting (ASU 2016-09). The standard is intended to simplify several areas of accounting for share-based compensation arrangements, including the income tax impact, classification on the statement of cash flows and forfeitures. ASU 2016-09 is effective for fiscal years, and interim periods within those years, beginning after December 15, 2016, and early adoption is permitted. We adopted this standard prospectively on January 1, 2017. The adoption of the standard increased volatility reported in income tax expense as income tax windfalls and shortfalls associated with the vesting of stock-based compensation is now recorded in income tax expense, rather than additional paid-in capital, when applicable. This new guidance resulted in us recognizing approximately $0.2 million and $1.3 million of income tax expense for tax shortfalls related to stock-based compensation vesting occurring during the three and nine months ended September 30, 2017, respectively. This had the effect of reducing basic EPS by $0.01 for the nine months ended September 30, 2017. See Notes 11 and 12 to our Consolidated Financial Statements.
In February 2016, the FASB issued ASU 2016-02, Leases (ASU 2016-02), which requires lessees to include most leases on the balance sheet. ASU 2016-02 is effective for fiscal years (and interim reporting periods within those years) beginning after December 15, 2018 and early adoption is permitted. We are currently evaluating the impact that the standard will have on our consolidated financial statements and expect, at a minimum, that its implementation will result in a gross-up on the consolidated balance sheets upon recognition of right-of-use assets and lease liabilities associated with the future minimum payments required under operating leases as disclosed in Note 8 to our Consolidated Financial Statements.
In January 2016, the FASB issued ASU 2016-01, Financial Instruments – Recognition and Measurement of Financial Assets and Financial Liabilities (ASU 2016-01). The main objective of the standard is to enhance the reporting model for financial instruments to provide users of financial statements with more decision-useful information. The amendments in the update make targeted improvements to generally accepted accounting principles. These include requiring equity investments (except those accounted for under the equity method of accounting or those that result in consolidation of the investee) to be measured at fair value with changes in fair value recognized in net income. Available-for-sale classification for equity investments with readily determinable fair values will no longer be permissible. However, an entity may choose to measure equity investments that do not have readily determinable fair values at cost minus impairment, if any, plus or minus changes resulting from observable price changes in orderly transactions for the identical or similar investment of the same issuer. The update also simplifies the impairment assessment of equity investments without readily determinable fair values by requiring a qualitative assessment to identify impairment. When a qualitative assessment indicates that impairment exists, an entity is required to measure the investment at fair value. ASU 2016-01 is effective for fiscal years beginning after December 15, 2017, including interim periods within those fiscal years. Early adoption is not permitted for the updates currently applicable to us. Our equity investments with readily determinable fair values are all currently measured at fair value with changes in fair value recognized in net income. Upon adoption, we will apply the amendments in this update when assessing the carrying value of our investments, held at cost.
In May 2014, the FASB issued ASU 2014-09, Revenue from Contracts with Customers (ASU 2014-09), which is a new comprehensive revenue recognition standard on the financial reporting requirements for revenue from contracts entered into with customers. In July 2015, the FASB deferred this ASU’s effective date by one year, to interim and annual periods beginning after December 15, 2017. The deferral allows early adoption at the original effective date. During 2016, the FASB issued ASU 2016-08, which clarifies principal versus agent considerations, ASU 2016-10, which clarifies identifying performance obligations and the licensing implementation guidance, and ASU 2016-12, which amends certain aspects of the new revenue recognition standard pursuant to ASU 2014-09. ASU 2014-09 allows for the use of either the retrospective or modified retrospective adoption method. We will implement this standard under the modified retrospective method and have determined the standard will not have a material impact on our consolidated financial statements.
| ITEM 3. | QUANTITATIVE AND QUALITATIVE DISCLOSURES ABOUT MARKET RISK |
The following information, together with information included in other parts of this Management’s Discussion and Analysis of Financial Condition and Results of Operations, describes key aspects of our market risk.
Market Risk
Market risk to us generally represents the risk of changes in the value of securities held in the portfolios of the WisdomTree ETPs that generally results from fluctuations in securities prices, foreign currency exchange rates against the U.S. dollar, and interest rates. Nearly all of our revenues are derived from advisory agreements for the WisdomTree ETFs. Under these agreements, the advisory fee we receive is based on the average market value of the assets in the WisdomTree ETF portfolios we manage.
Fluctuations in the value of these securities are common and are generated by numerous factors such as market volatility, the overall economy, inflation, changes in investor strategies and sentiment, availability of alternative investment vehicles, government regulations and others. Accordingly, changes in any one or a combination of these factors may reduce the value of investment securities and, in turn, the underlying AUM on which our revenues are earned. These declines may cause investors to withdraw funds from our ETPs in favor of investments that they perceive as offering greater opportunity or lower risk, thereby compounding the impact on our revenues. We believe challenging and volatile market conditions will continue to be present in the foreseeable future.
37
Table of Contents
Interest Rate Risk
In order to maximize yields, we invest our corporate cash in short-term interest earning assets, primarily money market instruments at a commercial bank, federal agency debt instruments and short-term investment grade corporate bonds which totaled $135.7 million and $102.1 million as of December 31, 2016 and September 30, 2017, respectively. We do not anticipate that changes in interest rates will have a material impact on our financial condition, operating results or cash flows.
Exchange Rate Risk
As a result of our operations in Europe, Japan and Canada, we now operate globally and are subject to currency translation exposure on the results of our non-U.S. operations. Foreign currency translation risk is the risk that exchange rate gains or losses arise from translating foreign entities’ statements of earnings and balance sheets from functional currency to our reporting currency (the U.S. dollar) for consolidation purposes. We generate the vast majority of our revenues and expenses in the U.S. dollar and expect to do so for some time. We do not anticipate that changes in exchange rates, predominantly the British pound or Euro, and to a lesser extent, the Japanese Yen and Canadian Dollar, as they relate to translating functional currency to our reporting currency, will have a material impact on our financial condition, operating results or cash flows. Currently, we do not enter into derivative financial instruments aimed at offsetting certain exposures in the statement of operations or the balance sheet but may look to do so in the future.
| ITEM 4. | CONTROLS AND PROCEDURES |
Evaluation of Disclosure Controls and Procedures
As of September 30, 2017, our management, with the participation of our Chief Executive Officer and our Chief Financial Officer, evaluated the effectiveness of our disclosure controls and procedures pursuant to Rule 13a-15(b) promulgated under the Securities Exchange Act of 1934, as amended, or the Exchange Act. Based upon that evaluation, our Chief Executive Officer and our Chief Financial Officer concluded that, as of September 30, 2017, our disclosure controls and procedures were effective at a reasonable assurance level in ensuring that material information required to be disclosed by us in the reports that we file or submit under the Exchange Act is recorded, processed, summarized and reported within the time periods specified in the rules, regulations and forms of the SEC, including ensuring that such material information is accumulated by and communicated to our management, including our Chief Executive Officer and our Chief Financial Officer, as appropriate to allow timely decisions regarding required disclosure.
Changes in Internal Control over Financial Reporting
During the quarter ended September 30, 2017, there were no changes in our internal control over financial reporting that have materially affected, or are reasonably likely to materially affect, our internal control over financial reporting.
38
Table of Contents
| ITEM 1. | LEGAL PROCEEDINGS |
None.
| ITEM 1A. | RISK FACTORS |
You should carefully consider the information set forth in this Report, as well as the information set forth in Part 1, Item 1A. “Risk Factors” in our Annual Report on Form 10-K for the fiscal year ended December 31, 2016.
| ITEM 2. | UNREGISTERED SALES OF EQUITY SECURITIES AND USE OF PROCEEDS |
Recent sales of Unregistered Securities
None.
Use of Proceeds
Not applicable.
Purchases of Equity Securities by the Issuer and Affiliated Purchasers
The following table provides information with respect to purchases made by or on behalf of the Company or any “affiliated purchaser” of shares of the Company’s common stock.
| Total Number of Shares Purchased |
Average Price Paid Per Share |
Total
Number of Shares Purchased as Part of Publicly Announced Plans or Programs(1) |
Approximate Dollar Value of Shares that May Yet Be Purchased Under the Plans or Programs |
|||||||||||||
| Period |
(in thousands) | |||||||||||||||
| July 1, 2017 to July 31, 2017 |
28,884 | $ | 10.23 | 28,884 | ||||||||||||
| August 1, 2017 to August 31, 2017 |
14,645 | $ | 10.57 | 14,645 | ||||||||||||
| September 1, 2017 to September 30, 2017 |
3,788 | $ | 8.97 | 3,788 | ||||||||||||
|
|
|
|
|
|||||||||||||
| Total |
47,317 | $ | $10.24 | 47,317 | $ | 92,327 | ||||||||||
|
|
|
|
|
|
|
|||||||||||
| (1) | On October 29, 2014, our Board of Directors authorized a three-year share repurchase program of up to $100.0 million. On April 27, 2016, the Board approved a $60.0 million increase to this program and extended the term through April 27, 2019, increasing the total authorized repurchase amount to $100.3 million. During the three months ended September 30, 2017, we repurchased 47,317 shares of our common stock under this program for an aggregate cost of $0.5 million. As of September 30, 2017, $92.3 million remains available under this program for future purchases. |
| ITEM 3. | DEFAULTS UPON SENIOR SECURITIES |
None.
| ITEM 4. | MINE SAFETY DISCLOSURES |
Not applicable.
| ITEM 5. | OTHER INFORMATION |
None.
39
Table of Contents
| ITEM 6. | EXHIBITS |
| (1) | Filed herewith. |
40
Table of Contents
SIGNATURE
Pursuant to the requirements of the Securities Exchange Act of 1934, the registrant has duly caused this Report to be signed on its behalf by the undersigned thereunto duly authorized on this 8th day of November 2017.
| WISDOMTREE INVESTMENTS, INC. | ||
| By: | /s/ Jonathan L. Steinberg | |
| Jonathan L. Steinberg | ||
| Chief Executive Officer and President (Authorized Officer and Principal Executive Officer) | ||
| WISDOMTREE INVESTMENTS, INC. | ||
| By: | /s/ Amit Muni | |
| Amit Muni | ||
| Executive Vice President—Finance and Chief Financial Officer (Authorized Officer and Principal Financial and Accounting Officer) | ||
41