Attached files
| file | filename |
|---|---|
| 8-K - FORM 8-K - Wendy's Co | d482392d8k.htm |
Third Quarter 2017 Conference Call November 8, 2017 © Quality Is Our Recipe, LLC Exhibit 99.1
Peter Koumas Director – Investor Relations © Quality Is Our Recipe, LLC
Forward-Looking Statements and Non-GAAP Financial Measures This presentation, and certain information that management may discuss in connection with this presentation, contains certain statements that are not historical facts, including information concerning possible or assumed future results of our operations and our stated 2020 goals. Those statements constitute “forward-looking statements” within the meaning of the Private Securities Litigation Reform Act of 1995 (The “Reform Act”). For all forward-looking statements, we claim the protection of the safe harbor for forward-looking statements contained in the Reform Act. Many important factors could affect our future results and could cause those results to differ materially from those expressed in or implied by our forward-looking statements. Such factors, all of which are difficult or impossible to predict accurately, and many of which are beyond our control, include but are not limited to those identified under the caption “Forward-Looking Statements” in our news release issued on November 8, 2017 and in the “Special Note Regarding Forward-Looking Statements and Projections” and “Risk Factors” sections of our most recent Form 10-K / Form 10-Qs. In addition, this presentation and certain information management may discuss in connection with this presentation reference non-GAAP financial measures (i.e., adjusted EBITDA, adjusted EBITDA margin, adjusted earnings per share, adjusted tax rate, free cash flow and systemwide sales). These non-GAAP financial measures exclude certain expenses and benefits. Reconciliations of non-GAAP financial measures to the most directly comparable GAAP financial measures are provided in the Appendix to this presentation, and are included in our news release issued on November 8, 2017 and posted on www.aboutwendys.com. As used in this presentation, the terms adjusted EBITDA and adjusted earnings per share refer to adjusted EBITDA from continuing operations and adjusted earnings per share from continuing operations, respectively. THE WENDY'S COMPANY |
THE WENDY'S COMPANY | Agenda CEO Update Financial Update Q&A
Todd Penegor President & Chief Executive Officer © Quality Is Our Recipe, LLC
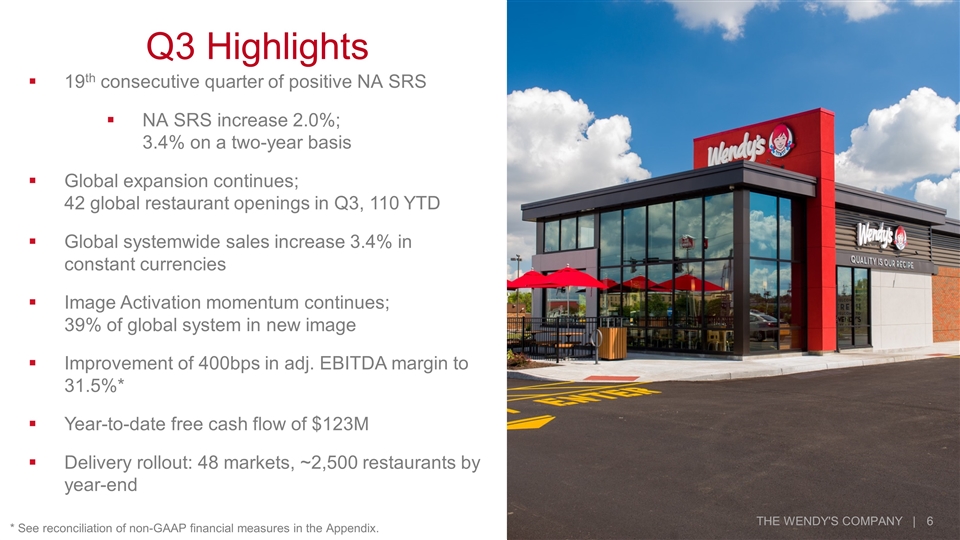
THE WENDY'S COMPANY | Q3 Highlights * See reconciliation of non-GAAP financial measures in the Appendix. 19th consecutive quarter of positive NA SRS NA SRS increase 2.0%; 3.4% on a two-year basis Global expansion continues; 42 global restaurant openings in Q3, 110 YTD Global systemwide sales increase 3.4% in constant currencies Image Activation momentum continues; 39% of global system in new image Improvement of 400bps in adj. EBITDA margin to 31.5%* Year-to-date free cash flow of $123M Delivery rollout: 48 markets, ~2,500 restaurants by year-end
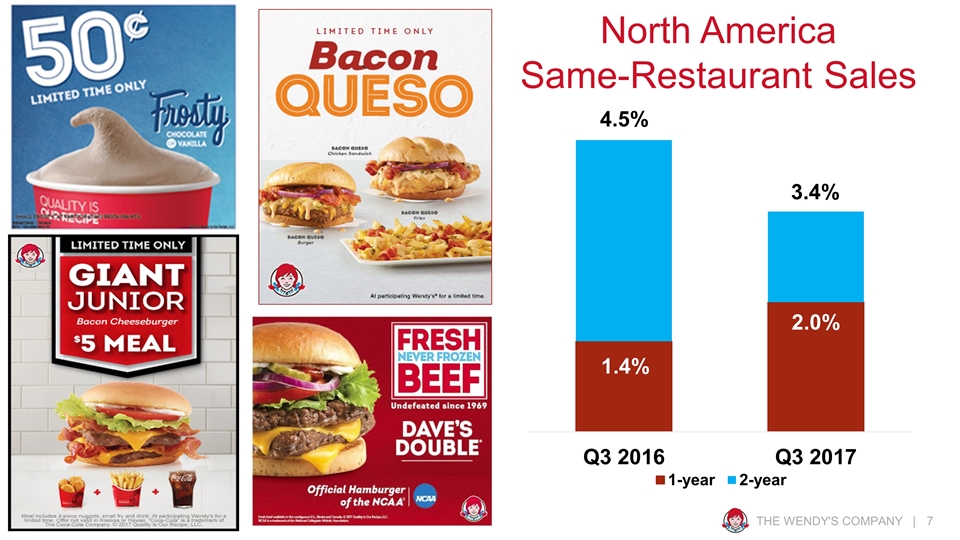
THE WENDY'S COMPANY | North America Same-Restaurant Sales 4.5% 3.4%
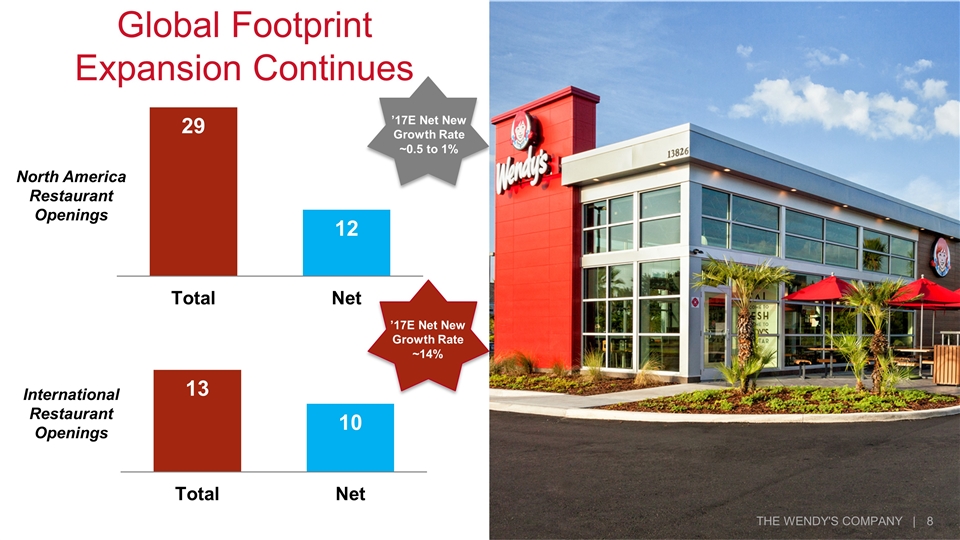
Global Footprint Expansion Continues THE WENDY'S COMPANY | 0.08% North America Restaurant Openings International Restaurant Openings ’17E Net New Growth Rate ~14% ’17E Net New Growth Rate ~0.5 to 1%
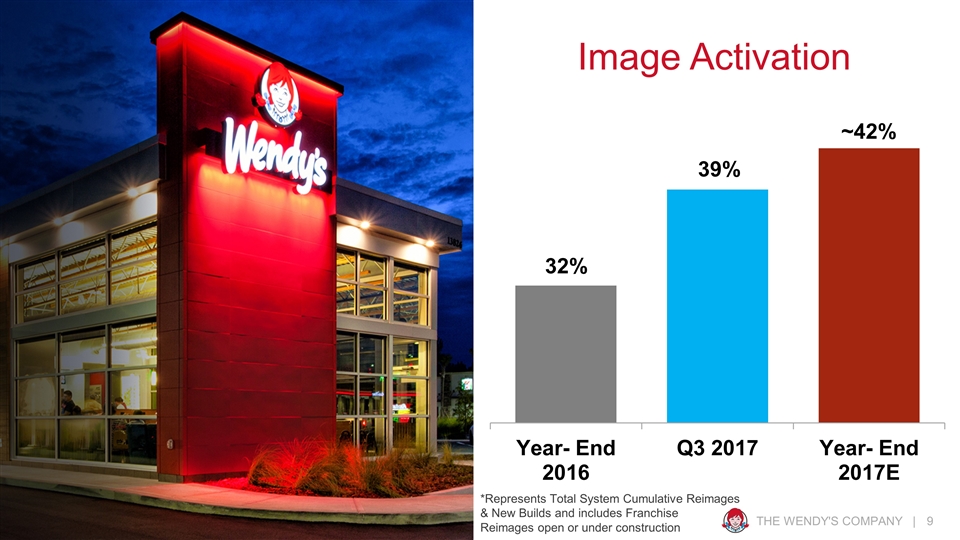
THE WENDY'S COMPANY | Image Activation *Represents Total System Cumulative Reimages & New Builds and includes Franchise Reimages open or under construction 118 Buy & Flip transactions completed in Q1. On track to achieve target of 400 ~42% 39%
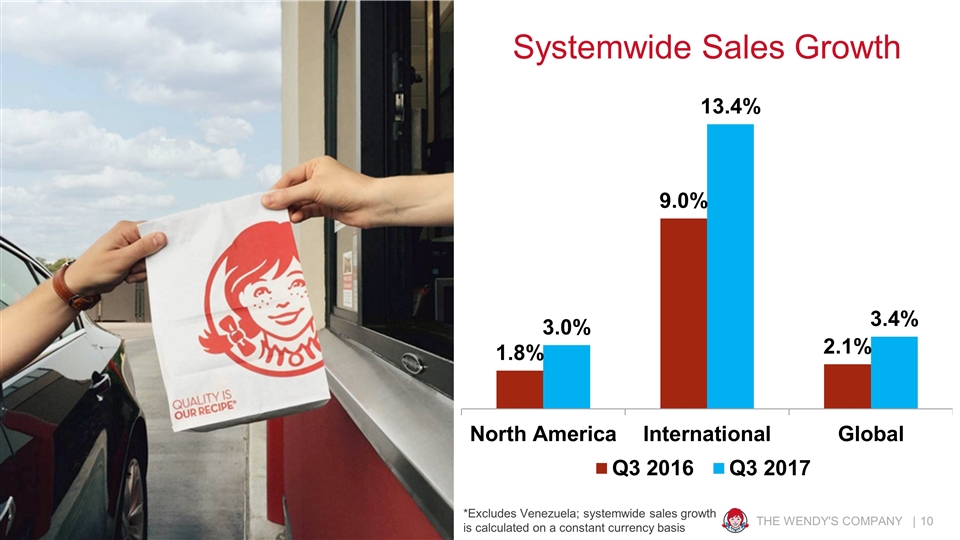
Systemwide Sales Growth THE WENDY'S COMPANY | *Excludes Venezuela; systemwide sales growth is calculated on a constant currency basis
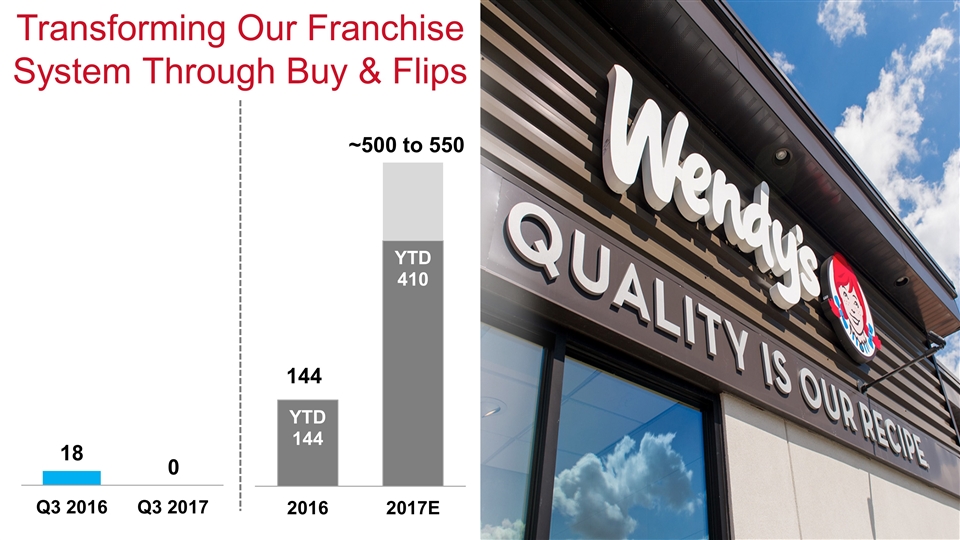
Transforming Our Franchise System Through Buy & Flips THE WENDY'S COMPANY | ~34% of Global System Image Activated at the end of Q1 2017 ~500 to 550 144 0
THE WENDY'S COMPANY |
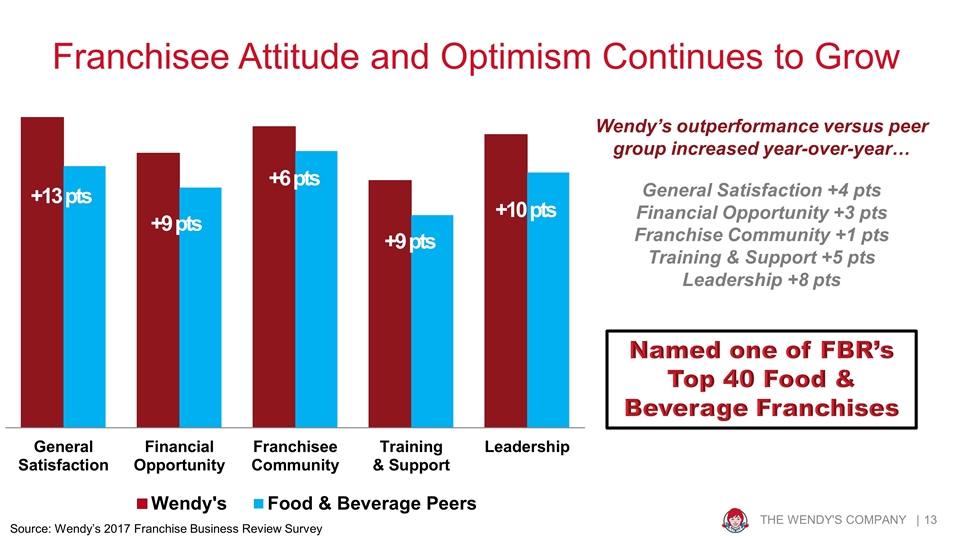
THE WENDY'S COMPANY | Franchisee Attitude and Optimism Continues to Grow Source: Wendy’s 2017 Franchise Business Review Survey +13 pts +9 pts +6 pts +9 pts +10 pts Wendy’s outperformance versus peer group increased year-over-year… General Satisfaction +4 pts Financial Opportunity +3 pts Franchise Community +1 pts Training & Support +5 pts Leadership +8 pts Named one of FBR’s Top 40 Food & Beverage Franchises
Gunther Plosch Chief Financial Officer © Quality Is Our Recipe, LLC
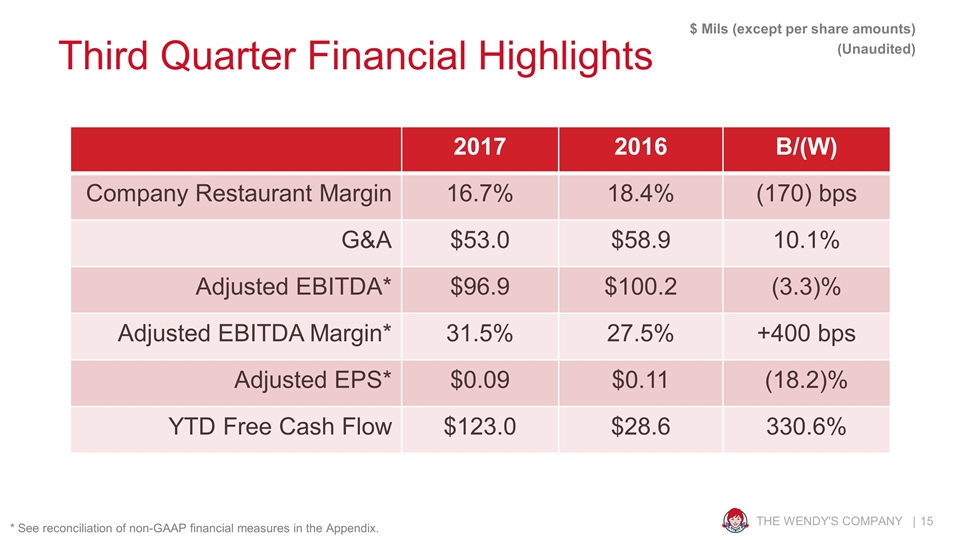
Third Quarter Financial Highlights THE WENDY'S COMPANY | 2017 2016 B/(W) Company Restaurant Margin 16.7% 18.4% (170) bps G&A $53.0 $58.9 10.1% Adjusted EBITDA* $96.9 $100.2 (3.3)% Adjusted EBITDA Margin* 31.5% 27.5% +400 bps Adjusted EPS* $0.09 $0.11 (18.2)% YTD Free Cash Flow $123.0 $28.6 330.6% $ Mils (except per share amounts) (Unaudited) * See reconciliation of non-GAAP financial measures in the Appendix.
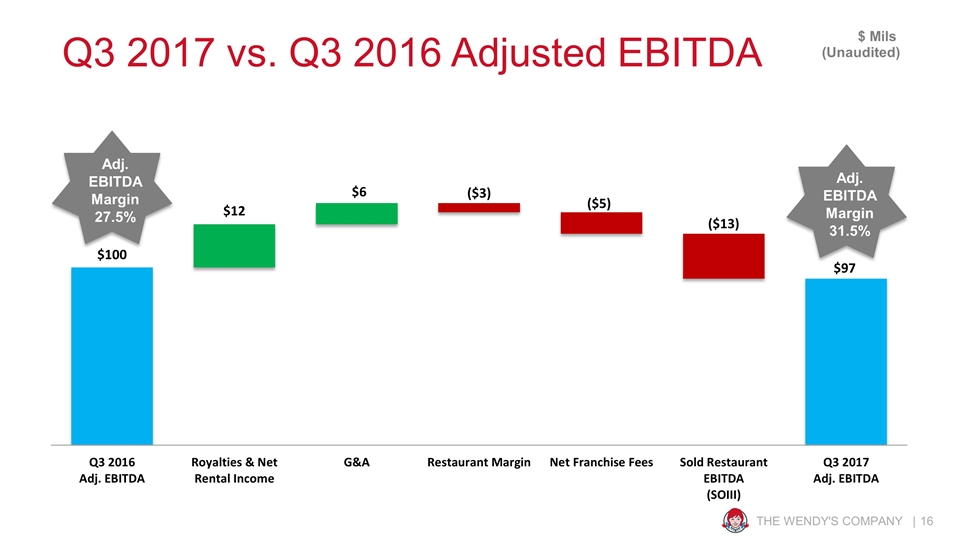
THE WENDY'S COMPANY | Q3 2017 vs. Q3 2016 Adjusted EBITDA $ Mils Adj. EBITDA Margin 27.5% Adj. EBITDA Margin 31.5% (Unaudited)
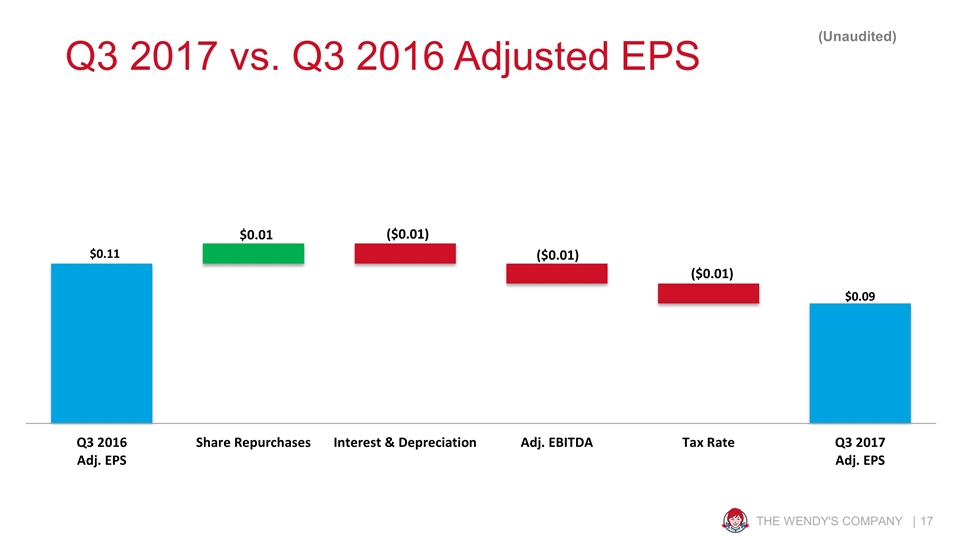
THE WENDY'S COMPANY | Q3 2017 vs. Q3 2016 Adjusted EPS (Unaudited)
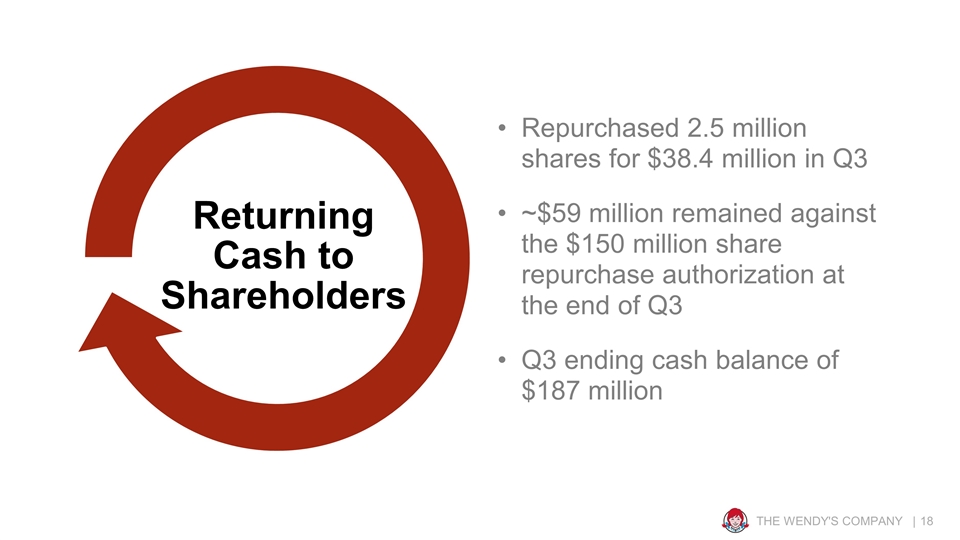
THE WENDY'S COMPANY | Returning Cash to Shareholders Repurchased 2.5 million shares for $38.4 million in Q3 ~$59 million remained against the $150 million share repurchase authorization at the end of Q3 Q3 ending cash balance of $187 million
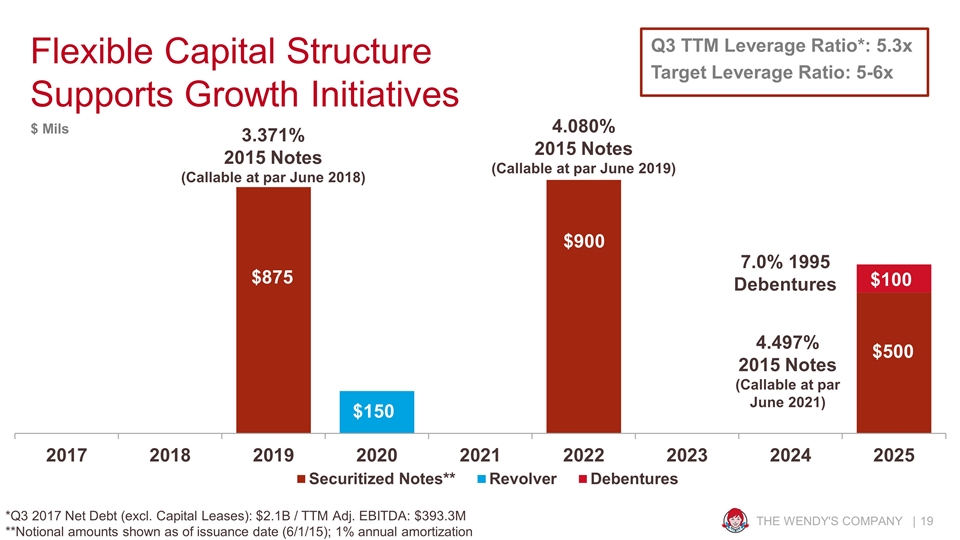
Flexible Capital Structure Supports Growth Initiatives THE WENDY'S COMPANY | Q3 TTM Leverage Ratio*: 5.3x Target Leverage Ratio: 5-6x $875 $900 $500 $100 *Q3 2017 Net Debt (excl. Capital Leases): $2.1B / TTM Adj. EBITDA: $393.3M **Notional amounts shown as of issuance date (6/1/15); 1% annual amortization 3.371% 2015 Notes (Callable at par June 2018) 4.080% 2015 Notes (Callable at par June 2019) 4.497% 2015 Notes (Callable at par June 2021) 7.0% 1995 Debentures $ Mils
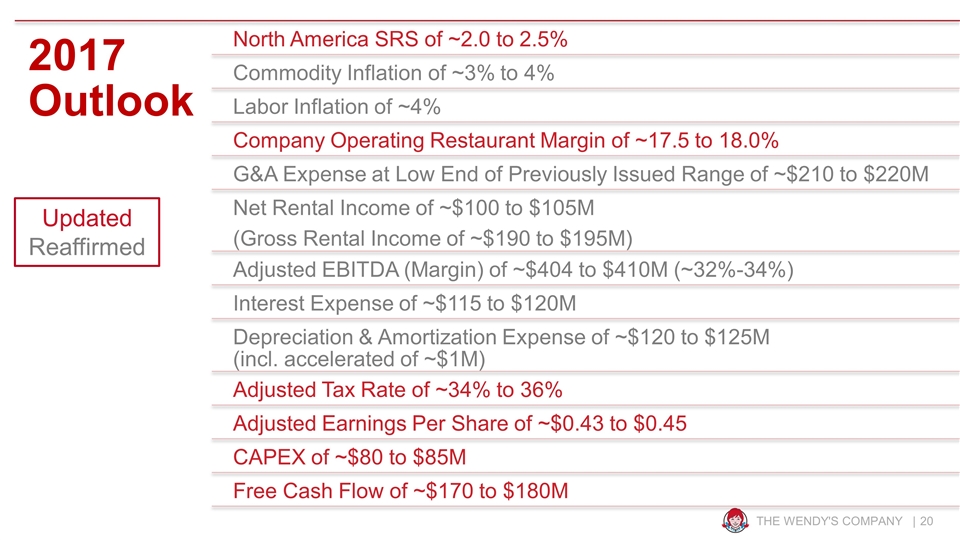
THE WENDY'S COMPANY | Updated Reaffirmed 2017 Outlook CAPEX of ~$80 to $85M Free Cash Flow of ~$170 to $180M North America SRS of ~2.0 to 2.5% Interest Expense of ~$115 to $120M Commodity Inflation of ~3% to 4% G&A Expense at Low End of Previously Issued Range of ~$210 to $220M Labor Inflation of ~4% Company Operating Restaurant Margin of ~17.5 to 18.0% Adjusted EBITDA (Margin) of ~$404 to $410M (~32%-34%) Depreciation & Amortization Expense of ~$120 to $125M (incl. accelerated of ~$1M) Adjusted Tax Rate of ~34% to 36% Adjusted Earnings Per Share of ~$0.43 to $0.45 Net Rental Income of ~$100 to $105M (Gross Rental Income of ~$190 to $195M)
Peter Koumas Director – Investor Relations © Quality Is Our Recipe, LLC
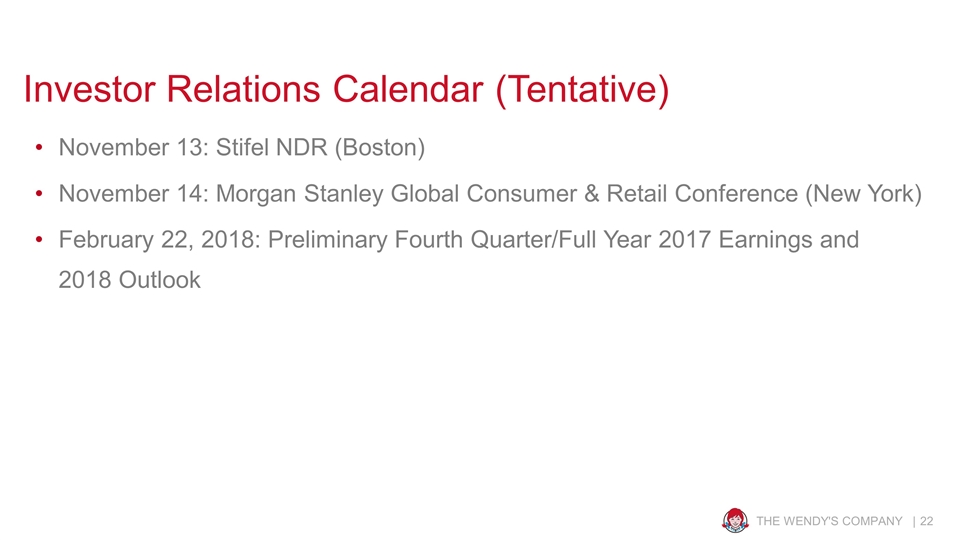
Investor Relations Calendar (Tentative) November 13: Stifel NDR (Boston) November 14: Morgan Stanley Global Consumer & Retail Conference (New York) February 22, 2018: Preliminary Fourth Quarter/Full Year 2017 Earnings and 2018 Outlook THE WENDY'S COMPANY |

Q&A

Appendix
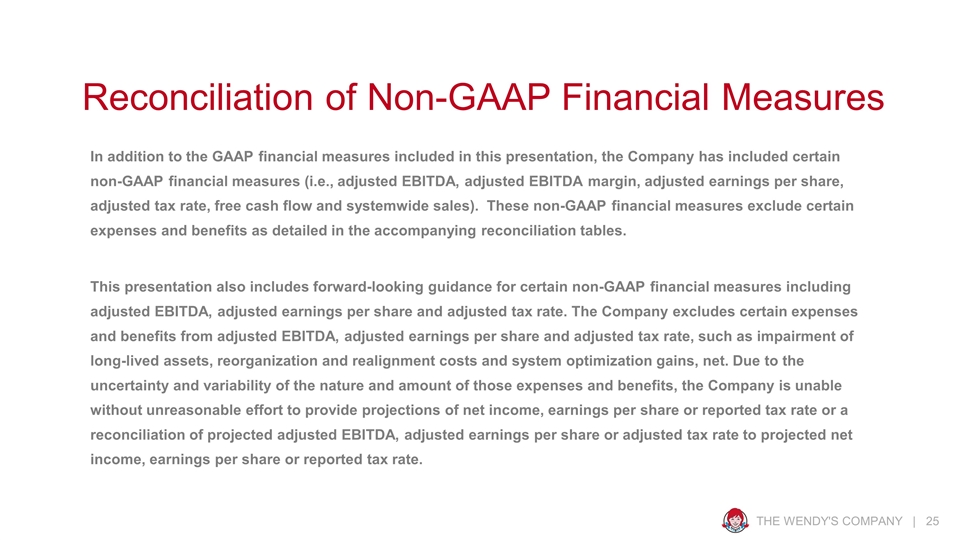
Reconciliation of Non-GAAP Financial Measures In addition to the GAAP financial measures included in this presentation, the Company has included certain non-GAAP financial measures (i.e., adjusted EBITDA, adjusted EBITDA margin, adjusted earnings per share, adjusted tax rate, free cash flow and systemwide sales). These non-GAAP financial measures exclude certain expenses and benefits as detailed in the accompanying reconciliation tables. This presentation also includes forward-looking guidance for certain non-GAAP financial measures including adjusted EBITDA, adjusted earnings per share and adjusted tax rate. The Company excludes certain expenses and benefits from adjusted EBITDA, adjusted earnings per share and adjusted tax rate, such as impairment of long-lived assets, reorganization and realignment costs and system optimization gains, net. Due to the uncertainty and variability of the nature and amount of those expenses and benefits, the Company is unable without unreasonable effort to provide projections of net income, earnings per share or reported tax rate or a reconciliation of projected adjusted EBITDA, adjusted earnings per share or adjusted tax rate to projected net income, earnings per share or reported tax rate. THE WENDY'S COMPANY |
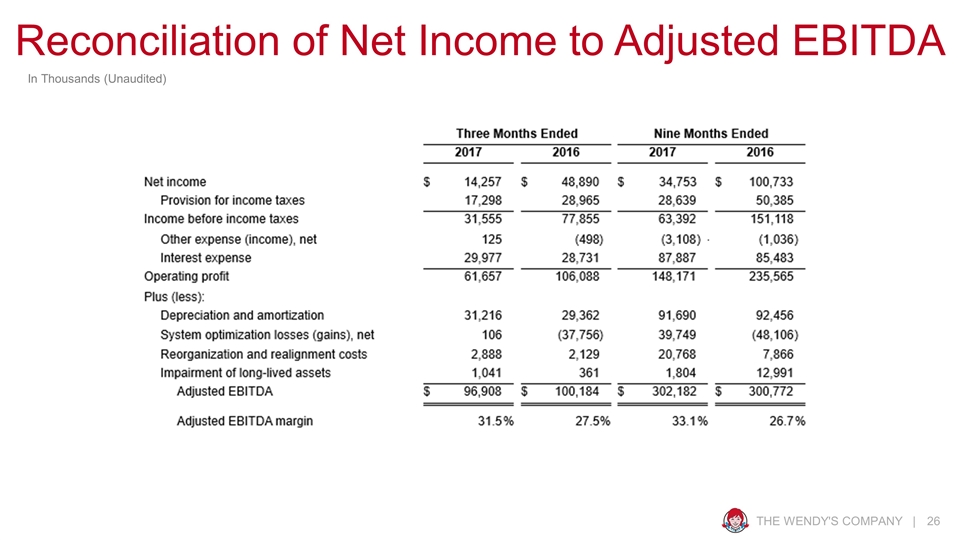
THE WENDY'S COMPANY | Reconciliation of Net Income to Adjusted EBITDA In Thousands (Unaudited)
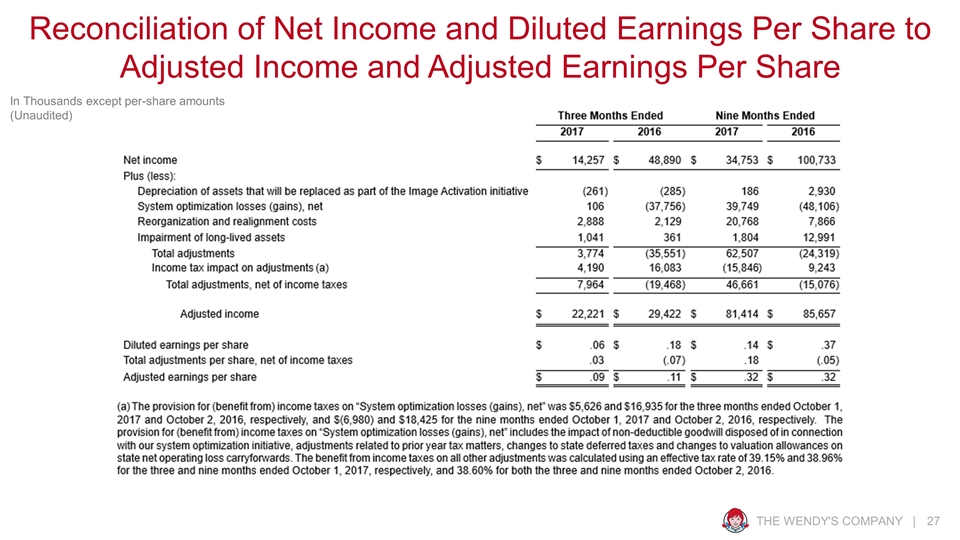
Reconciliation of Net Income and Diluted Earnings Per Share to Adjusted Income and Adjusted Earnings Per Share In Thousands except per-share amounts (Unaudited) THE WENDY'S COMPANY |
