Attached files
| file | filename |
|---|---|
| EX-99.1 - EXHIBIT 99.1 - KELLY SERVICES INC | a20173qearningsreleaseform.htm |
| 8-K - 8-K - KELLY SERVICES INC | form8-k2017thirdquarter.htm |
Kelly Services, Inc.
Third Quarter
November 8, 2017
Exhibit 99.2
Safe Harbor Statement
This release contains statements that are forward looking in nature and, accordingly, are subject to risks and
uncertainties. These factors include, but are not limited to, competitive market pressures including pricing and
technology introductions, changing market and economic conditions, our ability to achieve our business strategy,
the risk of damage to our brand, the risk our intellectual assets could be infringed upon or compromised, our
ability to successfully develop new service offerings, our exposure to risks associated with services outside
traditional staffing, including business process outsourcing, our increasing dependency on third parties for the
execution of critical functions, the risks associated with past and future acquisitions, exposure to risks associated
with investments in equity affiliates, material changes in demand from or loss of large corporate customers, risks
associated with conducting business in foreign countries, including foreign currency fluctuations, availability of
full-time employees to lead complex talent supply chain sales and operations, availability of temporary workers
with appropriate skills required by customers, liabilities for employment-related claims and losses, including class
action lawsuits and collective actions, the risk of cyber attacks or other breaches of network or information
technology security as well as risks associated with compliance on data privacy, our ability to sustain critical
business applications through our key data centers, our ability to effectively implement and manage our
information technology programs, our ability to maintain adequate financial and management processes and
controls, impairment charges triggered by adverse industry developments or operational circumstances,
unexpected changes in claim trends on workers’ compensation, disability and medical benefit plans, the impact of
the Patient Protection and Affordable Care Act on our business, the impact of changes in laws and regulations
(including federal, state and international tax laws ), the risk of additional tax or unclaimed property liabilities in
excess of our estimates, our ability to maintain specified financial covenants in our bank facilities to continue to
access credit markets, and other risks, uncertainties and factors discussed in this release and in the Company’s
filings with the Securities and Exchange Commission. Actual results may differ materially from any forward looking
statements contained herein, and we have no intention to update these statements.
2

Third Quarter 2017 Highlights
(YOY Comparisons)
Total revenue increased 6.5%
– Increased 5.3% on a constant currency basis
Gross profit up 7.3%
– up 6.2% on a constant currency basis
Earnings from operations of $18.2 million, down 3%
Diluted earnings per share of $0.58, compared to $2.06 per share last
year
– Excluding $1.62 after-tax gain on APAC JV transaction in 2016,
diluted earnings per share up $0.14, a 32% increase
3
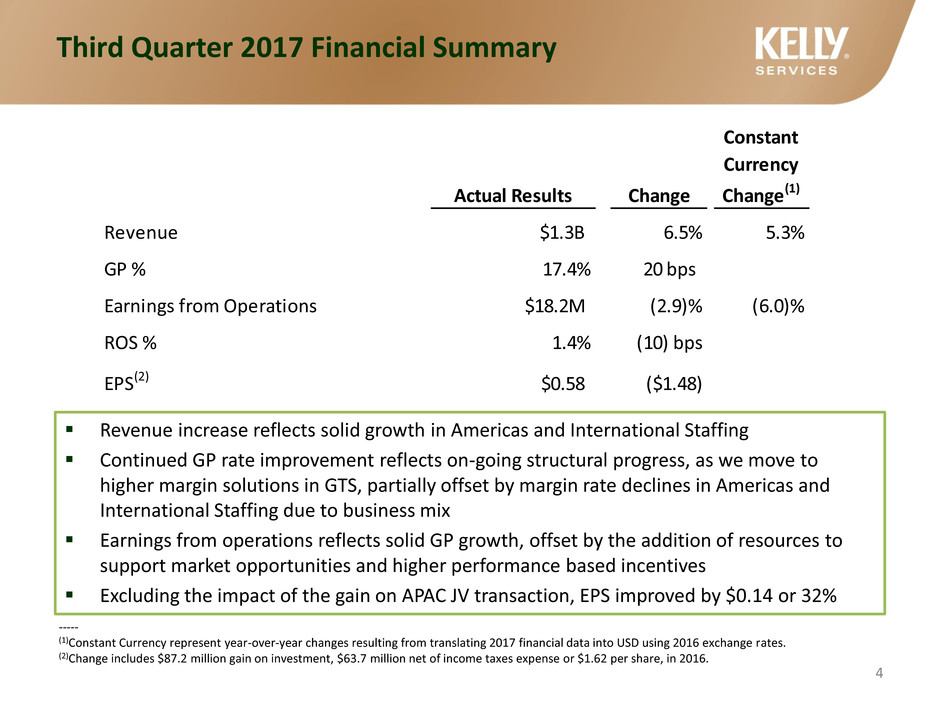
Revenue increase reflects solid growth in Americas and International Staffing
Continued GP rate improvement reflects on-going structural progress, as we move to
higher margin solutions in GTS, partially offset by margin rate declines in Americas and
International Staffing due to business mix
Earnings from operations reflects solid GP growth, offset by the addition of resources to
support market opportunities and higher performance based incentives
Excluding the impact of the gain on APAC JV transaction, EPS improved by $0.14 or 32%
-----
(1)Constant Currency represent year-over-year changes resulting from translating 2017 financial data into USD using 2016 exchange rates.
(2)Change includes $87.2 million gain on investment, $63.7 million net of income taxes expense or $1.62 per share, in 2016.
Third Quarter 2017 Financial Summary
4
Actual Results Change
Constant
Currency
Change(1)
Reve ue $1.3B 6.5% 5.3%
GP % 17.4% 20 bps
Earnings from Operations $18.2M (2.9)% (6.0)%
ROS % 1.4% (10) bps
EPS(2) $0.58 ($1.48)
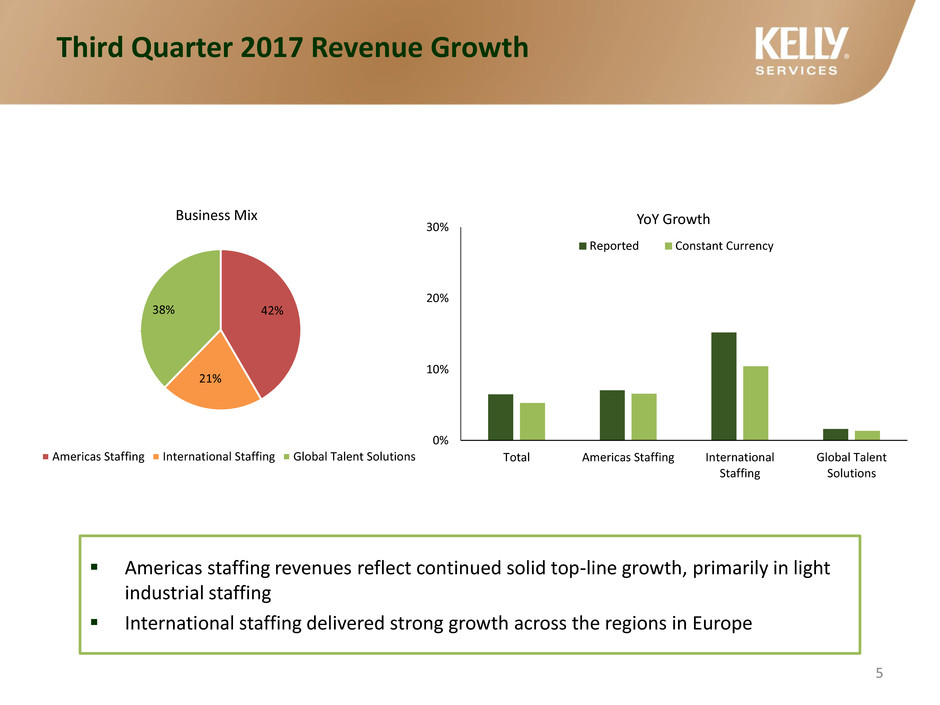
Americas staffing revenues reflect continued solid top-line growth, primarily in light
industrial staffing
International staffing delivered strong growth across the regions in Europe
Third Quarter 2017 Revenue Growth
5
42%
21%
38%
Business Mix
Americas Staffing International Staffing Global Talent Solutions
0%
10%
20%
30%
Total Americas Staffing International
Staffing
Global Talent
Solutions
YoY Growth
Reported Constant Currency
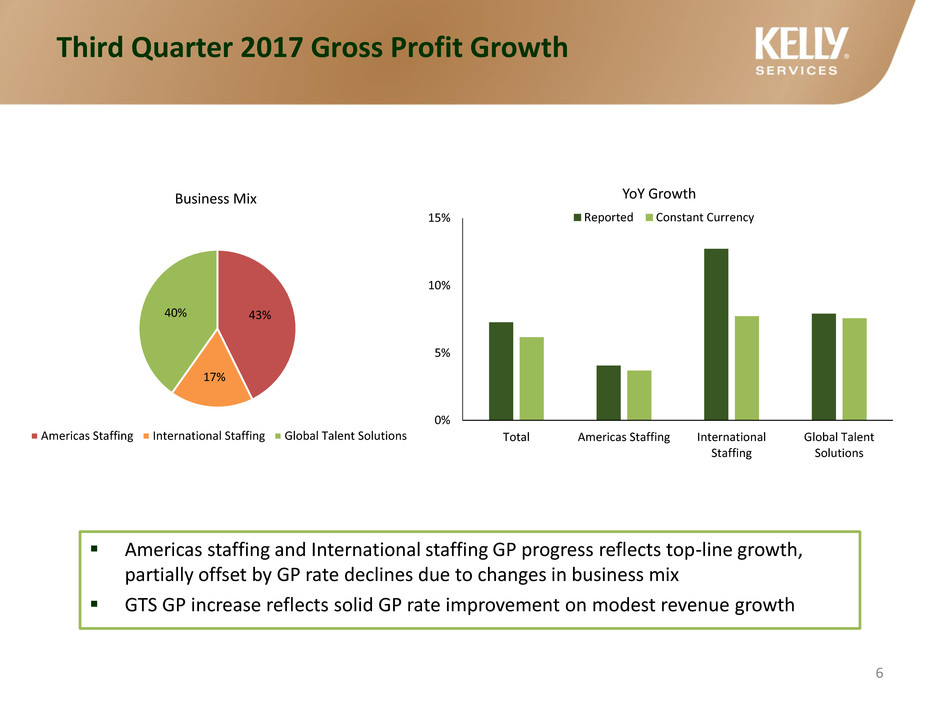
Third Quarter 2017 Gross Profit Growth
Americas staffing and International staffing GP progress reflects top-line growth,
partially offset by GP rate declines due to changes in business mix
GTS GP increase reflects solid GP rate improvement on modest revenue growth
6
43%
17%
40%
Business Mix
Americas Staffing International Staffing Global Talent Solutions
0%
5%
10%
15%
Total Americas Staffing International
Staffing
Global Talent
Solutions
YoY Growth
Reported Constant Currency
17.2%
17.4%
16.0%
16.2%
16.4%
16.6%
16.8%
17.0%
17.2%
17.4%
17.6%
Q3 2016 GP Rate Americas Staffing International Staffing Global Talent
Solutions
Perm Fees Q3 2017 GP Rate
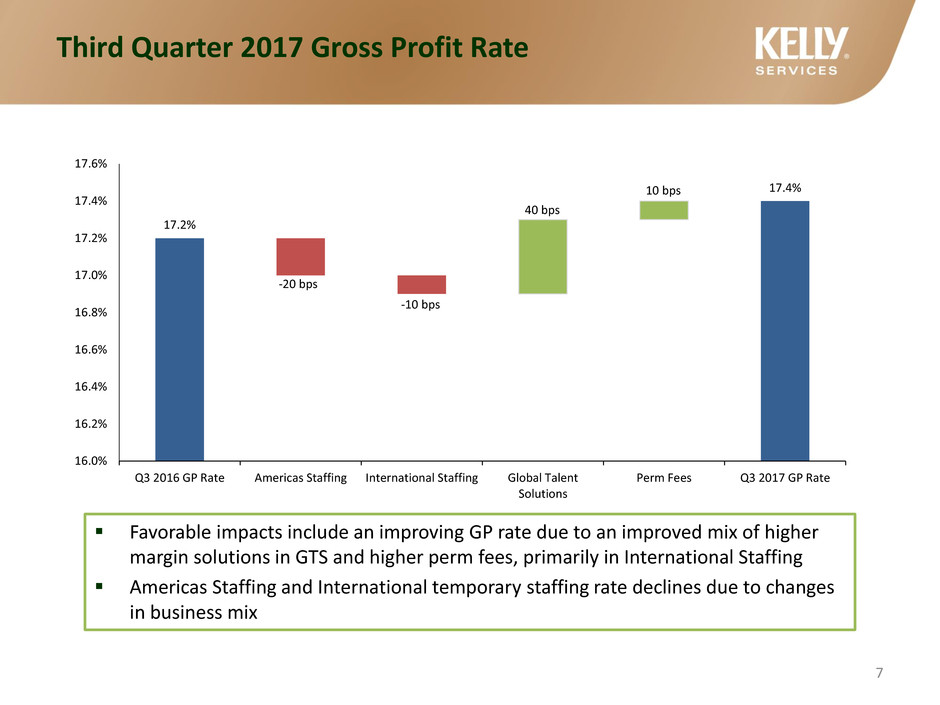
Third Quarter 2017 Gross Profit Rate
Favorable impacts include an improving GP rate due to an improved mix of higher
margin solutions in GTS and higher perm fees, primarily in International Staffing
Americas Staffing and International temporary staffing rate declines due to changes
in business mix
-10 bps
40 bps
7
-20 bps
10 bps
$196
$213
$180
$185
$190
$195
$200
$205
$210
$215
Q3 2016 SG&A International
Staffing
FX Americas Staffing Corporate Global Talent
Solutions
Q3 2017 SG&A
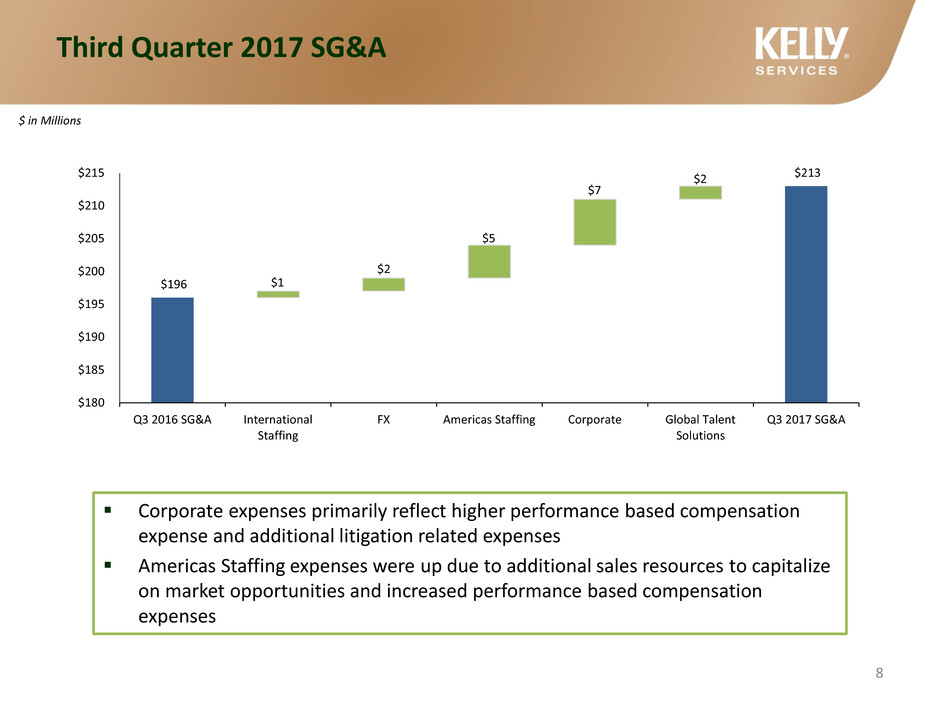
Third Quarter 2017 SG&A
Corporate expenses primarily reflect higher performance based compensation
expense and additional litigation related expenses
Americas Staffing expenses were up due to additional sales resources to capitalize
on market opportunities and increased performance based compensation
expenses
$1
$2
$5
$2
$ in Millions
$7
8
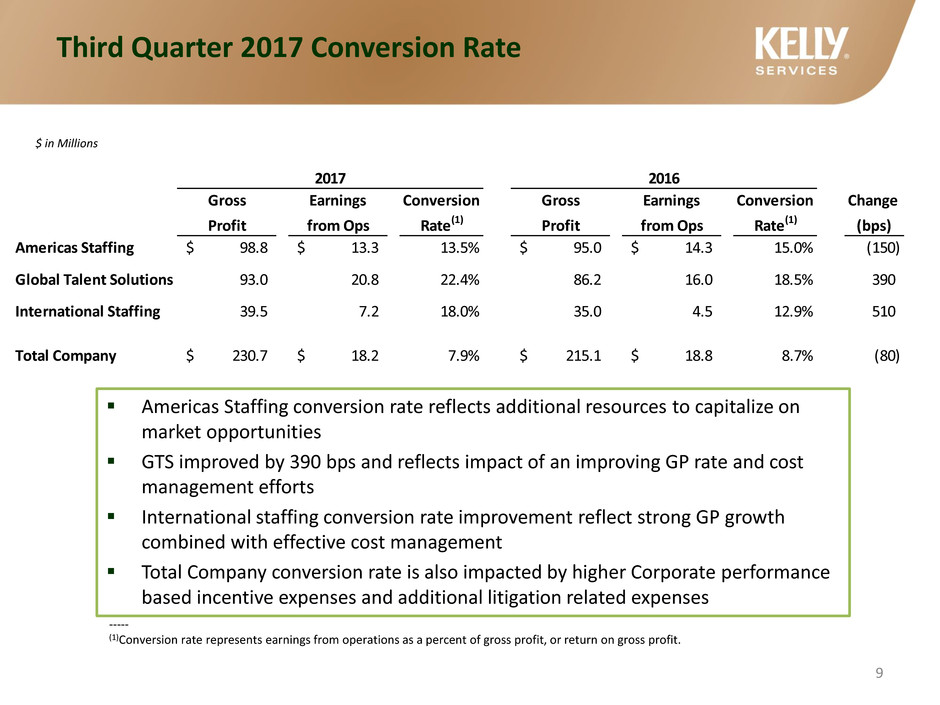
Third Quarter 2017 Conversion Rate
-----
(1)Conversion rate represents earnings from operations as a percent of gross profit, or return on gross profit.
Americas Staffing conversion rate reflects additional resources to capitalize on
market opportunities
GTS improved by 390 bps and reflects impact of an improving GP rate and cost
management efforts
International staffing conversion rate improvement reflect strong GP growth
combined with effective cost management
Total Company conversion rate is also impacted by higher Corporate performance
based incentive expenses and additional litigation related expenses
$ in Millions
9
2017 2016
Gross Earnings Conversion Gross Earnings Conversion Change
Profit from Ops Rate(1) Profit from Ops Rate(1) (bps)
Americas Staffing 98.8$ 13.3$ 13.5% 95.0$ 14.3$ 15.0% (150)
Global Talent Solutions 93.0 20.8 22.4% 86.2 16.0 18.5% 390
International Staffing 39.5 7.2 18.0% 35.0 4.5 12.9% 510
Total Company 230.7$ 18.2$ 7.9% 215.1$ 18.8$ 8.7% (80)
-----
(1)Conversion rate represents earnings from operations as a percent of gross profit, or return on gross profit.
$500
$600
$700
$800
$900
$1,000
$1,100
$1,200
$1,300
$1,400
2016 Q3 2016 2017 Q3
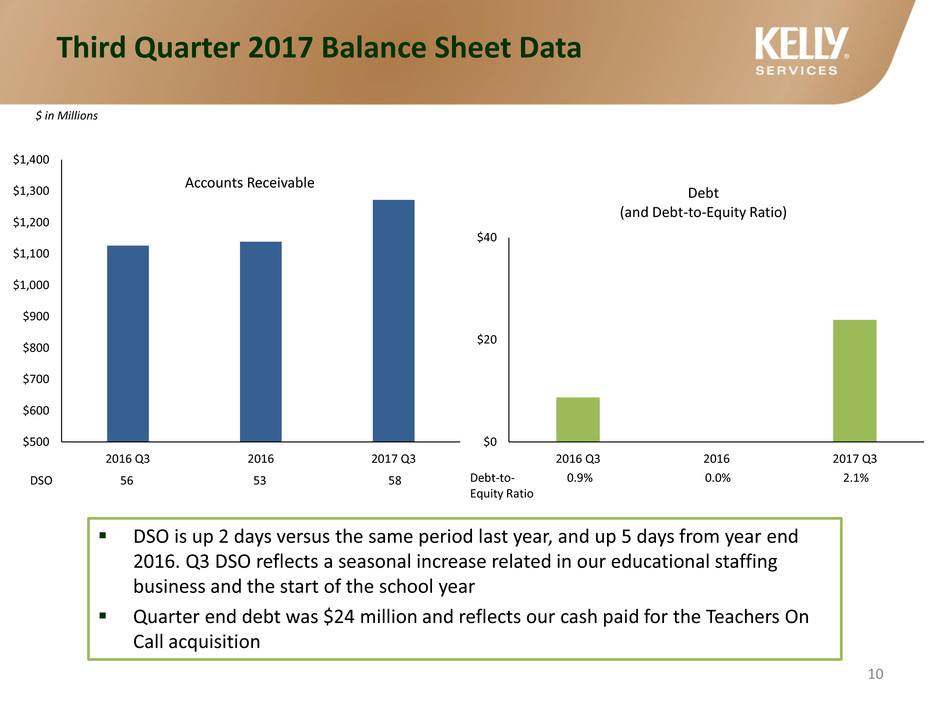
Accounts Receivable
Third Quarter 2017 Balance Sheet Data
10
DSO is up 2 days versus the same period last year, and up 5 days from year end
2016. Q3 DSO reflects a seasonal increase related in our educational staffing
business and the start of the school year
Quarter end debt was $24 million and reflects our cash paid for the Teachers On
Call acquisition
$ in Millions
DSO 56 53 58 Debt-to- 0.9% 0.0% 2.1%
Equity Ratio
$0
$20
$40
2016 Q3 2016 2017 Q3
Debt
(and Debt-to-Equity Ratio)
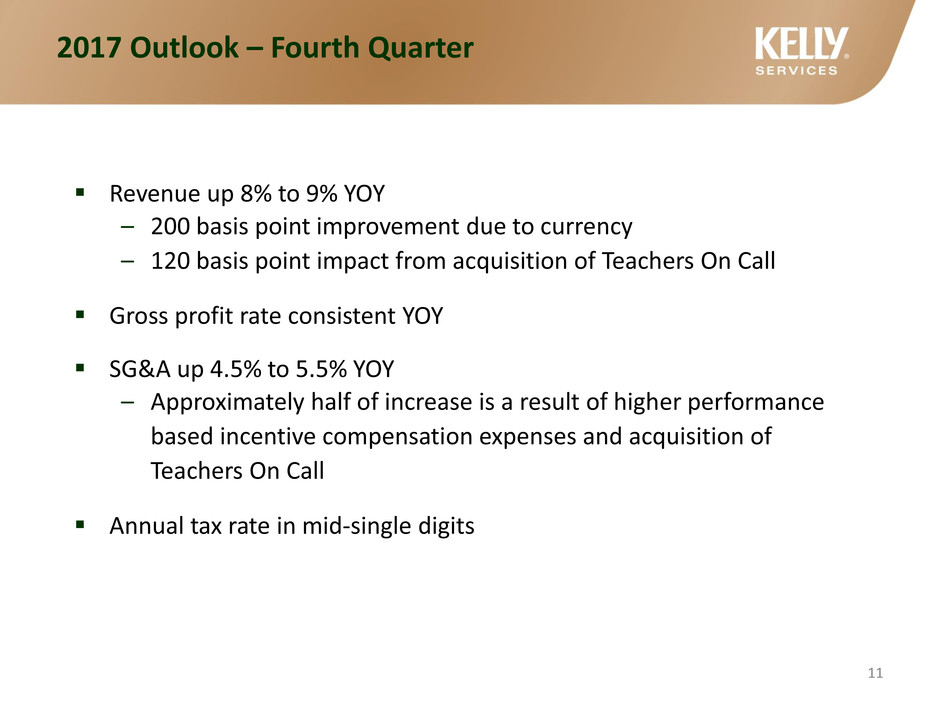
2017 Outlook – Fourth Quarter
Revenue up 8% to 9% YOY
– 200 basis point improvement due to currency
– 120 basis point impact from acquisition of Teachers On Call
Gross profit rate consistent YOY
SG&A up 4.5% to 5.5% YOY
– Approximately half of increase is a result of higher performance
based incentive compensation expenses and acquisition of
Teachers On Call
Annual tax rate in mid-single digits
11
Teachers On Call acquisition
Stock purchase completed on September 5, 2017
Teachers On Call is a U.S. based provider of substitute teacher staffing
services for K-12 public, private, and charter schools, and early child
care centers focused on the upper mid-west
Complements Kelly Educational Staffing geographic and service
footprint
Expands on Kelly’s existing leading position in the U.S. educational
staffing market
12
