Attached files
| file | filename |
|---|---|
| EX-99.1 - EXHIBIT 99.1 - Community Healthcare Trust Inc | earningspressrelease2017q3.htm |
| 8-K - 8-K - Community Healthcare Trust Inc | a2017q3earningsrelease8-k.htm |
Exhibit 99.2
Supplemental Information
Third Quarter 2017
NYSE: CHCT |
www.chct.reit |
TABLE OF CONTENTS
Cautionary Note Regarding Forward-Looking Statements
In addition to the historical information contained within, the matters discussed in this supplemental operating and financial information package may contain “forward-looking statements” within the meaning of Section 27A of the Securities Act of 1933, as amended, and Section 21E of the Securities Exchange Act of 1934, as amended, pursuant to the safe harbor provisions of the Private Securities Litigation Reform Act of 1995. Forward-looking statements are generally identifiable by use of forward-looking terminology such as “believes”, “expects”, “may”, “should”, “seeks”, “approximately”, “intends”, “plans”, “estimates”, “anticipates” or other similar words or expressions, including the negative thereof. Forward-looking statements are based on certain assumptions and can include future expectations, future plans and strategies, financial and operating projections or other forward-looking information. Such forward-looking statements reflect management’s current beliefs and are based on information currently available to management. Because forward-looking statements relate to future events, they are subject to inherent uncertainties, risks and changes in circumstances that are difficult to predict and many of which are outside of the control of Community Healthcare Trust Incorporated (the "Company"). Thus, the Company’s actual results and financial condition may differ materially from those indicated in such forward-looking statements. Some factors that might cause such a difference include the following: general volatility of the capital markets and the market price of the Company’s common stock, changes in the Company’s business strategy, availability, terms and deployment of capital, the Company’s ability to refinance existing indebtedness at or prior to maturity on favorable terms, or at all, changes in the real estate industry in general, interest rates or the general economy, adverse developments related to the healthcare industry, the degree and nature of the Company’s competition, the ability to consummate acquisitions under contract and the other factors described in the section entitled “Risk Factors” in the Company’s Annual Report on Form 10-K for the year ended December 31, 2016, the Company's Quarterly Reports on Form 10-Q for the three months ended March 31, 2017 and June 30, 2017, and the Company’s other filings with the Securities and Exchange Commission from time to time. Readers are therefore cautioned not to place undue reliance on the forward-looking statements contained herein which speak only as of the date hereof. The Company intends these forward-looking statements to speak only as of the time of this supplemental operating and financial information package and undertakes no obligation to update forward-looking statements, whether as a result of new information, future developments, or otherwise, except as may be required by law.
Community Healthcare Trust / 3Q 2017 Supplemental Information | Page 2 | |
CORPORATE INFORMATION
Corporate Headquarters | ||||
Community Healthcare Trust Incorporated | ||||
3326 Aspen Grove Drive, Suite 150 | ||||
Franklin, Tennessee 37067 | ||||
Phone: 615.771.3052 | ||||
E-mail: Investorrelations@chct.reit | ||||
Website: www.chct.reit | ||||
Board of Directors | ||||
Timothy G. Wallace | Alan Gardner | Robert Hensley | Alfred Lumsdaine | R. Lawrence Van Horn |
Chairman of the Board, Chief Executive Officer and President | Lead Independent Director | Audit Committee Chair | Compensation Committee Chair | Corporate Governance Committee Chair |
Management Team | ||||
Timothy G. Wallace | W. Page Barnes | Leigh Ann Stach | Roland H. Hart | Steve Harrison |
Chief Executive Officer and President | Executive Vice President, Chief Financial Officer | Vice President, Financial Reporting and Chief Accounting Officer | Vice President, Asset Management | Managing Director, Business Development |
Michael Willman | William R. Davis | James W. Short | ||
Vice President, Real Estate | Vice President, Information Technology | Director, Special Projects | ||
Covering Analysts | ||||
A. Goldfarb - Sandler O'Neill | E. Fleming - SunTrust Robinson Humphrey | |||
S. McGrath - Evercore ISI | R. Stevenson - Janney Capital Markets | |||
Professional Services | ||||
Independent Registered Public Accounting Firm | Transfer Agent | |||
BDO USA, LLP | American Stock Transfer & Trust Company, LLC | |||
414 Union Street, Suite 1800 | Operations Center | |||
Nashville, Tennessee 37219 | 6201 15th Avenue | |||
Brooklyn, New York 11219 | ||||
1.800.937.5449 | ||||
Community Healthcare Trust / 3Q 2017 Supplemental Information | Page 3 | |
HISTORICAL FFO, NORMALIZED FFO AND AFFO (1)
(dollars in thousands, except per share data)
2017 | 2016 | 2015 | ||||||||||||||||||||||||
Q3 | Q2 | Q1 | Q4 | Q3 | Q2 | Q1 | Q4 | |||||||||||||||||||
Net income | $ | 579 | $ | 466 | $ | 913 | $ | 1,033 | $ | 1,064 | $ | 508 | $ | 116 | $ | 121 | ||||||||||
Real estate depreciation and amortization | 4,539 | 4,276 | 3,921 | 3,554 | 3,493 | 3,330 | 2,813 | 2,415 | ||||||||||||||||||
Total adjustments | 4,539 | 4,276 | 3,921 | 3,554 | 3,493 | 3,330 | 2,813 | 2,415 | ||||||||||||||||||
Funds from Operations | $ | 5,118 | $ | 4,742 | $ | 4,834 | $ | 4,587 | $ | 4,557 | $ | 3,838 | $ | 2,929 | $ | 2,536 | ||||||||||
Transaction costs (2) | 11 | — | — | 200 | 137 | 204 | 288 | 243 | ||||||||||||||||||
Normalized Funds From Operations | $ | 5,129 | $ | 4,742 | $ | 4,834 | $ | 4,787 | $ | 4,694 | $ | 4,042 | $ | 3,217 | $ | 2,779 | ||||||||||
Straight line rent | (417 | ) | (270 | ) | (265 | ) | (201 | ) | (171 | ) | (138 | ) | (95 | ) | (69 | ) | ||||||||||
Deferred compensation | 395 | 338 | 318 | 221 | 192 | 140 | 121 | 70 | ||||||||||||||||||
AFFO | $ | 5,107 | $ | 4,810 | $ | 4,887 | $ | 4,807 | $ | 4,715 | $ | 4,044 | $ | 3,243 | $ | 2,780 | ||||||||||
Funds from Operations per Common Share-Diluted | $ | 0.31 | $ | 0.37 | $ | 0.38 | $ | 0.36 | $ | 0.36 | $ | 0.32 | $ | 0.39 | $ | 0.34 | ||||||||||
Normalized Funds From Operations Per Common Share-Diluted | $ | 0.31 | $ | 0.37 | $ | 0.38 | $ | 0.38 | $ | 0.37 | $ | 0.34 | $ | 0.43 | $ | 0.37 | ||||||||||
AFFO Per Common Share-Diluted | $ | 0.31 | $ | 0.38 | $ | 0.38 | $ | 0.38 | $ | 0.37 | $ | 0.34 | $ | 0.43 | $ | 0.37 | ||||||||||
Weighted Average Common Shares Outstanding-Diluted | 16,401,718 | 12,815,605 | 12,819,496 | 12,759,089 | 12,750,967 | 12,064,839 | 7,562,644 | 7,511,815 | ||||||||||||||||||
(1 | ) | Historical cost accounting for real estate assets implicitly assumes that the value of real estate assets diminishes predictably over time. However, since real estate values have historically risen or fallen with market conditions, many industry investors deem presentations of operating results for real estate companies that use historical cost accounting to be insufficient by themselves. For that reason, the Company considers funds from operations ("FFO"), normalized FFO and adjusted funds from operations ("AFFO") to be appropriate measures of operating performance of an equity real estate investment trust ("REIT"). In particular, the Company believes that normalized FFO and AFFO are useful because they allows investors, analysts and Company management to compare the Company’s operating performance to the operating performance of other real estate companies and between periods on a consistent basis without having to account for differences caused by unanticipated items and other events. The Company uses the National Association of Real Estate Investment Trusts, Inc. ("NAREIT") definition of FFO. FFO and FFO per share are operating performance measures adopted by NAREIT. NAREIT defines FFO as the most commonly accepted and reported measure of a REIT's operating performance equal to "net income (computed in accordance with GAAP), excluding gains (or losses) from sales of property, plus depreciation and amortization, and after adjustments for unconsolidated partnerships and joint ventures." The Company has included normalized FFO which it has defined as FFO excluding certain expenses related to closing costs of properties acquired accounted for as business combinations and mortgages funded and has included AFFO which it has defined as normalized FFO excluding straight-line rent and deferred compensation and may include other non-cash items from time to time. Normalized FFO and AFFO presented herein may not be comparable to similar measures presented by other real estate companies due to the fact that not all real estate companies use the same definitions. FFO, normalized FFO and AFFO should not be considered as alternatives to net income (determined in accordance with GAAP) as indicators of the Company’s financial performance or as alternatives to cash flow from operating activities (determined in accordance with GAAP) as measures of the Company’s liquidity, nor are they necessarily indicative of sufficient cash flow to fund all of the Company’s needs. The Company believes that in order to facilitate a clear understanding of the consolidated historical operating results of the Company, FFO, normalized FFO and AFFO should be examined in conjunction with net income as presented elsewhere herein. |
(2 | ) | Upon the adoption of Accounting Standards Update ("ASU") No, 2017-01, Business Combinations (Topic 805): Clarifying the Definition of a Business, on January 1, 2017, the Company expects that substantially all of its acquisitions will be accounted for as asset acquisitions. As such, transaction costs related to its acquisitions will be capitalized into the real estate property. The transaction costs of $11,000 above for the three months ended September 30, 2017 relate to costs associated with the $5.0 million mezzanine loan. |
Community Healthcare Trust / 3Q 2017 Supplemental Information | Page 4 | |
BALANCE SHEET INFORMATION
(dollars in thousands, except per share data)
2017 | 2016 | 2015 | ||||||||||||||||||||||
Q3 | Q2 | Q1 | Q4 | Q3 | Q2 | Q1 | Q4 | |||||||||||||||||
ASSETS | ||||||||||||||||||||||||
Real estate properties | ||||||||||||||||||||||||
Land and land improvements | $ | 39,810 | $ | 37,277 | $ | 33,476 | $ | 29,884 | $ | 24,109 | $ | 22,601 | $ | 19,317 | $ | 13,216 | ||||||||
Buildings, improvements, and lease intangibles | 307,492 | 281,408 | 248,922 | 222,755 | 182,474 | 171,407 | 140,322 | 119,716 | ||||||||||||||||
Personal property | 112 | 109 | 102 | 97 | 97 | 81 | 69 | 35 | ||||||||||||||||
Total real estate properties | 347,414 | 318,794 | 282,500 | 252,736 | 206,680 | 194,089 | 159,708 | 132,967 | ||||||||||||||||
Less accumulated depreciation | (31,153 | ) | (26,610 | ) | (22,328 | ) | (18,404 | ) | (14,846 | ) | (11,350 | ) | (8,018 | ) | (5,203 | ) | ||||||||
Total real estate properties, net | 316,261 | 292,184 | 260,172 | 234,332 | 191,834 | 182,739 | 151,690 | 127,764 | ||||||||||||||||
Cash and cash equivalents | 17,479 | 831 | 2,044 | 1,568 | 1,742 | 10,920 | 1,571 | 2,018 | ||||||||||||||||
Mortgage note receivable, net | 10,633 | 10,518 | 10,652 | 10,786 | 10,875 | 10,872 | 23,277 | 10,897 | ||||||||||||||||
Other assets, net | 10,776 | 5,722 | 4,905 | 4,843 | 4,153 | 3,082 | 2,704 | 2,124 | ||||||||||||||||
Total assets | $ | 355,149 | $ | 309,255 | $ | 277,773 | $ | 251,529 | $ | 208,604 | $ | 207,613 | $ | 179,242 | $ | 142,803 | ||||||||
LIABILITIES AND STOCKHOLDERS' EQUITY | ||||||||||||||||||||||||
Liabilities | ||||||||||||||||||||||||
Debt, net | $ | 59,284 | $ | 117,251 | $ | 81,235 | $ | 51,000 | $ | 5,000 | $ | — | $ | 55,000 | $ | 17,000 | ||||||||
Accounts payable and accrued liabilities | 3,226 | 3,057 | 2,964 | 3,541 | 2,755 | 2,521 | 1,299 | 812 | ||||||||||||||||
Other liabilities | 4,743 | 3,533 | 3,566 | 2,981 | 3,095 | 3,625 | 3,349 | 2,721 | ||||||||||||||||
Total liabilities | 67,253 | 123,841 | 87,765 | 57,522 | 10,850 | 6,146 | 59,648 | 20,533 | ||||||||||||||||
Commitments and contingencies | ||||||||||||||||||||||||
Stockholders' Equity | ||||||||||||||||||||||||
Preferred stock, $0.01 par value; 50,000,000 shares authorized | — | — | — | — | — | — | — | — | ||||||||||||||||
Common stock, $0.01 par value; 450,000,000 shares authorized | 181 | 131 | 131 | 130 | 130 | 129 | 77 | 76 | ||||||||||||||||
Additional paid-in capital | 323,877 | 214,975 | 214,640 | 214,323 | 214,102 | 213,912 | 127,697 | 127,578 | ||||||||||||||||
Cumulative net income (loss) | 3,223 | 2,644 | 2,178 | 1,265 | 232 | (832 | ) | (1,340 | ) | (1,456 | ) | |||||||||||||
Accumulated other comprehensive loss | (386 | ) | (436 | ) | (152 | ) | — | — | — | — | — | |||||||||||||
Cumulative dividends | (38,999 | ) | (31,900 | ) | (26,789 | ) | (21,711 | ) | (16,710 | ) | (11,742 | ) | (6,840 | ) | (3,928 | ) | ||||||||
Total stockholders’ equity | 287,896 | 185,414 | 190,008 | 194,007 | 197,754 | 201,467 | 119,594 | 122,270 | ||||||||||||||||
Total liabilities and stockholders' equity | $ | 355,149 | $ | 309,255 | $ | 277,773 | $ | 251,529 | $ | 208,604 | $ | 207,613 | $ | 179,242 | $ | 142,803 | ||||||||
Community Healthcare Trust / 3Q 2017 Supplemental Information | Page 5 | |
STATEMENTS OF OPERATIONS INFORMATION
(dollars in thousands, except per share data)
2017 | 2016 | 2015 | ||||||||||||||||||||||
Q3 | Q2 | Q1 | Q4 | Q3 | Q2 | Q1 | Q4 | |||||||||||||||||
REVENUES | ||||||||||||||||||||||||
Rental income | $ | 8,012 | $ | 7,338 | $ | 6,618 | $ | 5,811 | $ | 4,985 | $ | 4,530 | $ | 3,673 | $ | 3,050 | ||||||||
Tenant reimbursements | 1,158 | 1,334 | 1,128 | 1,314 | 1,188 | 1,105 | 957 | 1,202 | ||||||||||||||||
Mortgage interest | 255 | 258 | 261 | 267 | 270 | 561 | 536 | 304 | ||||||||||||||||
Other operating | 19 | — | — | — | — | — | — | — | ||||||||||||||||
9,444 | 8,930 | 8,007 | 7,392 | 6,443 | 6,196 | 5,166 | 4,556 | |||||||||||||||||
EXPENSES | ||||||||||||||||||||||||
Property operating | 2,225 | 2,140 | 1,738 | 1,504 | 963 | 1,228 | 1,049 | 1,123 | ||||||||||||||||
General and administrative | 1,069 | 835 | 770 | 856 | 671 | 895 | 806 | 646 | ||||||||||||||||
Depreciation and amortization | 4,544 | 4,281 | 3,924 | 3,558 | 3,496 | 3,332 | 2,815 | 2,416 | ||||||||||||||||
Bad debts | — | — | 67 | 52 | 73 | 30 | — | 71 | ||||||||||||||||
7,838 | 7,256 | 6,499 | 5,970 | 5,203 | 5,485 | 4,670 | 4,256 | |||||||||||||||||
OTHER INCOME (EXPENSE) | ||||||||||||||||||||||||
Interest expense | (1,091 | ) | (1,209 | ) | (597 | ) | (391 | ) | (185 | ) | (222 | ) | (380 | ) | (183 | ) | ||||||||
Interest and other income, net | 64 | 1 | 2 | 2 | 9 | 19 | — | 4 | ||||||||||||||||
(1,027 | ) | (1,208 | ) | (595 | ) | (389 | ) | (176 | ) | (203 | ) | (380 | ) | (179 | ) | |||||||||
NET INCOME | $ | 579 | $ | 466 | $ | 913 | $ | 1,033 | $ | 1,064 | $ | 508 | $ | 116 | $ | 121 | ||||||||
NET INCOME PER COMMON SHARE | ||||||||||||||||||||||||
Net income per common share – Basic | $ | 0.02 | $ | 0.04 | $ | 0.07 | $ | 0.08 | $ | 0.08 | $ | 0.04 | $ | 0.02 | $ | 0.02 | ||||||||
Net income per common share – Diluted | $ | 0.02 | $ | 0.04 | $ | 0.07 | $ | 0.08 | $ | 0.08 | $ | 0.04 | $ | 0.02 | $ | 0.02 | ||||||||
WEIGHTED AVERAGE COMMON SHARES OUTSTANDING-BASIC | 16,241,986 | 12,686,183 | 12,686,183 | 12,686,183 | 12,686,183 | 12,038,381 | 7,511,183 | 7,511,183 | ||||||||||||||||
WEIGHTED AVERAGE COMMON SHARES OUTSTANDING-DILUTED | 16,241,986 | 12,815,605 | 12,819,496 | 12,759,089 | 12,750,967 | 12,064,839 | 7,562,644 | 7,511,815 | ||||||||||||||||
DIVIDENDS DECLARED, PER COMMON SHARE, DURING THE PERIOD | $ | 0.3925 | $ | 0.3900 | $ | 0.3875 | $ | 0.3850 | $ | 0.3825 | $ | 0.3800 | $ | 0.3775 | $ | 0.3750 | ||||||||
Community Healthcare Trust / 3Q 2017 Supplemental Information | Page 6 | |
PROPERTY LOCATIONS
Over 44% of our property revenues are in MSAs with populations over 1,000,000 and over 85% are in MSAs with populations over 100,000.
Property Name | Property Type | Address | City | State | Area | % of Square Feet | Annualized Revenue (1) | % of Annualized Revenue | Population | MSA/MISA | Rank | |||||
($ 000's) | ||||||||||||||||
Chicago Behavioral Hospital | BF | 1771 Rand Road | Des Plaines | IL | 85,000 | 4.64 | % | $ | 1,938.0 | 5.87 | % | 9,512,999 | Chicago-Naperville-Elgin, IL-IN-WI | 3 | ||
Novamed Surgery Center | ASC | 6309 West 95th Street | Oak Lawn | IL | 30,455 | 1.66 | % | $ | 623.9 | 1.89 | % | 9,512,999 | Chicago-Naperville-Elgin, IL-IN-WI | 3 | ||
Skin MD | PC | 16105 South LaGrange Road | Orland Park | IL | 13,565 | 0.74 | % | $ | 450.3 | 1.36 | % | 9,512,999 | Chicago-Naperville-Arlington Heights, IL | 3 | ||
Presence | MOB | 7380 N. Lincoln Ave. | Lincolnwood | IL | 14,863 | 0.81 | % | $ | 303.4 | 0.92 | % | 9,512,999 | Chicago-Naperville-Arlington Heights, IL | 3 | ||
Bayside Medical Center | MOB | 4001 Preston Avenue | Pasadena | TX | 51,316 | 2.80 | % | $ | 710.2 | 2.15 | % | 6,772,470 | Houston-The Woodlands-Sugar Land, TX | 5 | ||
Northwest Surgery Center | ASC | 5215 Hollister Street | Houston | TX | 11,200 | 0.61 | % | $ | 466.4 | 1.41 | % | 6,772,470 | Houston-The Woodlands-Sugar Land, TX | 5 | ||
Haddon Hill Professional Center | MOB | 63 Kresson Road | Cherry Hill | NJ | 24,636 | 1.34 | % | $ | 431.0 | 1.30 | % | 6,070,500 | Philadelphia-Camden-Wilmington, PA-NJ-OE-MO | 7 | ||
Continuum Wellness Center | PC | 3941 E. Baseline Road | Gilbert | AZ | 8,200 | 0.45 | % | $ | 33.0 | 0.10 | % | 4,661,537 | Phoenix-Mesa-Scottsdale, AZ | 12 | ||
Desert Endoscopy Center | ASC | 610 E. Baseline Road | Tempe | AZ | 13,000 | 0.71 | % | $ | 250.0 | 0.76 | % | 4,661,537 | Phoenix-Mesa-Scottsdale, AZ | 12 | ||
Mountain View Surgery Center | ASC | 3131 West Peoria Avenue | Phoenix | AZ | 13,835 | 0.75 | % | $ | 306.4 | 0.93 | % | 4,661,537 | Phoenix-Mesa-Scottsdale, AZ | 12 | ||
Associated Surgical Center of Dearborn | ASC | 24420 Ford Road | Dearborn Heights | MI | 12,400 | 0.68 | % | $ | 348.9 | 1.06 | % | 4,297,617 | Detroit-Warren-Dearborn, MI | 14 | ||
Berry Surgical Center | ASC | 28500 Orchard Lake Road | Farmington Hills | MI | 27,217 | 1.48 | % | $ | 627.1 | 1.90 | % | 4,297,617 | Detroit-Warren-Dearborn, MI | 14 | ||
Bay Area Physicians Surgery Center | ASC | 6043 Winthrop Commerce Avenue | Riverview | FL | 18,708 | 1.02 | % | $ | 624.8 | 1.89 | % | 3,032,171 | Tampa-St. Petersburg-Clearwater, FL | 18 | ||
Liberty Dialysis | SC | 4352 Trail Boss Drive | Castle Rock | CO | 8,450 | 0.46 | % | $ | 310.5 | 0.94 | % | 2,853,077 | Denver-Aurora-Lakewood, CO | 19 | ||
Bassin Center For Plastic Surgery-Orlando | PC | 422 Alafaya Trail #32 | Orlando | FL | 2,420 | 0.13 | % | $ | 127.2 | 0.39 | % | 2,441,257 | Orlando-Kissimmee-Sanford, FL | 23 | ||
Bassin Center For Plastic-Surgery-Villages | PC | 8575 NE 138th Lane Suites 103-104 | Lady Lake | FL | 2,894 | 0.16 | % | $ | 152.2 | 0.46 | % | 2,441,257 | Orlando-Kissimmee-Sanford, FL | 23 | ||
Medical Village at Wintergarden | MOB | 1210 E. Plant Street | Winter Garden | FL | 21,648 | 1.18 | % | $ | 463.2 | 1.40 | % | 2,441,257 | Orlando-Kissimmee-Sanford, FL | 23 | ||
Assurance Health System | BF | 11690 Grooms Road | Cincinnati | OH | 14,381 | 0.78 | % | $ | 485.7 | 1.47 | % | 2,165,139 | Cincinnati, OH-KY-IN | 28 | ||
Cavalier Medical & Dialysis Center | MOB | 47 & 51 Cavalier Blvd | Florence | KY | 36,362 | 1.98 | % | $ | 389.3 | 1.18 | % | 2,165,139 | Cincinnati, OH-KY-IN | 28 | ||
Fresenius Florence Dialysis Center | SC | 7205 Dixie Hwy | Florence | KY | 18,283 | 1.00 | % | $ | 267.4 | 0.81 | % | 2,165,139 | Cincinnati, OH-KY-IN | 28 | ||
Vascular Access Centers of Southern Nevada | PC | 3150 West Charleston | Las Vegas | NV | 4,800 | 0.26 | % | $ | 224.8 | 0.68 | % | 2,155,664 | Las Vegas-Henderson-Paradise, NV | 29 | ||
Prairie Star Medical Facility I | PC | 6815 Hilltop Road | Shawnee | KS | 24,557 | 1.34 | % | $ | 460.4 | 1.39 | % | 2,104,509 | Kansas City, MO-KS | 30 | ||
Prairie Star Medical Facility II | MOB | 6850 Hilltop Road | Shawnee | KS | 24,840 | 1.36 | % | $ | 453.2 | 1.37 | % | 2,104,509 | Kansas City, MO-KS | 30 | ||
Brook Park Medical Building | MOB | 15900 Snow Road | Brook Park | OH | 18,444 | 1.01 | % | $ | 353.4 | 1.07 | % | 2,055,612 | Cleveland-Elyria, OH | 32 | ||
Rockside Medical Center | MOB | 6701 Rockside Road | Independence | OH | 53,921 | 2.94 | % | $ | 1,334.2 | 4.04 | % | 2,055,612 | Cleveland-Elyria, OH | 32 | ||
Court Street Surgery Center | ASC | 125 South Court Street | Circleville | OH | 7,787 | 0.42 | % | $ | 7.8 | 0.02 | % | 2,041,520 | Columbus, OH | 33 | ||
Assurance Health, LLC | BF | 2725 Enterprise Drive | Anderson | IN | 10,200 | 0.56 | % | $ | 326.1 | 0.99 | % | 2,004,230 | Indianapolis-Carmel-Anderson, IN | 34 | ||
Kindred Hospital Indianapolis North | LTAC | Suite 2000 Box 82064, One American Square | Indianapolis | IN | 37,270 | 2.03 | % | $ | 1,351.4 | 4.09 | % | 2,004,230 | Indianapolis-Carmel-Anderson, IN | 34 | ||
Virgina Orthopaedic & Spine Specialists | PC | 3300 High Street | Portsmouth | VA | 8,445 | 0.46 | % | $ | 168.9 | 0.51 | % | 1,726,907 | Virginia Beach-Norfolk-Newport News, VA-NC | 37 | ||
Memphis Spine and Rehab Center | PC | 11221 Latting Road | Eads | TN | 11,669 | 0.64 | % | $ | 240.0 | 0.73 | % | 1,342,842 | Memphis, TN-MS-AR | 42 | ||
Sterling Medical Center | MOB | 200 Sterling Drive | Orchard Park | NY | 28,702 | 1.57 | % | $ | 459.1 | 1.39 | % | 1,132,804 | Buffalo-Cheektowaga-Niagara Falls, NY | 50 | ||
(CONTINUED) | ||||||||||||||||
Community Healthcare Trust / 3Q 2017 Supplemental Information | Page 7 | |
Property Name | Property Type | Address | City | State | Area | % of Square Feet | Annualized Revenue (1) | % of Annualized Revenue | Population | MSA/MISA | Rank | |||||
($ 000's) | ||||||||||||||||
Los Alamos Professional Plaza | MOB | 427 E. Duranta Avenue | Alamo | TX | 41,797 | 2.28 | % | $ | 512.7 | 1.55 | % | 849,843 | McAllen-Edinburg-Mission, TX | 66 | ||
Columbia Gastroenterology Surgery Center | ASC | 2739 Laurel Street | Columbia | SC | 16,969 | 0.93 | % | $ | 325.5 | 0.99 | % | 817,488 | Columbia, SC | 71 | ||
UH Walden Health Center | PC | 1119 Aurora Hudson Road | Aurora | OH | 11,000 | 0.60 | % | $ | 305.2 | 0.92 | % | 702,221 | Akron, OH | 80 | ||
Parkway Professional Plaza | MOB | 4725 US Hwy 98 S | Lakeland | FL | 40,000 | 2.18 | % | $ | 673.0 | 2.04 | % | 666,149 | Lakeland-Winter Haven, FL | 82 | ||
UW Health Clinic- Portage | PC | 2977 County Highway CX | Portage | WI | 14,000 | 0.76 | % | $ | 301.9 | 0.91 | % | 648,929 | Madison, WI | 86 | ||
Cypress Medical Center | MOB | 9300 E. 29th Street North | Wichita | KS | 43,945 | 2.40 | % | $ | 778.3 | 2.36 | % | 644,672 | Wichita, KS | 87 | ||
Family Medicine East | PC | 1709 S. Rock Road | Wichita | KS | 16,581 | 0.90 | % | $ | 410.8 | 1.24 | % | 644,672 | Wichita, KS | 87 | ||
Grene Vision Center | PC | 655 N. Woodlawn Blvd | Wichita | KS | 11,891 | 0.65 | % | $ | 281.5 | 0.85 | % | 644,672 | Wichita, KS | 87 | ||
Medical Village at Debary | MOB | 110 Pond Court | Debary | FL | 24,000 | 1.31 | % | $ | 608.1 | 1.84 | % | 637,674 | Deltona-Daytona Beach-Ormond Beach, FL | 88 | ||
Perrysburg Medical Arts Building | MOB | 1103 Village Square Drive | Perrysburg | OH | 24,134 | 1.32 | % | $ | 381.8 | 1.16 | % | 605,221 | Toledo, OH | 91 | ||
St. Vincent Mercy Medical Center, Inc. | MOB | 3930 Sunforest Court | Toledo | OH | 23,368 | 1.27 | % | $ | 301.4 | 0.91 | % | 605,221 | Toledo, OH | 91 | ||
Bassin Center For Plastic Surgery-Melbourne | PC | 1705 Berglund Lane | Viera | FL | 5,228 | 0.29 | % | $ | 274.9 | 0.83 | % | 579,130 | Palm Bay-Melbourne-Titusville, FL | 95 | ||
Eynon Surgery Center | ASC | 681 Scranton Carbondale Hwy | Eynon | PA | 6,500 | 0.35 | % | $ | 159.6 | 0.48 | % | 555,225 | Scranton--Wilkes-Barre--Hazleton, PA | 99 | ||
Grandview Plaza | PC | 802 New Holland Avenue | Lancaster | PA | 20,000 | 1.09 | % | $ | 96.7 | 0.29 | % | 538,500 | Lancaster, PA | 103 | ||
AMG Specialty Hospital - Lafayette | LTAC | 310 Youngville Highway | Lafayette | LA | 29,890 | 1.63 | % | $ | — | — | % | 491,528 | Lafayette, LA | 108 | ||
Treasure Coast Medical Pavilion | MOB | 3498 NW Federal Hwy #C | Jensen Beach | FL | 56,457 | 3.08 | % | $ | 655.7 | 1.99 | % | 465,208 | Port St. Lucie, FL | 111 | ||
Affinity Health Center | MOB | 4455 Dressler Road NW | Canton | OH | 47,366 | 2.58 | % | $ | 701.3 | 2.12 | % | 401,281 | Canton-Massillon, OH | 134 | ||
Bristol Pediatric Associates | MOB | 320 Steeles Road | Bristol | TN | 10,975 | 0.60 | % | $ | 224.8 | 0.68 | % | 306,334 | Kingsport-Bristol-Bristol, TN-VA | 162 | ||
Wellmont Bristol Urgent Care | SC | 1220 Volunteer Parkway | Bristol | TN | 4,548 | 0.25 | % | $ | 65.9 | 0.20 | % | 306,334 | Kingsport-Bristol-Bristol, TN-VA | 162 | ||
Londonderry Centre | MOB | 7030 New Sanger Avenue | Waco | TX | 19,495 | 1.06 | % | $ | 373.3 | 1.13 | % | 265,207 | Waco, TX | 181 | ||
Meridian Behavioral Health Systems | BF | 300 56th SW | Charleston | WV | 135,137 | 7.37 | % | $ | 2,437.5 | 7.38 | % | 217,916 | Charleston, WV | 200 | ||
Gulf Coast Cancer Centers- Gulf Shores | SC | 253 Professional Lane | Gulf Shores | AL | 6,398 | 0.35 | % | $ | 202.6 | 0.61 | % | 208,563 | Daphne-Fairhope-Foley, AL | 213 | ||
Gulf Coast Cancer Centers-Foley | SC | 1703 North Bunner Street | Foley | AL | 6,146 | 0.34 | % | $ | 194.6 | 0.59 | % | 208,563 | Daphne-Fairhope-Foley, AL | 213 | ||
Fresenius Ft. Valley | SC | 135 Avera Drive | Fort Valley | GA | 4,920 | 0.27 | % | $ | 120.3 | 0.36 | % | 190,028 | Warner Robins, GA | 227 | ||
Monroe Surgical Hosptial | ASC | 2408 Broadmoor Blvd | Monroe | LA | 58,121 | 3.17 | % | $ | 2,070.0 | 6.27 | % | 179,470 | Monroe, LA | 235 | ||
ImmunoTek Bio Center | SC | 505 East Webb Avenue | Burlington | NC | 12,870 | 0.70 | % | $ | 272.1 | 0.82 | % | 159,688 | Burlington, NC | 261 | ||
Provena Medical Center | MOB | 600-680 N. Convent Street | Bourbonnais | IL | 54,000 | 2.95 | % | $ | 876.8 | 2.65 | % | 110,008 | Kankakee, IL | 357 | ||
Fresenius Gallipolis Dialysis Center | SC | 137 Pine Street | Gallipolis | OH | 15,110 | 0.82 | % | $ | 134.8 | 0.41 | % | 56,840 | Point Pleasant, WV-OH | 546 | ||
Davita Etowah Dialysis Center | SC | 109 Grady Road | Etowah | TN | 4,720 | 0.26 | % | $ | 67.4 | 0.20 | % | 52,850 | Athens, TN | 573 | ||
Fresenius Dialysis Center | SC | 1321 W. 2nd Avenue | Corsicana | TX | 17,699 | 0.97 | % | $ | 132.0 | 0.40 | % | 48,523 | Corsicana, TX | 605 | ||
Arkansas Valley Surgery Center | ASC | 933 Sell Avenue | Canon City | CO | 10,165 | 0.55 | % | $ | 262.1 | 0.79 | % | 47.446 | Cañon City, CO | 616 | ||
Ottumwa Medical Clinic | MOB | 1005 Pennsylvania Avenue | Ottumwa | IA | 69,739 | 3.80 | % | $ | 1,368.8 | 4.14 | % | 43.842 | Ottumwa, IA | 657 | ||
Davita Dialysis | SC | 330 Lola Lane | Pahrump | NV | 12,545 | 0.68 | % | $ | 411.0 | 1.24 | % | 43.423 | Pahrump, NV | 659 | ||
Amory Regional Medical Center | MOB | 1107 Earl Frye Blvd | Amory | MS | 17,629 | 0.96 | % | $ | 82.5 | 0.25 | % | City: 7,067; County: 35,873 | RURAL - NO CBSA | N/A | ||
Amory Regional Medical Center | MOB | 1111 Earl Frye Blvd, | Amory | MS | 27,743 | 1.51 | % | $ | 129.8 | 0.39 | % | City: 7,067; County: 35,873 | RURAL - NO CBSA | N/A | ||
(CONTINUED) | ||||||||||||||||
Community Healthcare Trust / 3Q 2017 Supplemental Information | Page 8 | |
Property Name | Property Type | Address | City | State | Area | % of Square Feet | Annualized Revenue (1) | % of Annualized Revenue | Population | MSA/MISA | Rank | |||||
($ 000's) | ||||||||||||||||
Amory Regional Medical Center | MOB | 1127 Earl Frye Blvd | Amory | MS | 18,074 | 0.99 | % | $ | 84.5 | 0.26 | % | City: 7,067; County: 35,873 | RURAL - NO CBSA | N/A | ||
Amory Regional Medical Center | MOB | 404 Gilmore Drive | Amory | MS | 9,890 | 0.54 | % | $ | 46.3 | 0.14 | % | City: 7,067; County: 35,873 | RURAL - NO CBSA | N/A | ||
Amory Regional Medical Center | MOB | 305 Highway 45N | Aberdeen | MS | 3,378 | 0.18 | % | $ | 15.8 | 0.05 | % | City: 5,391; County: 35,873 | RURAL - NO CBSA | N/A | ||
Batesville Regional Medical Center | MOB | 205 Medical Center Dr | Batesville | MS | 9,263 | 0.51 | % | $ | 43.3 | 0.13 | % | City: 7,391; County: 34,164 | RURAL - NO CBSA | N/A | ||
Dahlonega Medical Mall | MOB | 134 Ansley Drive | Dahlonega | GA | 20,981 | 1.14 | % | $ | 211.8 | 0.64 | % | City: 6,437; County: 31,445 | RURAL - NO CBSA | N/A | ||
Gulf Coast Cancer Centers-Brewton | SC | 1207 Azalea Place | Brewton | AL | 3,971 | 0.22 | % | $ | 125.8 | 0.38 | % | City: 5,432; County: 37,728 | RURAL - NO CBSA | N/A | ||
Haleyville Physicians Professional Building | MOB | 42030 Hwy 195 East | Haleyville | AL | 29,515 | 1.61 | % | $ | 142.0 | 0.43 | % | City: 4,074; County: 23,805 | RURAL - NO CBSA | N/A | ||
Rettig Family Healthcare | PC | 204 W Trinity Street | Groesbeck | TX | 12,000 | 0.65 | % | $ | 180.0 | 0.54 | % | City: 4,321; County: 23,468 | RURAL - NO CBSA | N/A | ||
Russellville Medical Plaza | MOB | 15155 Hwy 43 NE | Russellville | AL | 29,129 | 1.59 | % | $ | 140.1 | 0.42 | % | City: 9,815; County: 31,628 | RURAL - NO CBSA | N/A | ||
Sanderling Dialysis Center | SC | 102 Crestview Drive | Holdenville | OK | 5,217 | 0.28 | % | $ | 237.5 | 0.72 | % | City: 5,680; County: 13,566 | RURAL - NO CBSA | N/A | ||
Wellmont Assoicates Complex | MOB | 338 Coeburn Avenue | Norton | VA | 37,000 | 2.02 | % | $ | 473.3 | 1.43 | % | City: 3,864; County: 39,228 | RURAL - NO CBSA | N/A | ||
Wellmont Lebanon Urgent Care | SC | 344 Overlook Drive | Lebanon | VA | 8,369 | 0.46 | % | $ | 97.7 | 0.30 | % | City: 3,285; County: 27370 | RURAL - NO CBSA | N/A | ||
Wellmont Norton Urgent Care | SC | 1014 Park Avenue | Norton | VA | 5,000 | 0.27 | % | $ | 57.5 | 0.17 | % | City: 3,864; County: 39,228 | RURAL - NO CBSA | N/A | ||
Winfield Medical Office Buildings | PC | 191 Carraway Dr | Winfield | AL | 60,592 | 3.31 | % | $ | 291.5 | 0.88 | % | City: 4,531; County: 29,998 | RURAL - NO CBSA | N/A | ||
(1) Annualized revenue for leases was calculated by multiplying base rent for the month of September 2017 by 12 and for the mortgage was calculated based on the principal outstanding at September 30, 2017 in accordance with the mortgage note. | ||||||||||||||||
(2) Mortgage investment. | ||||||||||||||||
Community Healthcare Trust / 3Q 2017 Supplemental Information | Page 9 | |
INVESTMENT ACTIVITY
(dollars in thousands)
2017 INVESTMENT ACTIVITY | ||||||||||
Location | Property Type | Acquisition/ Closing Date | Purchase Price | Square Feet | Aggregate Leased % at Acquisition | |||||
Property Acquisitions: | ||||||||||
Perrysburg, OH | MOB | 2/1/2017 | $ | 3,969 | 27,672 | 100.0 | % | |||
Cherry Hill, NJ | MOB | 2/2/2017 | 3,900 | 24,636 | 88.2 | % | ||||
Las Vegas, NV | PC | 3/30/2017 | 1,973 | 4,800 | 100.0 | % | ||||
Pahrump, NV | SC | 3/30/2017 | 4,635 | 12,545 | 100.0 | % | ||||
Cincinnati, OH | BF | 3/31/2017 | 4,625 | 14,381 | 100.0 | % | ||||
Bristol, TN | SC | 3/31/2017 | 675 | 4,548 | 100.0 | % | ||||
Lebanon, VA | SC | 3/31/2017 | 860 | 8,369 | 100.0 | % | ||||
Norton, VA | SC | 3/31/2017 | 589 | 5,000 | 100.0 | % | ||||
Norton, VA | MOB | 3/31/2017 | 4,991 | 32,351 | 87.4 | % | ||||
Bristol, TN | MOB | 3/31/2017 | 2,301 | 10,975 | 100.0 | % | ||||
Amory, MS | MOB | 5/1/2017 | 835 | 17,629 | 100.0 | % | ||||
Amory, MS | MOB | 5/1/2017 | 1,315 | 27,743 | 100.0 | % | ||||
Amory, MS | MOB | 5/1/2017 | 857 | 18,074 | 100.0 | % | ||||
Amory, MS | MOB | 5/1/2017 | 469 | 9,890 | 100.0 | % | ||||
Aberdeen, MS | MOB | 5/1/2017 | 160 | 3,378 | 100.0 | % | ||||
Batesville, MS | MOB | 5/1/2017 | 439 | 9,263 | 100.0 | % | ||||
Canton, OH | MOB | 5/11/2017 | 5,000 | 47,366 | 100.0 | % | ||||
Orland Park, IL | MOB | 6/14/2017 | 5,000 | 13,565 | 100.0 | % | ||||
Indianapolis, IN | SCH | 6/23/2017 | 14,900 | 37,270 | 100.0 | % | ||||
Riverview, FL | MOB | 6/28/2017 | 7,200 | 18,708 | 100.0 | % | ||||
Lincolnwood, IL | MOB | 9/21/2017 | 3,315 | 14,863 | 100.0 | % | ||||
Charleston, WV (1) | BF | 9/27/2017 | 25,000 | 132,430 | 100.0 | % | ||||
Total / Weighted Average | $ | 93,008 | 495,456 | 98.6 | % | |||||
(1) In addition, the Company entered into a $5.0 million mezzanine loan with the tenant. | ||||||||||
Community Healthcare Trust / 3Q 2017 Supplemental Information | Page 10 | |
LEASING INFORMATION
LEASE EXPIRATION SCHEDULE (1)
Total Leased Square Footage | Annualized Lease Revenue | |||||||||||
Year | Number of Leases Expiring | Amount ($) | Percent (%) | Amount ($) (in thousands) | Percent (%) | |||||||
Q4 2017 | 8 | $ | 56,092 | 3.4 | % | $ | 1,474,780 | 4.4 | % | |||
2018 | 34 | 169,529 | 10.2 | % | 3,644,490 | 10.9 | % | |||||
2019 | 29 | 141,200 | 8.5 | % | 3,269,142 | 9.8 | % | |||||
2020 | 37 | 196,021 | 11.8 | % | 3,631,325 | 10.9 | % | |||||
2021 | 15 | 144,311 | 8.7 | % | 2,848,408 | 8.5 | % | |||||
2022 | 27 | 165,814 | 10.0 | % | 3,390,192 | 10.2 | % | |||||
2023 | 12 | 68,055 | 4.1 | % | 1,437,463 | 4.3 | % | |||||
2024 | 4 | 18,513 | 1.1 | % | 465,511 | 1.4 | % | |||||
2025 | 6 | 29,234 | 1.8 | % | 718,651 | 2.2 | % | |||||
2026 | 4 | 98,911 | 5.9 | % | 2,343,129 | 7.0 | % | |||||
Thereafter | 26 | 563,849 | 34.0 | % | 9,987,216 | 29.9 | % | |||||
Month-to-Month | 6 | 8,302 | 0.5 | % | 152,552 | 0.5 | % | |||||
Totals | 208 | $ | 1,659,831 | 100.0 | % | $ | 33,362,859 | 100.0 | % | |||
(1) Total portfolio was approximately 92.1% leased in the aggregate at September 30, 2017 with lease expirations ranging from 2017 through 2033.
Community Healthcare Trust / 3Q 2017 Supplemental Information | Page 11 | |
PROPERTY DIVERSIFICATION
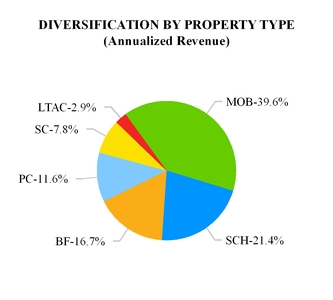
Property Type (1) | Number of Properties | Annualized Revenue (1) ($ in thousands) | Annualized Revenue (%) | |||
Medical Office Building (MOB) | 31 | $ | 13,722 | 39.6 | % | |
Surgical Centers and Hospitals (SCH) | 13 | 7,424 | 21.4 | % | ||
Behavioral Facilities (BF) | 4 | 5,787 | 16.7 | % | ||
Physician Clinics (PC) | 16 | 4,000 | 11.6 | % | ||
Specialty Centers (SC) | 15 | 2,697 | 7.8 | % | ||
Long-term Acute Care Center (LTAC) (2) | 1 | 1,006 | 2.9 | % | ||
Total | 80 | $ | 34,636 | 100.0 | % | |
______________________ | ||||||
(1) Annualized revenue for leases was calculated by multiplying base rent for the month of September 2017 by 12 and for the mortgage was calculated based on the principal outstanding at September 30, 2017 in accordance with the mortgage note. | ||||||
(2) Mortgage investment. | ||||||
Community Healthcare Trust / 3Q 2017 Supplemental Information | Page 12 | |
PROPERTY DIVERSIFICATION
(continued)
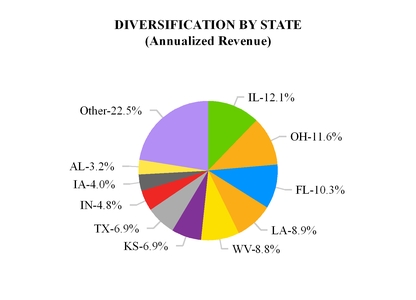
State | Number of Properties | Annualized Revenue (1) ($ in thousands) | Annualized Revenue (%) | |||
Illinois | 5 | $ | 4,192 | 12.1 | % | |
Ohio | 9 | 4,006 | 11.6 | % | ||
Florida | 8 | 3,579 | 10.3 | % | ||
Louisiana (2) | 2 | 3,076 | 8.9 | % | ||
West Virginia | 1 | 3,037 | 8.8 | % | ||
Kansas | 5 | 2,384 | 6.9 | % | ||
Texas | 6 | 2,374 | 6.9 | % | ||
Indiana | 2 | 1,679 | 4.8 | % | ||
Iowa | 1 | 1,369 | 4.0 | % | ||
Alabama | 6 | 1,097 | 3.2 | % | ||
Other (Less than 3%) | 35 | 7,843 | 22.5 | % | ||
Total | 80 | $ | 34,636 | 100.0 | % | |
_________________ | ||||||
(1) Annualized revenue for leases was calculated by multiplying base rent for the month of September 2017 by 12 and for the mortgage was calculated based on the principal outstanding at September 30, 2017 in accordance with the mortgage note. | ||||||
(2) Includes one mortgage investment. | ||||||
Community Healthcare Trust / 3Q 2017 Supplemental Information | Page 13 | |
PROPERTY DIVERSIFICATION
(continued)
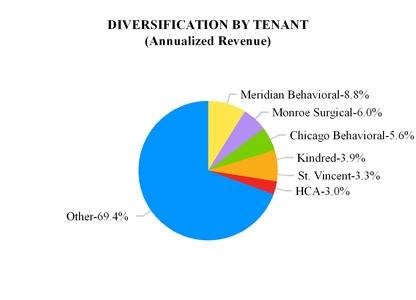
Tenant | Annualized Revenue (1) ($ in thousands) | Annualized Revenue (%) | |||
Meridian Behavioral Health System | $ | 3,038 | 8.8 | % | |
Vantage Health Plan, Inc. (Monroe Surgical) | 2,070 | 6.0 | % | ||
2014 Health, LLC (Chicago Behavioral) | 1,938 | 5.6 | % | ||
KND Development 67, LLC (Kindred) | 1,352 | 3.9 | % | ||
St. Vincent Medical Group | 1,158 | 3.3 | % | ||
HCA | 1,048 | 3.0 | % | ||
Others (Less than 3%) | 24,032 | 69.4 | % | ||
Total | $ | 34,636 | 100.0 | % | |
(1) Annualized revenue for leases was calculated by multiplying base rent for the month of September 2017 by 12 and for the mortgage was calculated based on the principal outstanding at September 30, 2017 in accordance with the mortgage note. | |||||
Community Healthcare Trust / 3Q 2017 Supplemental Information | Page 14 | |