Attached files
| file | filename |
|---|---|
| 8-K - 8-K - CHART INDUSTRIES INC | gtls-2017117x8kinvestorpre.htm |

© 2017 Chart Industries, Inc. Confidential and Proprietary
Chart Industries, Inc.
Investor Presentation
Exhibit 99.1

© 2017 Chart Industries, Inc. Confidential and Proprietary 2
Disclosure
Forward-Looking Statements: This presentation contains forward-looking statements within the meaning
of the Private Securities Litigation Reform Act of 1995. These statements are based on the current beliefs
and expectations of management of Chart Industries, Inc. (“Chart”) and are subject to significant risks
and uncertainties. Actual results may differ from those set forth in the forward-looking statements. Factors
that could cause Chart’s actual results to differ materially from those described in the forward-looking
statements include those found in Chart’s Annual Report on Form 10-K for the year ended December 31,
2016, which has been filed with the Securities and Exchange Commission and is available on Chart’s
website (http://www.snl.com/IRW/CorporateProfile/4295886) and on the Securities and Exchange
Commission’s website (www.sec.gov), as well as risks and uncertainties related to the integration of
Hudson’s business with Chart’s. Chart does not undertake to update the forward-looking statements to
reflect the impact of circumstances or events that may arise after the date of the forward-looking
statements.

© 2017 Chart Industries, Inc. Confidential and Proprietary 3
Company Overview
Healthcare
Chart is a leading diversified global manufacturer of highly-engineered equipment, packaged
solutions and value-add services for the energy, industrial gas and biomedical industries
Technology leader providing premium equipment to energy and industrial liquid gas
supply chain end markets
A leading supplier in all primary markets served
Global footprint for our operations on four continents with approximately 4,000
employees
Balanced expansion in the US and International markets
FY 2016 Sales by Segment
BioMed
24%
Energy &
Chemicals
18%
Distribution &
Storage
58%
FY 2016 Sales by Segment Pro Forma Hudson*
BioMed
20%
Energy, &
Chemicals
32%
Distribution &
Storage
48%
* Assumes Hudson Acquisition occurred as of 1 January 2016

© 2017 Chart Industries, Inc. Confidential and Proprietary 4
Supplier of Brazed Aluminum
Heat Exchangers (BAHX), Air
Cooled Heat Exchangers
(ACHX) and Cold Boxes
Provider of integrated
systems and aftermarket
services for gas processing,
LNG and petrochemical
applications
Technology leader
Complete portfolio of
cryogenic distribution and
storage equipment
Leading innovator in
cryogenic packaged gas and
MicroBulk systems
Over 20 years of experience
in LNG applications
Leading Supplier of Mission Critical Equipment
End-to-end provider of
respiratory therapy
equipment
Set the standard for storage
of biological materials at low
temperatures
Reliable, high quality
solutions for environmental
market applications
BioMed Distribution & Storage Energy & Chemicals
A B C

© 2017 Chart Industries, Inc. Confidential and Proprietary 5
18%
of Total Chart Sales
$123M
Backlog at 6/30/17
17%
Gross Margin
BioMed
Broad End-Market Exposure
Distribution & Storage Energy & Chemicals
Sales
b
y
Indust
ry
*
H
ig
h
li
g
h
ts
9%
34%
57%
5%
7%
7%
22%
59%
Healthcare
Life
Sciences
Environ-
mental
Manufacturing/
Fabrication
LNG
Food/
Beverage
Electronics
Healthcare
Natural Gas
Processing/
Petrochemical
7%
25%
68% Industrial
Gas
LNG
$80M $112M $251M
25%
of Total Chart Sales
$19M
Backlog at 6/30/17
35%
Gross Margin
57%
of Total Chart Sales
$225M
Backlog at 6/30/17
26%
Gross Margin
Sales
b
y
G
e
o
g
ra
p
h
y
*
51%
41%
53% 50%
34%
22%
21% 16%
17% 18%
17% 23%
8%
6%
10% 7% 6%
E&C BioMed D&S Total
$80M $112M $251M $442M
United States
Asia
Europe
Middle East
Rest of World
A B C
1H 2017
1H 2017 Highlights
1H 2017
* 1H 2017 as per SEC filings, not pro forma for subsequent acquisitions

© 2017 Chart Industries, Inc. Confidential and Proprietary 6
Adds highly-complementary Fans business
Strengthens aftermarket presence
Consistent with core strategy to enhance Air
Cooled Heat Exchanger (ACHX) business
Expected to be accretive to growth, margins and
EPS
Significant cost synergies
Efficient use of Chart’s strong balance sheet
position
Product Split*
OEM
63%
End Market Split* Aftermarket Split*
Aftermarket
37% Fans
38%
ACHEs
62%
Industrial /
Other /
HVAC
23%
Chemical
6%
LNG
22%
Power
10%
Oil & Gas
19%
Refining
20%
Key
Products
Chart Product Offerings
End Market Mix
Axial Flow Fans ACHEs Brazed Aluminum
Heat Exchangers
Integrated
Process
Systems
Natural Gas Industrial Gas LNG
Power HVAC Refining
Oil & Gas Petrochemical
Expands Industrial Gas Offerings
Maximizes LNG Opportunity
Hudson Transaction Broadens Offering
Denotes Chart
offering pre-
acquisition
* Hudson stand-alone

© 2017 Chart Industries, Inc. Confidential and Proprietary 7
26.5
29.3
2Q 2017 3Q 2017
$253
$258
2Q 2017 3Q 2017
3Q 2017 Update
Orders increased sequentially (versus prior quarter) in every segment in 1Q, 2Q and
Q3 2017
Backlog is $481M as of 9/30/2017, up from $367M as of 6/30/2017
Gross Margin was $70M (29.3% of revenue) in 3Q 2017 compared to $63M (26.5%
of revenue) in 2Q 2017
($USD Million)
$238
$241
2Q 2017 3Q 2017
Orders Sales
($USD Million)
Gross Margin
(% Sales)

© 2017 Chart Industries, Inc. Confidential and Proprietary 8
Profitable Growth Focus
Reduced global headcount by one-third since 2014
Continue facility consolidation efforts to create further operating
efficiencies and leverage support functions across the business
Focus on operational excellence and strategic goals for long-
term growth when market returns
Invest in additional capacity at our brazed aluminum heat
exchanger facility
Pursue acquisition targets in our core technologies and
adjacencies

© 2017 Chart Industries, Inc. Confidential and Proprietary 9
$125M
Cash at 9/30/2017***
$450M
Revolving Credit
Facility***
Well Positioned For Continued Growth
1.13x
Current Ratio*
Significant
Liquidity
Solid Balance
Sheet
43%
Debt / Capital %**
** Total Debt (ST + LT Debt) / Total Capital (Common Equity + Noncontrolling Interests + Total Debt) as of 6/30/2017
***After closing Hudson on 9/20/2017, cash balance was reduced by ~$120M and available revolver capacity reduced
to ~$150M
* Total Current Assets / Total Current Liabilities as of 9/30/2017

© 2017 Chart Industries, Inc. Confidential and Proprietary 10
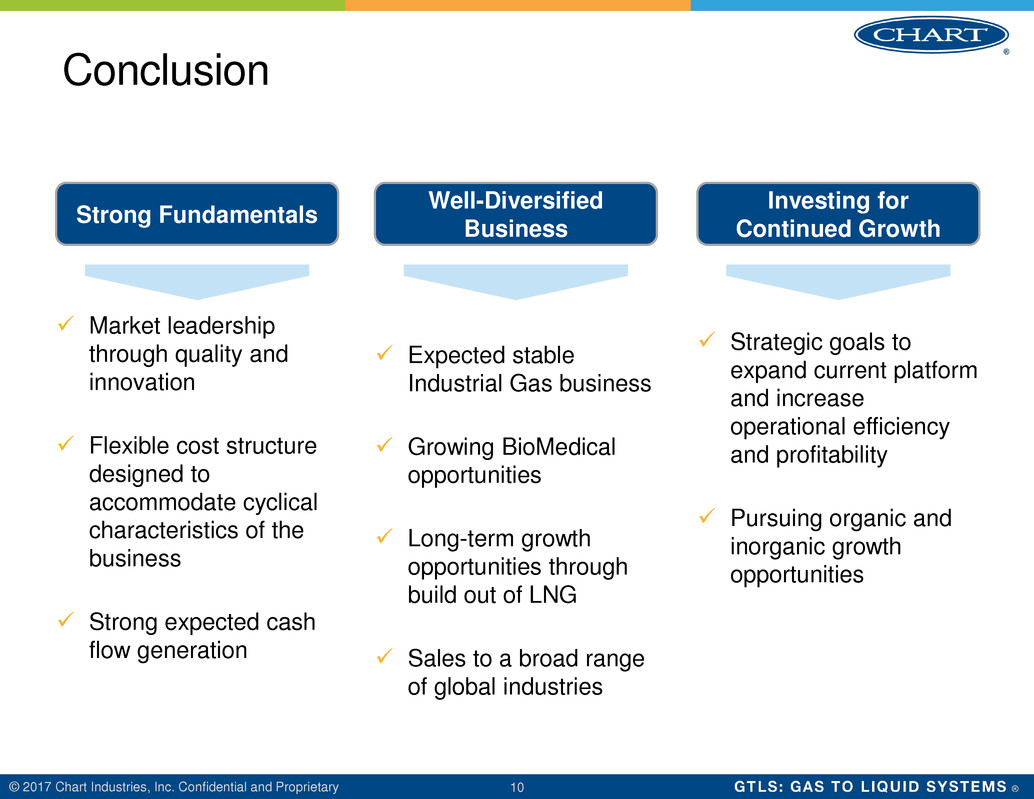
Conclusion
Expected stable
Industrial Gas business
Growing BioMedical
opportunities
Long-term growth
opportunities through
build out of LNG
Sales to a broad range
of global industries
Well-Diversified
Business
Strong Fundamentals
Investing for
Continued Growth
Strategic goals to
expand current platform
and increase
operational efficiency
and profitability
Pursuing organic and
inorganic growth
opportunities
Market leadership
through quality and
innovation
Flexible cost structure
designed to
accommodate cyclical
characteristics of the
business
Strong expected cash
flow generation

© 2017 Chart Industries, Inc. Confidential and Proprietary
www.ChartIndustries.com
11
