Attached files
| file | filename |
|---|---|
| EX-99.2 - EXHIBIT 99.2 - CARVANA CO. | a9928-kq32017.htm |
| 8-K - 8-K - CARVANA CO. | q3178-k.htm |
Exhibit 99.1
Carvana Co. Q3 2017 Shareholder Letter
Tempe, Arizona
November 7, 2017
Dear Shareholders,
We’re pleased to announce our third quarter 2017 results. In Q3, we continued to see meaningful year-over-year improvements across a number of key metrics, including gains in retail units sold (up 133%), total revenue (up 128%), and total gross profit per unit (“GPU”) to $1,742, up $395. Our sequential total GPU gains were driven in part by improvements in average days to sale, which decreased from 105 in Q2 to 97 days in Q3. This metric fell to 85 days in September, and we are currently targeting approximately 75 days in Q4. We also achieved several significant company milestones during Q3, as we launched a record nine markets and opened our first West Coast inspection and reconditioning center (“IRC”) in Phoenix, bringing the Carvana experience coast to coast.
Our 133% unit sale growth rate put us at the lower end of our guidance, which we attribute to the confluence of unique factors that occurred during the quarter, including two major hurricanes that struck the Southeastern United States and atypical seasonality. That said, we are proud of our total GPU gains this quarter, and as you’ll see in our Q4 guidance, we expect 2017 to be another year of tremendous growth and progress for Carvana, and we look forward to discussing our Q3 results and outlook with you on our conference call today.
Summary of Q3 Results
All financial comparisons stated below are versus Q3 2016, unless otherwise noted. Complete financial tables appear at the end of this letter.
• | Retail units sold totaled 11,719, an increase of 133% |
• | Revenue totaled $225.4 million, an increase of 128% |
• | Total gross profit was $20.4 million, an increase of 202% |
• | Total gross profit per unit was $1,742, an increase of $395 |
• | Net loss was $39.8 million, an increase of 81% |
• | EBITDA margin was (15.9%), an improvement from (20.3%) |
• | GAAP basic and diluted net loss per Class A share was $0.29 based on 15 million shares of Class A common stock outstanding |
• | Adjusted net loss per Class A share, a non-GAAP measure, was $0.29, based on 137 million adjusted shares of Class A common stock outstanding assuming the exchange of all outstanding LLC Units for shares of Class A common stock |
• | We opened a new West Coast IRC in Phoenix |
• | We opened nine new markets, bringing our end-of-quarter total to 39 |
Recent Events
We’ve already completed a few notable accomplishments in Q4, including:
• | We entered into agreements with Ally to fund $1.4 billion in future Carvana retail contracts, increasing their total funding commitment for our financing platform to approximately $2 billion. |
• | We entered into a master sale-leaseback agreement that provides for up to $75 million for our real estate assets, including existing and in-process vending machines on our balance sheet and future real estate or construction projects. |
• | We launched our seventh vending machine in Jacksonville, Florida. |
1
Q4 and 2017 Outlook
We anticipate strong unit and revenue growth to close out the year, as well as continued EBITDA margin improvement. We expect total GPU to decline sequentially in Q4 due to normal seasonal factors, including our annual Cyber Monday promotion, but to increase significantly year-over-year and resume growing in Q1 2018. Our updated guidance incorporates a forecasted reduction in retail average selling price, as we have recently seen an acceleration in sales of lower sticker price cars. We believe the increased demand for these vehicles is driven in part by an increase in the share of our customers who are millennials, which is now approximately 50%.
Our Q4 guidance is as follows:
• | Retail unit sales of 13,600 - 15,000, an increase of 143% - 168% year-over-year |
• | Total revenue of $257 million - $287 million, an increase of 140% - 168% year-over-year |
• | Total gross profit per unit of $1,500 - $1,650 |
• | EBITDA margin of (16.0%) - (14.0%) |
We are updating our FY 2017 guidance as follows:
• | Retail unit sales of 44,300 - 45,700, an increase of 136% - 144% year-over-year |
• | Revenue of $850 million - $880 million, an increase of 133% - 141% year-over-year |
• | Total gross profit per unit of $1,500 - $1,550, as compared to $1,023 in FY 2016 |
• | EBITDA margin of (17.0%) - (16.4%), reflecting our decision to more quickly open new markets during the year than our previous plan |
• | Raising our market opening guidance to 21 - 23, bringing our end-of-year total to 42 - 44, an increase over our prior guidance of 37 - 39 |
For more information regarding the non-GAAP financial measures discussed in this letter, please see the reconciliations of our non-GAAP measurements to their most directly comparable GAAP-based financial measurements included at the end of this letter. Guidance for EBITDA margin excludes depreciation and amortization expense and interest expense. We have not reconciled EBITDA guidance to GAAP net loss as a result of the uncertainty regarding, and the potential variability of, interest expense. Accordingly, a reconciliation of the non-GAAP financial measure guidance to the corresponding GAAP measure is not available without unreasonable effort. Depreciation and amortization expense, which is a component of the reconciliation between EBITDA and GAAP net loss, is expected to be between 1.0% and 1.5% of total revenues for both Q4 2017 and FY 2017.
Management Objectives
Our management team continues to believe that customer experience quality is the most important focal point to drive the long-term success of the business, and that by offering customers lower prices, wider selection, and simpler experiences, we can improve that customer experience quality over the traditional standard in automotive retail. To realize that long-term vision, we focus on three primary financial objectives: (1) Grow Retail Units and Revenue; (2) Increase Total Gross Profit Per Unit; and (3) Demonstrate Operating Leverage.
For more information on our business and objectives, please visit https://investors.carvana.com/events-and-presentations.
2
Objective #1: Grow Retail Units and Revenue
Q3 was another strong growth quarter, as retail units sold increased to 11,719, up 133% from 5,023 in the prior year period. Revenue in Q3 grew to $225.4 million, up 128% from $98.8 million in Q3 2016. We achieved triple-digit unit sale and revenue growth despite atypical seasonality. The variance to our expectations in the quarter came in August, while September was the best month in the quarter for the first time in our history, even after adjusting for hurricane effects.
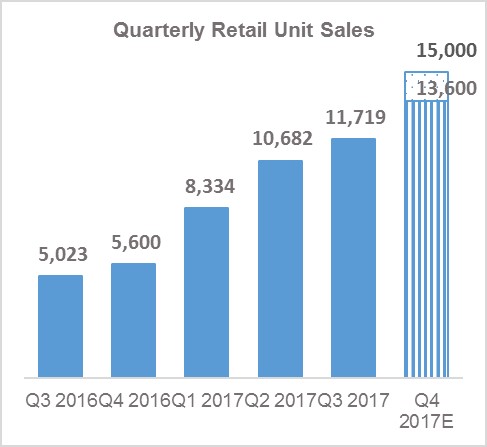
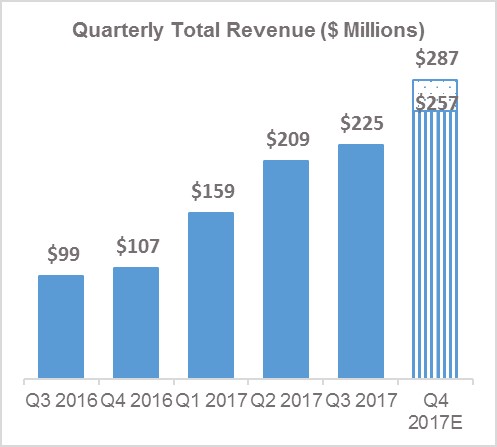
*Q4 2017E bars represent high and low end points of quarterly retail unit sales and quarterly total revenue guidance ranges.
Hurricanes Harvey and Irma
The hurricanes that struck the Southeastern United States in late August were devastating natural disasters. We consider the Texas and Florida communities affected by the hurricanes part of the Carvana family, and we tried to do our small part to help residents in affected areas by mobilizing our purchasing, reconditioning and logistics teams to quickly serve any customers needing to replace flood-damaged vehicles.
As it relates to Q3 sales, Harvey depressed expected sales in late August and early September, but the effect from replacing vehicles during the remainder of September resulted in a net sales increase in Texas. Irma negatively affected sales throughout the Southeast in September, as it shut down several key markets for multiple days, and sales levels in the affected areas returned to normal levels in the back half of the month, making Irma’s effect on sales negative.
3
Markets
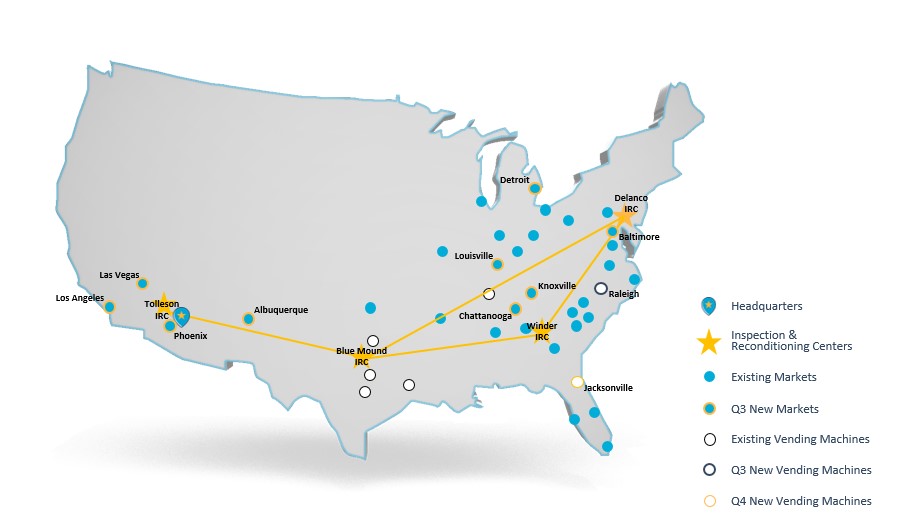
We launched a record nine new markets in the third quarter: Louisville, Detroit, Phoenix, Chattanooga, Knoxville, Baltimore, Los Angeles, Las Vegas and Albuquerque. This brought our total number of markets to 39 on September 30, 2017. This expansion increases the total percentage of the U.S. population our markets collectively serve to 38.1%, up from 19.7% at the end of 2016. Opening markets in Los Angeles and in our headquarters city of Phoenix were significant achievements for our business. Less than five years after establishing our first market in Atlanta, we’ve built a coast-to-coast production, logistics and fulfillment network using a nimble, capital-light expansion model that allows us to quickly and efficiently enter new markets.
4
In Q3, our Market Operations team pioneered its “hub-in-a-box” expansion approach, where everything we need to open our office and staging space in a market-from furniture, to operating procedure packets, to Carvana-branded customer merchandise-sits on a pallet in Phoenix and can be shipped to our new office location (the “hub”), allowing us to set up shop in a new city extremely quickly. These process improvements enable even faster market expansion, and we are increasing our guidance for number of market openings in FY 2017 to 21 - 23, up from 16 - 18.
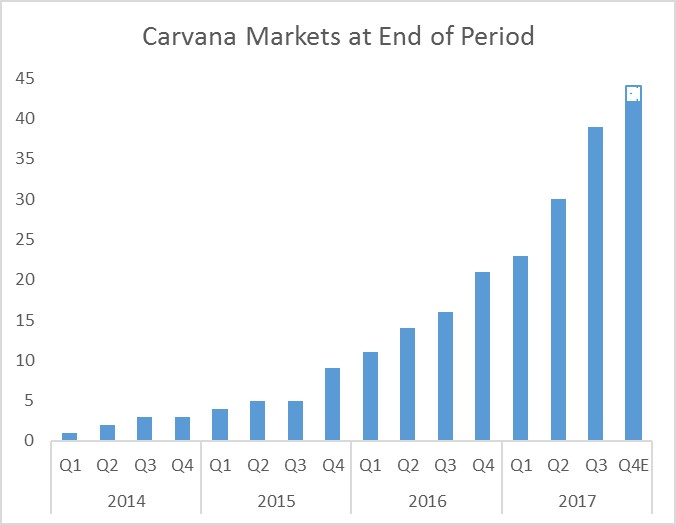
*Q4 2017E bar represents high and low end points of end-of-year total market guidance range.
Vending Machines
During Q3 we opened a Carvana car vending machine (“VM”) in Raleigh, North Carolina. In early October, we also opened a VM in Jacksonville, Florida, bringing our total number of VMs to seven. Similar to our Nashville, Houston, Austin, San Antonio and Dallas markets, our market penetration in these markets has markedly increased following the VM launch.
We continue to believe these proprietary VMs provide a significant ROI as an incremental investment in a market, and we expect our new sale-leaseback agreement of up to $75 million to allow us to more efficiently build them. As we discussed on our Q2 earnings call, we believe transactions like this demonstrate that VMs serve as attractive financeable assets and a source of liquidity for the business.

Raleigh left, Jacksonville right
5
Inspection and Reconditioning Centers
In Q3, we opened our fourth IRC in the Phoenix metro area. With this IRC we can efficiently service markets in the Southwest and on the West Coast. This is Carvana’s first self-built IRC and at full utilization will allow us to inspect and recondition an additional 50,000 cars per year, bringing our total annual production capacity at full utilization to approximately 200,000 units.


Production Line and Photo Booth at Carvana’s Phoenix-area IRC
Customer Trends
We continue to see positive trends in customers adopting our mobile technology, as more than 20% of our sales are now completed entirely on a mobile device. This is more pronounced with millennial customers, nearly 30% of whom purchase start-to-finish on mobile devices. Additionally, early data from our 2017 cohort of markets indicates that it is the fastest-growing cohort to date.
6
Objective #2: Increase Total Gross Profit Per Unit
Total GPU in Q3 2017 grew to $1,742 per unit, an increase of $241 over the previous quarter. This increase reflects continued execution of our plan, including reducing average days to sale and increasing the profitability of ancillary products. We expect a seasonal decline in total GPU in Q4, consistent with our historical experience based on several factors, including our annual Cyber Monday promotion and the $500 gift cards we distributed to hurricane-affected customers in early Q4, which combined will likely decrease total GPU by $180 to $220. Similar to previous years, we expect significant total GPU growth in the first quarter. For additional details on seasonal trends in our business, see our discussion beginning on page 8.
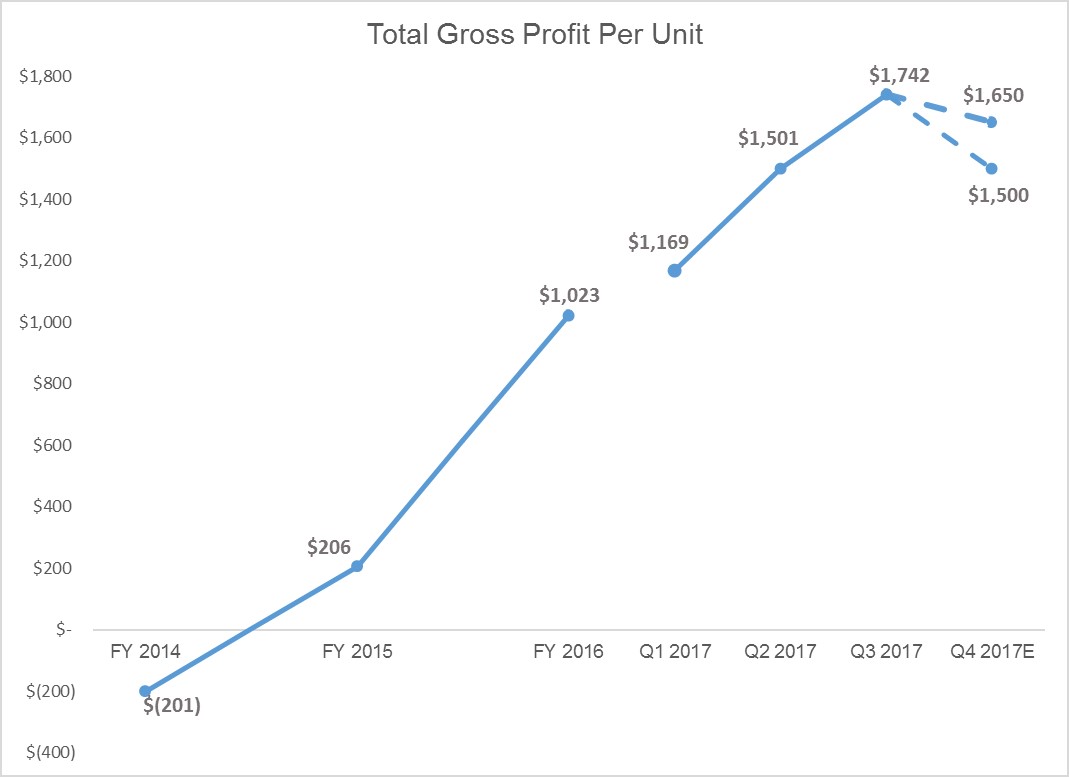
*Q4 2017E data points represent high and low end points of the guidance range.
Our 2017 guidance demonstrates solid progress toward our mid-term GPU goal of $3,000, and we’ve said that achieving that goal is a function of increasing scale and improving our technology and product offering. With respect to scale, in Q3 we reduced our average days to sale to 97 days, a significant improvement over Q2’s 105 days. In September, our average days to sale fell to 85. We continue to expect average days to sale to decline in future quarters and are now targeting approximately 75 days in Q4.
Regarding technology and product offering, following successful testing in Q2, we expanded our rollout of our GAP waiver coverage in Q3 and now widely offer this protection to our customers. We expect to continue increasing the penetration of this and other currently available ancillary products while also developing new value-add products for our customers.
7
Objective #3: Demonstrate Operating Leverage
In Q3, we accelerated our growth across the business and reached significant expansion milestones. Opening our West Coast IRC and a number of key West Coast markets were critical achievements to prepare the business for the seasonal tailwinds we expect to see in the first half of 2018.
Total SG&A as a percent of revenue was 26.0% in Q3, compared to 28.3% in Q3 2016. The third quarter was a significant investment quarter for us. In addition to typical investment that occurs in the third and fourth quarters to prepare for the significant growth expected in the first half of the year, we also set a company record for new market openings with nine, launched our fourth IRC, and expanded our logistics network from coast to coast.
Our net loss for the quarter was $39.8 million. GAAP basic and diluted net loss per Class A share was $0.29, based on 15.0 million shares of Class A common stock outstanding for purposes of computing net loss per share. Adjusted net loss per Class A share, a non-GAAP measure, was $0.29, based on 137.0 million adjusted shares of Class A common stock outstanding assuming the exchange of all outstanding LLC Units for shares of Class A common stock. A reconciliation of adjusted net loss per share to its most directly comparable GAAP measure is provided in the appendix.
As previously mentioned, we consider EBITDA margin to be an important measure of the leverage in our business. EBITDA margin in the third quarter of 2017 was (15.9%), a slight improvement from (16.1%) in Q2. We expect EBITDA margin to continue to improve in coming quarters as we continue to grow sales. A reconciliation of EBITDA, a non-GAAP measure, to net loss, its most directly comparable GAAP measure, is provided in the appendix.
Carvana 101 - Seasonality
In our first shareholder letter, we introduced the concept of Carvana 101 to take a deeper dive into areas of our business that we believe would be helpful to investors. This quarter, we’re providing important background information on used automotive retail seasonality. We intend to periodically add similar content to our shareholder letters to address recurring investor questions.
Used vehicle sales exhibit seasonality throughout the year that is quite different from other sectors. We’d like to walk you through how seasonality affects our unit sales, vehicle margin and SG&A investment.
Historically, we’ve experienced the highest sales growth during the first half of the year, which we believe relates to the timing of federal tax refunds that consumers tend to use for vehicle down payments. Relative to the rest of the year, we usually open fewer markets in Q1 than in other quarters, as our operations teams focus on the rapidly increasing retail demand. Used vehicle demand is typically lowest during the second half of the year after the elevated tax refund demand abates.
Vehicle margin typically mimics a similar seasonal curve as unit sales. Depreciation rates exhibit opposite seasonality as they are largely driven by the underlying demand of tax season. In Q1 and Q2, we typically see lower vehicle depreciation rates and therefore our vehicle margin has historically been higher in the first half of the year. Depreciation rates usually increase in the latter half of the year, meaning our vehicle margin during that time typically faces the same seasonal headwinds as unit sales. As turn times improve, we expect the volatility of deprecation due to seasonality to have a decreasing impact on total GPU.
Given the seasonality of unit sales, we focus our equipment purchases, recruiting, and staffing on the growth and demand we anticipate four to six months down the road. This means we typically invest more in SG&A in Q3 and Q4 as we prepare for the approaching Q1 sales lift, including expanding and strengthening our IRCs and our logistics network and hiring additional customer advocates. Conversely, in Q1 and Q2, our SG&A investments are typically lower as a percent of revenue, as we expect seasonal headwinds in the latter half of the year to slow our sequential growth relative to the first half of the year.
8
Summary
Carvana continued its rapid growth in Q3 and we expect to end 2017 with triple-digit growth in unit sales and revenue, progress toward our mid-term GPU target of $3,000, and a truly national footprint. The first two quarters of the year are important for used car sales, and we are poised to enter 2018 in a very strong position, with new markets ramping well, our reconditioning and logistics network prepared to support demand, and average days to sale expected to reach an all-time low in Q4. Carvana is the new way to buy a car, and we are extremely excited about what lies ahead for our customers, our company and our shareholders.
Sincerely,
Ernie Garcia, III, Chairman and CEO
Mark Jenkins, CFO
9
Appendix
Conference Call Details
Carvana will host a conference call today, Nov. 7, 2017, at 3 p.m. MST (2 p.m. PST, 5 p.m. EST) to discuss financial results. To participate in the live call, analysts and investors should dial (877) 270-2148 or (412) 902-6510. A live audio webcast of the conference call along with supplemental financial information will also be accessible on the company's website at investors.carvana.com. Following the webcast, an archived version will be available on the website for one year. A telephonic replay of the conference call will be available until Nov. 14, 2017, by dialing (877) 344-7529 or (412) 317-0088 and entering passcode 10112347#.
Forward Looking Statements
This letter contains forward-looking statements within the meaning of the Private Securities Litigation Reform Act of 1995. These forward-looking statements reflect Carvana’s current expectations and projections with respect to, among other things, its financial condition, results of operations, plans, objectives, future performance, and business. These statements may be preceded by, followed by or include the words "aim," "anticipate," "believe," "estimate," "expect," "forecast," "intend," "likely," "outlook," "plan," "potential," "project," "projection," "seek," "can," "could," "may," "should," "would," "will," the negatives thereof and other words and terms of similar meaning.
Forward-looking statements include all statements that are not historical facts. Such forward-looking statements are subject to various risks and uncertainties. Accordingly, there are or will be important factors that could cause actual outcomes or results to differ materially from those indicated in these statements. Among these factors are risks related to: (1) our history of losses and ability to maintain profitability in the future, (2) our ability to effectively manage our rapid growth, (3) our limited operating history, (4) the seasonal and other fluctuations in our quarterly operating results, (5) our relationship with DriveTime Automotive Group, Inc.,(6) our management’s accounting judgments and estimates, as well as changes to accounting policies, (7) our ability to compete in the highly competitive industry in which we participate, (8) the changes in prices of new and used vehicles, (9) our ability to acquire desirable inventory, (10) our ability to sell our inventory expeditiously, (11) our ability to sell and generate gains on the sale of automotive finance receivables, (12) our dependence on the sale of automotive finance receivables for a substantial portion of our gross profits, (13) our reliance on potentially fraudulent credit data for the automotive finance receivables we sell, (14) our ability to successfully market and brand our business; (15) our reliance on Internet searches to drive traffic to our website, (16) our ability to comply with the laws and regulations to which we are subject, (17) the changes in the laws and regulations to which we are subject, (18) our ability to comply with the Telephone Consumer Protection Act of 1991;(19) the evolution of regulation of the Internet and eCommerce, (20) our ability to maintain reputational integrity and enhance our brand, (21) our ability to grow complementary product and service offerings, (22) our ability to address the shift to mobile device technology by our customers, (23) risks related to the larger automotive ecosystem, (24) the geographic concentration where we provide services, (25) our ability to raise additional capital, (26) our ability to maintain adequate relationships with the third parties that finance our vehicle inventory purchases, (27) the representations we make in our finance receivables we sell, (28) our reliance on our proprietary credit scoring model in the forecasting of loss rates, (29) our reliance on internal and external logistics to transport our vehicle inventory, (30) the risks associated with the construction and operation of our inspection and reconditioning centers, fulfillment centers and vending machines, including our dependence on one supplier for construction and maintenance for our vending machines, (31) our ability to protect the personal information and other data that we collect, process and store, (32) disruptions in availability and functionality of our website, (33) our ability to protect our intellectual property, technology and confidential information, (34) our ability to defend against claims that our employees, consultants or advisors have wrongfully used or disclosed trade secrets or intellectual property, (35) our ability to defend against intellectual property disputes, (36) our ability to comply with the terms of open source licenses, (37) conditions affecting automotive manufacturers, including manufacturer recalls, (38) our reliance on third party technology to complete critical business functions, (39) our dependence on key personnel to operate our business, (40) the costs associated with becoming a public company, (41) the diversion of management’s attention and other disruptions associated with potential future acquisitions, (42) the legal proceedings to which we may be subject in the ordinary course of business, (43) potential errors in our retail installment contracts with our customers that could render them unenforceable and (44) risks relating to our corporate structure and tax receivable agreements.
There is no assurance that any forward-looking statements will materialize. You are cautioned not to place undue reliance on forward-looking statements, which reflect expectations only as of this date. Carvana does not undertake any obligation to publicly update or review any forward-looking statement, whether as a result of new information, future developments, or otherwise.
10
Use of Non-GAAP Financial Measures
As appropriate, we supplement our results of operations determined in accordance with U.S. generally accepted accounting principles (“GAAP”) with certain non-GAAP financial measurements that are used by management, and which we believe are useful to investors, as supplemental operational measurements to evaluate our financial performance. These measurements should not be considered in isolation or as a substitute for reported GAAP results because they may include or exclude certain items as compared to similar GAAP-based measurements, and such measurements may not be comparable to similarly-titled measurements reported by other companies. Rather, these measurements should be considered as an additional way of viewing aspects of our operations that provide a more complete understanding of our business. We strongly encourage investors to review our consolidated financial statements included in publicly filed reports in their entirety and not rely solely on any one, single financial measurement or communication.
Reconciliations of our non-GAAP measurements to their most directly comparable GAAP-based financial measurements are included at the end of this letter.
11
CARVANA CO. AND SUBSIDIARIES
CONDENSED CONSOLIDATED BALANCE SHEETS
(Unaudited)
(In thousands)
September 30, 2017 | December 31, 2016 | ||||||
ASSETS | |||||||
Current assets: | |||||||
Cash and cash equivalents | $ | 103,454 | $ | 39,184 | |||
Restricted cash | 11,755 | 10,266 | |||||
Accounts receivable, net | 11,639 | 5,692 | |||||
Finance receivables held for sale, net | 37,519 | 24,771 | |||||
Vehicle inventory | 192,242 | 185,506 | |||||
Other current assets | 9,598 | 9,822 | |||||
Total current assets | 366,207 | 275,241 | |||||
Property and equipment, net | 125,996 | 60,592 | |||||
Other assets | 2,969 | — | |||||
Total assets | $ | 495,172 | $ | 335,833 | |||
LIABILITIES, TEMPORARY EQUITY & STOCKHOLDERS' EQUITY / MEMBERS’ DEFICIT | |||||||
Current liabilities: | |||||||
Accounts payable and accrued liabilities | $ | 43,813 | $ | 28,164 | |||
Accounts payable due to related party | 2,142 | 1,884 | |||||
Floor plan facility | 195,083 | 165,313 | |||||
Current portion of long-term debt | 3,375 | 1,057 | |||||
Total current liabilities | 244,413 | 196,418 | |||||
Long-term debt, excluding current portion | 16,363 | 4,404 | |||||
Other liabilities | 6,920 | — | |||||
Total liabilities | 267,696 | 200,822 | |||||
Commitments and contingencies | |||||||
Temporary equity - Class C redeemable preferred units - 0 and 43,089 units authorized and outstanding as of September 30, 2017 and December 31, 2016, respectively | — | 250,972 | |||||
Stockholders' equity / members' deficit: | |||||||
Members' deficit | — | (115,961 | ) | ||||
Preferred stock, $.01 par value - 50,000 shares authorized, none issued and outstanding as of September 30, 2017 | — | — | |||||
Class A common stock, $0.001 par value - 500,000 shares authorized, 15,513 shares issued and outstanding as of September 30, 2017 | 16 | — | |||||
Class B common stock, $0.001 par value - 125,000 shares authorized, 117,236 shares issued and outstanding as of September 30, 2017 | 117 | — | |||||
Additional paid in capital | 35,447 | — | |||||
Accumulated deficit | (7,419 | ) | — | ||||
Total stockholders' equity / members' deficit attributable to Carvana Co. | 28,161 | (115,961 | ) | ||||
Non-controlling interests | 199,315 | — | |||||
Total stockholders' equity / members’ deficit | 227,476 | (115,961 | ) | ||||
Total liabilities, temporary equity & stockholders' equity / members’ deficit | $ | 495,172 | $ | 335,833 | |||
12
CARVANA CO. AND SUBSIDIARIES
CONDENSED CONSOLIDATED STATEMENTS OF OPERATIONS
(Unaudited)
(In thousands, except per share amounts)
Three Months Ended September 30, | Nine Months Ended September 30, | ||||||||||||||
2017 | 2016 | 2017 | 2016 | ||||||||||||
Sales and operating revenues: | |||||||||||||||
Used vehicle sales, net | $ | 208,113 | $ | 92,115 | $ | 550,442 | $ | 241,098 | |||||||
Wholesale vehicle sales | 7,459 | 2,870 | 21,003 | 6,904 | |||||||||||
Other sales and revenues, including $2,414, $0, $6,070 and $0, respectively, from related parties | 9,807 | 3,859 | 22,372 | 10,319 | |||||||||||
Net sales and operating revenues | 225,379 | 98,844 | 593,817 | 258,321 | |||||||||||
Cost of sales | 204,963 | 92,078 | 547,616 | 241,561 | |||||||||||
Gross profit | 20,416 | 6,766 | 46,201 | 16,760 | |||||||||||
Selling, general and administrative expenses | 58,676 | 27,995 | 156,595 | 71,971 | |||||||||||
Interest expense, including $0, $0, $1,382 and $0, respectively, to related parties | 838 | 725 | 5,404 | 2,231 | |||||||||||
Other expense (income), net | 671 | 31 | 1,280 | (24 | ) | ||||||||||
Net loss before income taxes | (39,769 | ) | (21,985 | ) | (117,078 | ) | (57,418 | ) | |||||||
Income tax provision | — | — | — | — | |||||||||||
Net loss | (39,769 | ) | (21,985 | ) | (117,078 | ) | (57,418 | ) | |||||||
Less: net loss attributable to non-controlling interests | (35,389 | ) | — | (59,717 | ) | — | |||||||||
Net loss attributable to Carvana Co. | $ | (4,380 | ) | $ | (21,985 | ) | $ | (57,361 | ) | $ | (57,418 | ) | |||
Net loss per share of Class A common stock, basic and diluted(1) | $ | (0.29 | ) | $ | (0.16 | ) | $ | (0.86 | ) | $ | (0.42 | ) | |||
Weighted-average shares of Class A common stock, basic and diluted(1)(2) | 15,045 | 15,000 | 15,024 | 15,000 | |||||||||||
(1) Amounts for periods prior to the initial public offering have been retrospectively adjusted to give effect to 15.0 million shares of Class A common stock issued in the initial public offering and the Organizational Transactions.
(2) Weighted-average shares of Class A common stock outstanding have been adjusted for unvested restricted stock awards.
(3) Wholesale vehicle sales revenue generated from 1,797 and 4,665 wholesale units sold during the three and nine months ended September 30, 2017, respectively, and 787 and 1,920 wholesale units sold during the three and nine months ended September 30, 2016, respectively.
13
CARVANA CO. AND SUBSIDIARIES
CONDENSED CONSOLIDATED STATEMENT OF STOCKHOLDERS' EQUITY / MEMBERS' DEFICIT
(Unaudited)
(In thousands)
Class A | Class B | ||||||||||||||||||||||||||||||||
Members' Deficit | Shares | Amount | Shares | Amount | Additional Paid-in Capital | Accumulated Deficit | Non-controlling Interests | Total Stockholders' Equity | |||||||||||||||||||||||||
Balance, December 31, 2016 | $ | (115,961 | ) | — | $ | — | — | $ | — | $ | — | $ | — | $ | — | $ | — | ||||||||||||||||
Equity-based compensation expense prior to Organizational Transactions | 158 | — | — | — | — | — | — | — | — | ||||||||||||||||||||||||
Accrued return on Class C Redeemable Preferred Units prior to Organizational Transactions | (9,439 | ) | — | — | — | — | — | — | — | — | |||||||||||||||||||||||
Net loss prior to Organizational Transactions | (49,942 | ) | — | — | — | — | — | — | — | — | |||||||||||||||||||||||
Conversion of Class C Redeemable Preferred Units for Class A Units | 260,411 | — | — | — | — | — | — | — | — | ||||||||||||||||||||||||
Effect of Organizational Transactions | (85,227 | ) | — | — | 117,236 | 117 | (174,255 | ) | — | 259,365 | 85,227 | ||||||||||||||||||||||
Issuance of Class A common stock sold in initial public offering, net of underwriters' discounts and commissions and offering expenses | — | 15,000 | 15 | — | — | 205,910 | — | — | 205,925 | ||||||||||||||||||||||||
Net loss subsequent to Organizational Transactions | — | — | — | — | — | — | (7,419 | ) | (59,717 | ) | (67,136 | ) | |||||||||||||||||||||
Adjustments to non-controlling interests | — | — | — | — | — | 333 | — | (333 | ) | — | |||||||||||||||||||||||
Issuance of restricted stock awards, net of forfeitures | — | 538 | 1 | — | — | (1 | ) | — | — | — | |||||||||||||||||||||||
Restricted stock surrendered in lieu of withholding taxes | — | (27 | ) | — | — | — | (399 | ) | — | — | (399 | ) | |||||||||||||||||||||
Options exercised | 2 | 28 | 28 | ||||||||||||||||||||||||||||||
Equity-based compensation expense recognized subsequent to Organizational Transactions | — | — | — | — | — | 3,831 | — | — | 3,831 | ||||||||||||||||||||||||
Balance, September 30, 2017 | $ | — | 15,513 | $ | 16 | 117,236 | $ | 117 | $ | 35,447 | $ | (7,419 | ) | $ | 199,315 | $ | 227,476 | ||||||||||||||||
14
CARVANA CO. AND SUBSIDIARIES
CONDENSED CONSOLIDATED STATEMENTS OF CASH FLOWS
(Unaudited)
(In thousands)
Nine Months Ended September 30, | |||||||
2017 | 2016 | ||||||
Cash Flows from Operating Activities: | |||||||
Net loss | $ | (117,078 | ) | $ | (57,418 | ) | |
Adjustments to reconcile net loss to net cash used in operating activities: | |||||||
Depreciation and amortization expense | 7,746 | 3,020 | |||||
Loss on disposal of property and equipment | 882 | — | |||||
Provision for bad debt and valuation allowance | 805 | 1,299 | |||||
Gain on loan sales | (14,982 | ) | (6,169 | ) | |||
Gain on loan sales to related party | — | — | |||||
Equity-based compensation expense | 3,989 | 421 | |||||
Amortization and write-off of debt issuance costs | 1,407 | — | |||||
Originations of finance receivables | (361,265 | ) | (160,713 | ) | |||
Proceeds from sale of finance receivables | 361,659 | 228,480 | |||||
Proceeds from sale of finance receivables to related party | — | 1,531 | |||||
Purchase of finance receivables from related party | — | (74,589 | ) | ||||
Changes in assets and liabilities: | |||||||
Accounts receivable | (6,159 | ) | (1,509 | ) | |||
Prepayment to related parties | — | (1,404 | ) | ||||
Vehicle inventory | (5,962 | ) | (62,335 | ) | |||
Other current assets | (1,206 | ) | (3,449 | ) | |||
Other assets | (1,722 | ) | — | ||||
Accounts payable and accrued liabilities | 8,694 | 9,493 | |||||
Accounts payable to related party | 258 | (21,436 | ) | ||||
Other liabilities | 6,920 | — | |||||
Net cash used in operating activities | (116,014 | ) | (144,778 | ) | |||
Cash Flows from Investing Activities: | |||||||
Purchases of property and equipment | (59,408 | ) | (21,021 | ) | |||
Change in restricted cash | (1,489 | ) | (2,299 | ) | |||
Net cash used in investing activities | (60,897 | ) | (23,320 | ) | |||
Cash Flows from Financing Activities: | |||||||
Proceeds from floor plan facility | 674,411 | 246,880 | |||||
Payments on floor plan facility | (644,641 | ) | (200,870 | ) | |||
Proceeds from Verde Credit Facility | 35,000 | — | |||||
Payments on Verde Credit Facility | (35,000 | ) | — | ||||
Proceeds from long-term debt | 7,596 | — | |||||
Payments on long-term debt | (1,137 | ) | (107 | ) | |||
Payment of note payable to related party | — | — | |||||
Payments of debt issuance costs, including $1,000 and $0 to related parties, respectively | (1,000 | ) | (228 | ) | |||
Proceeds from exercise of stock options | 28 | — | |||||
Tax withholdings related to restricted stock awards | (399 | ) | — | ||||
Proceeds from issuance of Class C redeemable preferred units | — | 159,725 | |||||
Class C redeemable preferred units issuance costs | — | (82 | ) | ||||
Net proceeds from initial public offering | 206,323 | — | |||||
Net cash provided by financing activities | 241,181 | 205,318 | |||||
Net increase in cash and cash equivalents | 64,270 | 37,220 | |||||
Cash and cash equivalents at beginning of period | 39,184 | 43,134 | |||||
Cash and cash equivalents at end of period | $ | 103,454 | $ | 80,354 | |||
Supplemental cash flow information: | |||||||
Cash payments for interest to third parties | $ | 4,668 | $ | 1,844 | |||
Cash payments for interest to related parties | $ | 382 | $ | 30 | |||
Non-cash investing and financing activities: | |||||||
Capital expenditures included in accounts payable and accrued liabilities | $ | 11,006 | $ | 3,284 | |||
Capital expenditures financed through long-term debt | $ | 7,988 | $ | 2,328 | |||
Accrual of return on Class C redeemable preferred units | $ | 9,439 | $ | 13,224 | |||
Conversion of Class C redeemable preferred units to Class A units | $ | 260,411 | $ | — | |||
15
CARVANA CO. AND SUBSIDIARIES
RECONCILIATION OF GAAP TO NON-GAAP FINANCIAL MEASURES
(Unaudited)
(In thousands, except per share amounts)
Adjusted Net Loss and Adjusted Net Loss per Share
Adjusted net loss and adjusted net loss per share are supplemental measures of operating performance that do not represent and should not be considered alternatives to net loss and net loss per share, as determined under GAAP. We believe that adjusted net loss and adjusted net loss per share supplement GAAP measures and enable us to more effectively evaluate our performance period-over-period and relative to our competitors. A reconciliation of adjusted net loss to net loss attributable to Carvana Co., the most directly comparable GAAP measure, and the computation of adjusted net loss per share are as follows:
Three Months Ended September 30, | ||||||
Numerator: | ||||||
Net loss attributable to Carvana Co. | $ | (4,380 | ) | |||
Add: Net loss attributable to non-controlling interests | (35,389 | ) | ||||
Adjusted net loss attributable to Carvana Co. | $ | (39,769 | ) | |||
Denominator: | ||||||
Weighted-average shares of Class A common stock outstanding(1)(3) | 15,045 | |||||
Adjustments: | ||||||
Assumed exchange of LLC Units for shares of Class A common stock (2) | 121,989 | |||||
Adjusted shares of Class A common stock outstanding | 137,034 | |||||
Adjusted net loss per share | $ | (0.29 | ) | |||
(1) Amounts for periods prior to the initial public offering have been retrospectively adjusted to give effect to 15.0 million shares of Class A common stock issued in the initial public offering.
(2) Assumes exchange of all outstanding LLC Units for shares of Class A common stock during each period presented, including retrospectively applying exchanges of LLC units outstanding at the initial public offering to all periods prior to the initial public offering.
(3) Excludes approximately 0.5 million unvested restricted stock awards and 0.6 million vested and unvested stock options outstanding at September 30, 2017, because they were determined to be anti-dilutive.
EBITDA and EBITDA Margin
EBITDA and EBITDA Margin are non-GAAP supplemental measures of operating performance that do not represent and should not be considered an alternative to net loss or cash flow from operations, as determined by GAAP. EBITDA is defined as net loss before interest expense, income tax expense and depreciation and amortization expense. EBITDA Margin is EBITDA as a percentage of total revenues. We use EBITDA to measure the operating performance of our business, excluding specifically identified items that we do not believe directly reflect our core operations and may not be indicative of our recurring operations. We use EBITDA Margin to measure our operating performance relative to our total revenues. EBITDA and EBITDA Margin may not be comparable to similarly titled measures provided by other companies due to potential differences in methods of calculations. A reconciliation of EBITDA to net loss, the most directly comparable GAAP measure, and calculation of EBITDA Margin is as follows:
Three Months Ended | ||||||||||||
September 30, 2017 | June 30, 2017 | September 30, 2016 | ||||||||||
Net loss | $ | (39,769 | ) | $ | (38,870 | ) | $ | (21,985 | ) | |||
Depreciation and amortization expense | 3,101 | 2,584 | 1,196 | |||||||||
Interest expense | 838 | 2,507 | 725 | |||||||||
EBITDA | $ | (35,830 | ) | $ | (33,779 | ) | $ | (20,064 | ) | |||
Total revenues | $ | 225,379 | $ | 209,365 | $ | 98,844 | ||||||
EBITDA Margin | (15.9 | )% | (16.1 | )% | (20.3 | )% | ||||||
16