Attached files
| file | filename |
|---|---|
| 8-K - 8-K - National Bank Holdings Corp | nbhc-20171106x8k.htm |
Exhibit 99.1
|
|
Q3 2017 Investor Presentation |
|
|
This presentation contains “forward-looking statements” within the meaning of the Private Securities Litigation Reform Act of 1995. Forward-looking statements contain words such as “anticipate,” “believe,” “can,” “would,” “should,” “could,” “may,” “predict,” “seek,” “potential,” “will,” “estimate,” “target,” “plan,” “project,” “continuing,” “ongoing,” “expect,” “intend” or similar expressions that relate to the Company’s strategy, plans or intentions. Forward-looking statements involve certain important risks, uncertainties and other factors, any of which could cause actual results to differ materially from those in such statements. Such factors include, without limitation, the “Risk Factors” referenced in our most recent Form 10-K filed with the Securities and Exchange Commission (SEC), other risks and uncertainties listed from time to time in our reports and documents filed with the SEC, and the following factors: ability to execute our business strategy; business and economic conditions; economic, market, operational, liquidity, credit and interest rate risks associated with the Company’s business; effects of any changes in trade, monetary and fiscal policies and laws; changes imposed by regulatory agencies to increase capital standards; effects of inflation, as well as, interest rate, securities market and monetary supply fluctuations; changes in the economy or supply-demand imbalances affecting local real estate values; changes in consumer spending, borrowings and savings habits; the Company’s ability to identify potential candidates for, consummate, integrate and realize operating efficiencies from, acquisitions or consolidations; the Company's ability to realize anticipated benefits from enhancements or updates to its core operating systems from time to time without significant change in client service or risk to the Company's control environment; the Company's dependence on information technology and telecommunications systems of third party service providers and the risk of systems failures, interruptions or breaches of security; the Company’s ability to achieve organic loan and deposit growth and the composition of such growth; changes in sources and uses of funds; increased competition in the financial services industry; the effect of changes in accounting policies and practices; the share price of the Company’s stock; the Company's ability to realize deferred tax assets or the need for a valuation allowance; continued consolidation in the financial services industry; ability to maintain or increase market share and control expenses; costs and effects of changes in laws and regulations and of other legal and regulatory developments; technological changes; the timely development and acceptance of new products and services; the Company’s continued ability to attract and maintain qualified personnel; ability to implement and/or improve operational management and other internal risk controls and processes and reporting system and procedures; regulatory limitations on dividends from the Company's bank subsidiary; changes in estimates of future loan reserve requirements based upon the periodic review thereof under relevant regulatory and accounting requirements; widespread natural and other disasters, dislocations, political instability, acts of war or terrorist activities, cyberattacks or international hostilities; impact of reputational risk; and success at managing the risks involved in the foregoing items. The Company can give no assurance that any goal or plan or expectation set forth in forward-looking statements can be achieved and readers are cautioned not to place undue reliance on such statements. The forward-looking statements are made as of the date of this presentation, and the Company does not intend, and assumes no obligation, to update any forward-looking statement to reflect events or circumstances after the date on which the statement is made or to reflect the occurrence of unanticipated events or circumstances, except as required by applicable law. Further Information This presentation should be read together with “Management’s Discussion and Analysis of Financial Condition and Results of Operations” and the consolidated financial statements and the related notes thereto included in our Form 10-K and quarterly reports. 2 Forward-Looking Statements |
|
|
3 About Non-GAAP Financial Measures Certain of the financial measures and ratios we present, including “tangible book value” and “tangible book value per share” metrics, are supplemental measures that are not required by, or are not presented in accordance with, U.S. generally accepted accounting principles (GAAP). We refer to these financial measures and ratios as “non-GAAP financial measures.” We consider the use of select non-GAAP financial measures and ratios to be useful for financial and operational decision making and useful in evaluating period-to-period comparisons. We believe that these non-GAAP financial measures provide meaningful supplemental information regarding our performance by excluding certain expenditures or assets that we believe are not indicative of our primary business operating results or by presenting certain metrics on a fully taxable equivalent basis. We believe that management and investors benefit from referring to these non-GAAP financial measures in assessing our performance and when planning, forecasting, analyzing and comparing past, present and future periods. These non-GAAP financial measures should not be considered a substitute for financial information presented in accordance with GAAP and you should not rely on non-GAAP financial measures alone as measures of our performance. The non-GAAP financial measures we present may differ from non-GAAP financial measures used by our peers or other companies. We compensate for these limitations by providing the equivalent GAAP measures whenever we present the non-GAAP financial measures and by including a reconciliation of the impact of the components adjusted for in the non-GAAP financial measure so that both measures and the individual components may be considered when analyzing our performance. The Company does not provide a reconciliation of forward-looking non-GAAP financial measures to its comparable GAAP financial measures because it could not do so without unreasonable effort due to the unavailability of the information needed to calculate reconciling items and the variability, complexity and limited visibility of the adjusting items that would be excluded from the non-GAAP financial measures in future periods. When planning, forecasting and analyzing future periods, the Company does so primarily on a non-GAAP basis without preparing a GAAP analysis as that would require estimates for various cash and non-cash reconciling items (including items such as expected credit losses, stock-based compensation, acquisition- and disposition-related expenses, and restructuring costs) that would be difficult to predict with reasonable accuracy. For example, future expectations for credit losses depend on a variety of factors including general economic conditions that make estimation on a GAAP basis impractical. Similarly, equity compensation expense would be difficult to estimate because it depends on the Company’s future hiring and retention needs, as well as the future fair market value of the Company’s common stock, all of which are difficult to predict and subject to constant change. It is also difficult to anticipate the need for or magnitude of a presently unforeseen one-time restructuring expenses. As a result, the Company does not believe that a GAAP reconciliation to forward-looking non-GAAP financial measures would provide meaningful supplemental information about the Company’s forward-looking measures. |
|
|
Company Overview 4 |
|
|
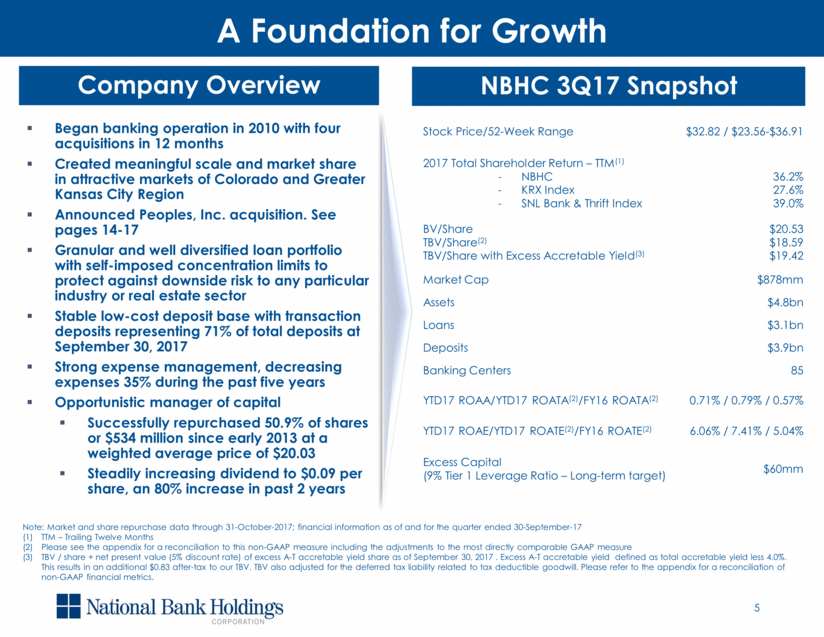
Company Overview 5 A Foundation for Growth Began banking operation in 2010 with four acquisitions in 12 months Created meaningful scale and market share in attractive markets of Colorado and Greater Kansas City Region Announced Peoples, Inc. acquisition. See pages 14-17 Granular and well diversified loan portfolio with self-imposed concentration limits to protect against downside risk to any particular industry or real estate sector Stable low-cost deposit base with transaction deposits representing 71% of total deposits at September 30, 2017 Strong expense management, decreasing expenses 35% during the past five years Opportunistic manager of capital Successfully repurchased 50.9% of shares or $534 million since early 2013 at a weighted average price of $20.03 Steadily increasing dividend to $0.09 per share, an 80% increase in past 2 years Stock Price/52-Week Range $32.82 / $23.56-$36.91 2017 Total Shareholder Return – TTM(1) - NBHC - KRX Index - SNL Bank & Thrift Index 36.2% 27.6% 39.0% BV/Share TBV/Share(2) TBV/Share with Excess Accretable Yield(3) $20.53 $18.59 $19.42 Market Cap $878mm Assets $4.8bn Loans $3.1bn Deposits $3.9bn Banking Centers 85 YTD17 ROAA/YTD17 ROATA(2)/FY16 ROATA(2) 0.71% / 0.79% / 0.57% YTD17 ROAE/YTD17 ROATE(2)/FY16 ROATE(2) 6.06% / 7.41% / 5.04% Excess Capital (9% Tier 1 Leverage Ratio – Long-term target) $60mm NBHC 3Q17 Snapshot Note: Market and share repurchase data through 31-October-2017; financial information as of and for the quarter ended 30-September-17 (1) TTM – Trailing Twelve Months (2) Please see the appendix for a reconciliation to this non-GAAP measure including the adjustments to the most directly comparable GAAP measure (3) TBV / share + net present value (5% discount rate) of excess A-T accretable yield share as of September 30, 2017 . Excess A-T accretable yield defined as total accretable yield less 4.0%. This results in an additional $0.83 after-tax to our TBV. TBV also adjusted for the deferred tax liability related to tax deductible goodwill. Please refer to the appendix for a reconciliation of non-GAAP financial metrics. |
|
|
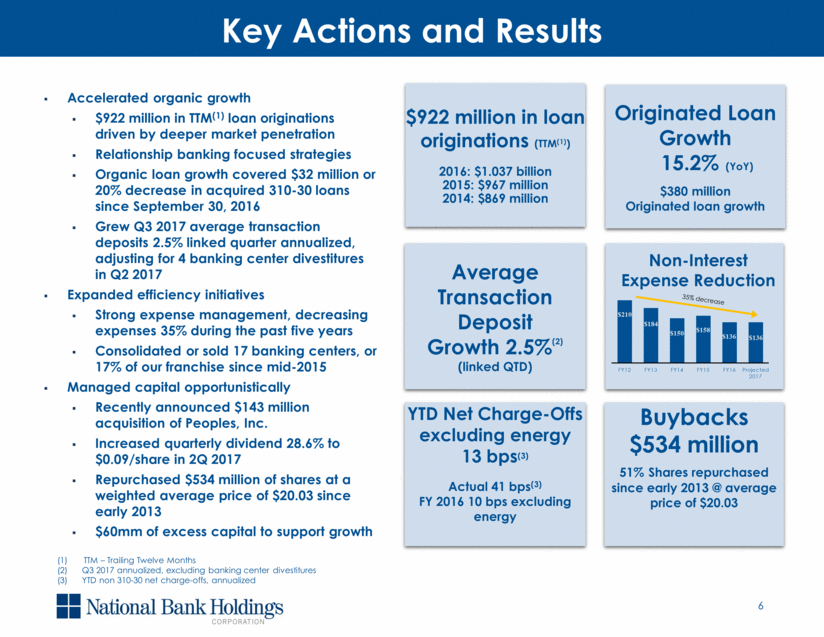
6 Key Actions and Results Accelerated organic growth $922 million in TTM(1) loan originations driven by deeper market penetration Relationship banking focused strategies Organic loan growth covered $32 million or 20% decrease in acquired 310-30 loans since September 30, 2016 Grew Q3 2017 average transaction deposits 2.5% linked quarter annualized, adjusting for 4 banking center divestitures in Q2 2017 Expanded efficiency initiatives Strong expense management, decreasing expenses 35% during the past five years Consolidated or sold 17 banking centers, or 17% of our franchise since mid-2015 Managed capital opportunistically Recently announced $143 million acquisition of Peoples, Inc. Increased quarterly dividend 28.6% to $0.09/share in 2Q 2017 Repurchased $534 million of shares at a weighted average price of $20.03 since early 2013 $60mm of excess capital to support growth YTD Net Charge-Offs excluding energy 13 bps(3) Actual 41 bps(3) FY 2016 10 bps excluding energy Buybacks $534 million 51% Shares repurchased since early 2013 @ average price of $20.03 (1) TTM – Trailing Twelve Months (2) Q3 2017 annualized, excluding banking center divestitures (3) YTD non 310-30 net charge-offs, annualized $922 million in loan originations (TTM(1)) 2016: $1.037 billion 2015: $967 million 2014: $869 million Originated Loan Growth 15.2% (YoY) $380 million Originated loan growth Average Transaction Deposit Growth 2.5%(2) (linked QTD) Non-Interest Expense Reduction 35% decrease $ 210 $ 184 $ 150 $ 158 $ 136 $ 136 FY12 FY13 FY14 FY15 FY16 Projected 2017 |
|
|
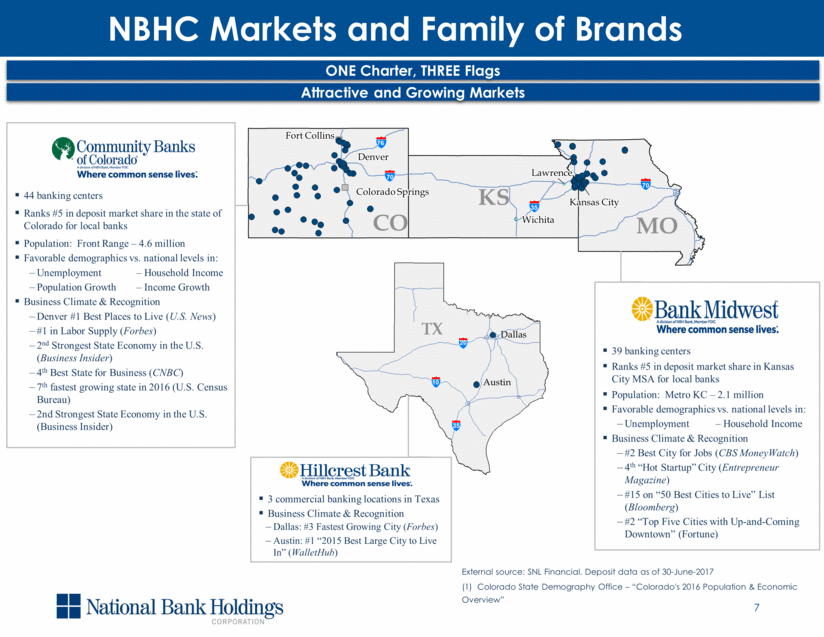
7 NBHC Markets and Family of Brands ONE Charter, THREE Flags Attractive and Growing Markets CO MO Denver Denver Denver Denver Denver Denver Denver Denver Denver Denver Denver Denver Denver Denver Denver Denver Denver Denver Denver Denver Denver Denver Denver Denver Denver Denver Denver Denver Denver Denver Denver Denver Denver Denver Denver Denver Denver Denver Denver Denver Denver Denver Denver Denver Denver Denver Denver Denver Denver Kansas City Kansas City Kansas City Kansas City Kansas City Kansas City Kansas City Kansas City Kansas City Kansas City Kansas City Kansas City Kansas City Kansas City Kansas City Kansas City Kansas City Kansas City Kansas City Kansas City Kansas City Kansas City Kansas City Kansas City Kansas City Kansas City Kansas City Kansas City Kansas City Kansas City Kansas City Kansas City Kansas City Kansas City Kansas City Kansas City Kansas City Kansas City Kansas City Kansas City Kansas City Kansas City Kansas City Kansas City Kansas City Kansas City Kansas City Kansas City Kansas City Lawrence Lawrence Lawrence Lawrence Lawrence Lawrence Lawrence Lawrence Lawrence Lawrence Lawrence Lawrence Lawrence Lawrence Lawrence Lawrence Lawrence Lawrence Lawrence Lawrence Lawrence Lawrence Lawrence Lawrence Lawrence Lawrence Lawrence Lawrence Lawrence Lawrence Lawrence Lawrence Lawrence Lawrence Lawrence Lawrence Lawrence Lawrence Lawrence Lawrence Lawrence Lawrence Lawrence Lawrence Lawrence Lawrence Lawrence Lawrence Lawrence Fort Collins Fort Collins Fort Collins Fort Collins Fort Collins Fort Collins Fort Collins Fort Collins Fort Collins Fort Collins Fort Collins Fort Collins Fort Collins Fort Collins Fort Collins Fort Collins Fort Collins Fort Collins Fort Collins Fort Collins Fort Collins Fort Collins Fort Collins Fort Collins Fort Collins Fort Collins Fort Collins Fort Collins Fort Collins Fort Collins Fort Collins Fort Collins Fort Collins Fort Collins Fort Collins Fort Collins Fort Collins Fort Collins Fort Collins Fort Collins Fort Collins Fort Collins Fort Collins Fort Collins Fort Collins Fort Collins Fort Collins Fort Collins Fort Collins Colorado Springs Colorado Springs Colorado Springs Colorado Springs Colorado Springs Colorado Springs Colorado Springs Colorado Springs Colorado Springs Colorado Springs Colorado Springs Colorado Springs Colorado Springs Colorado Springs Colorado Springs Colorado Springs Colorado Springs Colorado Springs Colorado Springs Colorado Springs Colorado Springs Colorado Springs Colorado Springs Colorado Springs Colorado Springs Colorado Springs Colorado Springs Colorado Springs Colorado Springs Colorado Springs Colorado Springs Colorado Springs Colorado Springs Colorado Springs Colorado Springs Colorado Springs Colorado Springs Colorado Springs Colorado Springs Colorado Springs Colorado Springs Colorado Springs Colorado Springs Colorado Springs Colorado Springs Colorado Springs Colorado Springs Colorado Springs Colorado Springs KS Wichita Wichita Wichita Wichita Wichita Wichita Wichita Wichita Wichita Wichita Wichita Wichita Wichita Wichita Wichita Wichita Wichita Wichita Wichita Wichita Wichita Wichita Wichita Wichita Wichita Wichita Wichita Wichita Wichita Wichita Wichita Wichita Wichita Wichita Wichita Wichita Wichita Wichita Wichita Wichita Wichita Wichita Wichita Wichita Wichita Wichita Wichita Wichita Wichita 35 10 20 44 banking centers Ranks #5 in deposit market share in the state of Colorado for local banks Population: Front Range – 4.6 million Favorable demographics vs. national levels in: Unemployment ‒ Household Income Population Growth ‒ Income Growth Business Climate & Recognition Denver #1 Best Places to Live (U.S. News) #1 in Labor Supply (Forbes) 2nd Strongest State Economy in the U.S. (Business Insider) 4th Best State for Business (CNBC) 7th fastest growing state in 2016 (U.S. Census Bureau) 2nd Strongest State Economy in the U.S. (Business Insider) 39 banking centers Ranks #5 in deposit market share in Kansas City MSA for local banks Population: Metro KC – 2.1 million Favorable demographics vs. national levels in: Unemployment ‒ Household Income Business Climate & Recognition #2 Best City for Jobs (CBS MoneyWatch) 4th “Hot Startup” City (Entrepreneur Magazine) #15 on “50 Best Cities to Live” List (Bloomberg) #2 “Top Five Cities with Up-and-Coming Downtown” (Fortune) 3 commercial banking locations in Texas Business Climate & Recognition Dallas: #3 Fastest Growing City (Forbes) Austin: #1 “2015 Best Large City to Live In” (WalletHub) External source: SNL Financial. Deposit data as of 30-June-2017 (1) Colorado State Demography Office – “Colorado's 2016 Population & Economic Overview” Dallas Austin 35 70 70 76 |
|
|
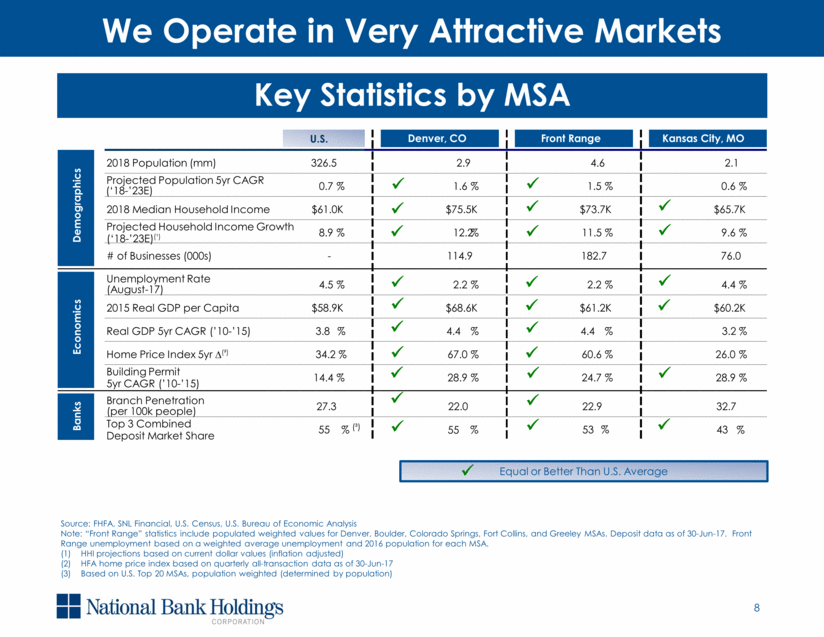
Key Statistics by MSA 8 We Operate in Very Attractive Markets ü ü ü ü ü ü ü ü ü ü ü ü ü ü ü ü ü ü ü ü ü ü ü ü ü Equal or Better Than U.S. Average ü % % % U.S. 2018 Population (mm) 326.5 2.9 4.6 2.1 Projected Population 5yr CAGR (‘18-’23E) 0.7 % 1.6 % 1.5 % 0.6 % 2018 Median Household Income $61.0K $75.5K $73.7K $65.7K Projected Household Income Growth (‘18-’23E)(¹) 8.9 % 12.2 % 11.5 % 9.6 % # of Businesses (000s) - 114.9 182.7 76.0 Unemployment Rate (August-17) 4.5 % 2.2 % 2.2 % 4.4 % 2015 Real GDP per Capita $58.9K $68.6K $61.2K $60.2K Real GDP 5yr CAGR (’10-’15) 3.8 % 4.4 % 4.4 % 3.2 % Home Price Index 5yr ∆(²) 34.2 % 67.0 % 60.6 % 26.0 % Building Permit 5yr CAGR (’10-’15) 14.4 % 28.9 % 24.7 % 28.9 % Branch Penetration (per 100k people) 27.3 22.0 22.9 32.7 Top 3 Combined Deposit Market Share 55 % (³) 55 53 43 Denver, CO Front Range Kansas City, MO Banks Demographics Economics Source: FHFA, SNL Financial, U.S. Census, U.S. Bureau of Economic Analysis Note: “Front Range” statistics include populated weighted values for Denver, Boulder, Colorado Springs, Fort Collins, and Greeley MSAs. Deposit data as of 30-Jun-17. Front Range unemployment based on a weighted average unemployment and 2016 population for each MSA. (1) HHI projections based on current dollar values (inflation adjusted) (2) HFA home price index based on quarterly all-transaction data as of 30-Jun-17 (3) Based on U.S. Top 20 MSAs, population weighted (determined by population) ü |
|
|
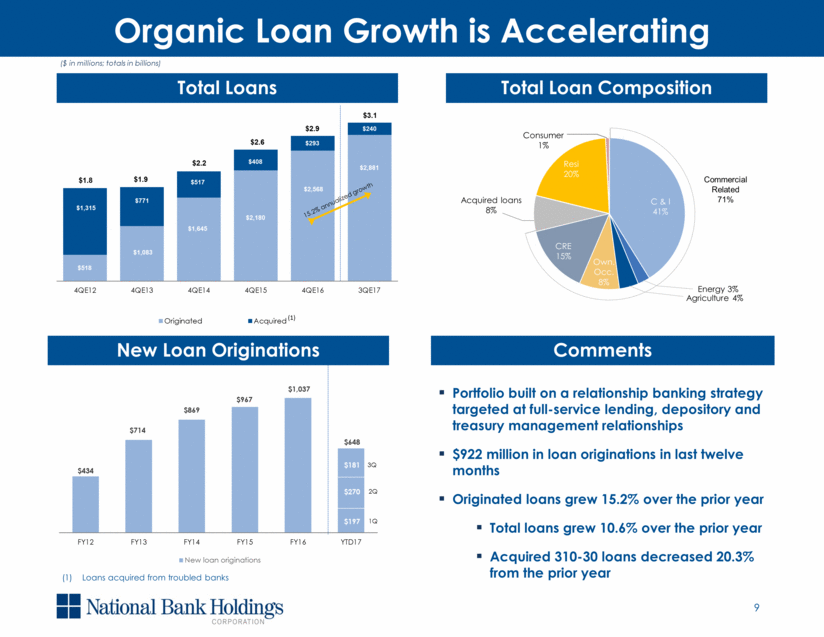
Total Loans 9 Organic Loan Growth is Accelerating Total Loan Composition New Loan Originations Commercial Related 71% ($ in millions; totals in billions) (1) Loans acquired from troubled banks $3.1 $2.9 1Q 2Q 3Q 15.2% annualized growth $181 $270 $197 Portfolio built on a relationship banking strategy targeted at full-service lending, depository and treasury management relationships $922 million in loan originations in last twelve months Originated loans grew 15.2% over the prior year Total loans grew 10.6% over the prior year Acquired 310-30 loans decreased 20.3% from the prior year Comments $434 $714 $869 $967 $1,037 $648 FY12 FY13 FY14 FY15 FY16 YTD17 New loan originations $518 $1,083 $1,645 $2,180 $2,568 $2,881 $1,315 $771 $517 $408 $293 $240 $1.9 $2.2 $2.6 $1.8 4QE12 4QE13 4QE14 4QE15 4QE16 3QE17 Originated Acquired (1) C & I 41% Energy 3% Agriculture 4% Own. Occ . 8% CRE 15% Resi 20% Acquired loans 8% Consumer 1% |
|
|
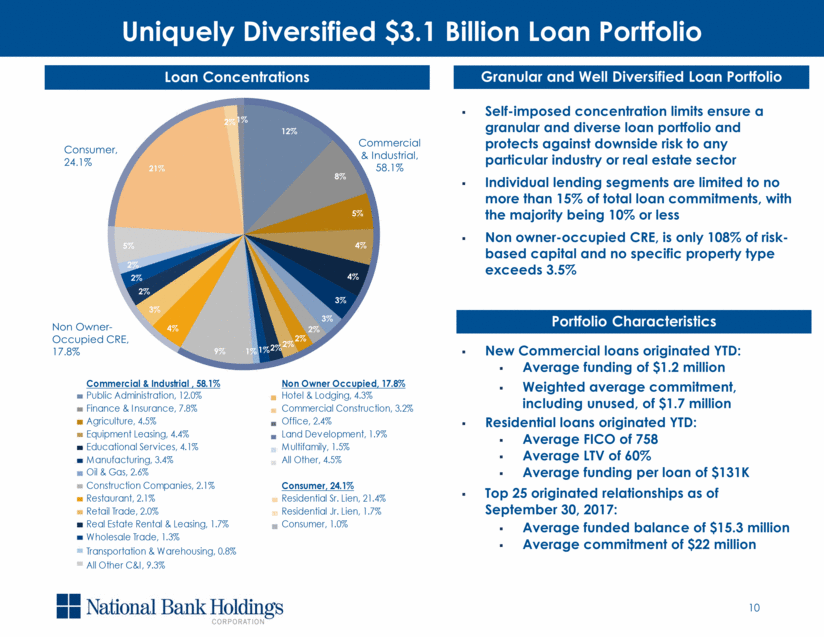
10 Uniquely Diversified $3.1 Billion Loan Portfolio Consumer, 24.1% Commercial & Industrial, 58.1% Non Owner-Occupied CRE, 17.8% Granular and Well Diversified Loan Portfolio Self-imposed concentration limits ensure a granular and diverse loan portfolio and protects against downside risk to any particular industry or real estate sector Individual lending segments are limited to no more than 15% of total loan commitments, with the majority being 10% or less Non owner-occupied CRE, is only 108% of risk-based capital and no specific property type exceeds 3.5% New Commercial loans originated YTD: Average funding of $1.2 million Weighted average commitment, including unused, of $1.7 million Residential loans originated YTD: Average FICO of 758 Average LTV of 60% Average funding per loan of $131K Top 25 originated relationships as of September 30, 2017: Average funded balance of $15.3 million Average commitment of $22 million Portfolio Characteristics 12% 8% 5% 4% 4% 3% 3% 2% 2% 2% 2% 1% 1% 9% 4% 3% 2% 2% 2% 5% 21% 2% 1% Loan Concentrations Commercial & Industrial , 58.1% Non Owner Occupied, 17.8% Public Administration, 12.0% Hotel & Lodging, 4.3% Finance & Insurance, 7.8% Commercial Construction, 3.2% Agriculture, 4.5% Office, 2.4% Equipment Leasing, 4.4% Land Development, 1.9% Educational Services, 4.1% Multifamily, 1.5% Manufacturing, 3.4% All Other, 4.5% Oil & Gas, 2.6% Construction Companies, 2.1% Consumer, 24.1% Restaurant, 2.1% Residential Sr. Lien, 21.4% Retail Trade, 2.0% Residential Jr. Lien, 1.7% Real Estate Rental & Leasing, 1.7% Consumer, 1.0% Wholesale Trade, 1.3% Transportation & Warehousing, 0.8% All Other C&I, 9.3% |
|
|
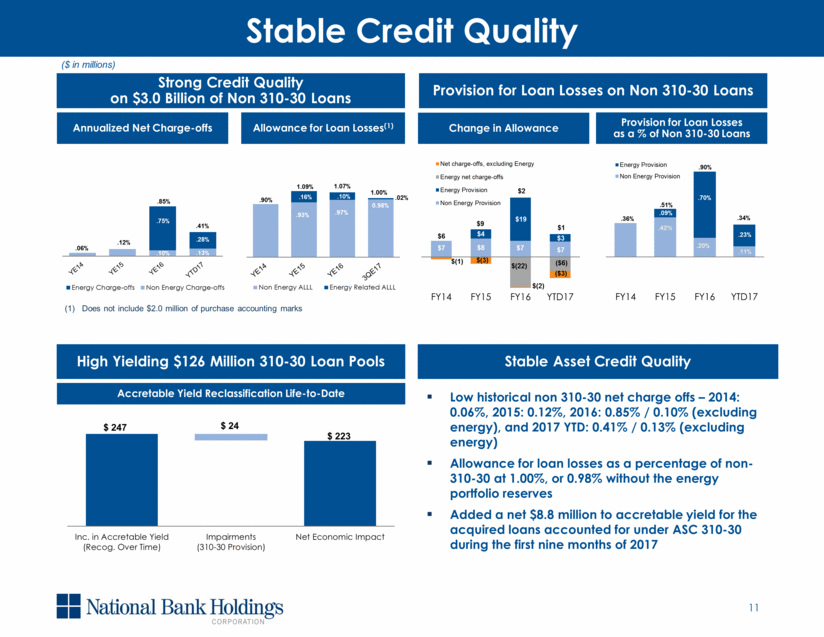
Strong Credit Quality on $3.0 Billion of Non 310-30 Loans 11 Stable Credit Quality Provision for Loan Losses on Non 310-30 Loans ($ in millions) High Yielding $126 Million 310-30 Loan Pools Stable Asset Credit Quality Annualized Net Charge-offs Allowance for Loan Losses(1) Change in Allowance Provision for Loan Losses as a % of Non 310-30 Loans Accretable Yield Reclassification Life-to-Date Low historical non 310-30 net charge offs – 2014: 0.06%, 2015: 0.12%, 2016: 0.85% / 0.10% (excluding energy), and 2017 YTD: 0.41% / 0.13% (excluding energy) Allowance for loan losses as a percentage of non-310-30 at 1.00%, or 0.98% without the energy portfolio reserves Added a net $8.8 million to accretable yield for the acquired loans accounted for under ASC 310-30 during the first nine months of 2017 (1) Does not include $2.0 million of purchase accounting marks .85% .75% .10% $6 ($3) $3 ($6) 0.98% .93% .90% 1.09% 1.07% 1.00% .02% .70% .11% .23% .28% .13% $7 $1 .41% .06% .12% Energy Charge-offs Non Energy Charge-offs Non Energy ALLL Energy Related ALLL .16% .10% .97% $7 $8 $7 $4 $19 $( 3) $( 1) $(2) FY14 FY15 FY16 YTD17 Net charge-offs, excluding Energy Energy net charge-offs Energy Provision Non Energy Provision $9 $2 $(22) .51% .09% .90% . 36% .34% FY14 FY15 FY16 YTD17 Energy Provision Non Energy Provision .42 % .20% $ 24 $ 223 Inc. in Accretable Yield (Recog. Over Time) Impairments (310-30 Provision) Net Economic Impact $ 247 |
|
|
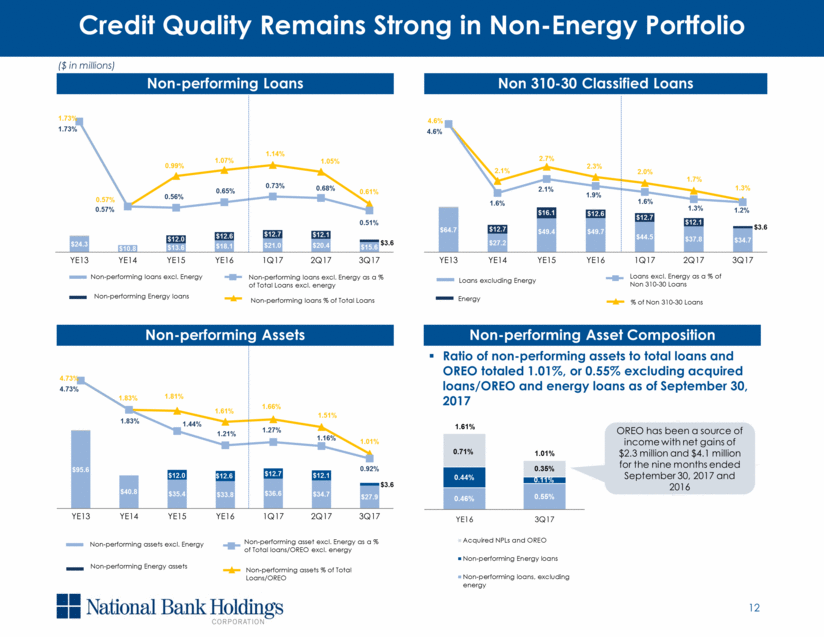
Non-performing Loans 12 Credit Quality Remains Strong in Non-Energy Portfolio Non 310-30 Classified Loans ($ in millions) Non-performing Assets Non-performing Asset Composition Non-performing Energy loans – 0.39% Acquired OREO OREO has been a source of income with net gains of $2.3 million and $4.1 million for the nine months ended September 30, 2017 and 2016 Ratio of non-performing assets to total loans and OREO totaled 1.01%, or 0.55% excluding acquired loans/OREO and energy loans as of September 30, 2017 1.61% 1.01% $3.6 $3.6 $12.0 $3.6 $12.0 $24.3 $10.8 $13.6 $18.1 $21.0 $20.4 $15.6 $12.0 $12.6 $12.7 $12.1 1.73% 0.57% 0.99% 1.07% 1.14% 1.05% 0.61% 1.73% 0.57% 0.56% 0.65% 0.73% 0.68% 0.51% YE13 YE14 YE15 YE16 1Q17 2Q17 3Q17 Non - performing loans excl. Energy Non - performing loans excl. Energy as a % of Total Loans excl. energy Non - performing Energy loans Non - performing loans % of Total Loans 0.46% 0.55% 0.44% 0.11% 0.71% 0.35% YE16 3Q17 Acquired NPLs and OREO Non-performing Energy loans Non-performing loans, excluding energy $95.6 $40.8 $35.4 $33.8 $36.6 $34.7 $27.9 $12.6 $12.7 $12.1 4.73% 1.83% 1.81% 1.61% 1.66% 1.51% 1.01% 4.73% 1.83% 1.44% 1.21% 1.27% 1.16% 0.92% YE13 YE14 YE15 YE16 1Q17 2Q17 3Q17 Non - performing assets excl. Energy Non - performing asset excl. Energy as a % of Total loans/OREO excl. energy Non - performing Energy assets Non - performing assets % of Total Loans/OREO $64.7 $27.2 $49.4 $49.7 $44.5 $37.8 $34.7 $12.7 $16.1 $12.6 $12.7 $12.1 4.6% 2.1% 2.7% 2.3% 2.0% 1.7% 1.3% 4.6% 1.6% 2.1% 1.9% 1.6% 1.3% 1.2% YE13 YE14 YE15 YE16 1Q17 2Q17 3Q17 Loans excluding Energy Loans excl. Energy as a % of Non 310 - 30 Loans Energy % of Non 310 - 30 Loans |
|
|
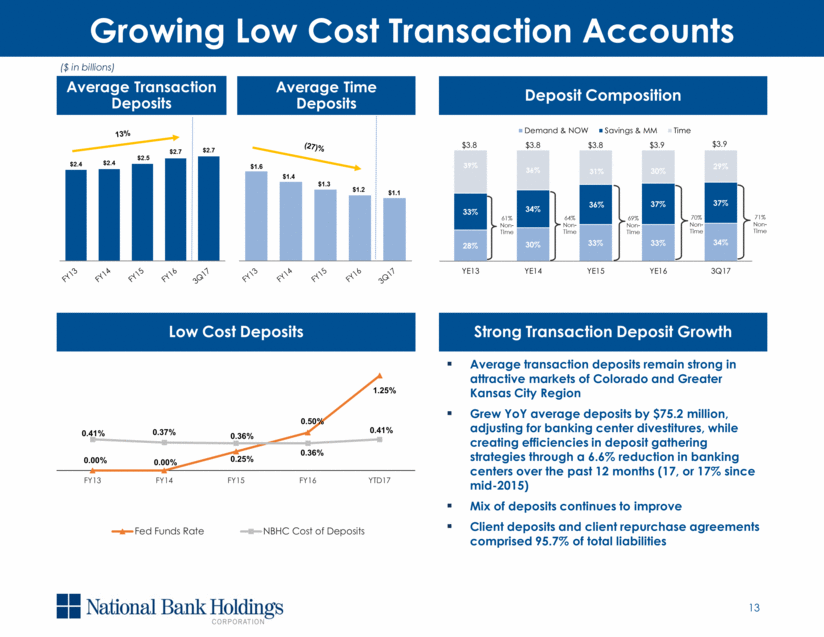
Average Transaction Deposits 13 Growing Low Cost Transaction Accounts Average Time Deposits Deposit Composition Low Cost Deposits 13% (27)% 71% Non-Time ($ in billions) Average transaction deposits remain strong in attractive markets of Colorado and Greater Kansas City Region Grew YoY average deposits by $75.2 million, adjusting for banking center divestitures, while creating efficiencies in deposit gathering strategies through a 6.6% reduction in banking centers over the past 12 months (17, or 17% since mid-2015) Mix of deposits continues to improve Client deposits and client repurchase agreements comprised 95.7% of total liabilities Strong Transaction Deposit Growth $2.4 $2.4 $2.5 $2.7 $2.7 $1.6 $1.4 $1.3 $1.2 $1.1 28% 30% 33% 33% 34% 33% 34% 36% 37% 37% 39% 36% 31% 30% 29% $3.8 $3.8 $3.8 $3.9 $3.9 YE13 YE14 YE15 YE16 3Q17 Demand & NOW Savings & MM Time 69% Non - Time 61% Non - Time 64% Non - Time 70% Non - Time 0.00% 0.00% 0.25% 0.50% 1.25% 0.41% 0.37% 0.36% 0.36% 0.41% FY13 FY14 FY15 FY16 YTD17 Fed Funds Rate NBHC Cost of Deposits |
|
|
Acquisition of Peoples, Inc. 14 |
|
|
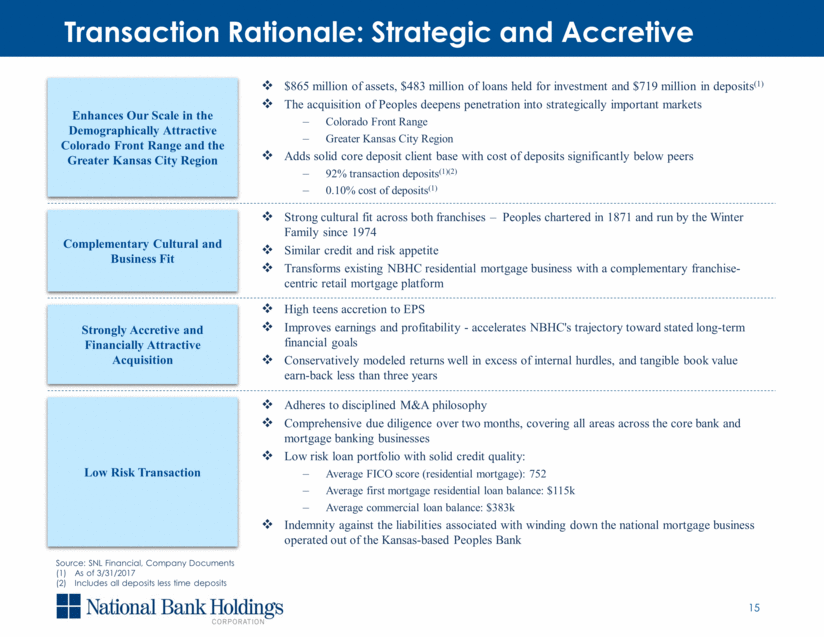
15 Transaction Rationale: Strategic and Accretive Transaction Rationale: Strategic and Accretive Transaction Rationale: Strategic and Accretive Enhances Our Scale in the Demographically Attractive Colorado Front Range and the Greater Kansas City Region $865 million of assets, $483 million of loans held for investment and $719 million in deposits(1) The acquisition of Peoples deepens penetration into strategically important markets Colorado Front Range Greater Kansas City Region Adds solid core deposit client base with cost of deposits significantly below peers 92% transaction deposits(1)(2) 0.10% cost of deposits(1) Complementary Cultural and Business Fit Strongly Accretive and Financially Attractive Acquisition Low Risk Transaction High teens accretion to EPS Improves earnings and profitability - accelerates NBHC's trajectory toward stated long-term financial goals Conservatively modeled returns well in excess of internal hurdles, and tangible book value earn-back less than three years Strong cultural fit across both franchises – Peoples chartered in 1871 and run by the Winter Family since 1974 Similar credit and risk appetite Transforms existing NBHC residential mortgage business with a complementary franchise-centric retail mortgage platform Adheres to disciplined M&A philosophy Comprehensive due diligence over two months, covering all areas across the core bank and mortgage banking businesses Low risk loan portfolio with solid credit quality: Average FICO score (residential mortgage): 752 Average first mortgage residential loan balance: $115k Average commercial loan balance: $383k Indemnity against the liabilities associated with winding down the national mortgage business operated out of the Kansas-based Peoples Bank Source: SNL Financial, Company Documents As of 3/31/2017 Includes all deposits less time deposits |
|
|
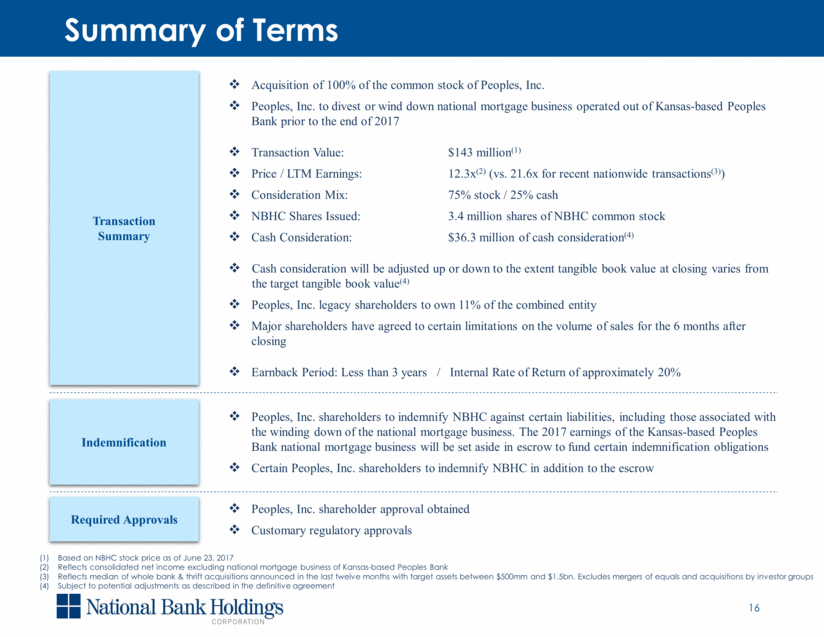
16 Summary of Terms Transaction Rationale: Strategic and Accretive Transaction Rationale: Strategic and Accretive Transaction Summary Acquisition of 100% of the common stock of Peoples, Inc. Peoples, Inc. to divest or wind down national mortgage business operated out of Kansas-based Peoples Bank prior to the end of 2017 Transaction Value: $143 million(1) Price / LTM Earnings: 12.3x(2) (vs. 21.6x for recent nationwide transactions(3)) Consideration Mix: 75% stock / 25% cash NBHC Shares Issued: 3.4 million shares of NBHC common stock Cash Consideration: $36.3 million of cash consideration(4) Cash consideration will be adjusted up or down to the extent tangible book value at closing varies from the target tangible book value(4) Peoples, Inc. legacy shareholders to own 11% of the combined entity Major shareholders have agreed to certain limitations on the volume of sales for the 6 months after closing Earnback Period: Less than 3 years / Internal Rate of Return of approximately 20% Indemnification Peoples, Inc. shareholders to indemnify NBHC against certain liabilities, including those associated with the winding down of the national mortgage business. The 2017 earnings of the Kansas-based Peoples Bank national mortgage business will be set aside in escrow to fund certain indemnification obligations Certain Peoples, Inc. shareholders to indemnify NBHC in addition to the escrow Required Approvals Peoples, Inc. shareholder approval obtained Customary regulatory approvals Based on NBHC stock price as of June 23, 2017 Reflects consolidated net income excluding national mortgage business of Kansas-based Peoples Bank Reflects median of whole bank & thrift acquisitions announced in the last twelve months with target assets between $500mm and $1.5bn. Excludes mergers of equals and acquisitions by investor groups Subject to potential adjustments as described in the definitive agreement |
|
|
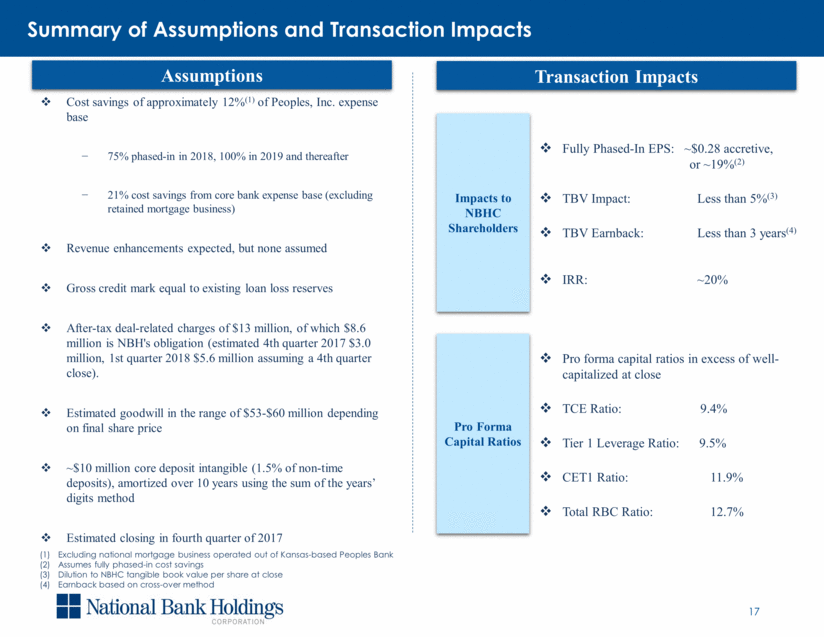
Cost savings of approximately 12%(1) of Peoples, Inc. expense base 75% phased-in in 2018, 100% in 2019 and thereafter 21% cost savings from core bank expense base (excluding retained mortgage business) Revenue enhancements expected, but none assumed Gross credit mark equal to existing loan loss reserves After-tax deal-related charges of $13 million, of which $8.6 million is NBH's obligation (estimated 4th quarter 2017 $3.0 million, 1st quarter 2018 $5.6 million assuming a 4th quarter close). Estimated goodwill in the range of $53-$60 million depending on final share price ~$10 million core deposit intangible (1.5% of non-time deposits), amortized over 10 years using the sum of the years’ digits method Estimated closing in fourth quarter of 2017 Impacts to NBHC Shareholders Pro Forma Capital Ratios Pro forma capital ratios in excess of well-capitalized at close TCE Ratio: 9.4% Tier 1 Leverage Ratio: 9.5% CET1 Ratio: 11.9% Total RBC Ratio: 12.7% Fully Phased-In EPS: ~$0.28 accretive, or ~19%(2) TBV Impact: Less than 5%(3) TBV Earnback: Less than 3 years(4) IRR: ~20% Excluding national mortgage business operated out of Kansas-based Peoples Bank Assumes fully phased-in cost savings Dilution to NBHC tangible book value per share at close Earnback based on cross-over method Summary of Assumptions and Transaction Impacts Assumptions Transaction Impacts 17 |
|
|
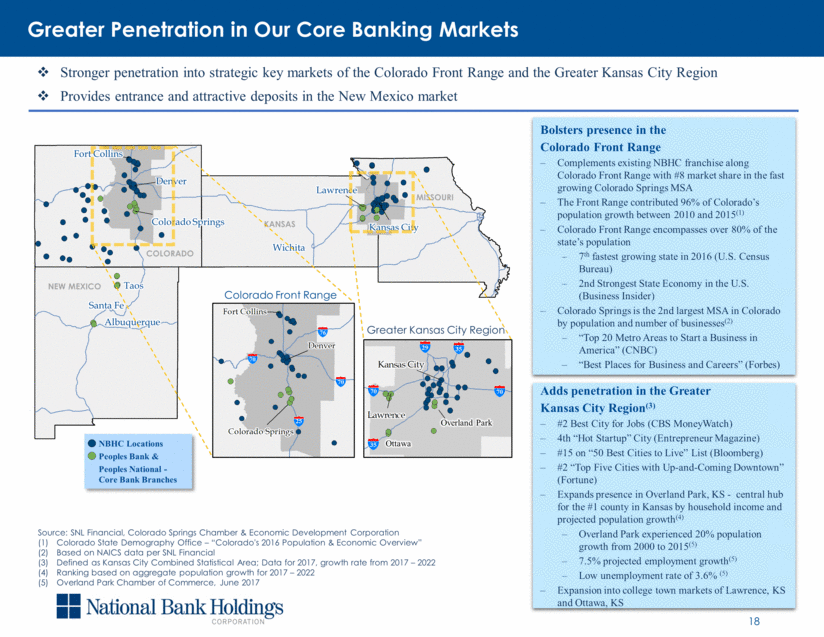
18 Adds penetration in the Greater Kansas City Region(3) #2 Best City for Jobs (CBS MoneyWatch) 4th “Hot Startup” City (Entrepreneur Magazine) #15 on “50 Best Cities to Live” List (Bloomberg) #2 “Top Five Cities with Up-and-Coming Downtown” (Fortune) Expands presence in Overland Park, KS - central hub for the #1 county in Kansas by household income and projected population growth(4) Overland Park experienced 20% population growth from 2000 to 2015(5) 7.5% projected employment growth(5) Low unemployment rate of 3.6% (5) Expansion into college town markets of Lawrence, KS and Ottawa, KS Bolsters presence in the Colorado Front Range Complements existing NBHC franchise along Colorado Front Range with #8 market share in the fast growing Colorado Springs MSA The Front Range contributed 96% of Colorado’s population growth between 2010 and 2015(1) Colorado Front Range encompasses over 80% of the state’s population 7th fastest growing state in 2016 (U.S. Census Bureau) 2nd Strongest State Economy in the U.S. (Business Insider) Colorado Springs is the 2nd largest MSA in Colorado by population and number of businesses(2) “Top 20 Metro Areas to Start a Business in America” (CNBC) “Best Places for Business and Careers” (Forbes) Greater Penetration in Our Core Banking Markets Stronger penetration into strategic key markets of the Colorado Front Range and the Greater Kansas City Region Provides entrance and attractive deposits in the New Mexico market Source: SNL Financial, Colorado Springs Chamber & Economic Development Corporation Colorado State Demography Office – “Colorado's 2016 Population & Economic Overview” Based on NAICS data per SNL Financial Defined as Kansas City Combined Statistical Area; Data for 2017, growth rate from 2017 – 2022 Ranking based on aggregate population growth for 2017 – 2022 Overland Park Chamber of Commerce, June 2017 70 70 25 40 35 76 44 Denver Denver Denver Denver Denver Denver Denver Denver Denver Denver Denver Denver Denver Denver Denver Denver Denver Denver Denver Denver Denver Denver Denver Denver Denver Denver Denver Denver Denver Denver Denver Denver Denver Denver Denver Denver Denver Denver Denver Denver Denver Denver Denver Denver Denver Denver Denver Denver Denver Colorado Springs Colorado Springs Colorado Springs Colorado Springs Colorado Springs Colorado Springs Colorado Springs Colorado Springs Colorado Springs Colorado Springs Colorado Springs Colorado Springs Colorado Springs Colorado Springs Colorado Springs Colorado Springs Colorado Springs Colorado Springs Colorado Springs Colorado Springs Colorado Springs Colorado Springs Colorado Springs Colorado Springs Colorado Springs Colorado Springs Colorado Springs Colorado Springs Colorado Springs Colorado Springs Colorado Springs Colorado Springs Colorado Springs Colorado Springs Colorado Springs Colorado Springs Colorado Springs Colorado Springs Colorado Springs Colorado Springs Colorado Springs Colorado Springs Colorado Springs Colorado Springs Colorado Springs Colorado Springs Colorado Springs Colorado Springs Colorado Springs Wichita Wichita Wichita Wichita Wichita Wichita Wichita Wichita Wichita Wichita Wichita Wichita Wichita Wichita Wichita Wichita Wichita Wichita Wichita Wichita Wichita Wichita Wichita Wichita Wichita Wichita Wichita Wichita Wichita Wichita Wichita Wichita Wichita Wichita Wichita Wichita Wichita Wichita Wichita Wichita Wichita Wichita Wichita Wichita Wichita Wichita Wichita Wichita Wichita Lawrence Lawrence Lawrence Lawrence Lawrence Lawrence Lawrence Lawrence Lawrence Lawrence Lawrence Lawrence Lawrence Lawrence Lawrence Lawrence Lawrence Lawrence Lawrence Lawrence Lawrence Lawrence Lawrence Lawrence Lawrence Lawrence Lawrence Lawrence Lawrence Lawrence Lawrence Lawrence Lawrence Lawrence Lawrence Lawrence Lawrence Lawrence Lawrence Lawrence Lawrence Lawrence Lawrence Lawrence Lawrence Lawrence Lawrence Lawrence Lawrence Albuquerque Albuquerque Albuquerque Albuquerque Albuquerque Albuquerque Albuquerque Albuquerque Albuquerque Albuquerque Albuquerque Albuquerque Albuquerque Albuquerque Albuquerque Albuquerque Albuquerque Albuquerque Albuquerque Albuquerque Albuquerque Albuquerque Albuquerque Albuquerque Albuquerque Albuquerque Albuquerque Albuquerque Albuquerque Albuquerque Albuquerque Albuquerque Albuquerque Albuquerque Albuquerque Albuquerque Albuquerque Albuquerque Albuquerque Albuquerque Albuquerque Albuquerque Albuquerque Albuquerque Albuquerque Albuquerque Albuquerque Albuquerque Albuquerque Santa Fe Santa Fe Santa Fe Santa Fe Santa Fe Santa Fe Santa Fe Santa Fe Santa Fe Santa Fe Santa Fe Santa Fe Santa Fe Santa Fe Santa Fe Santa Fe Santa Fe Santa Fe Santa Fe Santa Fe Santa Fe Santa Fe Santa Fe Santa Fe Santa Fe Santa Fe Santa Fe Santa Fe Santa Fe Santa Fe Santa Fe Santa Fe Santa Fe Santa Fe Santa Fe Santa Fe Santa Fe Santa Fe Santa Fe Santa Fe Santa Fe Santa Fe Santa Fe Santa Fe Santa Fe Santa Fe Santa Fe Santa Fe Santa Fe Kansas City Kansas City Kansas City Kansas City Kansas City Kansas City Kansas City Kansas City Kansas City Kansas City Kansas City Kansas City Kansas City Kansas City Kansas City Kansas City Kansas City Kansas City Kansas City Kansas City Kansas City Kansas City Kansas City Kansas City Kansas City Kansas City Kansas City Kansas City Kansas City Kansas City Kansas City Kansas City Kansas City Kansas City Kansas City Kansas City Kansas City Kansas City Kansas City Kansas City Kansas City Kansas City Kansas City Kansas City Kansas City Kansas City Kansas City Kansas City Kansas City Fort Collins Fort Collins Fort Collins Fort Collins Fort Collins Fort Collins Fort Collins Fort Collins Fort Collins Fort Collins Fort Collins Fort Collins Fort Collins Fort Collins Fort Collins Fort Collins Fort Collins Fort Collins Fort Collins Fort Collins Fort Collins Fort Collins Fort Collins Fort Collins Fort Collins Fort Collins Fort Collins Fort Collins Fort Collins Fort Collins Fort Collins Fort Collins Fort Collins Fort Collins Fort Collins Fort Collins Fort Collins Fort Collins Fort Collins Fort Collins Fort Collins Fort Collins Fort Collins Fort Collins Fort Collins Fort Collins Fort Collins Fort Collins Fort Collins Taos Taos Taos Taos Taos Taos Taos Taos Taos Taos Taos Taos Taos Taos Taos Taos Taos Taos Taos Taos Taos Taos Taos Taos Taos Taos Taos Taos Taos Taos Taos Taos Taos Taos Taos Taos Taos Taos Taos Taos Taos Taos Taos Taos Taos Taos Taos Taos Taos COLORADO KANSAS MISSOURI NEW MEXICO NBHC Locations Peoples Bank & Peoples National - Core Bank Branches 70 35 70 35 29 Colorado Front Range Greater Kansas City Region 70 25 70 76 Ottawa Overland Park |
|
|
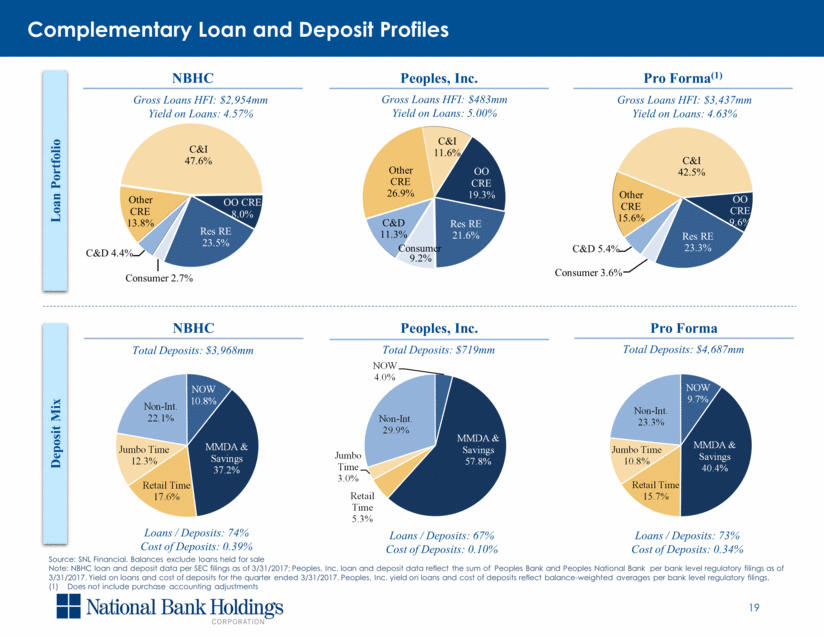
C&I 11.6% OO CRE 19.3% Res RE 21.6% Consumer 9.2% C&D 11.3% Other CRE 26.9% 19 Loan Portfolio Deposit Mix Peoples, Inc. NBHC Pro Forma(1) Peoples, Inc. NBHC Pro Forma Gross Loans HFI: $2,954mm Yield on Loans: 4.57% Total Deposits: $3,968mm Gross Loans HFI: $483mm Yield on Loans: 5.00% Gross Loans HFI: $3,437mm Yield on Loans: 4.63% Total Deposits: $4,687mm Total Deposits: $719mm Source: SNL Financial. Balances exclude loans held for sale Note: NBHC loan and deposit data per SEC filings as of 3/31/2017; Peoples, Inc. loan and deposit data reflect the sum of Peoples Bank and Peoples National Bank per bank level regulatory filings as of 3/31/2017. Yield on loans and cost of deposits for the quarter ended 3/31/2017. Peoples, Inc. yield on loans and cost of deposits reflect balance-weighted averages per bank level regulatory filings. Does not include purchase accounting adjustments Loans / Deposits: 74% Cost of Deposits: 0.39% Loans / Deposits: 67% Cost of Deposits: 0.10% Loans / Deposits: 73% Cost of Deposits: 0.34% Complementary Loan and Deposit Profiles C&I 47.6% OO CRE 8.0% Res RE 23.5% Consumer 2.7% C&D 4.4% Other CRE 13.8% C&I 42.5% OO CRE 9.6% Res RE 23.3% Consumer 3.6% C&D 5.4% Other CRE 15.6% Non - Int. 23.3% NOW 9.7% MMDA & Savings 40.4% Retail Time 15.7% Jumbo Time 10.8% Non - Int. 29.9% NOW 4.0% MMDA & Savings 57.8% Retail Time 5.3% Jumbo Time 3.0% Non - Int. 22.1% NOW 10.8% MMDA & Savings 37.2% Retail Time 17.6% Jumbo Time 12.3% |
|
|
Financial Overview 20 |
|
|
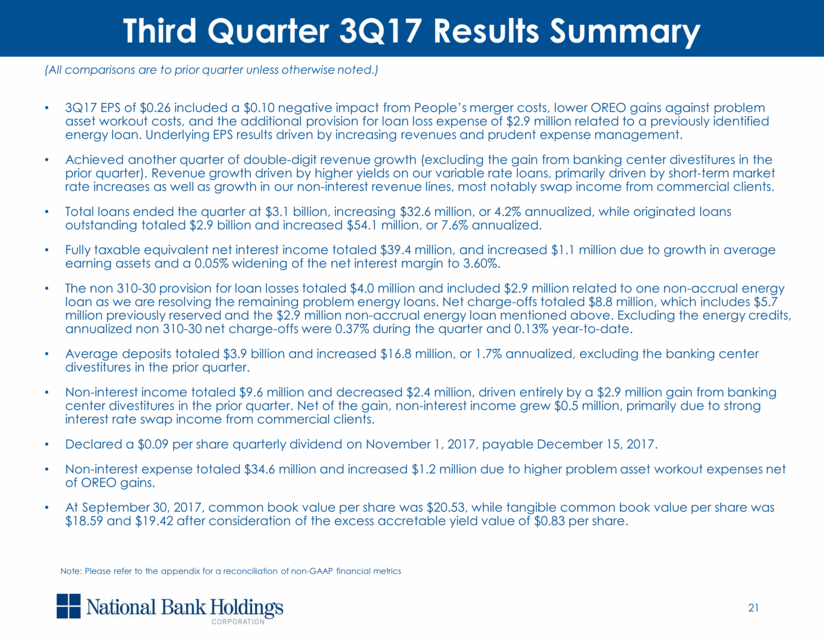
3Q17 EPS of $0.26 included a $0.10 negative impact from People’s merger costs, lower OREO gains against problem asset workout costs, and the additional provision for loan loss expense of $2.9 million related to a previously identified energy loan. Underlying EPS results driven by increasing revenues and prudent expense management. Achieved another quarter of double-digit revenue growth (excluding the gain from banking center divestitures in the prior quarter). Revenue growth driven by higher yields on our variable rate loans, primarily driven by short-term market rate increases as well as growth in our non-interest revenue lines, most notably swap income from commercial clients. Total loans ended the quarter at $3.1 billion, increasing $32.6 million, or 4.2% annualized, while originated loans outstanding totaled $2.9 billion and increased $54.1 million, or 7.6% annualized. Fully taxable equivalent net interest income totaled $39.4 million, and increased $1.1 million due to growth in average earning assets and a 0.05% widening of the net interest margin to 3.60%. The non 310-30 provision for loan losses totaled $4.0 million and included $2.9 million related to one non-accrual energy loan as we are resolving the remaining problem energy loans. Net charge-offs totaled $8.8 million, which includes $5.7 million previously reserved and the $2.9 million non-accrual energy loan mentioned above. Excluding the energy credits, annualized non 310-30 net charge-offs were 0.37% during the quarter and 0.13% year-to-date. Average deposits totaled $3.9 billion and increased $16.8 million, or 1.7% annualized, excluding the banking center divestitures in the prior quarter. Non-interest income totaled $9.6 million and decreased $2.4 million, driven entirely by a $2.9 million gain from banking center divestitures in the prior quarter. Net of the gain, non-interest income grew $0.5 million, primarily due to strong interest rate swap income from commercial clients. Declared a $0.09 per share quarterly dividend on November 1, 2017, payable December 15, 2017. Non-interest expense totaled $34.6 million and increased $1.2 million due to higher problem asset workout expenses net of OREO gains. At September 30, 2017, common book value per share was $20.53, while tangible common book value per share was $18.59 and $19.42 after consideration of the excess accretable yield value of $0.83 per share. 21 Third Quarter 3Q17 Results Summary (All comparisons are to prior quarter unless otherwise noted.) Note: Please refer to the appendix for a reconciliation of non-GAAP financial metrics |
|
|
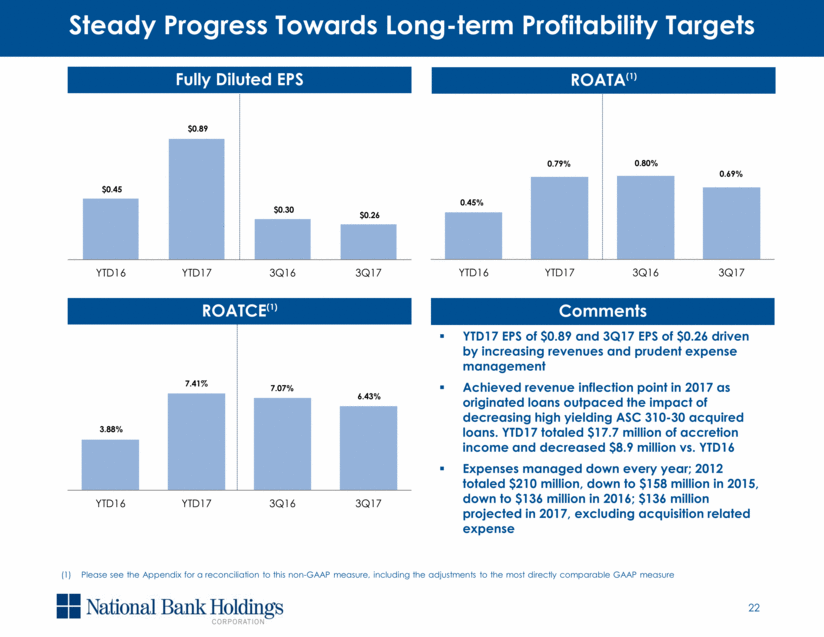
Fully Diluted EPS 22 Steady Progress Towards Long-term Profitability Targets YTD17 EPS of $0.89 and 3Q17 EPS of $0.26 driven by increasing revenues and prudent expense management Achieved revenue inflection point in 2017 as originated loans outpaced the impact of decreasing high yielding ASC 310-30 acquired loans. YTD17 totaled $17.7 million of accretion income and decreased $8.9 million vs. YTD16 Expenses managed down every year; 2012 totaled $210 million, down to $158 million in 2015, down to $136 million in 2016; $136 million projected in 2017, excluding acquisition related expense ROATA(1) 0.69% (1) Please see the Appendix for a reconciliation to this non-GAAP measure, including the adjustments to the most directly comparable GAAP measure ROATCE(1) 6.43% 7.41% 7.07% Comments $0.45 $0.89 $0.30 $0.26 YTD16 YTD17 3Q16 3Q17 YTD16 YTD17 3Q16 3Q17 0.45 % 0.79 % 0.80 % YTD16 YTD17 3Q16 3Q17 3.88 % |
|
|
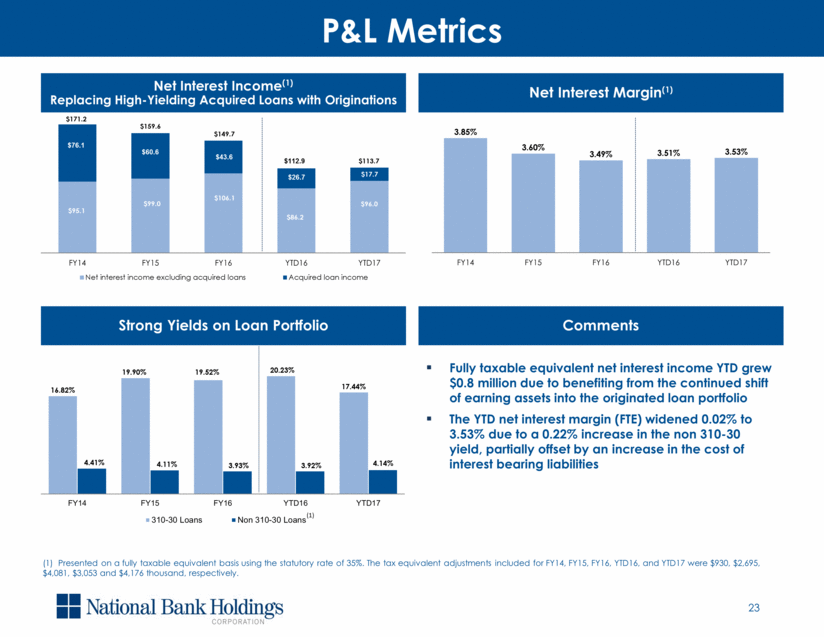
Net Interest Income(1) Replacing High-Yielding Acquired Loans with Originations 23 P&L Metrics Net Interest Margin(1) Strong Yields on Loan Portfolio Comments Fully taxable equivalent net interest income YTD grew $0.8 million due to benefiting from the continued shift of earning assets into the originated loan portfolio The YTD net interest margin (FTE) widened 0.02% to 3.53% due to a 0.22% increase in the non 310-30 yield, partially offset by an increase in the cost of interest bearing liabilities (1) Presented on a fully taxable equivalent basis using the statutory rate of 35%. The tax equivalent adjustments included for FY14, FY15, FY16, YTD16, and YTD17 were $930, $2,695, $4,081, $3,053 and $4,176 thousand, respectively. $17.7 $113.7 $96.0 $171.2 $159.6 $149.7 $95.1 $99.0 $106.1 $86.2 $76.1 $60.6 $43.6 $26.7 FY14 FY15 FY16 YTD16 YTD17 Net interest income excluding acquired loans Acquired loan income $112.9 3.85% 3.60% 3.49% 3.51% 3.53% FY14 FY15 FY16 YTD16 YTD17 16.82% 19.90% 19.52% 20.23% 17.44% 4.41% 4.11% 3.93% 3.92% 4.14% FY14 FY15 FY16 YTD16 YTD17 310-30 Loans Non 310-30 Loans (1) |
|
|
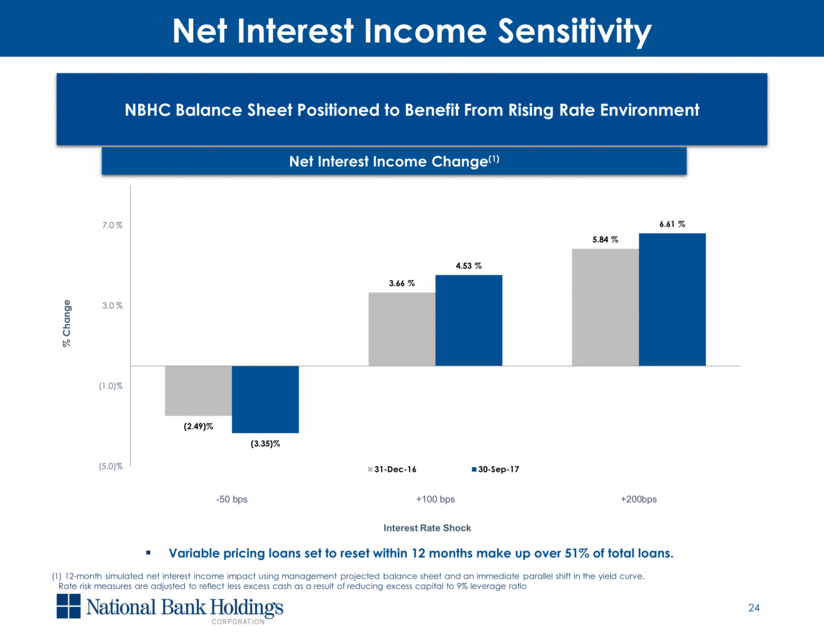
24 Net Interest Income Sensitivity NBHC Balance Sheet Positioned to Benefit From Rising Rate Environment Net Interest Income Change(1) (1) 12-month simulated net interest income impact using management projected balance sheet and an immediate parallel shift in the yield curve. Rate risk measures are adjusted to reflect less excess cash as a result of reducing excess capital to 9% leverage ratio Variable pricing loans set to reset within 12 months make up over 51% of total loans. |
|
|
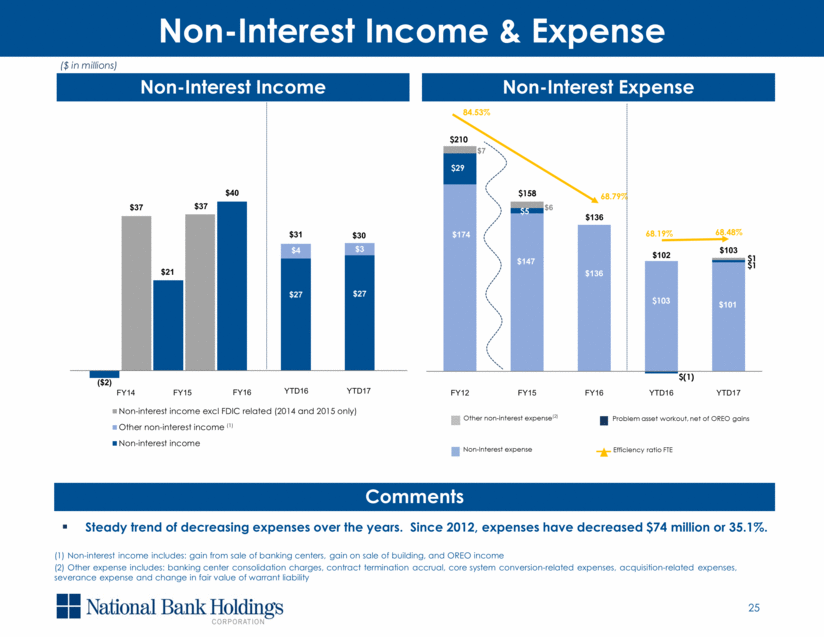
Steady trend of decreasing expenses over the years. Since 2012, expenses have decreased $74 million or 35.1%. Non-Interest Income 25 Non-Interest Income & Expense Non-Interest Expense Comments (1) Non-interest income includes: gain from sale of banking centers, gain on sale of building, and OREO income (2) Other expense includes: banking center consolidation charges, contract termination accrual, core system conversion-related expenses, acquisition-related expenses, severance expense and change in fair value of warrant liability $210 $158 $103 $29 $5 $(1) 84.53% 68.79% 68.19% 68.48% $30 FY14 FY15 FY16 YTD16 YTD17 $1 $1 $31 (1) ($ in millions) $174 $147 $136 $102 $103 $7 $6 FY12 FY15 FY16 YTD16 YTD17 $136 $101 Other non - interest expense (2) Problem asset w orkout, net of OREO gains Non - Interest expense Efficiency ratio FTE ($2) $21 $40 $27 $27 $4 $3 $37 $37 Non-interest income excl FDIC related (2014 and 2015 only) Other non-interest income Non-interest income |
|
|
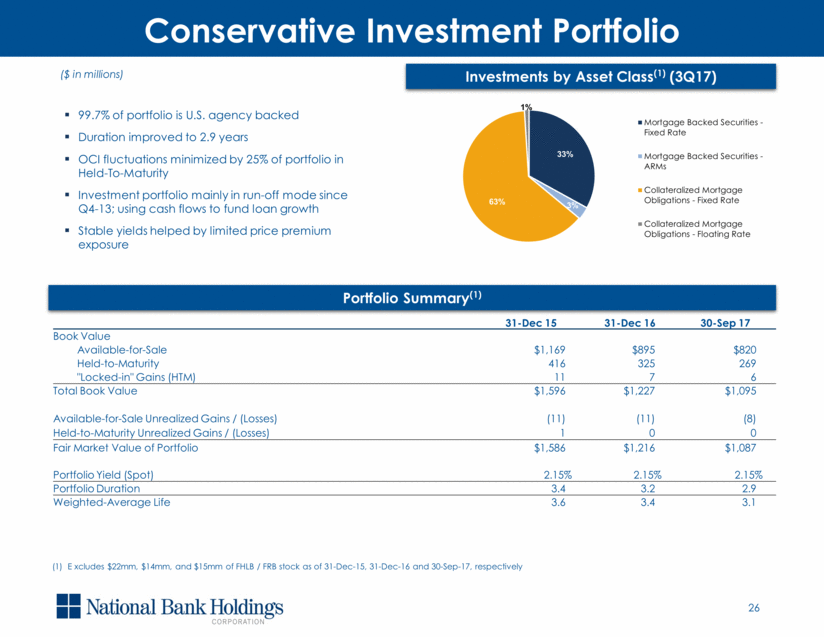
26 Conservative Investment Portfolio 99.7% of portfolio is U.S. agency backed Duration improved to 2.9 years OCI fluctuations minimized by 25% of portfolio in Held-To-Maturity Investment portfolio mainly in run-off mode since Q4-13; using cash flows to fund loan growth Stable yields helped by limited price premium exposure ($ in millions) Investments by Asset Class(1) (3Q17) Portfolio Summary(1) 31-Dec 15 31-Dec 16 30-Sep 17 Book Value Available-for-Sale $1,169 $895 $820 Held-to-Maturity 416 325 269 "Locked-in" Gains (HTM) 11 7 6 Total Book Value $1,596 $1,227 $1,095 Available-for-Sale Unrealized Gains / (Losses) (11) (11) (8) Held-to-Maturity Unrealized Gains / (Losses) 1 0 0 Fair Market Value of Portfolio $1,586 $1,216 $1,087 Portfolio Yield (Spot) 2.15% 2.15% 2.15% Portfolio Duration 3.4 3.2 2.9 Weighted-Average Life 3.6 3.4 3.1 (1) E xcludes $22mm, $14mm, and $15mm of FHLB / FRB stock as of 31-Dec-15, 31-Dec-16 and 30-Sep-17, respectively 33% 3% 63% 1% Mortgage Backed Securities - Fixed Rate Mortgage Backed Securities - ARMs Collateralized Mortgage Obligations - Fixed Rate Collateralized Mortgage Obligations - Floating Rate |
|
|
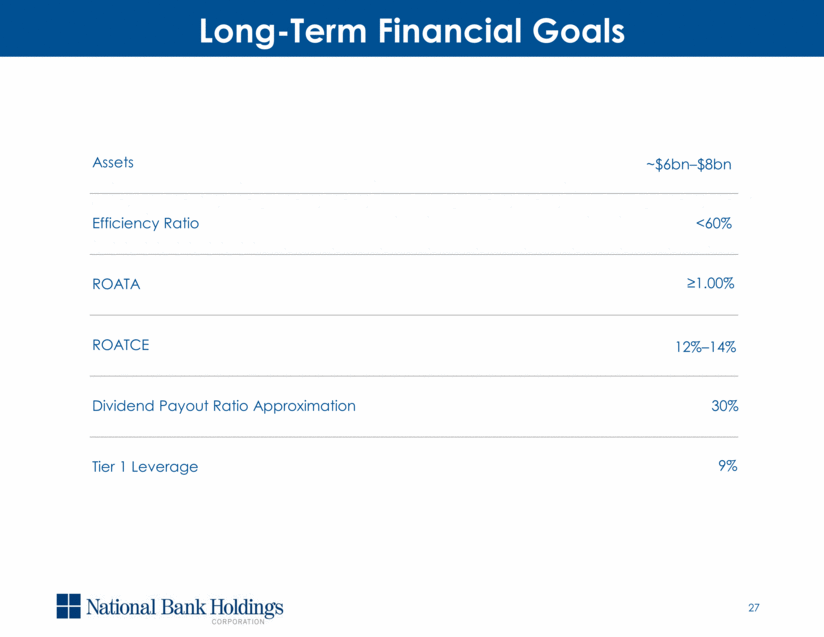
27 Long-Term Financial Goals Assets ~$6bn–$8bn Efficiency Ratio <60% ROATA ≥1.00% ROATCE 12%–14% Dividend Payout Ratio Approximation 30% Tier 1 Leverage 9% |
|
|
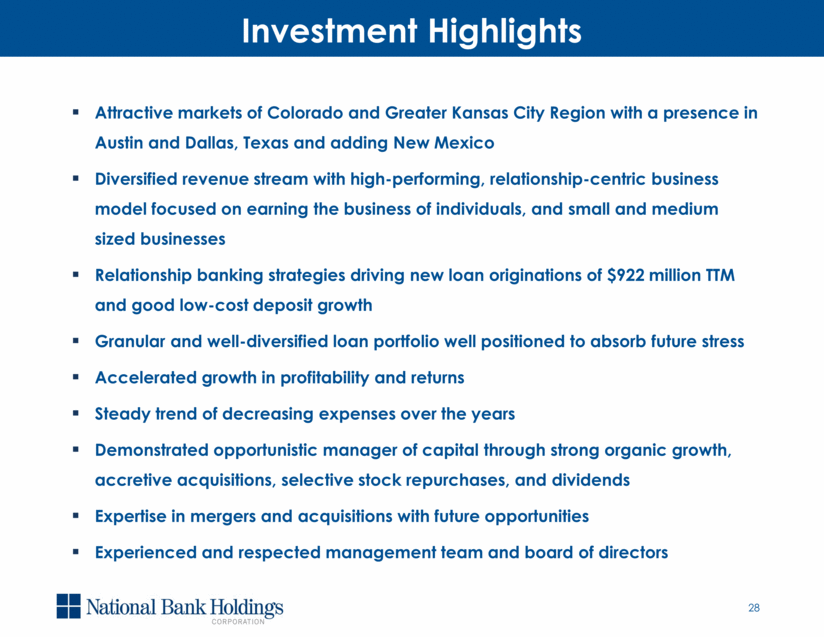
28 Investment Highlights Attractive markets of Colorado and Greater Kansas City Region with a presence in Austin and Dallas, Texas and adding New Mexico Diversified revenue stream with high-performing, relationship-centric business model focused on earning the business of individuals, and small and medium sized businesses Relationship banking strategies driving new loan originations of $922 million TTM and good low-cost deposit growth Granular and well-diversified loan portfolio well positioned to absorb future stress Accelerated growth in profitability and returns Steady trend of decreasing expenses over the years Demonstrated opportunistic manager of capital through strong organic growth, accretive acquisitions, selective stock repurchases, and dividends Expertise in mergers and acquisitions with future opportunities Experienced and respected management team and board of directors |
|
|
29 Appendix |
|
|
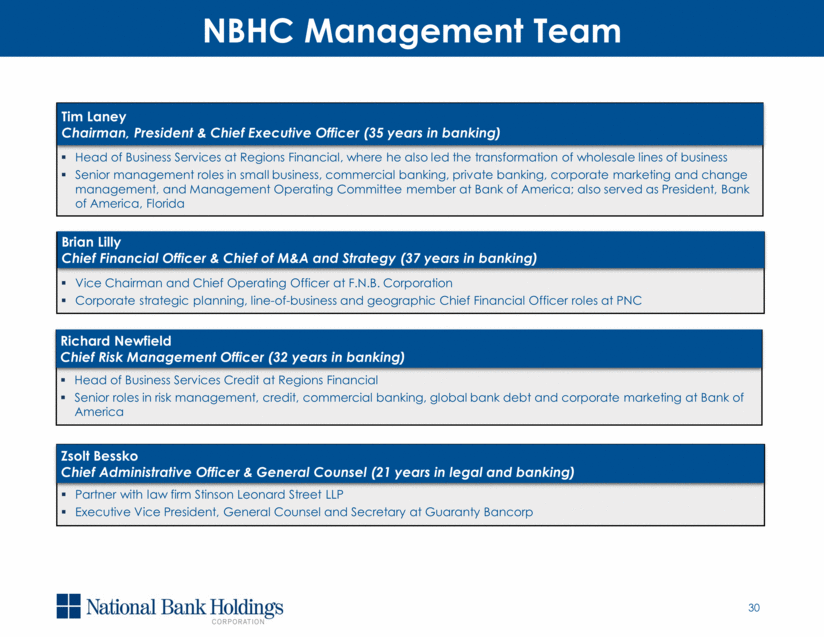
30 NBHC Management Team Head of Business Services at Regions Financial, where he also led the transformation of wholesale lines of business Senior management roles in small business, commercial banking, private banking, corporate marketing and change management, and Management Operating Committee member at Bank of America; also served as President, Bank of America, Florida Tim Laney Chairman, President & Chief Executive Officer (35 years in banking) Vice Chairman and Chief Operating Officer at F.N.B. Corporation Corporate strategic planning, line-of-business and geographic Chief Financial Officer roles at PNC Brian Lilly Chief Financial Officer & Chief of M&A and Strategy (37 years in banking) Head of Business Services Credit at Regions Financial Senior roles in risk management, credit, commercial banking, global bank debt and corporate marketing at Bank of America Richard Newfield Chief Risk Management Officer (32 years in banking) Partner with law firm Stinson Leonard Street LLP Executive Vice President, General Counsel and Secretary at Guaranty Bancorp Zsolt Bessko Chief Administrative Officer & General Counsel (21 years in legal and banking) |
|
|
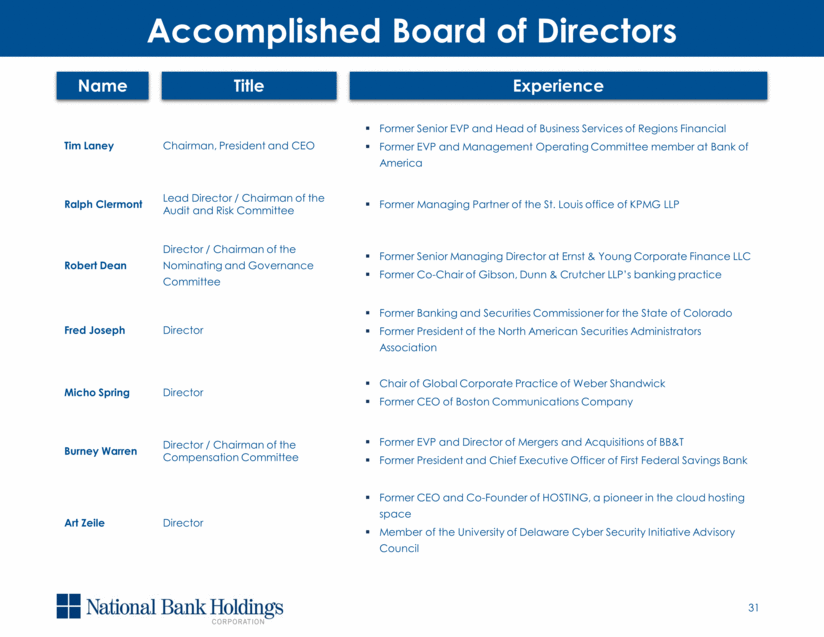
31 Accomplished Board of Directors Name Title Experience Tim Laney Chairman, President and CEO Former Senior EVP and Head of Business Services of Regions Financial Former EVP and Management Operating Committee member at Bank of America Ralph Clermont Lead Director / Chairman of the Audit and Risk Committee Former Managing Partner of the St. Louis office of KPMG LLP Robert Dean Director / Chairman of the Nominating and Governance Committee Former Senior Managing Director at Ernst & Young Corporate Finance LLC Former Co-Chair of Gibson, Dunn & Crutcher LLP’s banking practice Fred Joseph Director Former Banking and Securities Commissioner for the State of Colorado Former President of the North American Securities Administrators Association Micho Spring Director Chair of Global Corporate Practice of Weber Shandwick Former CEO of Boston Communications Company Burney Warren Director / Chairman of the Compensation Committee Former EVP and Director of Mergers and Acquisitions of BB&T Former President and Chief Executive Officer of First Federal Savings Bank Art Zeile Director Former CEO and Co-Founder of HOSTING, a pioneer in the cloud hosting space Member of the University of Delaware Cyber Security Initiative Advisory Council |
|
|
[LOGO] |
|
|
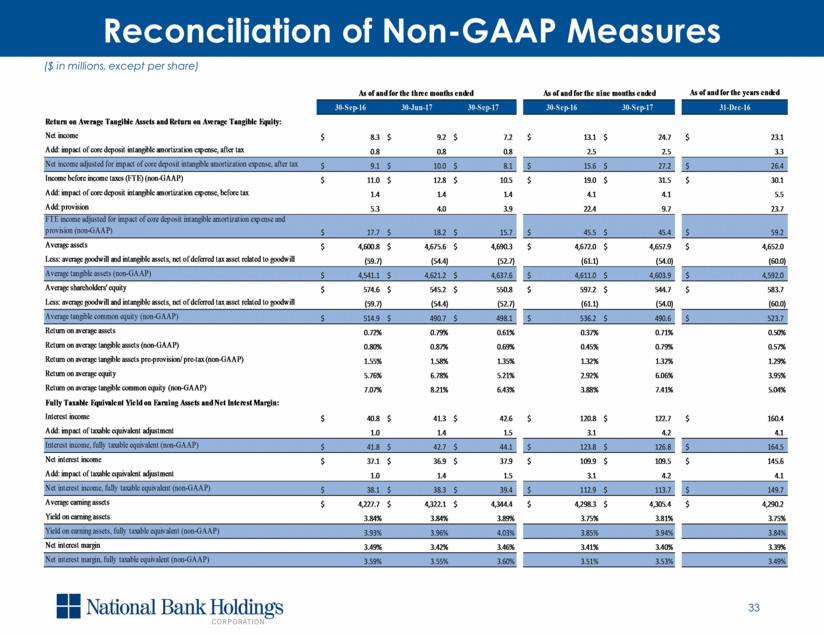
33 Reconciliation of Non-GAAP Measures ($ in millions, except per share) As of and for the years ended 30-Sep-16 30-Jun-17 30-Sep-17 30-Sep-16 30-Sep-17 31-Dec-16 Return on Average Tangible Assets and Return on Average Tangible Equity: Net income 8.3 $ 9.2 $ 7.2 $ 13.1 $ 24.7 $ 23.1 $ Add: impact of core deposit intangible amortization expense, after tax 0.8 0.8 0.8 2.5 2.5 3.3 Net income adjusted for impact of core deposit intangible amortization expense, after tax 9.1 $ 10.0 $ 8.1 $ 15.6 $ 27.2 $ 26.4 $ Income before income taxes (FTE) (non-GAAP) 11.0 $ 12.8 $ 10.5 $ 19.0 $ 31.5 $ 30.1 $ Add: impact of core deposit intangible amortization expense, before tax 1.4 1.4 1.4 4.1 4.1 5.5 Add: provision 5.3 4.0 3.9 22.4 9.7 23.7 FTE income adjusted for impact of core deposit intangible amortization expense and provision (non-GAAP) 17.7 $ 18.2 $ 15.7 $ 45.5 $ 45.4 $ 59.2 $ Average assets 4,600.8 $ 4,675.6 $ 4,690.3 $ 4,672.0 $ 4,657.9 $ 4,652.0 $ Less: average goodwill and intangible assets, net of deferred tax asset related to goodwill (59.7) (54.4) (52.7) (61.1) (54.0) (60.0) Average tangible assets (non-GAAP) 4,541.1 $ 4,621.2 $ 4,637.6 $ 4,611.0 $ 4,603.9 $ 4,592.0 $ Average shareholders' equity 574.6 $ 545.2 $ 550.8 $ 597.2 $ 544.7 $ 583.7 $ Less: average goodwill and intangible assets, net of deferred tax asset related to goodwill (59.7) (54.4) (52.7) (61.1) (54.0) (60.0) Average tangible common equity (non-GAAP) 514.9 $ 490.7 $ 498.1 $ 536.2 $ 490.6 $ 523.7 $ Return on average assets 0.72% 0.79% 0.61% 0.37% 0.71% 0.50% Return on average tangible assets (non-GAAP) 0.80% 0.87% 0.69% 0.45% 0.79% 0.57% Return on average tangible assets pre-provision/ pre-tax (non-GAAP) 1.55% 1.58% 1.35% 1.32% 1.32% 1.29% Return on average equity 5.76% 6.78% 5.21% 2.92% 6.06% 3.95% Return on average tangible common equity (non-GAAP) 7.07% 8.21% 6.43% 3.88% 7.41% 5.04% Fully Taxable Equivalent Yield on Earning Assets and Net Interest Margin: Interest income 40.8 $ 41.3 $ 42.6 $ 120.8 $ 122.7 $ 160.4 $ Add: impact of taxable equivalent adjustment 1.0 1.4 1.5 3.1 4.2 4.1 Interest income, fully taxable equivalent (non-GAAP) 41.8 $ 42.7 $ 44.1 $ 123.8 $ 126.8 $ 164.5 $ Net interest income 37.1 $ 36.9 $ 37.9 $ 109.9 $ 109.5 $ 145.6 $ Add: impact of taxable equivalent adjustment 1.0 1.4 1.5 3.1 4.2 4.1 Net interest income, fully taxable equivalent (non-GAAP) 38.1 $ 38.3 $ 39.4 $ 112.9 $ 113.7 $ 149.7 $ Average earning assets 4,227.7 $ 4,322.1 $ 4,344.4 $ 4,298.3 $ 4,305.4 $ 4,290.2 $ Yield on earning assets 3.84% 3.84% 3.89% 3.75% 3.81% 3.75% Yield on earning assets, fully taxable equivalent (non-GAAP) 3.93% 3.96% 4.03% 3.85% 3.94% 3.84% Net interest margin 3.49% 3.42% 3.46% 3.41% 3.40% 3.39% Net interest margin, fully taxable equivalent (non-GAAP) 3.59% 3.55% 3.60% 3.51% 3.53% 3.49% As of and for the three months ended As of and for the nine months ended |
|
|
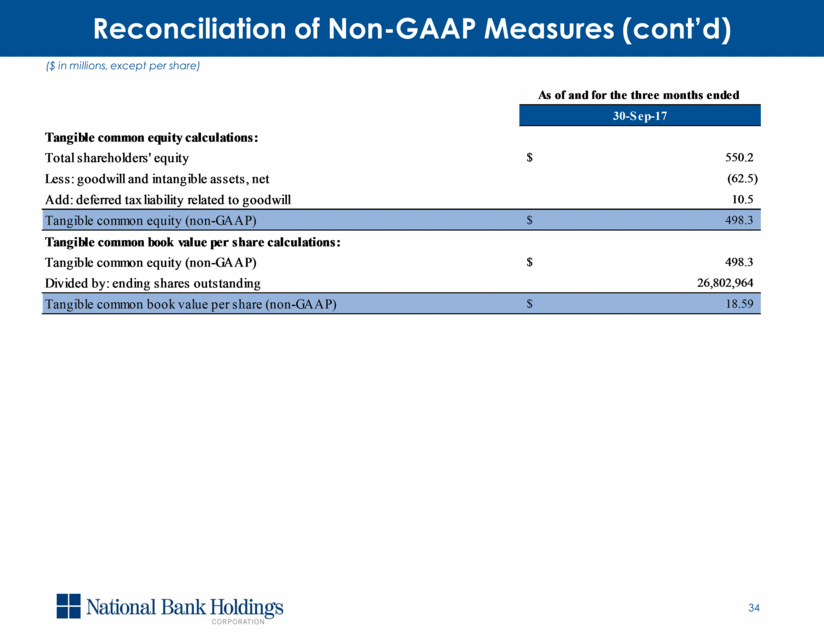
34 Reconciliation of Non-GAAP Measures (cont’d) ($ in millions, except per share) 30-Sep-17 Tangible common equity calculations: Total shareholders' equity 550.2 $ Less: goodwill and intangible assets, net (62.5) Add: deferred tax liability related to goodwill 10.5 Tangible common equity (non-GAAP) 498.3 $ Tangible common book value per share calculations: Tangible common equity (non-GAAP) 498.3 $ Divided by: ending shares outstanding 26,802,964 Tangible common book value per share (non-GAAP) 18.59 $ As of and for the three months ended |

