Attached files
| file | filename |
|---|---|
| 8-K - 8-K - Investar Holding Corp | a8-kforinvestorpresentation.htm |
1
NASDAQ: ISTR
Hovde Conference
November 2017
Exhibit 99.1
FORWARD-LOOKING STATEMENTS
2
This presentation may contain forward-looking statements within the meaning of the Private Securities
Litigation Reform Act of 1995 that reflect the Company’s current views with respect to, among other things,
future events and financial performance. The Company generally identifies forward-looking statements by
terminology such as “outlook,” “believes,” “expects,” “potential,” “continues,” “may,” “will,” “could,”
“should,” “seeks,” “approximately,” “predicts,” “intends,” “plans,” “estimates,” “anticipates,” or the negative
version of those words or other comparable words. Any forward-looking statements contained in this
presentation are based on the historical performance of the Company and its subsidiaries or on the Company’s
current plans, estimates and expectations. The inclusion of this forward-looking information should not be
regarded as a representation by the Company that the future plans, estimates or expectations by the Company
will be achieved. Such forward-looking statements are subject to various risks and uncertainties and
assumptions relating to the Company’s operations, financial results, financial condition, business prospects,
growth strategy and liquidity. If one or more of these or other risks or uncertainties materialize, or if the
Company’s underlying assumptions prove to be incorrect, the Company’s actual results may vary materially
from those indicated in these statements. The Company does not undertake any obligation to publicly update
or review any forward-looking statement, whether as a result of new information, future developments or
otherwise. A number of important factors could cause actual results to differ materially from those indicated
by the forward-looking statements. These factors include, but are not limited to, the following, any one or
more of which could materially affect the outcome of future events:
• business and economic conditions generally and in the financial services industry in particular, whether
nationally, regionally or in the markets in which we operate;
• our ability to achieve organic loan and deposit growth, and the composition of that growth;
• changes (or the lack of changes) in interest rates, yield curves and interest rate spread relationships that
affect our loan and deposit pricing;
• the extent of continuing client demand for the high level of personalized service that is a key element of
our banking approach as well as our ability to execute our strategy generally;
• our dependence on our management team, and our ability to attract and retain qualified personnel;
• changes in the quality or composition of our loan or investment portfolios, including adverse
developments in borrower industries or in the repayment ability of individual borrowers;
• inaccuracy of the assumptions and estimates we make in establishing reserves for probable loan losses and
other estimates;
• the concentration of our business within our geographic areas of operation in Louisiana; and
• concentration of credit exposure.
These factors should not be construed as exhaustive. Additional information on these and other risk factors
can be found in Item 1A. “Risk Factors” and Item 7. “Special Note Regarding Forward-Looking Statements” in
the Company’s Annual Report on Form 10-K for the year ended December 31, 2016, filed with the Securities
and Exchange Commission.
www.investarbank.com
NASDAQ: ISTR
We encourage everyone to visit the
Investors Section of our website at
www.investarbank.com, where we
have posted additional important
information such as press releases
and SEC filings.
We intend to use our website to
expedite public access to time-
critical information regarding the
Company in advance of or in lieu of
distributing a press release or a
filing with the SEC disclosing the
same information.
COMPANY PROFILE AS OF SEPTEMBER 30, 2017
3
Shares Outstanding 8,704,562 Assets $1.5 billion
Market Cap $209.8 million Net Loans $1.1 billion
Price per Share $24.10 Deposits $1.1 billion
Dividend Yield (YTD) 0.35% Tangible Equity $139.6 million
Price/ Tangible Book Value 150.2% TE/TA 9.54%
Price/LTM EPS 24.59 Net Income $5.9 million
ROAA 0.62%
ROAE 5.65%
NPAs/Assets 0.46%
Net Interest Margin 3.32%
Cost of Funds 1.05%
Market Data Financial Highlights
SENIOR MANAGEMENT
John J. D’Angelo,
President & CEO
Christopher L. Hufft,
Chief Financial Officer
• Founding President and Chief Executive Officer
• New Orleans native; graduate of Louisiana State University
• Prior to founding Investar, Mr. D’Angelo was president and director of Aegis
Lending Corporation, a mortgage lending company with operations in 46 states
and the District of Columbia
• Previously, Mr. D’Angelo held various senior positions at Hibernia National Bank
(the predecessor to Capital One Bank, N.A.), focusing on the East Baton Rouge
Parish, Louisiana, market
• Current ownership of 1.9%
• Joined the Bank in February 2014 as Chief Accounting Officer, and assumed the
role of Chief Financial Officer in October of 2015.
• Prior to joining the Bank, Mr. Hufft served for 9 years as the Vice President of
Accounting at Amedisys, Inc., a publicly-traded home health and hospice company
• Mr. Hufft, a licensed certified public accountant, also spent seven years in public
accounting, serving both public and privately-held clients in the banking,
healthcare and manufacturing sectors
• B.S. Accounting – Louisiana State University
Travis M. Lavergne,
Chief Credit Officer
• Served as Executive Vice President and Chief Credit Officer since March, 2013 and
Chief Risk Management Officer since joining in July 2012
• Prior to joining the Bank, Mr. Lavergne was a Senior Examiner at the Louisiana
Office of Financial Institutions from September 2005 to July 2012
• B.S. Finance – Louisiana State University
• M.B.A. Southeastern Louisiana University
4
ACCOMPLISHMENTS SINCE IPO
5
Since IPO in June 2014, Investar has experienced significant progress :
Completed Largest Acquisition Since Inception on July 1, 2017 and
Announced an Additional Acquisition for 2017
Shifted from Consumer Loans to C&I and CRE Focus
Maintained High Quality Organic Loan Growth
Continued to Add Experienced Bankers in Key Areas
Further Established in Four Key Louisiana Markets
Transitioned from Transactional Banking to Relationship Banking
INVESTAR TIMELINE
6
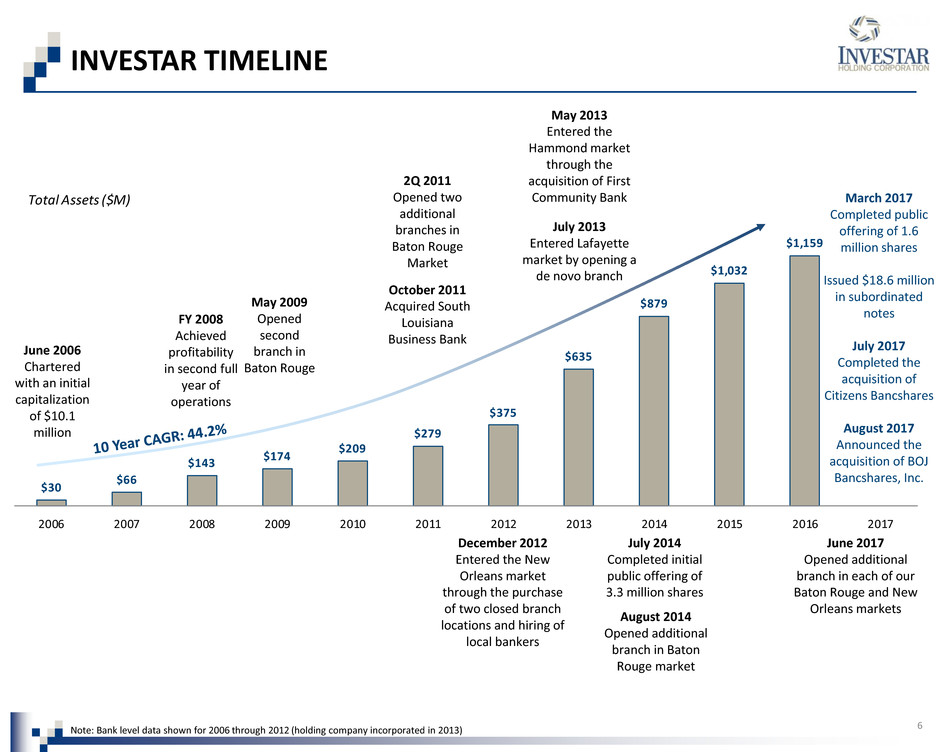
$30
$66
$143
$174
$209
$279
$375
$635
$879
$1,032
$1,159
2006 2007 2008 2009 2010 2011 2012 2013 2014 2015 2016 2017
Total Assets ($M)
March 2017
Completed public
offering of 1.6
million shares
Issued $18.6 million
in subordinated
notes
July 2017
Completed the
acquisition of
Citizens Bancshares
August 2017
Announced the
acquisition of BOJ
Bancshares, Inc.
June 2006
Chartered
with an initial
capitalization
of $10.1
million
FY 2008
Achieved
profitability
in second full
year of
operations
May 2009
Opened
second
branch in
Baton Rouge
2Q 2011
Opened two
additional
branches in
Baton Rouge
Market
October 2011
Acquired South
Louisiana
Business Bank
December 2012
Entered the New
Orleans market
through the purchase
of two closed branch
locations and hiring of
local bankers
May 2013
Entered the
Hammond market
through the
acquisition of First
Community Bank
July 2013
Entered Lafayette
market by opening a
de novo branch
July 2014
Completed initial
public offering of
3.3 million shares
August 2014
Opened additional
branch in Baton
Rouge market
Note: Bank level data shown for 2006 through 2012 (holding company incorporated in 2013)
June 2017
Opened additional
branch in each of our
Baton Rouge and New
Orleans markets
7
INVESTAR SNAPSHOT
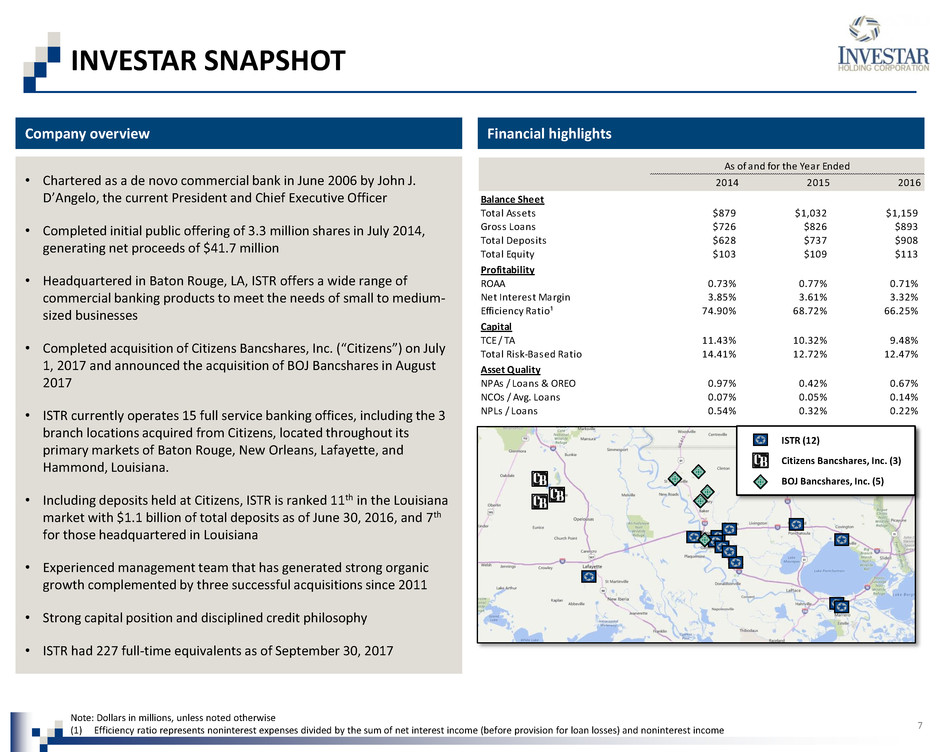
As of and for the Year Ended
2014 2015 2016
Balance Sheet
Total Assets $879 $1,032 $1,159
Gross Loans $726 $826 $893
Total Deposits $628 $737 $908
Total Equity $103 $109 $113
Profitability
ROAA 0.73% 0.77% 0.71%
Net Interest Margin 3.85% 3.61% 3.32%
Efficiency Ratio¹ 74.90% 68.72% 66.25%
Capital
TCE / TA 11.43% 10.32% 9.48%
Total Risk-Based Ratio 14.41% 12.72% 12.47%
Asset Quality
NPAs / Loans & OREO 0.97% 0.42% 0.67%
NCOs / Avg. Loans 0.07% 0.05% 0.14%
NPLs / Loans 0.54% 0.32% 0.22%
Company overview Financial highlights
• Chartered as a de novo commercial bank in June 2006 by John J.
D’Angelo, the current President and Chief Executive Officer
• Completed initial public offering of 3.3 million shares in July 2014,
generating net proceeds of $41.7 million
• Headquartered in Baton Rouge, LA, ISTR offers a wide range of
commercial banking products to meet the needs of small to medium-
sized businesses
• Completed acquisition of Citizens Bancshares, Inc. (“Citizens”) on July
1, 2017 and announced the acquisition of BOJ Bancshares in August
2017
• ISTR currently operates 15 full service banking offices, including the 3
branch locations acquired from Citizens, located throughout its
primary markets of Baton Rouge, New Orleans, Lafayette, and
Hammond, Louisiana.
• Including deposits held at Citizens, ISTR is ranked 11th in the Louisiana
market with $1.1 billion of total deposits as of June 30, 2016, and 7th
for those headquartered in Louisiana
• Experienced management team that has generated strong organic
growth complemented by three successful acquisitions since 2011
• Strong capital position and disciplined credit philosophy
• ISTR had 227 full-time equivalents as of September 30, 2017
Note: Dollars in millions, unless noted otherwise
(1) Efficiency ratio represents noninterest expenses divided by the sum of net interest income (before provision for loan losses) and noninterest income
ISTR (12)
Citizens Bancshares, Inc. (3)
BOJ Bancshares, Inc. (5)
8
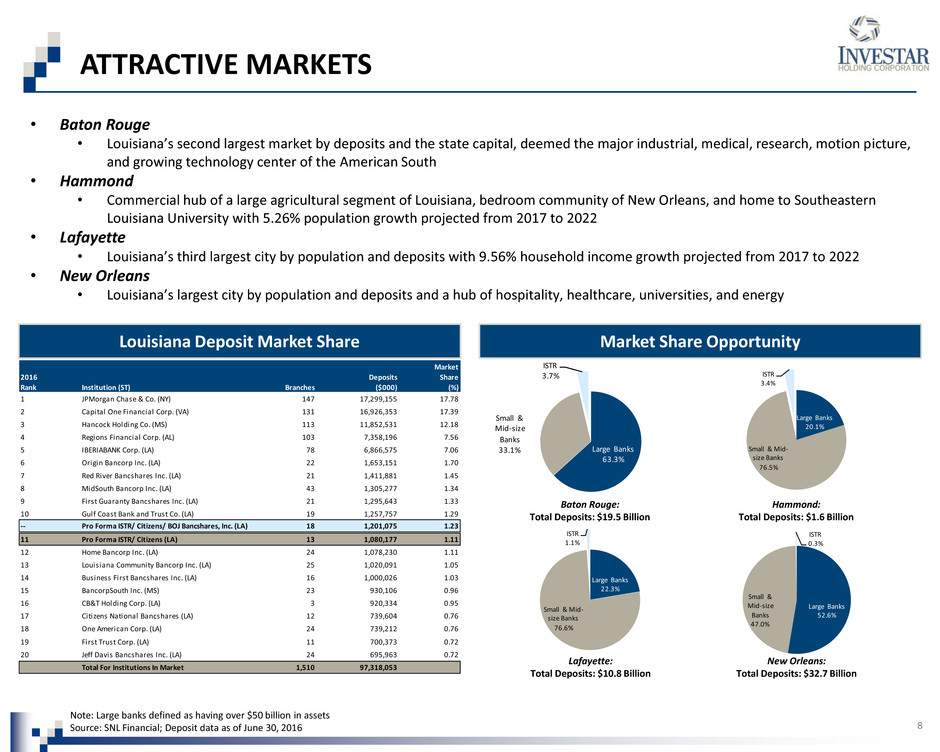
Large Banks
52.6%
Small &
Mid-size
Banks
47.0%
ISTR
0.3%
Large Banks
22.3%
Small & Mid-
size Banks
76.6%
ISTR
1.1%
Large Banks
20.1%
Small & Mid-
size Banks
76.5%
ISTR
3.4%
Large Banks
63.3%
Small &
Mid-size
Banks
33.1%
ISTR
3.7%
ATTRACTIVE MARKETS
Louisiana Deposit Market Share Market Share Opportunity
• Baton Rouge
• Louisiana’s second largest market by deposits and the state capital, deemed the major industrial, medical, research, motion picture,
and growing technology center of the American South
• Hammond
• Commercial hub of a large agricultural segment of Louisiana, bedroom community of New Orleans, and home to Southeastern
Louisiana University with 5.26% population growth projected from 2017 to 2022
• Lafayette
• Louisiana’s third largest city by population and deposits with 9.56% household income growth projected from 2017 to 2022
• New Orleans
• Louisiana’s largest city by population and deposits and a hub of hospitality, healthcare, universities, and energy
Note: Large banks defined as having over $50 billion in assets
Source: SNL Financial; Deposit data as of June 30, 2016
Baton Rouge:
Total Deposits: $19.5 Billion
Hammond:
Total Deposits: $1.6 Billion
Lafayette:
Total Deposits: $10.8 Billion
New Orleans:
Total Deposits: $32.7 Billion
2016
Rank Institution (ST) Branches
Deposits
($000)
Market
Share
(%)
1 JPMorgan Chase & Co. (NY) 147 17,299,155 17.78
2 Capital One Financial Corp. (VA) 131 16,926,353 17.39
3 Hancock Holding Co. (MS) 113 11,852,531 12.18
4 Regions Financial Corp. (AL) 103 7,358,196 7.56
5 IBERIABANK Corp. (LA) 78 6,866,575 7.06
6 Origin Bancorp Inc. (LA) 22 1,653,151 1.70
7 Red River Bancshares Inc. (LA) 21 1,411,881 1.45
8 MidSouth Bancorp Inc. (LA) 43 1,305,277 1.34
9 First Guaranty Bancshares Inc. (LA) 21 1,295,643 1.33
10 Gulf Coast Bank and Trust Co. (LA) 19 1,257,757 1.29
-- Pro Forma ISTR/ Citizens/ BOJ Bancshares, Inc. (LA) 18 1,201,075 1.23
11 Pro Forma ISTR/ Citizens (LA) 13 1,080,177 1.11
12 Home Bancorp Inc. (LA) 24 1,078,230 1.11
13 Louisiana Community Bancorp Inc. (LA) 25 1,020,091 1.05
14 Business First Bancshares Inc. (LA) 16 1,000,026 1.03
15 BancorpSouth Inc. (MS) 23 930,106 0.96
16 CB&T Hol ing Corp. (LA) 3 920,334 0.95
17 Citizens National Bancshares (LA) 12 739,604 0.76
18 One American Corp. (LA) 24 739,212 0.76
19 First Trust C rp. (LA) 11 700,373 0.72
20 Jeff Davis Bancshares Inc. (LA) 24 695,963 0.72
Total For Institutions In Market 1,510 97,318,053
OPPORTUNISTIC ACQUISITIONS COMPLETED
9
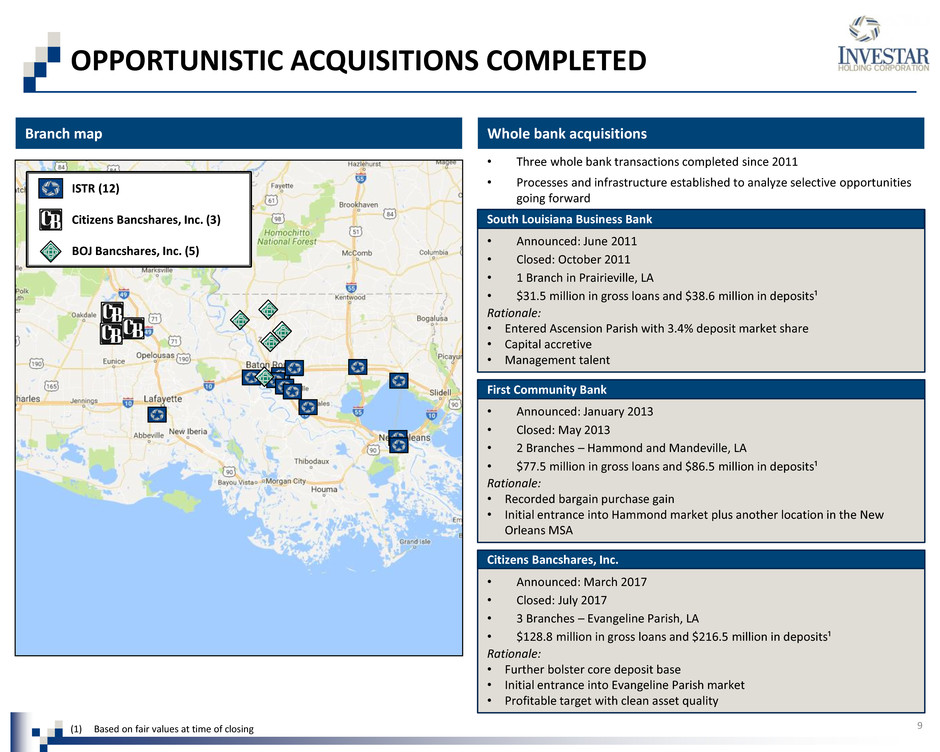
• Three whole bank transactions completed since 2011
• Processes and infrastructure established to analyze selective opportunities
going forward
• Announced: June 2011
• Closed: October 2011
• 1 Branch in Prairieville, LA
• $31.5 million in gross loans and $38.6 million in deposits¹
Rationale:
• Entered Ascension Parish with 3.4% deposit market share
• Capital accretive
• Management talent
South Louisiana Business Bank
• Announced: January 2013
• Closed: May 2013
• 2 Branches – Hammond and Mandeville, LA
• $77.5 million in gross loans and $86.5 million in deposits¹
Rationale:
• Recorded bargain purchase gain
• Initial entrance into Hammond market plus another location in the New
Orleans MSA
First Community Bank
Branch map Whole bank acquisitions
(1) Based on fair values at time of closing
ISTR (12)
Citizens Bancshares, Inc. (3)
BOJ Bancshares, Inc. (5)
• Announced: March 2017
• Closed: July 2017
• 3 Branches – Evangeline Parish, LA
• $128.8 million in gross loans and $216.5 million in deposits¹
Rationale:
• Further bolster core deposit base
• Initial entrance into Evangeline Parish market
• Profitable target with clean asset quality
Citizens Bancshares, Inc.
10
RECENTLY COMPLETED ACQUISITION OF CITIZENS BANCSHARES, INC.
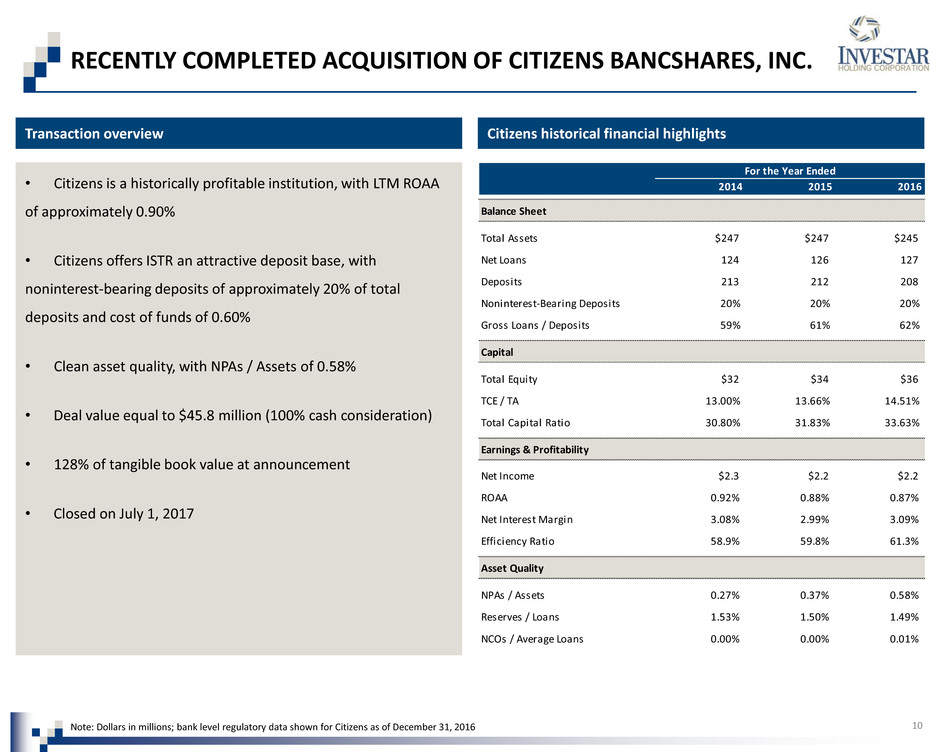
• Citizens is a historically profitable institution, with LTM ROAA
of approximately 0.90%
• Citizens offers ISTR an attractive deposit base, with
noninterest-bearing deposits of approximately 20% of total
deposits and cost of funds of 0.60%
• Clean asset quality, with NPAs / Assets of 0.58%
• Deal value equal to $45.8 million (100% cash consideration)
• 128% of tangible book value at announcement
• Closed on July 1, 2017
Transaction overview Citizens historical financial highlights
For the Year Ended
2014 2015 2016
Balance Sheet
Total Assets $247 $247 $245
Net Loans 124 126 127
Deposits 213 212 208
Noninterest-Bearing Deposits 20% 20% 20%
Gross Loans / Deposits 59% 61% 62%
Capital
Total Equity $32 $34 $36
TCE / TA 13.00% 13.66% 14.51%
Total Capital Ratio 30.80% 31.83% 33.63%
Earnings & Profitability
Net Income $2.3 $2.2 $2.2
ROAA 0.92% 0.88% 0.87%
Net Interest Margin 3.08% 2.99% 3.09%
Efficiency Ratio 58.9% 59.8% 61.3%
Asset Quality
NPAs / Assets 0.27% 0.37% 0.58%
Reserves / Loans 1.53% 1.50% 1.49%
NCOs / Average Loans 0.00% 0.00% 0.01%
Note: Dollars in millions; bank level regulatory data shown for Citizens as of December 31, 2016

For the Year Ended
2014 2015 2016
Balance Sheet
Total Assets $140 $137 $155
Net Loans 100 97 106
Deposits 122 119 130
Noninterest-Bearing Deposits 22% 23% 28%
Gross Loans / Deposits 83% 82% 82%
Capital
Total Equity $17 $18 $19
TCE / TA 12.31% 13.11% 12.13%
Total Capital Ratio 20.01% 21.22% 19.71%
Earnings & Profitability
Net Income³ $1.3 $0.9 $1.3
ROAA³ 0.96% 0.65% 0.88%
Net Interest Margin 4.02% 3.87% 3.84%
Efficiency Ratio 64.2% 64.7% 65.5%
Asset Quality
NPAs / Assets 1.32% 1.31% 1.89%
Reserves / Loans 1.02% 1.03% 0.90%
NCOs / Average Loans 0.28% 0.74% 0.21%
11
RECENTLY ANNOUNCED ACQUISITION OF BOJ BANCSHARES, INC.
• ISTR announced the acquisition of BOJ Bancshares, Inc., a $150
million asset bank headquartered in Louisiana, on August 7,
2017
– Expansion into East Baton Rouge Parishes, East Feliciana
Parishes, and West Feliciana Parishes
– BOJ bolsters ISTR's core deposit base, with noninterest-
bearing deposits of approximately 27% of total deposits and
cost of funds of 0.60%
– BOJ has historically strong margins with NIM of 3.83% and
yield on loans of 5.40%
• Deal value equal to $22.8 million¹ ($3.95 million of cash and
799,559 shares of ISTR common stock²)
• Expected closing fourth quarter of 2017
Transaction overview BOJ historical financial highlights
(1) Based on ISTR closing price of $23.55 on October 17, 2017
(2) Subject to adjustment based upon fluctuations in ISTR's average closing price for the ten consecutive trading days prior to the closing date
(3) S-Corp profitability adjusted for taxes assuming 35.0% tax rate
Note: Dollars in millions; bank level regulatory data shown for BOJ as of June 30, 2017
12
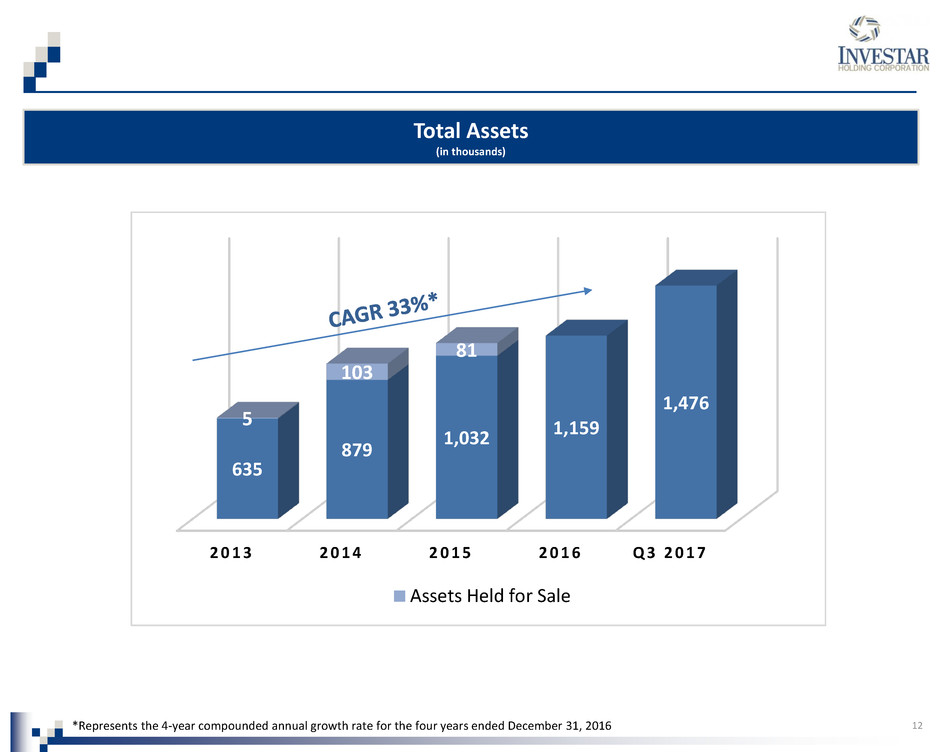
Total Assets
(in thousands)
*Represents the 4-year compounded annual growth rate for the four years ended December 31, 2016
2 0 1 3 2 0 1 4 2 0 1 5 2 0 1 6 Q 3 2 0 1 7
635
879
1,032 1,159
1,476
5
103
81
Assets Held for Sale
13
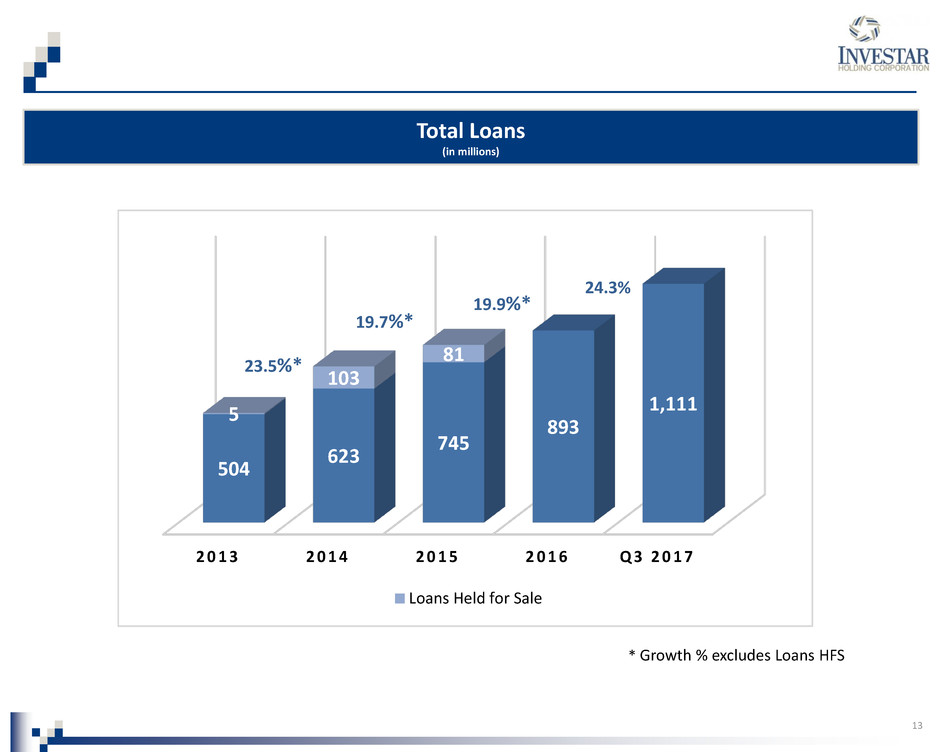
Total Loans oan
(in millions)
* Growth % excludes Loans HFS
2 0 1 3 2 0 1 4 2 0 1 5 2 0 1 6 Q 3 2 0 1 7
504
623
745
893
1,1115
103
81
Loans Held for Sale
23.5%*
19.7%*
19.9%*
24.3%
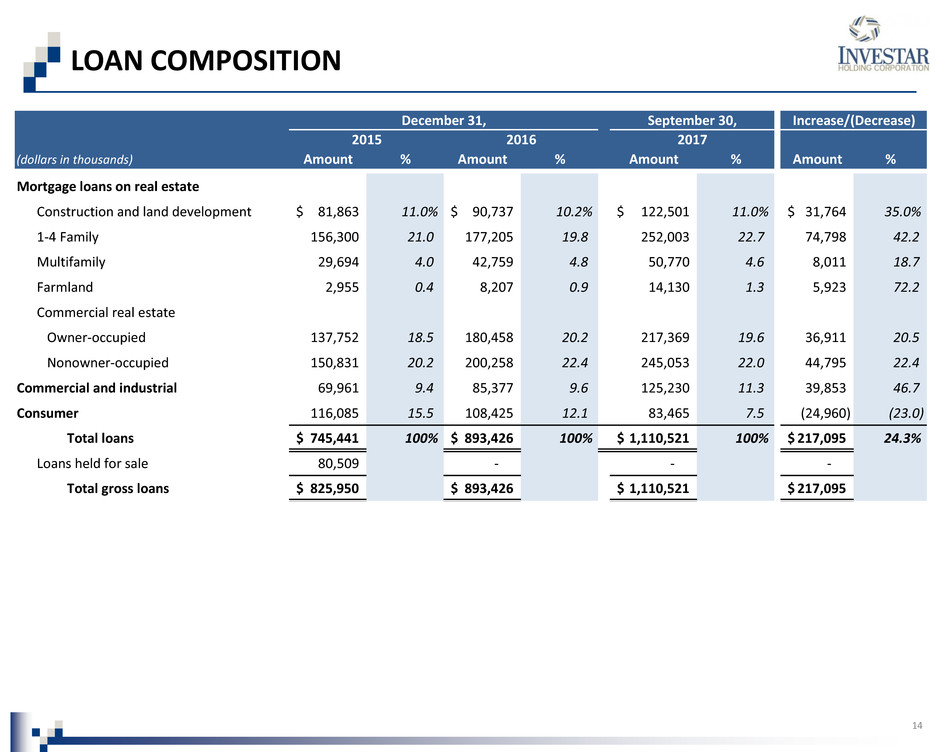
LOAN COMPOSITION
14
(dollars in thousands) Amount % Amount % Amount % Amount %
Mortgage loans on real estate
Construction and land development 81,863$ 11.0% 90,737$ 10.2% 122,501$ 11.0% 31,764$ 35.0%
1-4 Family 156,300 21.0 177,205 19.8 252,003 22.7 74,798 42.2
Multifamily 29,694 4.0 42,759 4.8 50,770 4.6 8,011 18.7
Farmland 2,955 0.4 8,207 0.9 14,130 1.3 5,923 72.2
Commercial real estate
Owner-occupied 137,752 18.5 180,458 20.2 217,369 19.6 36,911 20.5
Nonowner-occupied 150,831 20.2 200,258 22.4 245,053 22.0 44,795 22.4
Commercial and industrial 69,961 9.4 85,377 9.6 125,230 11.3 39,853 46.7
Consumer 116,085 15.5 108,425 12.1 83,465 7.5 (24,960) (23.0)
Total loans 745,441$ 100% 893,426$ 100% 1,110,521$ 100% 217,095$ 24.3%
Loans held for sale 80,509 - - -
Total gross loans 825,950$ 893,426$ 1,110,521$ 217,095$
Increase/(Decrease)
2015 2016
December 31, September 30,
2017
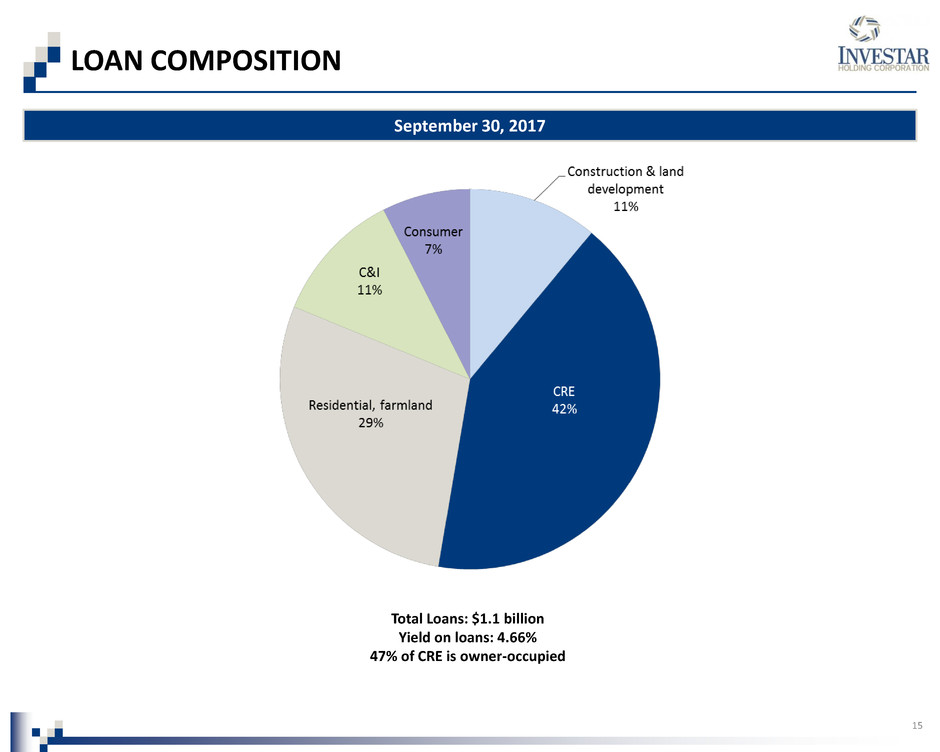
LOAN COMPOSITION
September 30, 2017
15
Total Loans: $1.1 billion
Yield on loans: 4.66%
47% of CRE is owner-occupied

LOAN COMPOSITION
Business Lending Portfolio1
16 (1) Business lending portfolio includes owner-occupied CRE and C&I loans as of September 30, 2017
Total Business Lending Portfolio1:
$342.6 million
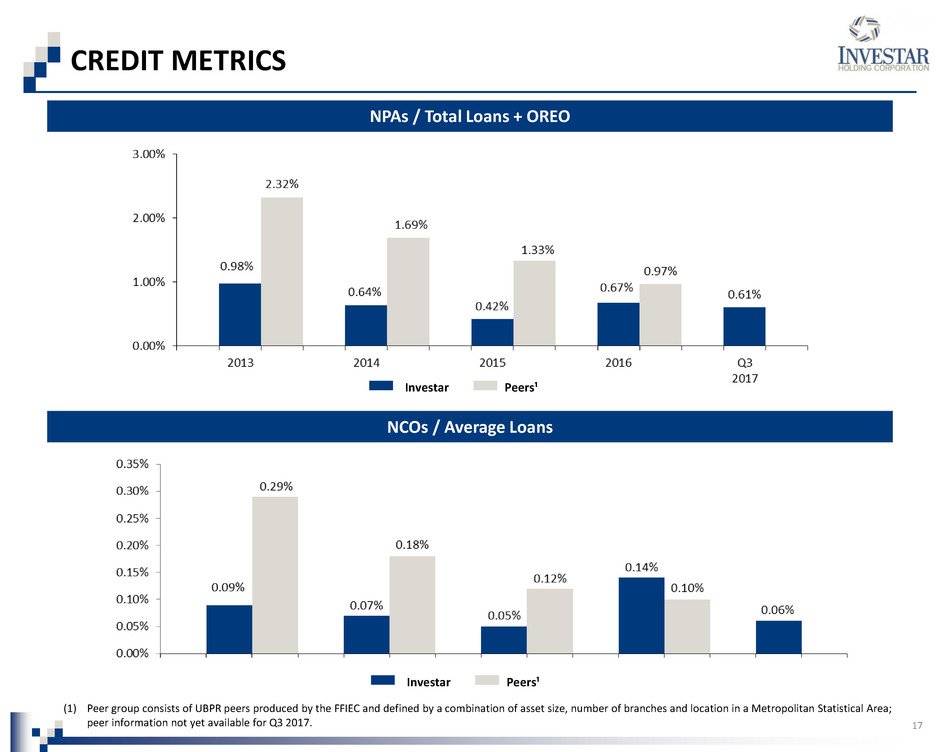
CREDIT METRICS
17
NPAs / Total Loans + OREO
NCOs / Average Loans
Peers¹ Investar
Peers¹ Investar
(1) Peer group consists of UBPR peers produced by the FFIEC and defined by a combination of asset size, number of branches and location in a Metropolitan Statistical Area;
peer information not yet available for Q3 2017.

(1) Total loans excludes loans held for sale, if applicable, allowance for loan losses, and acquired loans
DISCIPLINED LENDING
18
At September 30, 2017:
• Reserves / Total Loans¹: 0.77%
Reserves / Total Loans¹
Reserves / NPLs Provision Expense / NCOs
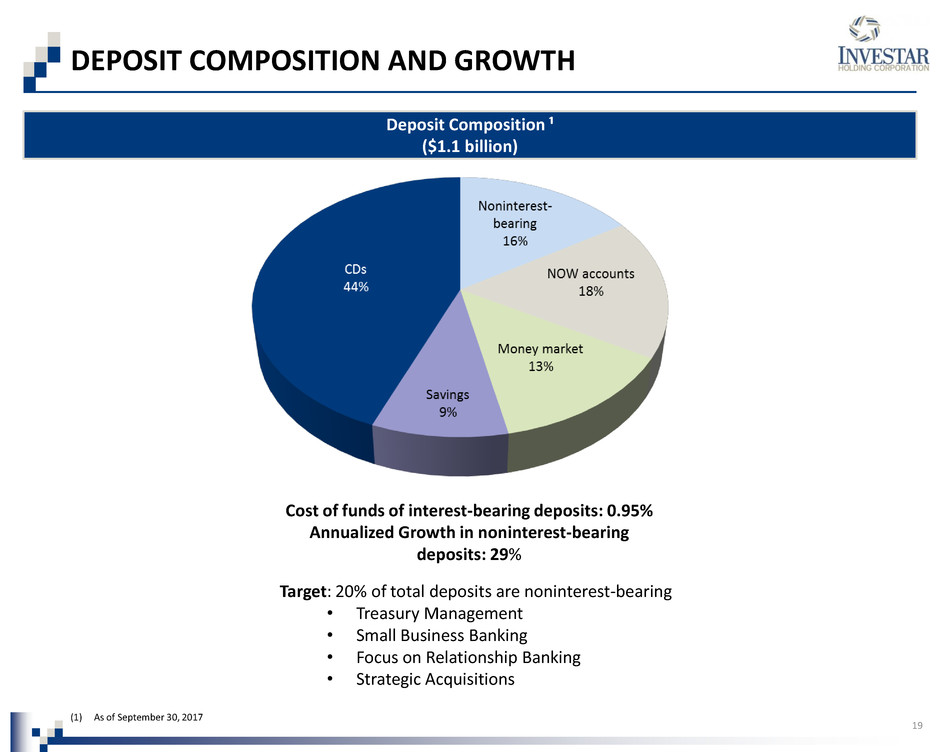
DEPOSIT COMPOSITION AND GROWTH
Deposit Composition ¹
($1.1 billion)
Target: 20% of total deposits are noninterest-bearing
• Treasury Management
• Small Business Banking
• Focus on Relationship Banking
• Strategic Acquisitions
(1) As of September 30, 2017
Cost of funds of interest-bearing deposits: 0.95%
Annualized Growth in noninterest-bearing
deposits: 29%
19
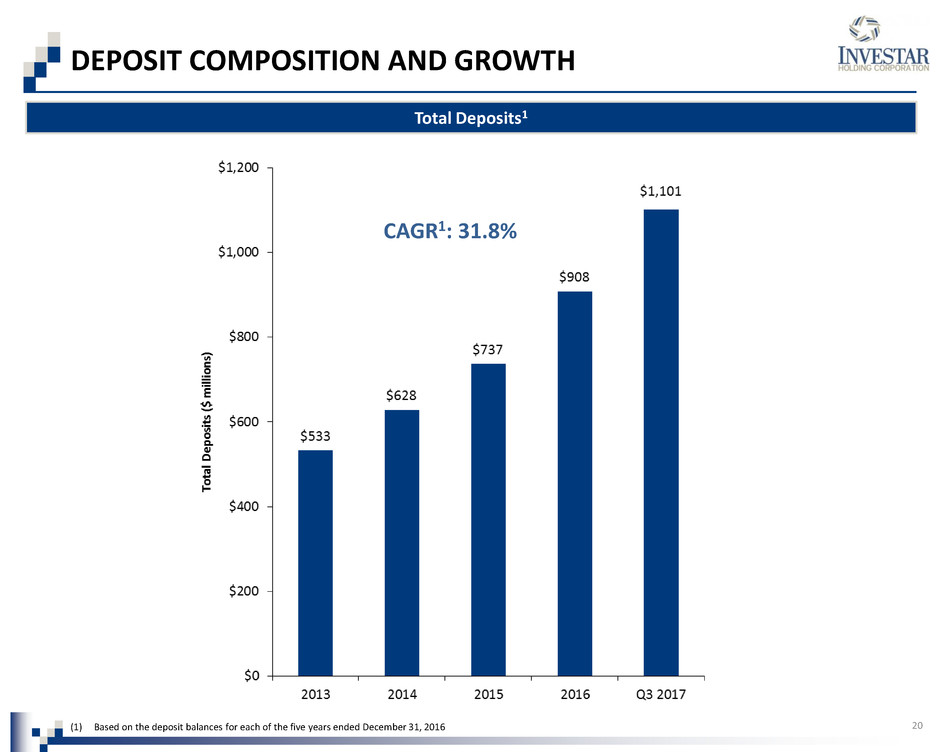
DEPOSIT COMPOSITION AND GROWTH
Total Deposits1
(1) Based on the deposit balances for each of the five years ended December 31, 2016 20
CAGR1: 31.8%
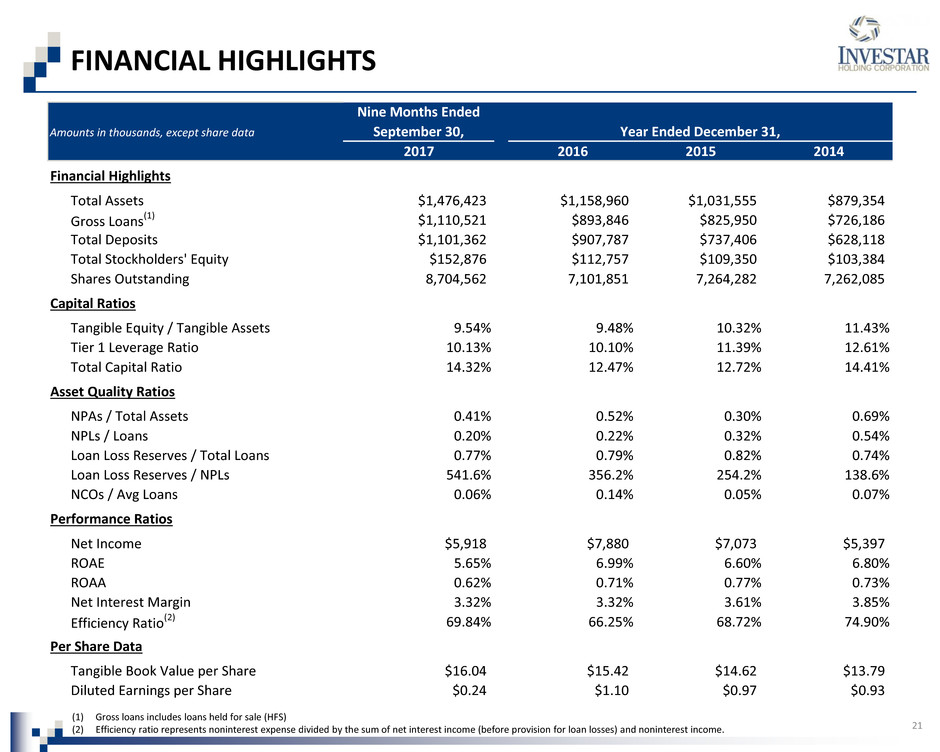
FINANCIAL HIGHLIGHTS
21
(1) Gross loans includes loans held for sale (HFS)
(2) Efficiency ratio represents noninterest expense divided by the sum of net interest income (before provision for loan losses) and noninterest income.
Amounts in thousands, except share data
Nine Months Ended
September 30,
2017 2016 2015 2014
Financial Highlights
Total Assets $1,476,423 $1,158,960 $1,031,555 $879,354
Gross Loans(1) $1,110,521 $893,846 $825,950 $726,186
Total Deposits $1,101,362 $907,787 $737,406 $628,118
Total Stockholders' Equity $152,876 $112,757 $109,350 $103,384
Shares Outstanding 8,704,562 7,101,851 7,264,282 7,262,085
Capital Ratios
Tangible Equity / Tangible Assets 9.54% 9.48% 10.32% 11.43%
Tier 1 Leverage Ratio 10.13% 10.10% 11.39% 12.61%
Total Capital Ratio 14.32% 12.47% 12.72% 14.41%
Asset Quality Ratios
NPAs / Total Assets 0.41% 0.52% 0.30% 0.69%
NPLs / Loans 0.20% 0.22% 0.32% 0.54%
Loan Loss Reserves / Total Loans 0.77% 0.79% 0.82% 0.74%
Loan Loss Reserves / NPLs 541.6% 356.2% 254.2% 138.6%
NCOs / Avg Loans 0.06% 0.14% 0.05% 0.07%
Performance Ratios
Net Income $5,918 $7,880 $7,073 $5,397
ROAE 5.65% 6.99% 6.60% 6.80%
ROAA 0.62% 0.71% 0.77% 0.73%
Net Interest Margin 3.32% 3.32% 3.61% 3.85%
Efficiency Ratio
(2) 69.84% 66.25% 68.72% 74.90%
Per Share Data
Tangible Book Value per Share $16.04 $15.42 $14.62 $13.79
Diluted Earnings per Share $0.24 $1.10 $0.97 $0.93
Year Ended December 31,

PERFORMANCE METRICS
22
Net Interest Margin
N
e
t
In
te
re
st
M
ar
gi
n
(
%
)
(1) Return on average assets was adjusted for the bargain purchase gain recognized in 2013, and the net effect of the Company’s investment in a tax credit entity recognized in 2014.
Return on Average Assets
R
O
A
A
(
%
)1

PERFORMANCE METRICS
23
Expense Ratios
C
o
re
E
ff
ic
ie
n
cy
R
atio
(
%
)
N
o
n
in
te
re
st
E
xp
e
n
se
/
A
vg
.
A
ssets
(
%
)
September 30,
2013 2014 2015 2016 2017
Employees 167 179 165 152 227
Locations 10 11 11 10 15
December 31,
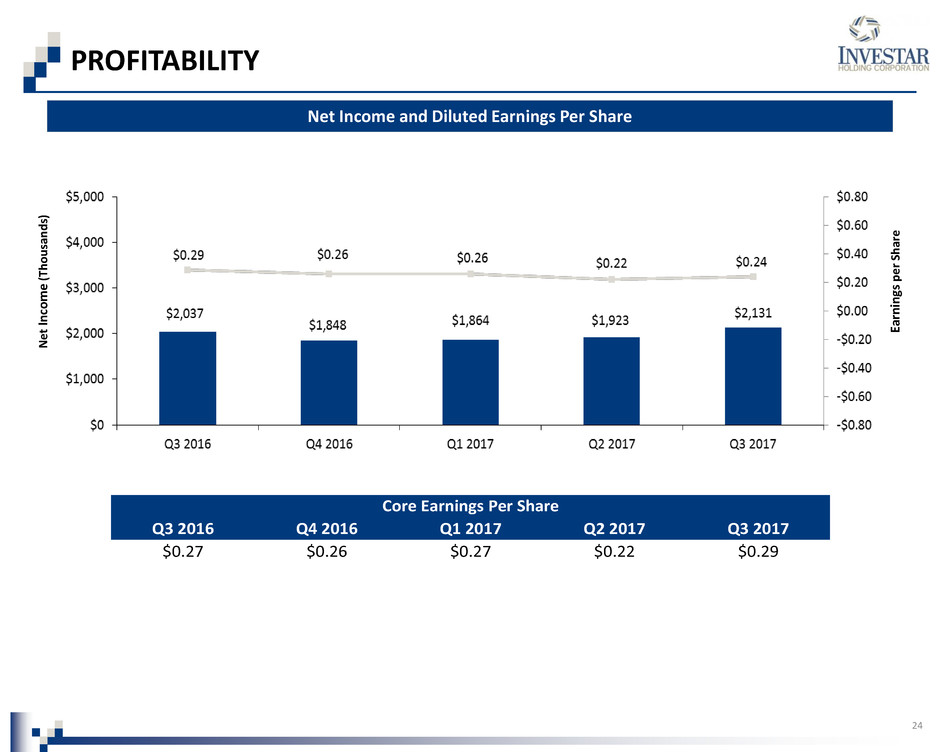
PROFITABILITY
24
Net Income and Diluted Earnings Per Share
N
e
t
Inc
o
m
e
(T
h
o
u
sa
n
d
s)
Ea
rn
in
gs
p
e
r
Sh
ar
e
Q3 2016 Q4 2016 Q1 2017 Q2 2017 Q3 2017
$0.27 $0.26 $0.27 $0.22 $0.29
Core Earnings Per Share
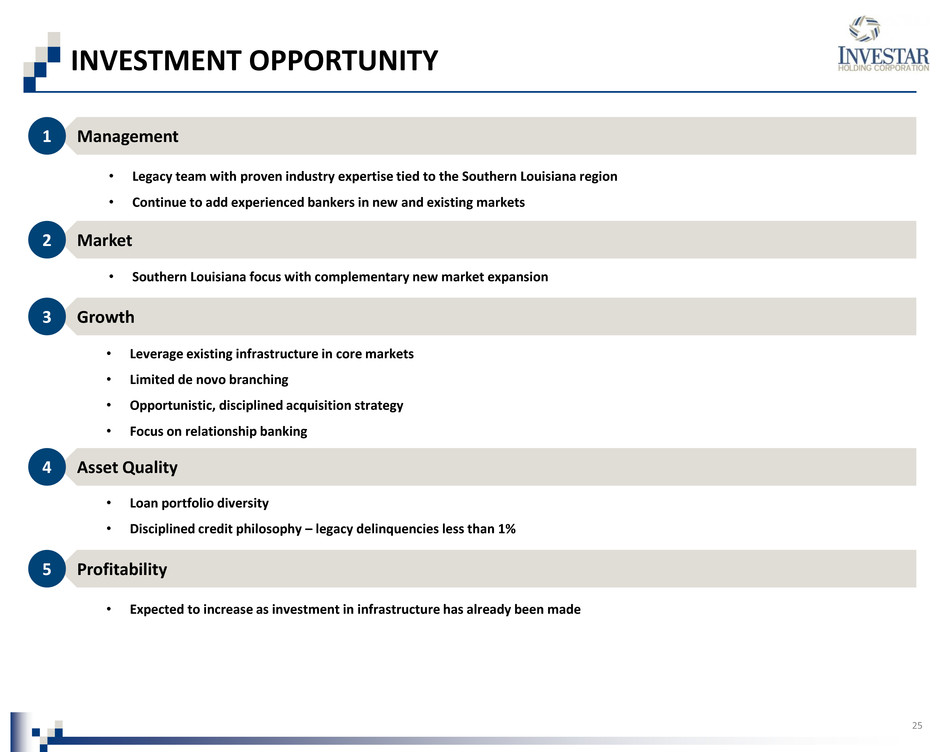
INVESTMENT OPPORTUNITY
25
Management 1
Market 2
Growth 3
Asset Quality 4
Profitability 5
• Legacy team with proven industry expertise tied to the Southern Louisiana region
• Continue to add experienced bankers in new and existing markets
• Southern Louisiana focus with complementary new market expansion
• Loan portfolio diversity
• Disciplined credit philosophy – legacy delinquencies less than 1%
• Expected to increase as investment in infrastructure has already been made
• Leverage existing infrastructure in core markets
• Limited de novo branching
• Opportunistic, disciplined acquisition strategy
• Focus on relationship banking
26
APPENDIX
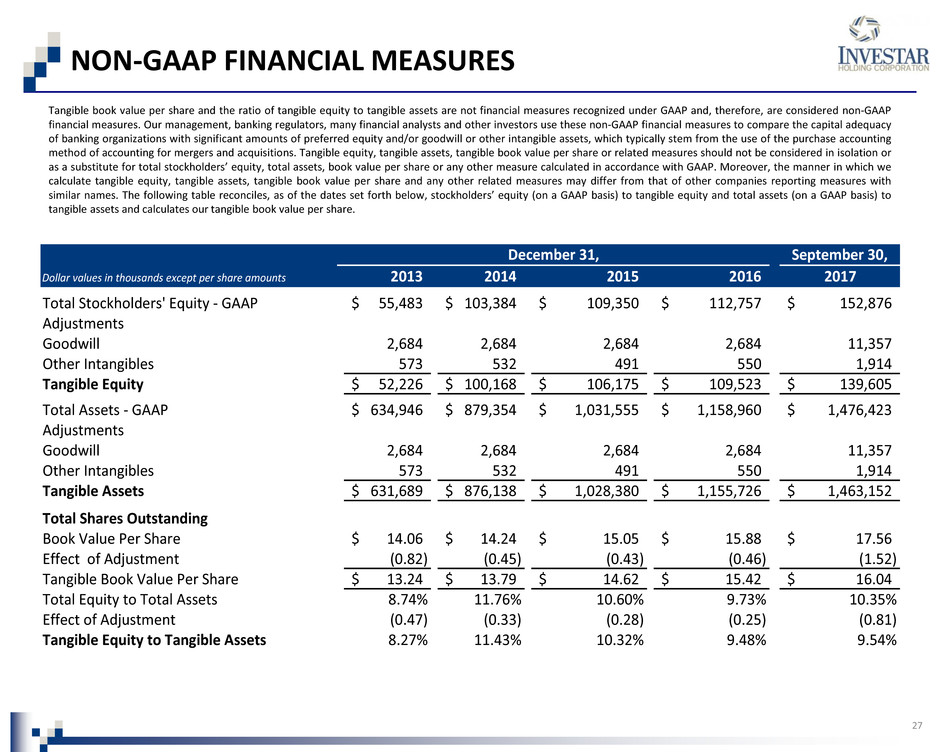
NON-GAAP FINANCIAL MEASURES
27
Tangible book value per share and the ratio of tangible equity to tangible assets are not financial measures recognized under GAAP and, therefore, are considered non-GAAP
financial measures. Our management, banking regulators, many financial analysts and other investors use these non-GAAP financial measures to compare the capital adequacy
of banking organizations with significant amounts of preferred equity and/or goodwill or other intangible assets, which typically stem from the use of the purchase accounting
method of accounting for mergers and acquisitions. Tangible equity, tangible assets, tangible book value per share or related measures should not be considered in isolation or
as a substitute for total stockholders’ equity, total assets, book value per share or any other measure calculated in accordance with GAAP. Moreover, the manner in which we
calculate tangible equity, tangible assets, tangible book value per share and any other related measures may differ from that of other companies reporting measures with
similar names. The following table reconciles, as of the dates set forth below, stockholders’ equity (on a GAAP basis) to tangible equity and total assets (on a GAAP basis) to
tangible assets and calculates our tangible book value per share.
Dollar values in thousands except per share amounts 2013 2014 2015 2016 2017
Total Stockholders' Equity - GAAP 55,483$ 103,384$ 109,350$ 112,757$ 152,876$
Adjustments
Goodwill 2,684 2,684 2,684 2,684 11,357
Other Intangibles 573 532 491 550 1,914
Tangible Equity 52,226$ 100,168$ 106,175$ 109,523$ 139,605$
Total Assets - GAAP 634,946$ 879,354$ 1,031,555$ 1,158,960$ 1,476,423$
Adjustments
Goodwill 2,684 2,684 2,684 2,684 11,357
Other Intangibles 573 532 491 550 1,914
Tangible Assets 631,689$ 876,138$ 1,028,380$ 1,155,726$ 1,463,152$
T t l S O tstanding
Book Value Per Share 14.06$ 14.24$ 15.05$ 15.88$ 17.56$
Effect of Adjustment (0.82) (0.45) (0.43) (0.46) (1.52)
Tangible Book Value Per Share 13.24$ 13.79$ 14.62$ 15.42$ 16.04$
Total Equity to Total Assets 8.74% 11.76% 10.60% 9.73% 10.35%
Effect of Adjustment (0.47) (0.33) (0.28) (0.25) (0.81)
Tangible Equity to Tangible Assets 8.27% 11.43% 10.32% 9.48% 9.54%
September 30,December 31,
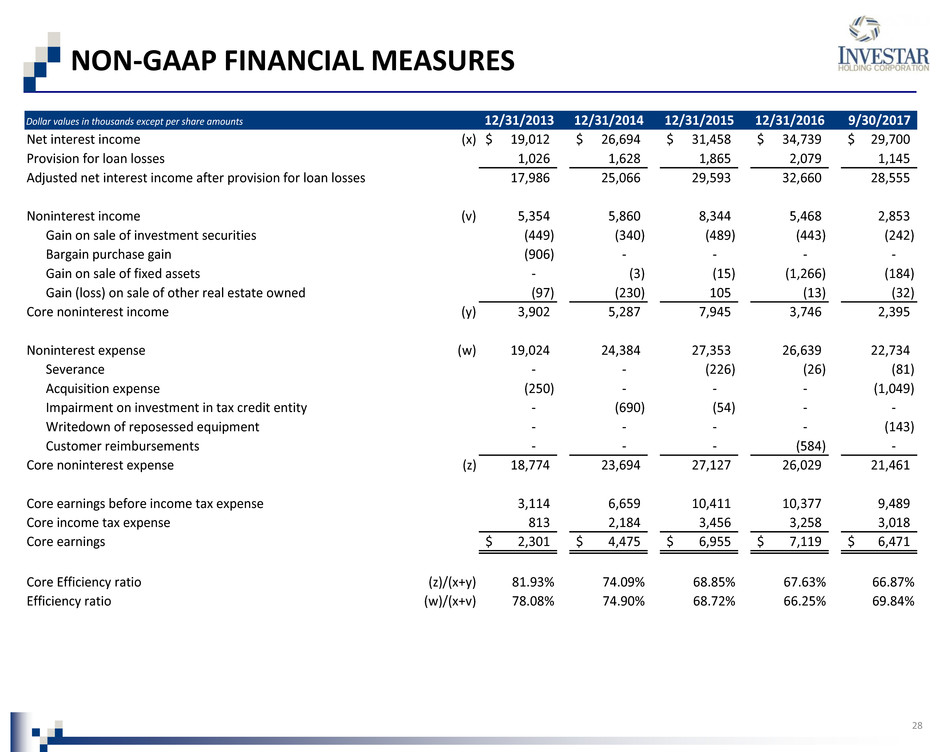
NON-GAAP FINANCIAL MEASURES
28
Dollar values in thousands except per share amounts 12/31/2013 12/31/2014 12/31/2015 12/31/2016 9/30/2017
Net interest income (x) 19,012$ 26,694$ 31,458$ 34,739$ 29,700$
Provision for loan losses 1,026 1,628 1,865 2,079 1,145
Adjusted net interest income after provision for loan losses 17,986 25,066 29,593 32,660 28,555
Noninterest income (v) 5,354 5,860 8,344 5,468 2,853
Gain on sale of investment securities (449) (340) (489) (443) (242)
Bargain purchase gain (906) - - - -
Gain on sale of fixed assets - (3) (15) (1,266) (184)
Gain (loss) on sale of other real estate owned (97) (230) 105 (13) (32)
Core noninterest income (y) 3,902 5,287 7,945 3,746 2,395
Noninterest expense (w) 19,024 24,384 27,353 26,639 22,734
Severance - - (226) (26) (81)
Acquisition expense (250) - - - (1,049)
Impairment on investment in tax credit entity - (690) (54) - -
Writedown of reposessed equipment - - - - (143)
Customer reimbursements - - - (584) -
Core noninterest expense (z) 18,774 23,694 27,127 26,029 21,461
Core earnings before income tax expense 3,114 6,659 10,411 10,377 9,489
Core income tax expense 813 2,184 3,456 3,258 3,018
Core earnings 2,301$ 4,475$ 6,955$ 7,119$ 6,471$
Core Efficiency ratio (z)/(x+y) 81.93% 74.09% 68.85% 67.63% 66.87%
Efficiency ratio (w)/(x+v) 78.08% 74.90% 68.72% 66.25% 69.84%
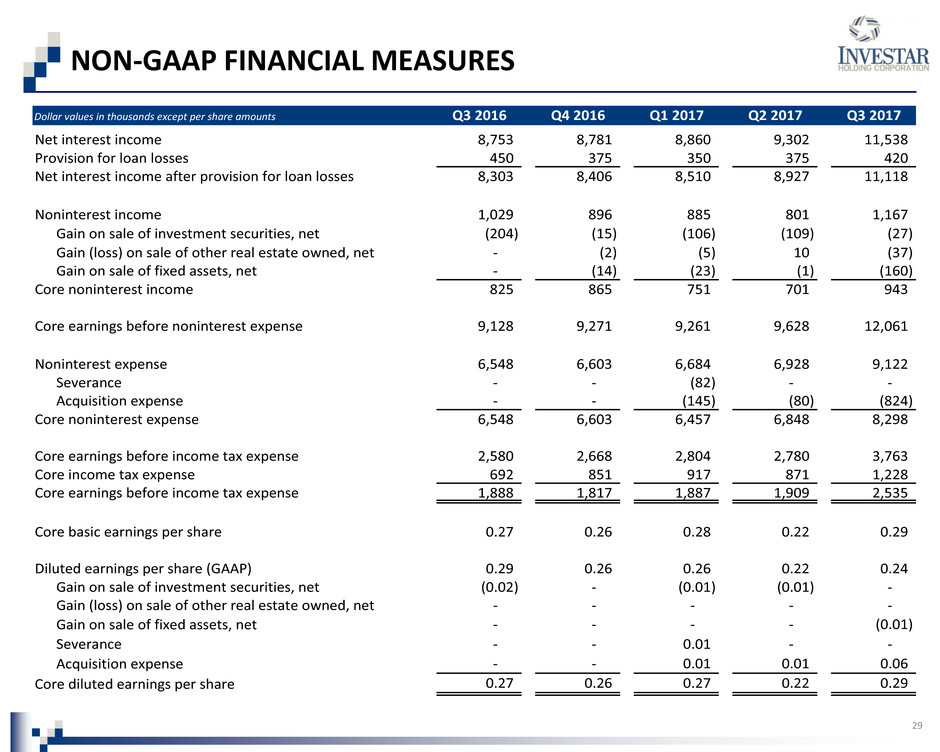
NON-GAAP FINANCIAL MEASURES
29
Dollar values in thousands except per share amounts Q3 2016 Q4 2016 Q1 2017 Q2 2017 Q3 2017
Net interest income 8,753 8,781 8,860 9,302 11,538
Provision for loan losses 450 375 350 375 420
Net interest income after provision for loan losses 8,303 8,406 8,510 8,927 11,118
Noninterest income 1,029 896 885 801 1,167
Gain on sale of investment securities, net (204) (15) (106) (109) (27)
Gain (loss) on sale of other real estate owned, net - (2) (5) 10 (37)
Gain on sale of fixed assets, net - (14) (23) (1) (160)
Core noninterest income 825 865 751 701 943
Core earnings before noninterest expense 9,128 9,271 9,261 9,628 12,061
Noninterest expense 6,548 6,603 6,684 6,928 9,122
Severance - - (82) - -
Acquisition expense - - (145) (80) (824)
Core noninterest expense 6,548 6,603 6,457 6,848 8,298
Core earnings before income tax expense 2,580 2,668 2,804 2,780 3,763
Core income tax expense 692 851 917 871 1,228
Core earnings before income tax expense 1,888 1,817 1,887 1,909 2,535
Core basic earnings per share 0.27 0.26 0.28 0.22 0.29
Diluted earnings per share (GAAP) 0.29 0.26 0.26 0.22 0.24
Gain on sale of investment securities, net (0.02) - (0.01) (0.01) -
Gain (loss) on sale of other real estate owned, net - - - - -
Gain on sale of fixed assets, net - - - - (0.01)
Severance - - 0.01 - -
Acquisition expense - - 0.01 0.01 0.06
Core diluted earnings per share 0.27 0.26 0.27 0.22 0.29
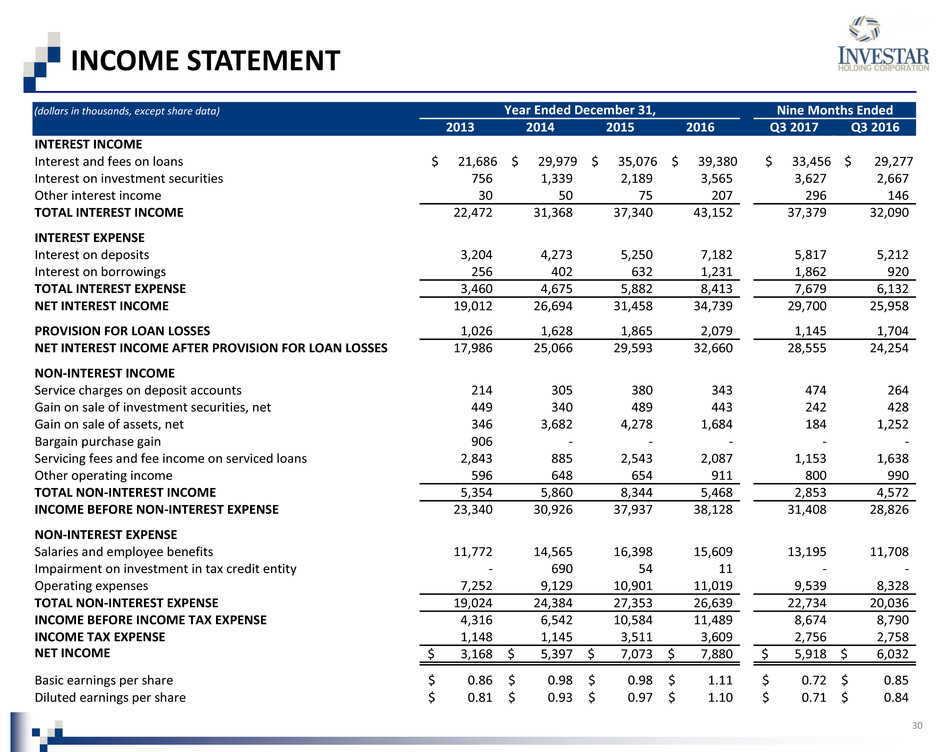
INCOME STATEMENT
30
(dollars in thousands, except share data) Nine Months Ended
2013 2014 2015 2016 Q3 2017 Q3 2016
INTEREST INCOME
Interest and fees on loans $ 21,686 $ 29,979 $ 35,076 $ 39,380 $ 33,456 $ 29,277
Interest on investment securities 756 1,339 2,189 3,565 3,627 2,667
Other interest income 30 50 75 207 296 146
TOTAL INTEREST INCOME 22,472 31,368 37,340 43,152 37,379 32,090
INTEREST EXPENSE
Interest on deposits 3,204 4,273 5,250 7,182 5,817 5,212
Interest on borrowings 256 402 632 1,231 1,862 920
TOTAL INTEREST EXPENSE 3,460 4,675 5,882 8,413 7,679 6,132
NET INTEREST INCOME 19,012 26,694 31,458 34,739 29,700 25,958
PROVISION FOR LOAN LOSSES 1,026 1,628 1,865 2,079 1,145 1,704
NET INTEREST INCOME AFTER PROVISION FOR LOAN LOSSES 17,986 25,066 29,593 32,660 28,555 24,254
NON-INTEREST INCOME
Service charges on deposit accounts 214 305 380 343 474 264
Gain on sale of investment securities, net 449 340 489 443 242 428
Gain on sale of assets, net 346 3,682 4,278 1,684 184 1,252
Bargain purchase gain 906 - - - - -
Servicing fees and fee income on serviced loans 2,843 885 2,543 2,087 1,153 1,638
Other operating income 596 648 654 911 800 990
TOTAL NON-INTEREST INCOME 5,354 5,860 8,344 5,468 2,853 4,572
INCOME BEFORE NON-INTEREST EXPENSE 23,340 30,926 37,937 38,128 31,408 28,826
NON-INTEREST EXPENSE
Salaries and employee benefits 11,772 14,565 16,398 15,609 13,195 11,708
Impairment on investment in tax credit entity - 690 54 11 - -
Operating expenses 7,252 9,129 10,901 11,019 9,539 8,328
TOTAL NON-INTEREST EXPENSE 19,024 24,384 27,353 26,639 22,734 20,036
INCOME BEFORE INCOME TAX EXPENSE 4,316 6,542 10,584 11,489 8,674 8,790
INCOME TAX EXPENSE 1,148 1,145 3,511 3,609 2,756 2,758
NET INCOME 3,168$ 5,397$ 7,073$ 7,880$ 5,918$ 6,032$
Basic earnings per share 0.86$ 0.98$ 0.98$ 1.11$ 0.72$ 0.85$
Diluted earnings per share 0.81$ 0.93$ 0.97$ 1.10$ 0.71$ 0.84$
Year Ended December 31,
