Attached files
| file | filename |
|---|---|
| EX-99.1 - EXHIBIT 99.1 - Lument Finance Trust, Inc. | tv478743_ex99-1.htm |
| 8-K - FORM 8-K - Lument Finance Trust, Inc. | tv478743_8k.htm |
Exhibit 99.2

Investment Corp. Third Quarter 2017 Earnings and Performance Highlights Presentation November 6, 2017

Safe Harbor Statement 2 This presentation includes "forward - looking statements" within the meaning of the U . S . securities laws that are subject to risks and uncertainties . These forward - looking statements include information about possible or assumed future results of the Company's business, financial condition, liquidity, results of operations, plans and objectives . You can identify forward - looking statements by use of words such as "believe," "expect," "anticipate," "estimate," "plan," "continue," "intend," "should," "may" or similar expressions or other comparable terms, or by discussions of strategy, plans or intentions . Statements regarding the following subjects, among others, may be forward - looking : the return on equity ; the yield on investments ; the ability to borrow to finance assets ; and risks associated with investing in real estate assets, including changes in business conditions, interest rates, the general economy and political conditions and related matters . Forward - looking statements are based on the Company's beliefs, assumptions and expectations of its future performance, taking into account all information currently available to the Company . Actual results may differ from expectations, estimates and projections and, consequently, you should not rely on these forward looking statements as predictions of future events . Forward - looking statements are subject to substantial risks and uncertainties, many of which are difficult to predict and are generally beyond the Company's control . Additional information concerning these and other risk factors are contained in the Company's most recent filings with the Securities and Exchange Commission, which are available on the Securities and Exchange Commission's website at www . sec . gov . All subsequent written and oral forward - looking statements that the Company makes, or that are attributable to the Company, are expressly qualified in their entirety by this cautionary notice . Any forward - looking statement speaks only as of the date on which it is made . Except as required by law, the Company is not obligated to, and does not intend to, update or revise any forward - looking statements, whether as a result of new information, future events or otherwise .

Performance Highlights: Third Quarter 2017 3 • Reported an economic loss on common equity of 2 . 59 % , comprised of a $ 0 . 29 decrease in book value per share and a $ 0 . 15 dividend per common share ( 1 ) • Decrease in book value was due to increased financing costs during the quarter which contracted our net interest margin, continued wider spreads on Agency hybrid ARM securities relative to 15 and 30 year collateral, contributing to unrealized losses on our investment portfolio and realized losses on our hedge portfolio • Core earnings of $ 2 . 4 million, or $ 0 . 11 per common share ( 2 ) • Rotated out of $ 416 . 0 million of seasoned shorter duration Agency ARMs and into $ 513 . 6 million of new issue longer duration Agency ARMs • This rotation increased the yield of the Agency portfolio from 2 . 34 % as at 2 Q 17 period end to 2 . 47 % as at 3 Q 17 period end Footnotes: 1) Economic return is a non - GAAP measure that we define as the sum of the change in net book value per common share and dividends d eclared on our common stock during the period over the beginning net book value per common share 2) Core Earnings is a non - GAAP measure that we define as GAAP net income, excluding impairment losses, realized and unrealized gains or losses on the aggregate portfolio and certain non - recurring upfront costs related to securitization transactions or other one - time charges. As defined, Core Earnings includes interest income or expense and premium income or loss on derivative instruments
Market Observations: Third Quarter 2017 4 • The treasury yield curve continued to flatten in the third quarter as short - term interest rates adjusted to the Fed’s June tightening and the September announcement of the Committee’s balance sheet normalization program to begin in October • For payments of principal that the Fed receives from its holdings of agency debt and mortgage - backed securities, the Committee anticipates that the cap will be $ 4 billion per month and will increase in steps of $ 4 billion at three - month intervals over 12 months until it reaches $ 20 billion per month • On October 26 , 2017 Mario Draghi, President of the ECB, announced that from January 2018 its quantitative easing program will be reduced from a rate of € 60 billion per month to € 30 billion per month • We believe the Fed is likely closer to the end of raising short - term interest rates in the traditional manner as the balance sheet normalization program has begun • The Fed in its own research views a withdrawal of its purchases as adding approximately 100 basis points of term premium to the term structure of U . S . interest rates • This Fed balance sheet reduction should longer term generate a steeper yield curve which is a positive for a levered Agency hybrid strategy and provides a strong tail wind to returns potentially for years to come • The risk for our leveraged agency strategy is that the Fed becomes too restrictive and the yield curve continues to flatten

Investment Strategy 5 • As we communicated previously, we intend to focus on a business strategy that is simpler to understand and more cost efficient • We have moved to an “expense light” investment strategy and have reduced the C ompany’s run - rate expenses by approximately a third • Management is proactively limiting non - investment professional compensation to no more than $ 2 million for a period of twelve months in recognition of our new focused strategy • Our focus is now primarily upon Agency hybrid floating - rate securities and Freddie Mac K - series Multifamily credit exposure • Exiting our prime jumbo securitization platform has allowed us to meaningfully reduce our fixed expenses • Investing in intermediate floating rate Agency hybrid securities allows us to minimize extension risk • Agency intermediate term hybrid securities should benefit from rolling down the yield curve • The Fed’s intention to reduce its balance sheet we believe is a net positive for our Agency reinvestment and is expected to add a strong tail wind to MBS spread investments for years to come • We have reduced our repo - funded Freddie Mac K - series investments as spreads have tightened • We have employed an active hedging strategy in an attempt to minimize large price changes resulting from movements in rates and changes in the shape of the yield curve • We have booked $ 548 . 8 million in gross loan volume as a limited rep and warranty risk backstop guarantee provider on prime jumbo loans sold through MAXEX’s LNEX Exchange

ARM Portfolio 6 • Our 3 Q 17 Agency ARM Portfolio has a three month CPR of 5 . 7 % • Our weighted average coupon is 2 . 65 % • Our weighted average purchase price is $ 101 . 82 • Lower coupon and dollar price hybrids benefit from “roll down the curve” Months to Reset Avg. MTR % of ARM Portfolio Current Face Value Weighted Avg. Coupon Weighted Avg. Amortized Purchase Price Amortized Cost Weighted Avg. Market Price Market Value 0 -36 33 3.7% $ 45,805,146 2.11% 102.40 $ 46,904,630 101.77 $ 46,616,083 37-72 68 35.2% $ 440,561,633 2.52% 101.34 $ 446,472,209 101.30 $ 446,299,402 73-84 78 54.4% $ 682,155,586 2.74% 102.03 $ 695,991,665 101.74 $ 694,008,299 85-120 117 6.7% $ 84,507,426 2.95% 102.25 $ 86,407,075 101.70 $ 85,942,031 Total ARMs 75 100.0% $ 1,253,029,790 2.65% 101.82 $ 1,275,775,579 101.58 $ 1,272,865,815 Agency ARM Portfolio: 9/30/2017

Core Earnings Analysis: Third Quarter 2017 7 Footnotes: • Core earnings does not include roll GAAP to Core Earnings Reconciliation Three Months Ended September 30, 2017 Reconciliation of GAAP to non-GAAP Information Net Income (loss) attributable to common shareholders $ (5,136,846) Adjustments for non-core earnings Realized (Gain) Loss on sale of investments, net $ 5,148,445 Unrealized (Gain) Loss on fair value option securities - Realized (Gain) Loss on derivative contracts, net $ 1,636,725 Unrealized (Gain) Loss on derivative contracts, net $ (307,263) Realized (Gain) Loss on mortgage loans held-for-sale $ 221,197 Unrealized (Gain) Loss on mortgage loans held-for-sale $ (28,794) Unrealized (Gain) Loss on mortgage servicing rights $ 102,945 Unrealized (Gain) Loss on multi-family loans held in securitization trusts $ (694,730) Unrealized (Gain) Loss on residential loans held in securitization trusts $ 155,252 Other income $ (8,369) Subtotal $ 6,225,408 Other Adjustments Recognized compensation expense related to restricted common stock 3,312 Adjustment for consolidated securities/securitization costs 1,262,691 Adjustment for one-time charges - Core Earnings 2,354,565 Weighted average shares outstanding - Basic and Diluted 22,139,258 Core Earnings per weighted average shares outstanding - Basic and Diluted $ 0.11
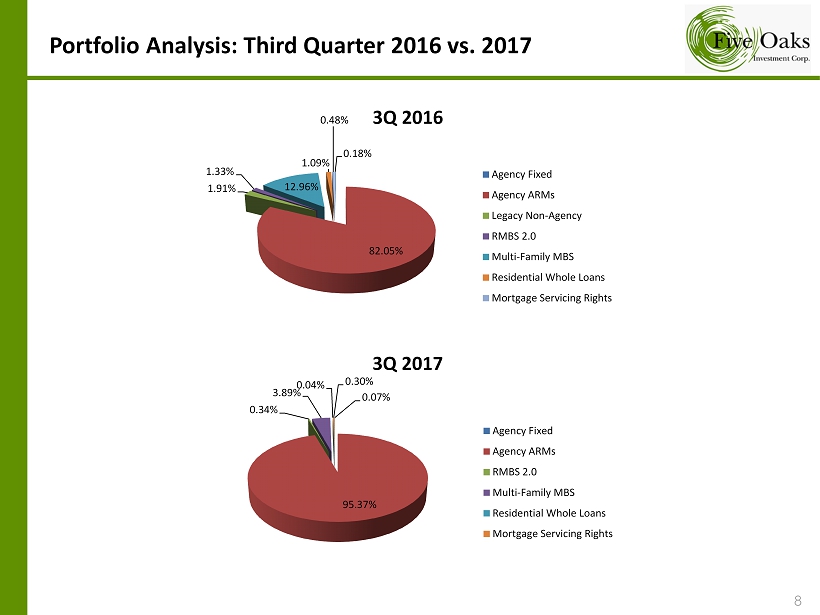
Portfolio Analysis: Third Quarter 2016 vs. 2017 8 0.18% 82.05% 1.91% 1.33% 12.96% 1.09% 0.48% 3Q 2016 Agency Fixed Agency ARMs Legacy Non-Agency RMBS 2.0 Multi-Family MBS Residential Whole Loans Mortgage Servicing Rights 0.07% 95.37% 0.34% 3.89% 0.04% 0.30% 3Q 2017 Agency Fixed Agency ARMs RMBS 2.0 Multi-Family MBS Residential Whole Loans Mortgage Servicing Rights

End of Presentation 9 Investment Corp.