UNITED STATES
SECURITIES AND EXCHANGE COMMISSION
Washington, D.C. 20549
___________
FORM 8-K
CURRENT REPORT
Pursuant to Section 13 or 15(d) of the Securities Exchange Act of 1934
Date of Report (Date of earliest event reported): November 6, 2017
___________
FIRST NATIONAL CORPORATION
(Exact name of registrant as specified in its charter)
|
Virginia
(State or other jurisdiction
of incorporation)
|
0-23976
(Commission File Number)
|
54-1232965
(IRS Employer
Identification No.)
|
|
|
|
|
|
|
|
112 West King Street
Strasburg, Virginia
(Address of principal executive offices)
|
22657
(Zip Code)
|
||
Registrant's telephone number, including area code: (540) 465-9121
Not Applicable
(Former name or former address, if changed since last report)
Check the appropriate box below if the Form 8-K filing is intended to simultaneously satisfy the filing obligation of the registrant under any of the following provisions:
□ Written communications pursuant to Rule 425 under the Securities Act (17 CFR 230.425)
□ Soliciting material pursuant to Rule 14a-12 under the Exchange Act (17 CFR 240.14a-12)
□ Pre-commencement communications pursuant to Rule 14d-2(b) under the Exchange Act (17 CFR 240.14d-2(b))
□ Pre-commencement communications pursuant to Rule 13e-4(c) under the Exchange Act (17 CFR 240.13e-4(c))
Indicate by check mark whether the registrant is an emerging growth company as defined in Rule 405 of the Securities Act of 1933 or Rule 12b-2 of the Securities Exchange Act of 1934.
Emerging growth company □
If an emerging growth company, indicate by check mark if the registrant has elected not to use the extended transition period for complying with any new or revised financial accounting standards provided pursuant to Section 13(a) of the Exchange Act. □
Item 7.01 Regulation FD Disclosure.
On November 6, 2017, First National Corporation (the "Company") participated in the Hovde Group's 2nd Annual Fast-Forward Bank Conference in Phoenix. An investor presentation, which includes information regarding the Company's financial results, business strategies and trends, is intended to be made available to shareholders, analysts and investors. A copy of the presentation to investors is furnished as Exhibit 99.1 to this Current Report on Form 8-K and incorporated by reference herein.
The information provided pursuant to this Item 7.01 is to be considered "furnished" pursuant to Form 8-K and shall not be deemed to be "filed" for purposes of Section 18 of the Securities Exchange Act of 1934, as amended (the "Exchange Act"), or otherwise subject to the liabilities under that Section, nor shall it be deemed incorporated by reference into any of the Company's reports or filings under the Securities Act of 1933 or the Exchange Act, except as expressly set forth by specific reference in such report or filing. The filing of this Current Report shall not be deemed an admission as to the materiality of any information in the Current Report that is required to be disclosed solely by reason of Regulation FD.
Item 9.01 Financial Statements and Exhibits.
(d) Exhibits.
|
Exhibit No
|
Description
|
|
|
99.1
|
First National Corporation investor presentation
|
|
2
SIGNATURES
Pursuant to the requirements of the Securities Exchange Act of 1934, as amended, the Registrant has duly caused this report to be signed on its behalf by the undersigned hereunto duly authorized.
|
FIRST NATIONAL CORPORATION
|
|||
|
(Registrant)
|
|||
|
Date: November 6, 2017
|
By:
|
/s/ M. Shane Bell
|
|
|
M. Shane Bell
|
|||
|
Executive Vice President
|
|||
|
and Chief Financial Officer
|
|||
3
EXHIBIT INDEX
|
Exhibit No
|
Description
|
|
|
99.1
|
First National Corporation investor presentation
|
|
4
Exhibit 99.1

Investor PresentationNovember 2017
Forward-Looking Statements The Company makes forward-looking statements in this presentation that are subject to risks and uncertainties. These forward-looking statements may include statements regarding profitability, liquidity, adequacy of capital, the allowance for loan losses, interest rate sensitivity, market risk, growth strategy, and financial and other goals. The words, “believes,” “expects,” “may,” “will,” “should,” “projects,” “contemplates,” “anticipates,” “forecasts,” “intends,” or other similar words or terms are intended to identify forward-looking statements. These forward-looking statements are subject to significant uncertainties. Because of these uncertainties, actual future results may be materially different from the results indicated by these forward-looking statements. In addition, past results of operations do not necessarily indicate future results. The following presentation should be read in conjunction with the consolidated financial statements and related notes included in Part II, Item 8, and Item 1A. Risk Factors of the Company’s Form 10-K for the year ended December 31, 2016. 2
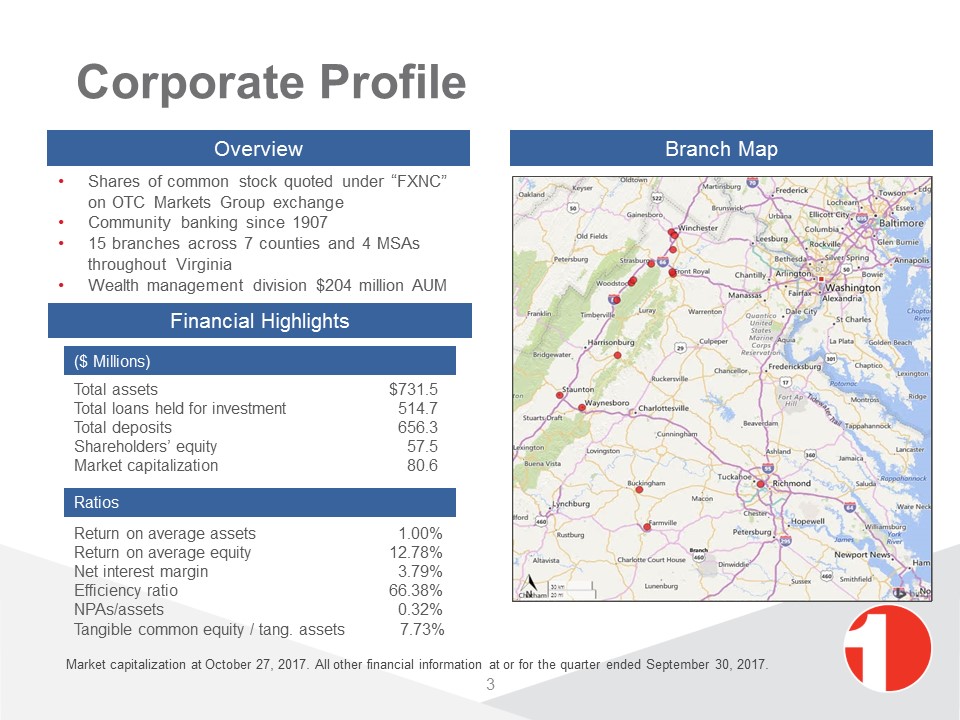
Corporate Profile 3 Branch Map Overview Shares of common stock quoted under “FXNC” on OTC Markets Group exchangeCommunity banking since 190715 branches across 7 counties and 4 MSAs throughout VirginiaWealth management division $204 million AUM Financial Highlights Total assets $731.5Total loans held for investment 514.7Total deposits 656.3Shareholders’ equity 57.5Market capitalization 80.6 ($ Millions) Ratios Return on average assets 1.00%Return on average equity 12.78%Net interest margin 3.79%Efficiency ratio 66.38%NPAs/assets 0.32%Tangible common equity / tang. assets 7.73% Market capitalization at October 27, 2017. All other financial information at or for the quarter ended September 30, 2017.
Strengths Management team with track record of successAnnual loan growth averaged 12% last 3 yearsSuperior asset quality with NPAs/Assets of 0.32%Non-interest income at 1.10% of average assetsWealth management with full trust powersLow-cost deposit portfolio at 0.27% Trusted financial advisors building customer relationshipsProviding solutions to small businessesDemonstrated ability to execute acquisitions 4 Financial information at or for the quarter ended September 30, 2017.
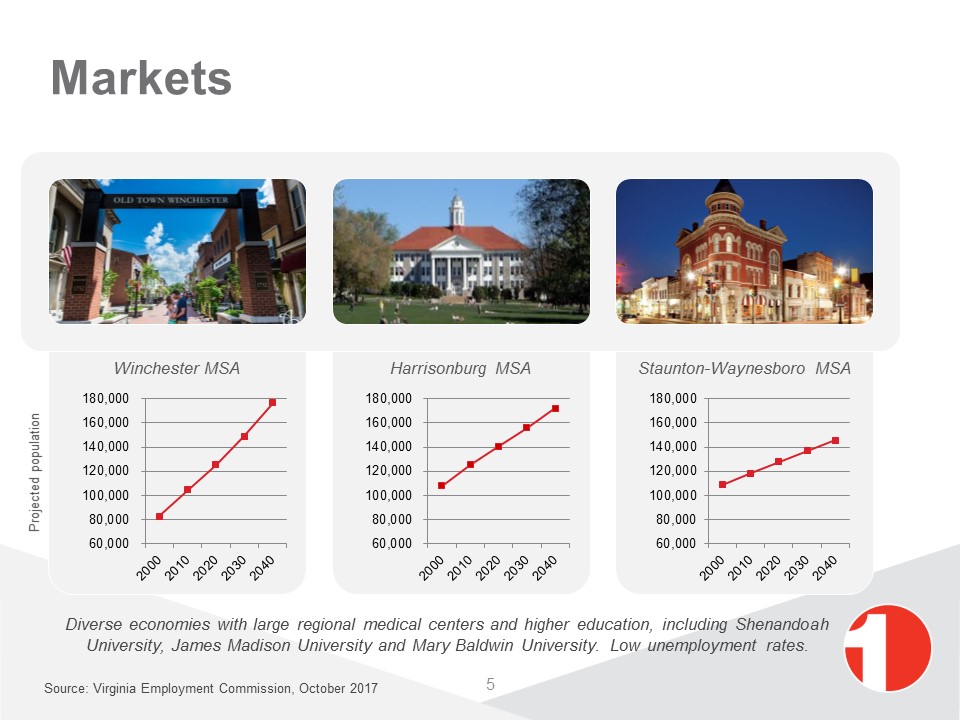
Markets Diverse economies with large regional medical centers and higher education, including Shenandoah University, James Madison University and Mary Baldwin University. Low unemployment rates. Projected population 5 Source: Virginia Employment Commission, October 2017
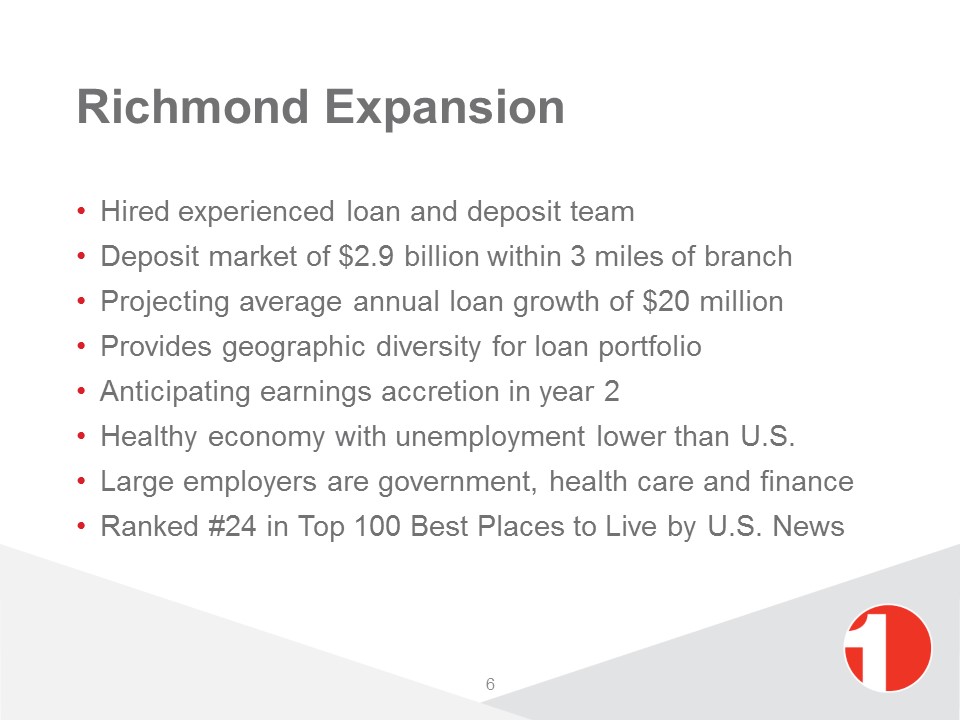
Richmond Expansion Hired experienced loan and deposit teamDeposit market of $2.9 billion within 3 miles of branchProjecting average annual loan growth of $20 millionProvides geographic diversity for loan portfolioAnticipating earnings accretion in year 2Healthy economy with unemployment lower than U.S.Large employers are government, health care and financeRanked #24 in Top 100 Best Places to Live by U.S. News 6
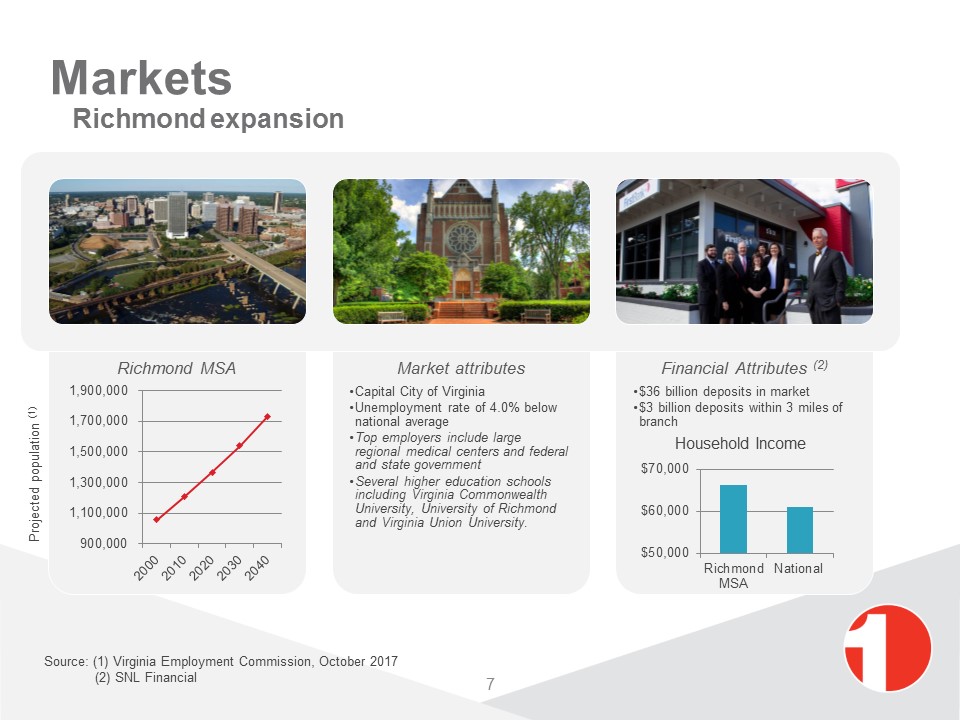
Markets Richmond expansion Projected population (1) 7 Source: (1) Virginia Employment Commission, October 2017 (2) SNL Financial
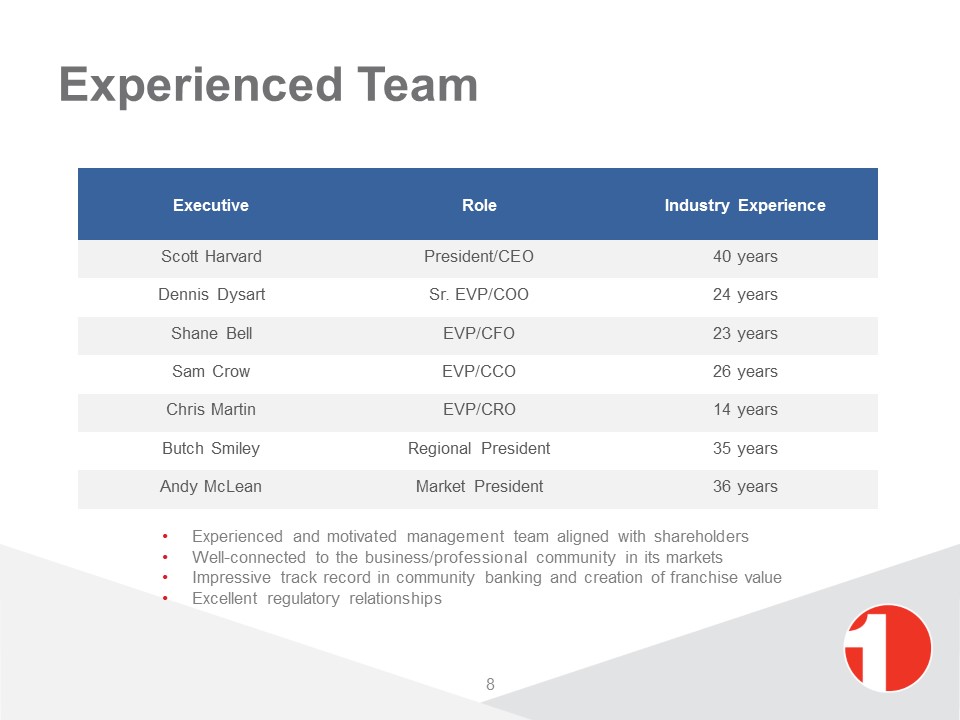
Experienced Team Executive Role Industry Experience Scott Harvard President/CEO 40 years Dennis Dysart Sr. EVP/COO 24 years Shane Bell EVP/CFO 23 years Sam Crow EVP/CCO 26 years Chris Martin EVP/CRO 14 years Butch Smiley Regional President 35 years Andy McLean Market President 36 years Experienced and motivated management team aligned with shareholdersWell-connected to the business/professional community in its marketsImpressive track record in community banking and creation of franchise valueExcellent regulatory relationships 8
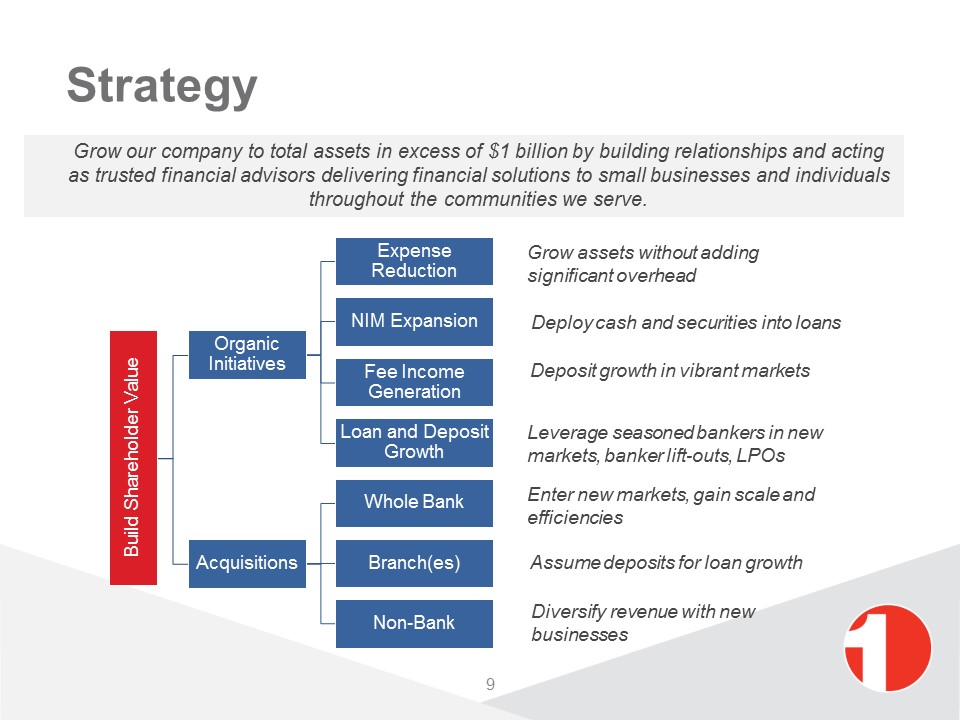
Strategy Grow assets without adding significant overhead Deploy cash and securities into loans Deposit growth in vibrant markets Leverage seasoned bankers in new markets, banker lift-outs, LPOs Enter new markets, gain scale and efficiencies Assume deposits for loan growth Diversify revenue with new businesses Grow our company to total assets in excess of $1 billion by building relationships and acting as trusted financial advisors delivering financial solutions to small businesses and individuals throughout the communities we serve. 9
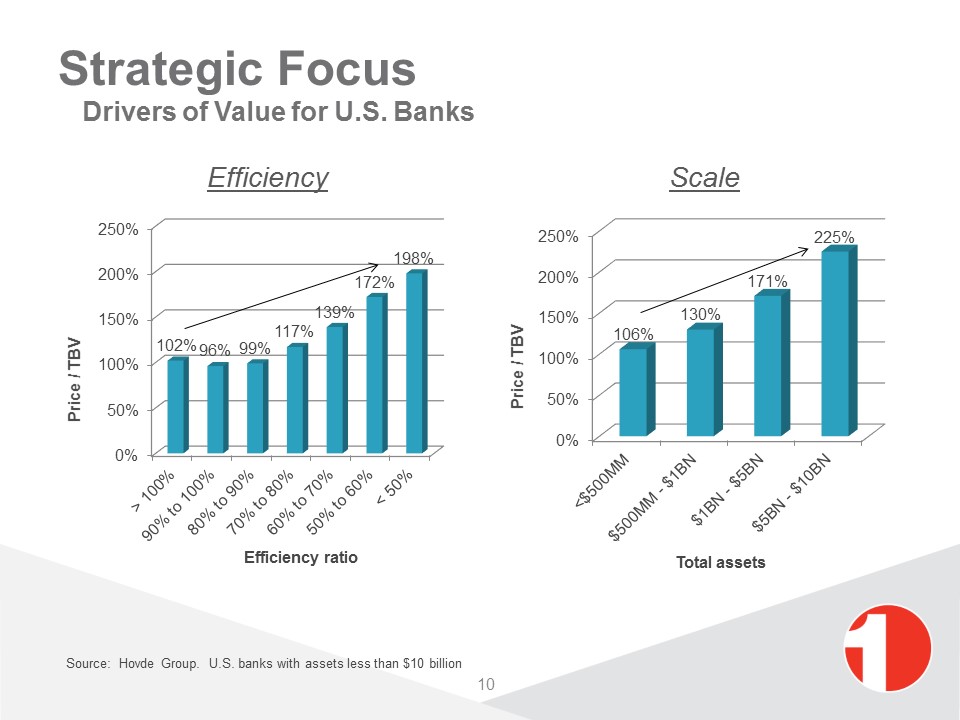
Efficiency Scale Strategic Focus Drivers of Value for U.S. Banks 10 Source: Hovde Group. U.S. banks with assets less than $10 billion
Strategy Execution Well-executed drive to improve efficiencySuccessful $186 million branch acquisitionDeployed acquired deposits with excellent loan growthGrowth of non-interest bearing depositsReinvigorated loan production with superior asset qualitySuccessful team lift out in Staunton-Augusta CountyRecent team lift out and expansion to Richmond’s west end 11
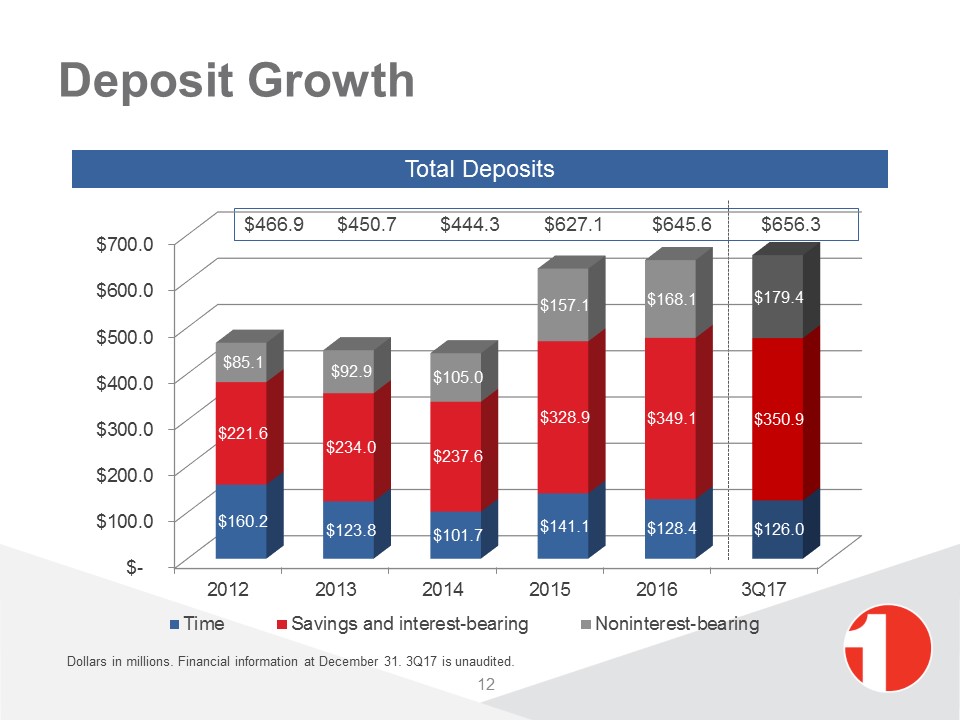
Deposit Growth Total Deposits 12 $466.9 $450.7 $444.3 $627.1 $645.6 $656.3 Dollars in millions. Financial information at December 31. 3Q17 is unaudited.
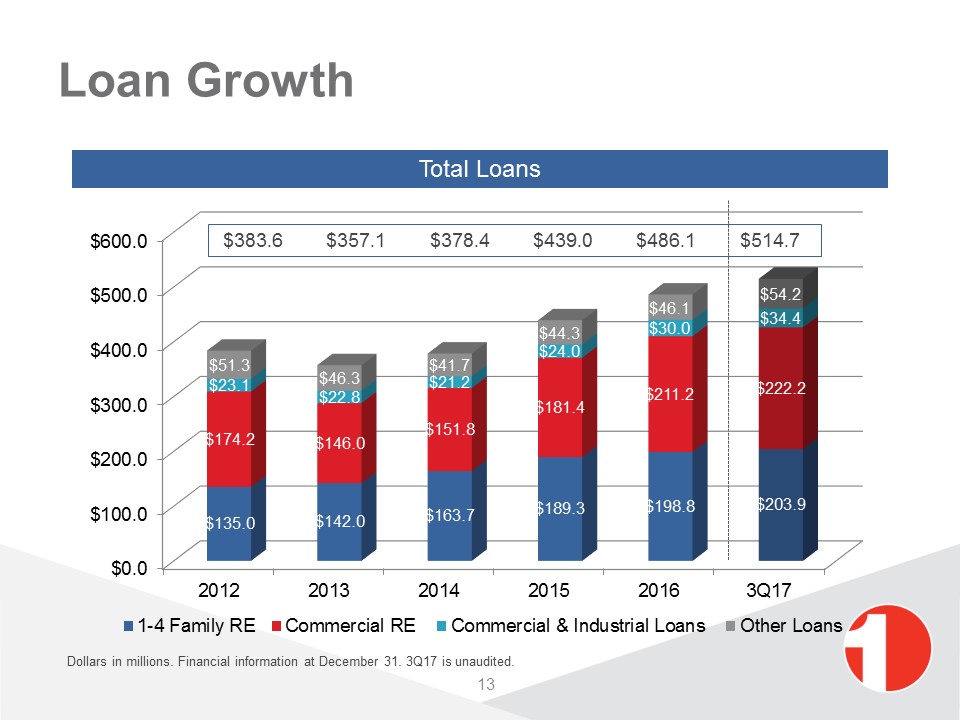
Loan Growth Total Loans 13 $383.6 $357.1 $378.4 $439.0 $486.1 $514.7 Dollars in millions. Financial information at December 31. 3Q17 is unaudited.
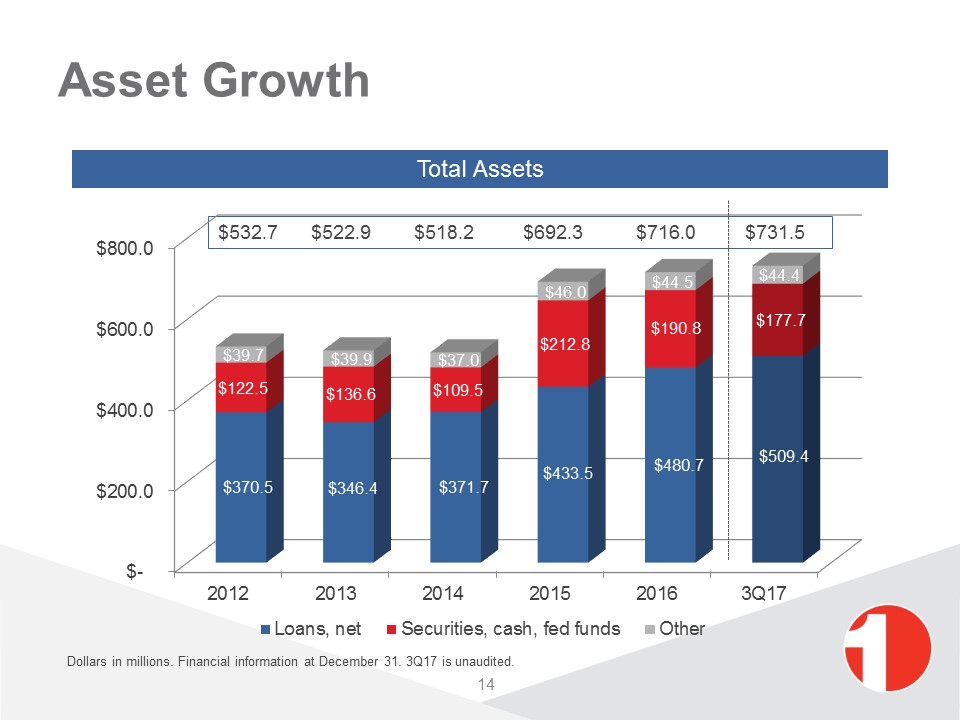
Asset Growth Total Assets 14 $532.7 $522.9 $518.2 $692.3 $716.0 $731.5 Dollars in millions. Financial information at December 31. 3Q17 is unaudited.
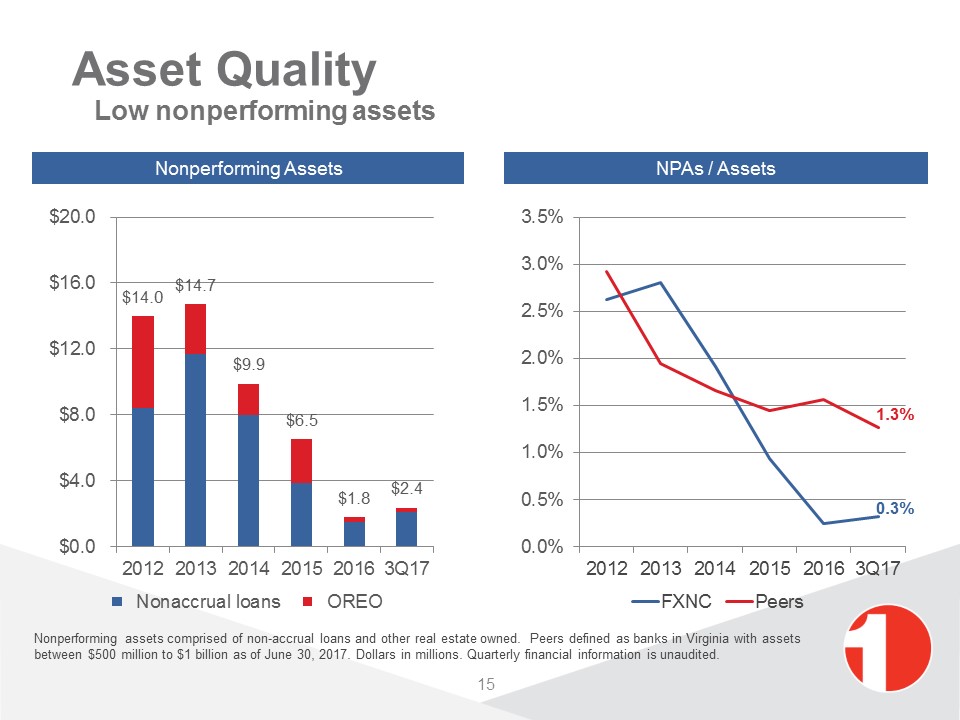
Asset Quality Low nonperforming assets Nonperforming assets comprised of non-accrual loans and other real estate owned. Peers defined as banks in Virginia with assets between $500 million to $1 billion as of June 30, 2017. Dollars in millions. Quarterly financial information is unaudited. NPAs / Assets Nonperforming Assets 15
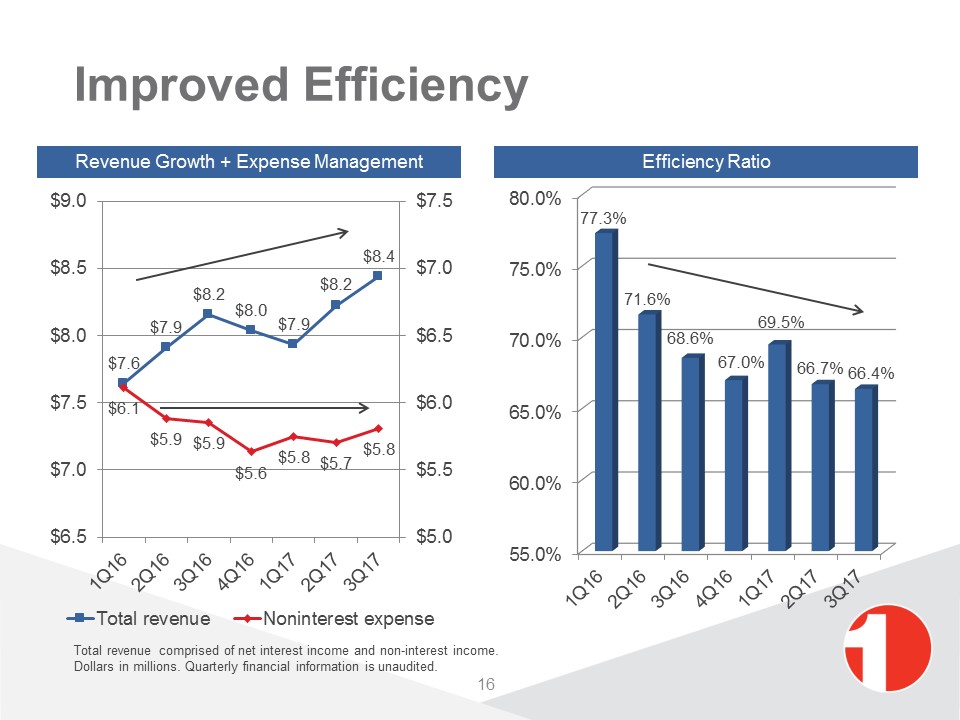
Improved Efficiency 16 Total revenue comprised of net interest income and non-interest income.Dollars in millions. Quarterly financial information is unaudited. Efficiency Ratio Revenue Growth + Expense Management
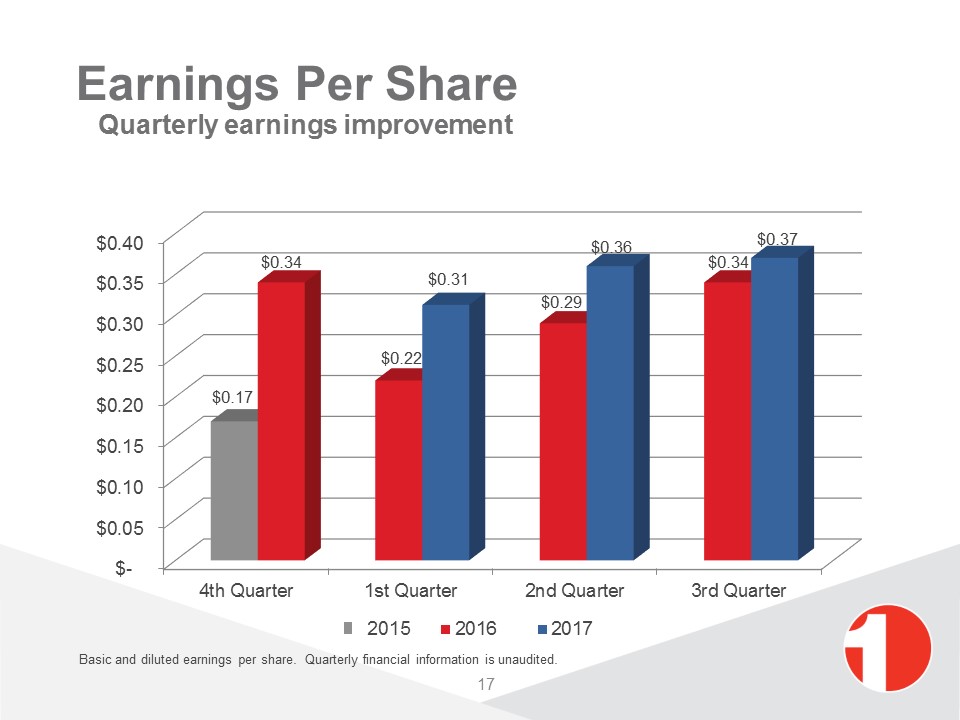
Earnings Per Share Quarterly earnings improvement Basic and diluted earnings per share. Quarterly financial information is unaudited. 17 2015
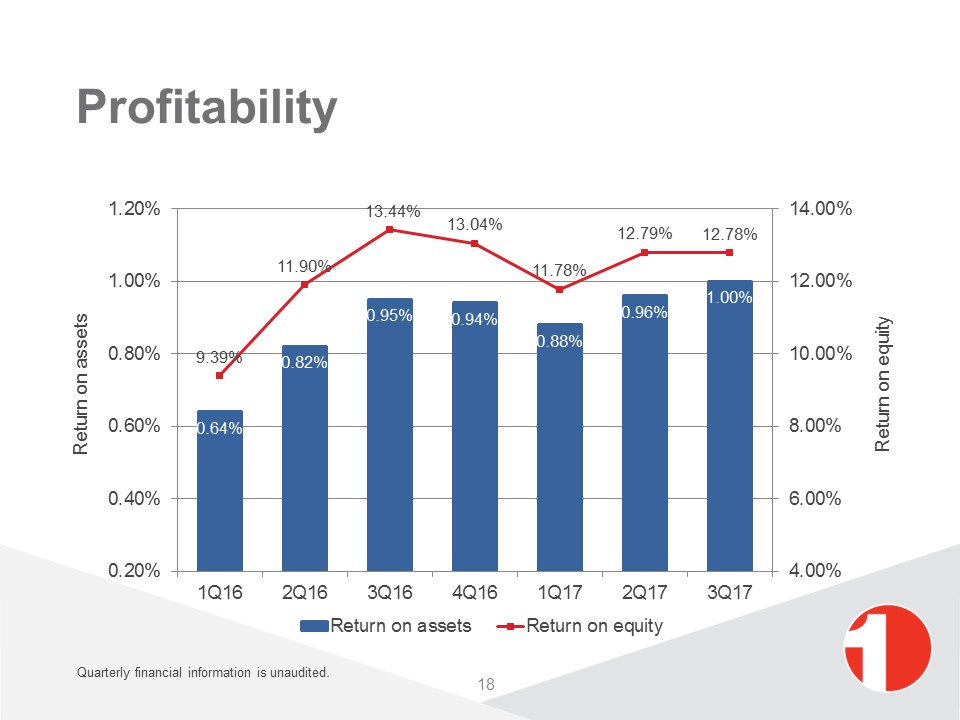
Profitability 18 Quarterly financial information is unaudited.
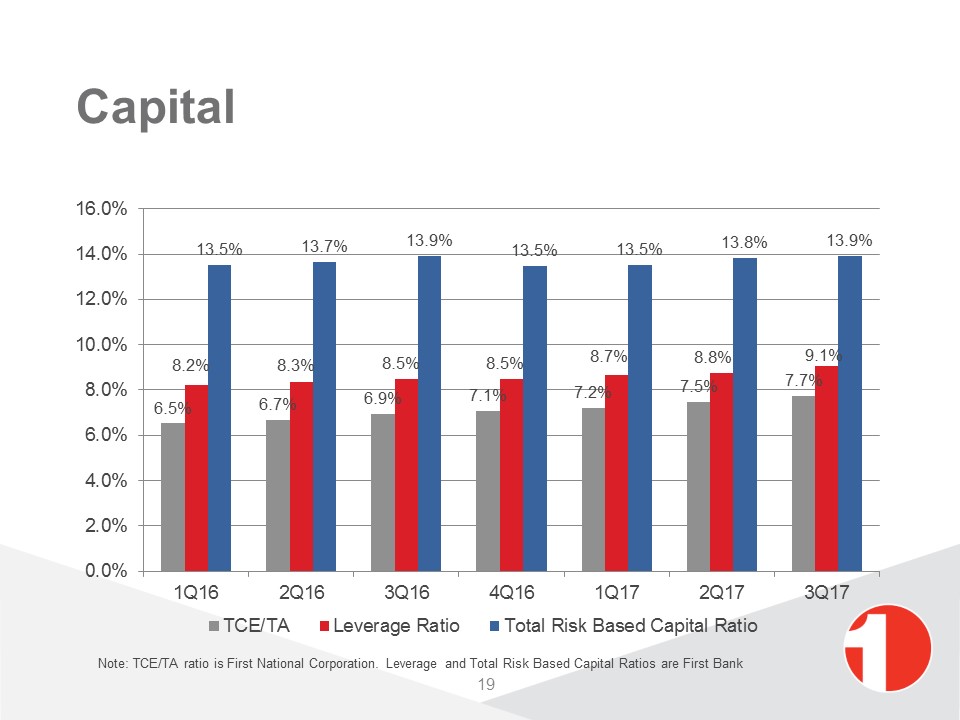
Capital 19 Note: TCE/TA ratio is First National Corporation. Leverage and Total Risk Based Capital Ratios are First Bank
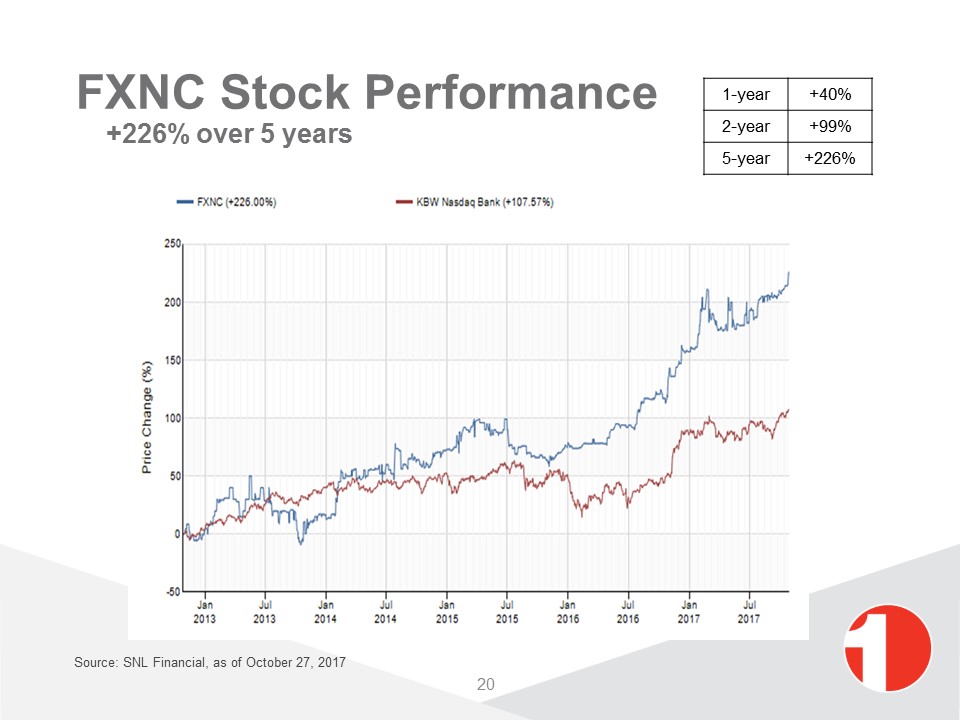
20 Source: SNL Financial, as of October 27, 2017 FXNC Stock Performance +226% over 5 years 1-year +40% 2-year +99% 5-year +226%
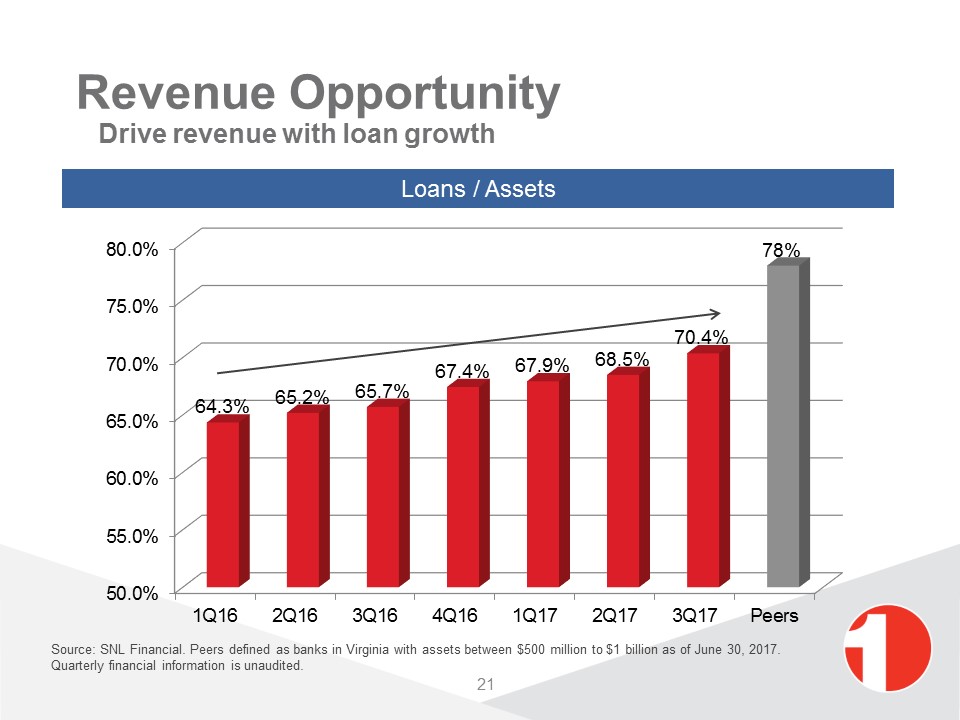
Revenue Opportunity Drive revenue with loan growth Loans / Assets 21 Source: SNL Financial. Peers defined as banks in Virginia with assets between $500 million to $1 billion as of June 30, 2017. Quarterly financial information is unaudited.
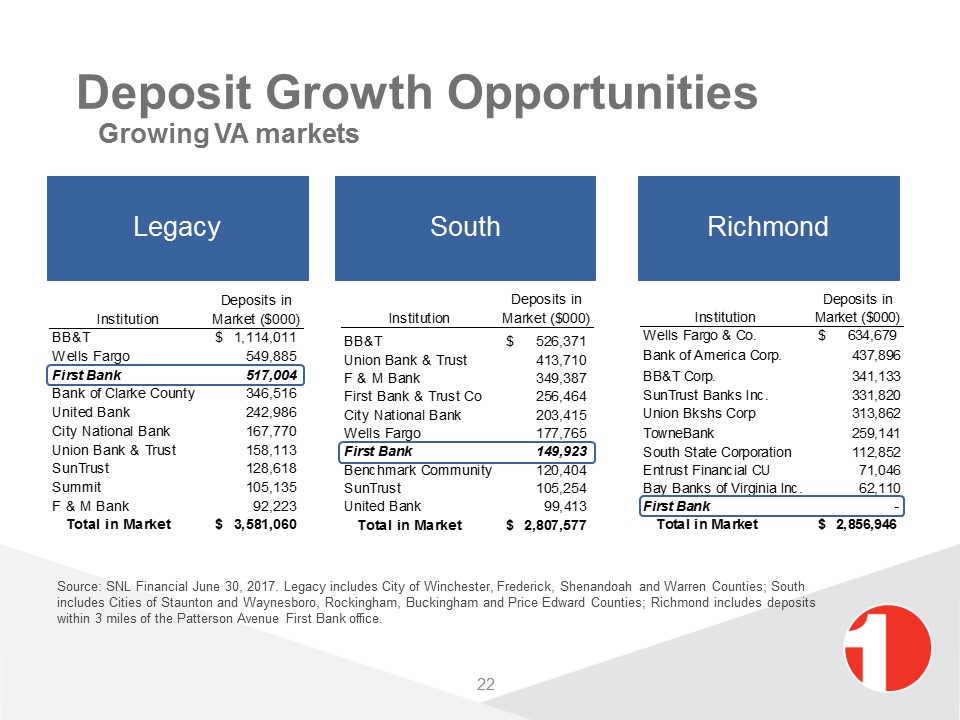
22 Deposit Growth Opportunities Growing VA markets Source: SNL Financial June 30, 2017. Legacy includes City of Winchester, Frederick, Shenandoah and Warren Counties; South includes Cities of Staunton and Waynesboro, Rockingham, Buckingham and Price Edward Counties; Richmond includes deposits within 3 miles of the Patterson Avenue First Bank office.
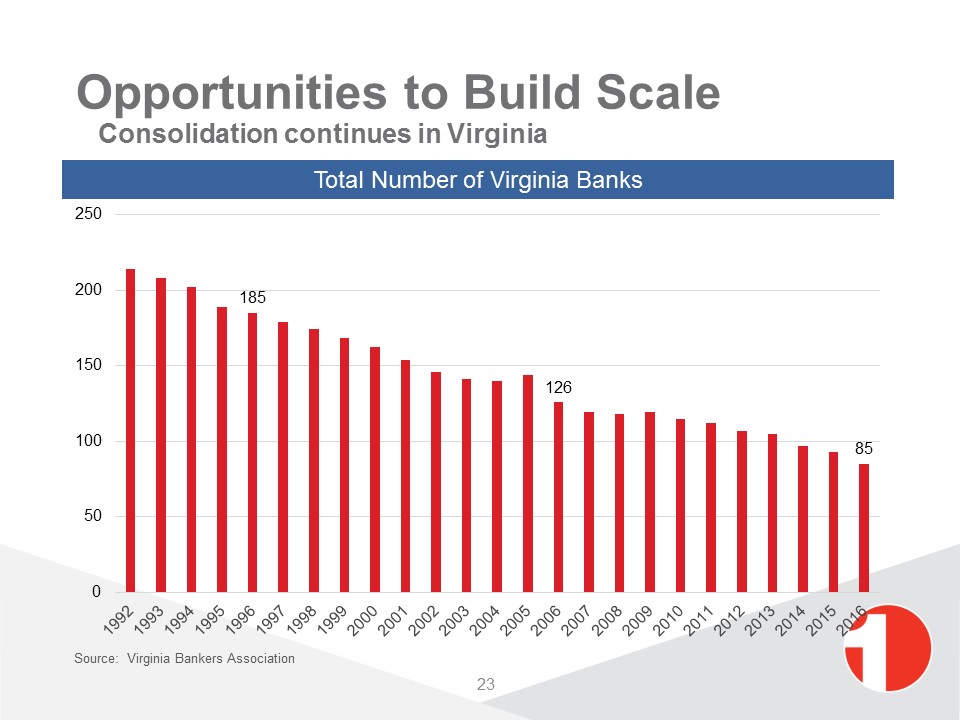
23 Opportunities to Build Scale Consolidation continues in Virginia Total Number of Virginia Banks Source: Virginia Bankers Association
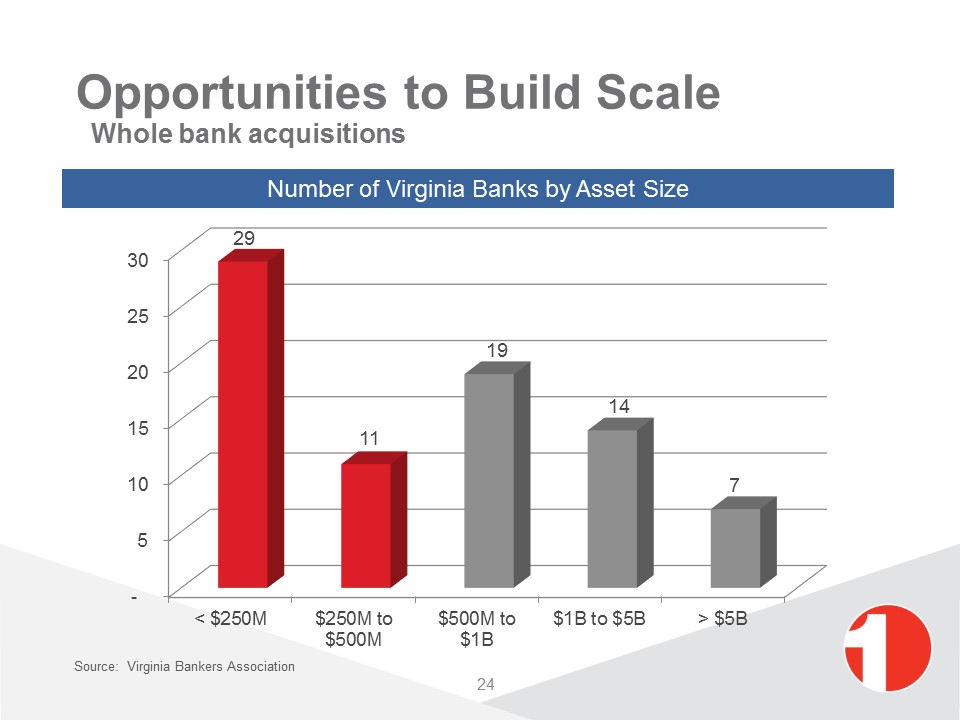
Opportunities to Build Scale Whole bank acquisitions Number of Virginia Banks by Asset Size 24 Source: Virginia Bankers Association
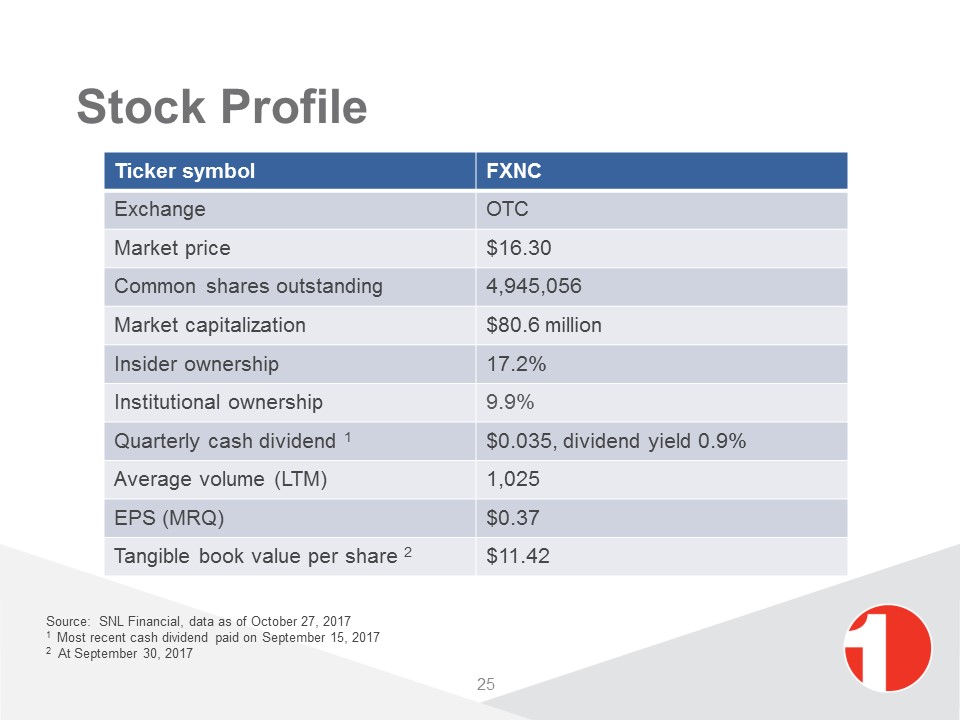
Stock Profile Source: SNL Financial, data as of October 27, 20171 Most recent cash dividend paid on September 15, 20172 At September 30, 2017 Ticker symbol FXNC Exchange OTC Market price $16.30 Common shares outstanding 4,945,056 Market capitalization $80.6 million Insider ownership 17.2% Institutional ownership 9.9% Quarterly cash dividend 1 $0.035, dividend yield 0.9% Average volume (LTM) 1,025 EPS (MRQ) $0.37 Tangible book value per share 2 $11.42 25
Value Proposition Proven management teamBranch acquisition and team lift outMargin expansionCapital managementReturn on investmentFocused on scale and efficiency to drive valueLow-cost deposit funding available for loan growthDisciplined loan growth with superior asset qualitySuperior non-interest incomeDeep relationships in robust, growing marketsRecent team lift creates growth opportunity in Richmond 26

Appendix 27
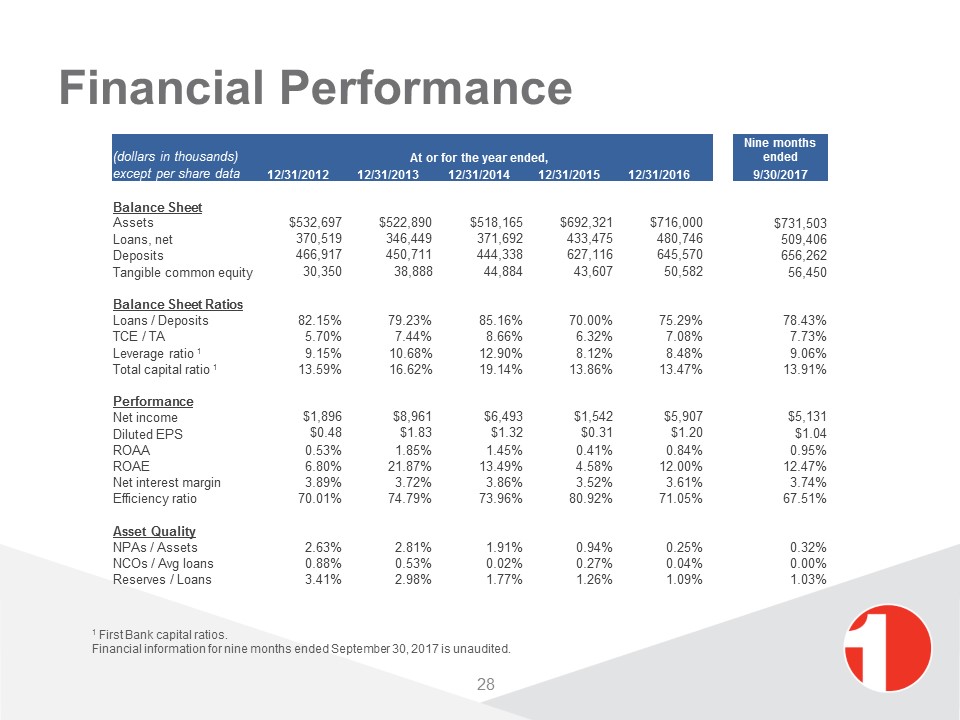
28 (dollars in thousands) At or for the year ended, Nine months ended except per share data 12/31/2012 12/31/2013 12/31/2014 12/31/2015 12/31/2016 9/30/2017 Balance Sheet Assets $532,697 $522,890 $518,165 $692,321 $716,000 $731,503 Loans, net 370,519 346,449 371,692 433,475 480,746 509,406 Deposits 466,917 450,711 444,338 627,116 645,570 656,262 Tangible common equity 30,350 38,888 44,884 43,607 50,582 56,450 Balance Sheet Ratios Loans / Deposits 82.15% 79.23% 85.16% 70.00% 75.29% 78.43% TCE / TA 5.70% 7.44% 8.66% 6.32% 7.08% 7.73% Leverage ratio 1 9.15% 10.68% 12.90% 8.12% 8.48% 9.06% Total capital ratio 1 13.59% 16.62% 19.14% 13.86% 13.47% 13.91% Performance Net income $1,896 $8,961 $6,493 $1,542 $5,907 $5,131 Diluted EPS $0.48 $1.83 $1.32 $0.31 $1.20 $1.04 ROAA 0.53% 1.85% 1.45% 0.41% 0.84% 0.95% ROAE 6.80% 21.87% 13.49% 4.58% 12.00% 12.47% Net interest margin 3.89% 3.72% 3.86% 3.52% 3.61% 3.74% Efficiency ratio 70.01% 74.79% 73.96% 80.92% 71.05% 67.51% Asset Quality NPAs / Assets 2.63% 2.81% 1.91% 0.94% 0.25% 0.32% NCOs / Avg loans 0.88% 0.53% 0.02% 0.27% 0.04% 0.00% Reserves / Loans 3.41% 2.98% 1.77% 1.26% 1.09% 1.03% Financial Performance 1 First Bank capital ratios. Financial information for nine months ended September 30, 2017 is unaudited.
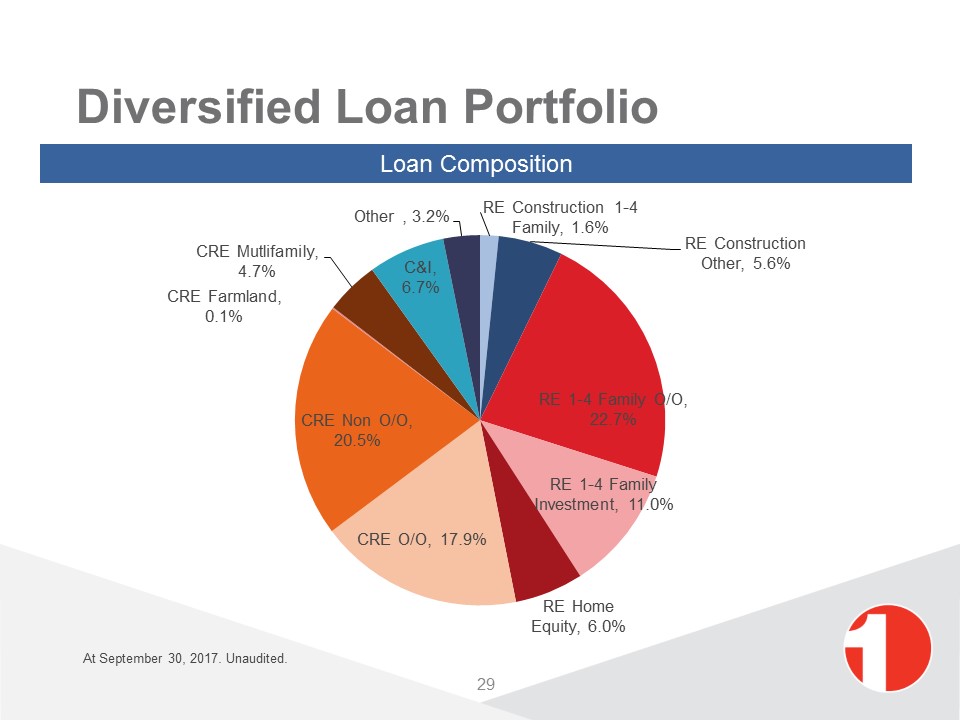
Diversified Loan Portfolio Loan Composition 29 At September 30, 2017. Unaudited.
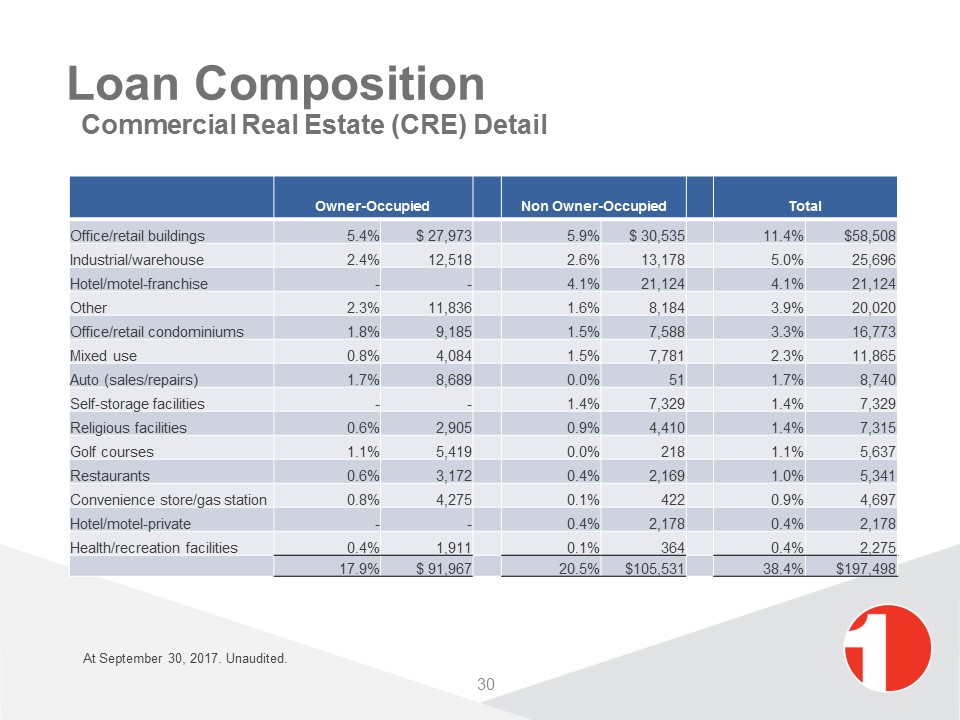
Loan Composition Commercial Real Estate (CRE) Detail Owner-Occupied Non Owner-Occupied Total Office/retail buildings 5.4% $ 27,973 5.9% $ 30,535 11.4% $58,508 Industrial/warehouse 2.4% 12,518 2.6% 13,178 5.0% 25,696 Hotel/motel-franchise - - 4.1% 21,124 4.1% 21,124 Other 2.3% 11,836 1.6% 8,184 3.9% 20,020 Office/retail condominiums 1.8% 9,185 1.5% 7,588 3.3% 16,773 Mixed use 0.8% 4,084 1.5% 7,781 2.3% 11,865 Auto (sales/repairs) 1.7% 8,689 0.0% 51 1.7% 8,740 Self-storage facilities - - 1.4% 7,329 1.4% 7,329 Religious facilities 0.6% 2,905 0.9% 4,410 1.4% 7,315 Golf courses 1.1% 5,419 0.0% 218 1.1% 5,637 Restaurants 0.6% 3,172 0.4% 2,169 1.0% 5,341 Convenience store/gas station 0.8% 4,275 0.1% 422 0.9% 4,697 Hotel/motel-private - - 0.4% 2,178 0.4% 2,178 Health/recreation facilities 0.4% 1,911 0.1% 364 0.4% 2,275 17.9% $ 91,967 20.5% $105,531 38.4% $197,498 30 At September 30, 2017. Unaudited.

Low Cost Deposits Deposit Composition Non-maturity deposits 80% of total depositsLow cost funding of 0.27%Comprised of 57% personal, 43% business$15 thousand average balance of non-maturity deposits 31 At September 30, 2017. Unaudited.
Scott Harvard, President and CEO(540) 465-6121sharvard@fbvirginia.comShane Bell, Executive VP and CFO(540) 465-6130sbell@fbvirginia.com