Attached files
| file | filename |
|---|---|
| 8-K - 8-K - BYLINE BANCORP, INC. | by-8k_20171106.htm |

Hovde Group 2017 Investor Conference Exhibit 99.1
Forward Looking Statements This communication contains forward-looking statements within the meaning of the U.S. federal securities laws. Forward-looking statements include, without limitation, statements concerning plans, estimates, calculations, forecasts and projections with respect to the anticipated future performance of the Company. These statements are often, but not always, made through the use of words or phrases such as ‘‘may’’, ‘‘might’’, ‘‘should’’, ‘‘could’’, ‘‘predict’’, ‘‘potential’’, ‘‘believe’’, ‘‘expect’’, ‘‘continue’’, ‘‘will’’, ‘‘anticipate’’, ‘‘seek’’, ‘‘estimate’’, ‘‘intend’’, ‘‘plan’’, ‘‘projection’’, ‘‘would’’, ‘‘annualized’’, “target” and ‘‘outlook’’, or the negative version of those words or other comparable words or phrases of a future or forward-looking nature. Forward-looking statements reflect various assumptions and involve elements of subjective judgment and analysis, which may or may not prove to be correct, and which are subject to uncertainties and contingencies outside the control of Byline and its respective affiliates, directors, employees and other representatives, which could cause actual results to differ materially from those presented in this communication. No representations, warranties or guarantees are or will be made by Byline as to the reliability, accuracy or completeness of any forward-looking statements contained in this communication or that such forward-looking statements are or will remain based on reasonable assumptions. You should not place undue reliance on any forward-looking statements contained in this communication. Forward-looking statements speak only as of the date they are made, and we assume no obligation to update any of these statements in light of new information, future events or otherwise unless required under the federal securities laws.
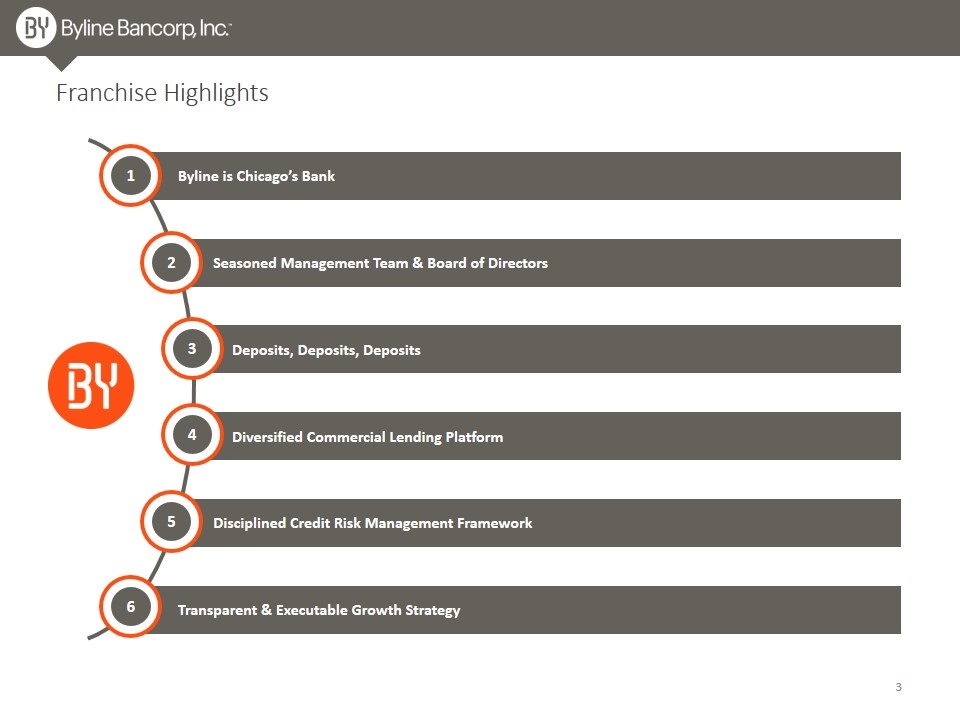
Transparent & Executable Growth Strategy Byline is Chicago’s Bank Seasoned Management Team & Board of Directors Diversified Commercial Lending Platform Disciplined Credit Risk Management Framework Deposits, Deposits, Deposits Franchise Highlights 1 2 3 4 5 6
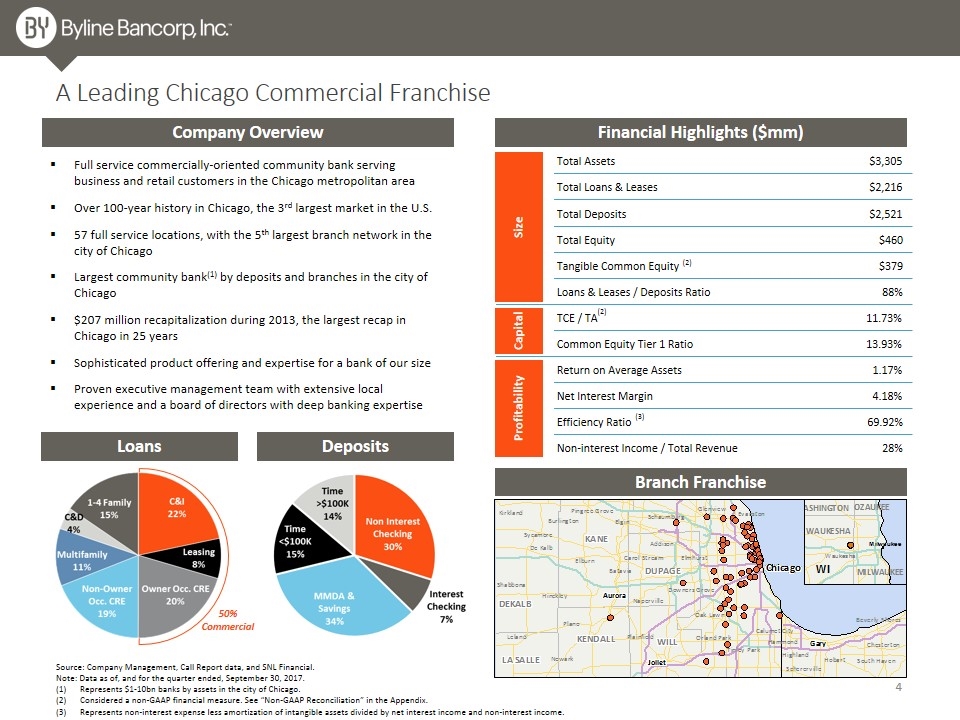
Total Assets $3,305 Total Loans & Leases $2,216 Total Deposits $2,521 Total Equity $460 Tangible Common Equity $379 Loans & Leases / Deposits Ratio 88% TCE / TA 11.73% Common Equity Tier 1 Ratio 13.93% Return on Average Assets 1.17% Net Interest Margin 4.18% Efficiency Ratio 69.92% Non-interest Income / Total Revenue 28% A Leading Chicago Commercial Franchise Company Overview Full service commercially-oriented community bank serving business and retail customers in the Chicago metropolitan area Over 100-year history in Chicago, the 3rd largest market in the U.S. 57 full service locations, with the 5th largest branch network in the city of Chicago Largest community bank(1) by deposits and branches in the city of Chicago $207 million recapitalization during 2013, the largest recap in Chicago in 25 years Sophisticated product offering and expertise for a bank of our size Proven executive management team with extensive local experience and a board of directors with deep banking expertise Source: Company Management, Call Report data, and SNL Financial. Note: Data as of, and for the quarter ended, September 30, 2017. Represents $1-10bn banks by assets in the city of Chicago. Considered a non-GAAP financial measure. See “Non-GAAP Reconciliation” in the Appendix. Represents non-interest expense less amortization of intangible assets divided by net interest income and non-interest income. Branch Franchise Loans Deposits Financial Highlights ($mm) Size Capital Profitability 50% Commercial (2) (2) (3)
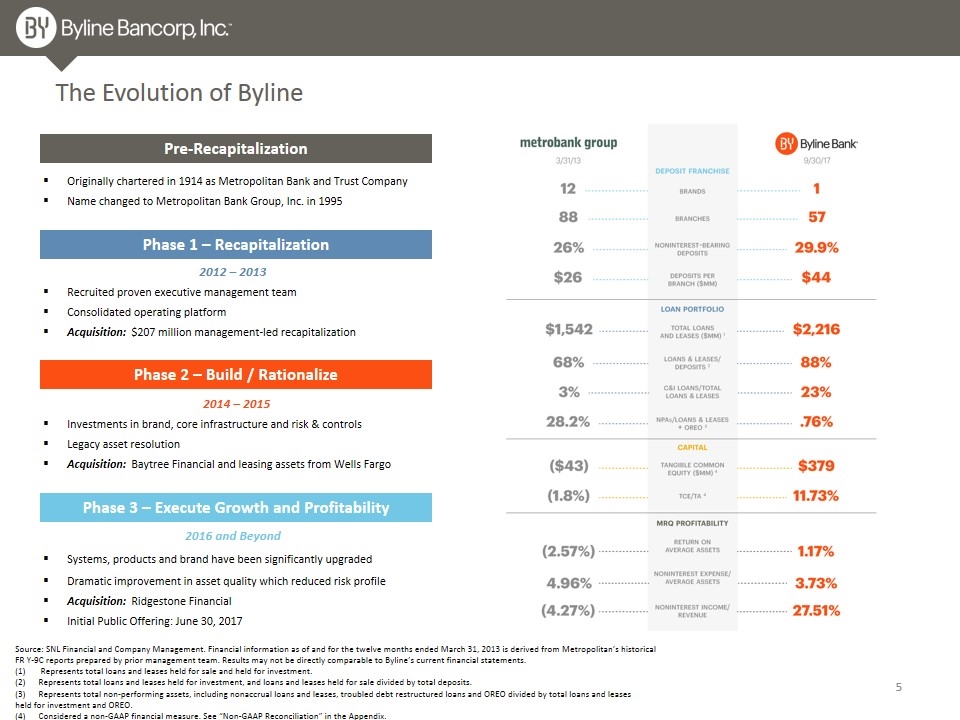
The Evolution of Byline 2014 – 2015 Investments in brand, core infrastructure and risk & controls Legacy asset resolution Acquisition: Baytree Financial and leasing assets from Wells Fargo 2016 and Beyond Systems, products and brand have been significantly upgraded Dramatic improvement in asset quality which reduced risk profile Acquisition: Ridgestone Financial Initial Public Offering: June 30, 2017 2012 – 2013 Recruited proven executive management team Consolidated operating platform Acquisition: $207 million management-led recapitalization Source: SNL Financial and Company Management. Financial information as of and for the twelve months ended March 31, 2013 is derived from Metropolitan’s historical FR Y-9C reports prepared by prior management team. Results may not be directly comparable to Byline’s current financial statements. Represents total loans and leases held for sale and held for investment. Represents total loans and leases held for investment, and loans and leases held for sale divided by total deposits. Represents total non-performing assets, including nonaccrual loans and leases, troubled debt restructured loans and OREO divided by total loans and leases held for investment and OREO. Considered a non-GAAP financial measure. See “Non-GAAP Reconciliation” in the Appendix. Phase 1 – Recapitalization Phase 2 – Build / Rationalize Phase 3 – Execute Growth and Profitability Originally chartered in 1914 as Metropolitan Bank and Trust Company Name changed to Metropolitan Bank Group, Inc. in 1995 Pre-Recapitalization
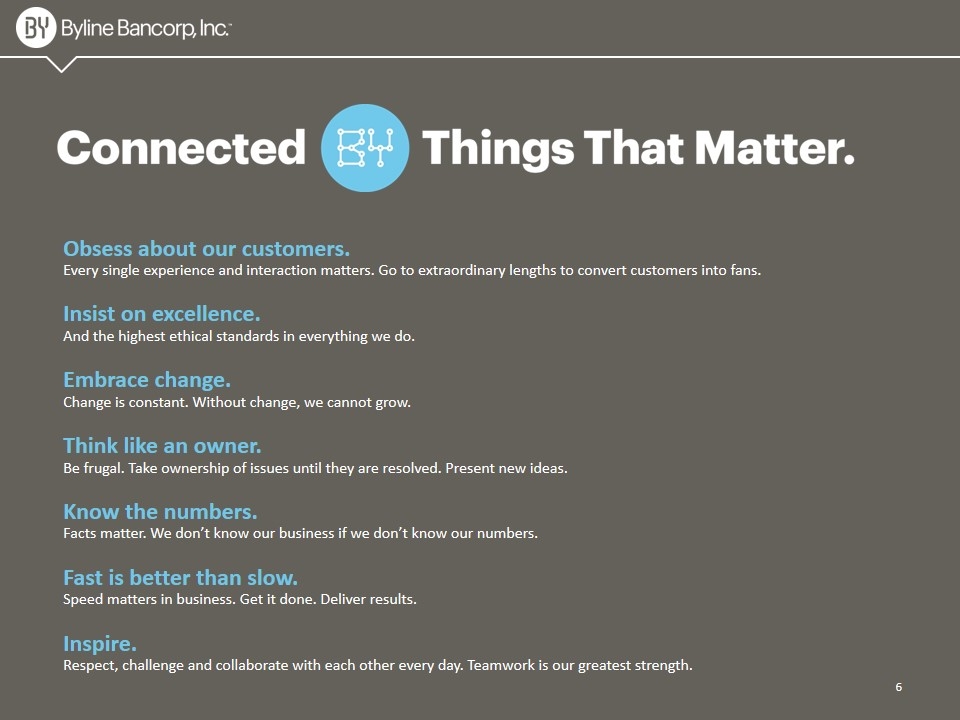
Obsess about our customers. Every single experience and interaction matters. Go to extraordinary lengths to convert customers into fans. Insist on excellence. And the highest ethical standards in everything we do. Embrace change. Change is constant. Without change, we cannot grow. Think like an owner. Be frugal. Take ownership of issues until they are resolved. Present new ideas. Know the numbers. Facts matter. We don’t know our business if we don’t know our numbers. Fast is better than slow. Speed matters in business. Get it done. Deliver results. Inspire. Respect, challenge and collaborate with each other every day. Teamwork is our greatest strength.
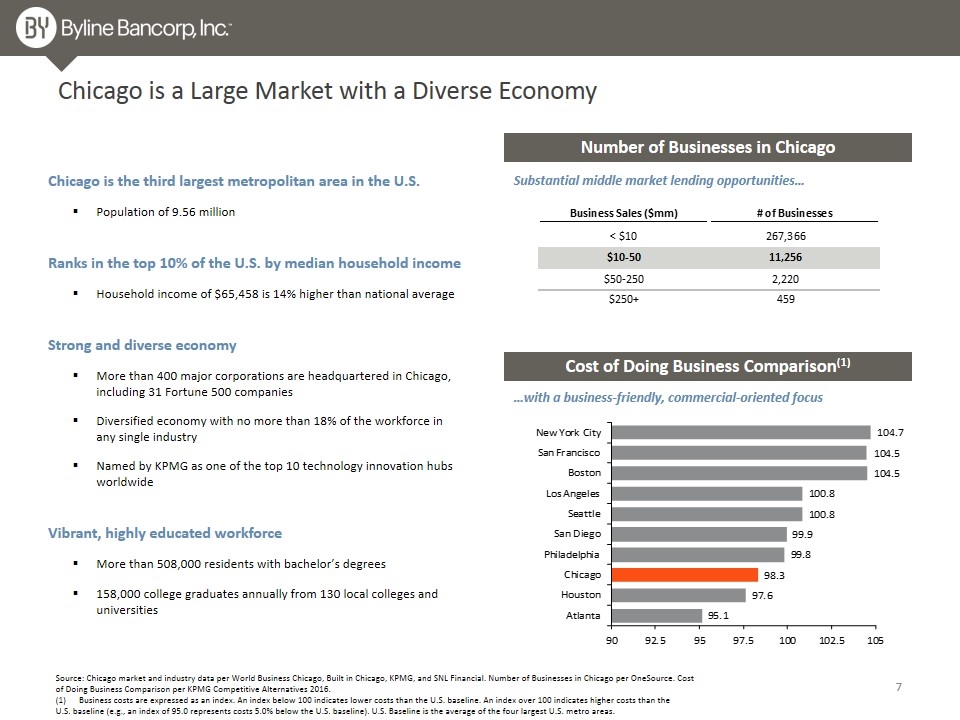
Chicago is a Large Market with a Diverse Economy Source: Chicago market and industry data per World Business Chicago, Built in Chicago, KPMG, and SNL Financial. Number of Businesses in Chicago per OneSource. Cost of Doing Business Comparison per KPMG Competitive Alternatives 2016. Business costs are expressed as an index. An index below 100 indicates lower costs than the U.S. baseline. An index over 100 indicates higher costs than the U.S. baseline (e.g., an index of 95.0 represents costs 5.0% below the U.S. baseline). U.S. Baseline is the average of the four largest U.S. metro areas. Number of Businesses in Chicago Cost of Doing Business Comparison(1) Substantial middle market lending opportunities… …with a business-friendly, commercial-oriented focus Chicago is the third largest metropolitan area in the U.S. Population of 9.56 million Ranks in the top 10% of the U.S. by median household income Household income of $65,458 is 14% higher than national average Strong and diverse economy More than 400 major corporations are headquartered in Chicago, including 31 Fortune 500 companies Diversified economy with no more than 18% of the workforce in any single industry Named by KPMG as one of the top 10 technology innovation hubs worldwide Vibrant, highly educated workforce More than 508,000 residents with bachelor’s degrees 158,000 college graduates annually from 130 local colleges and universities
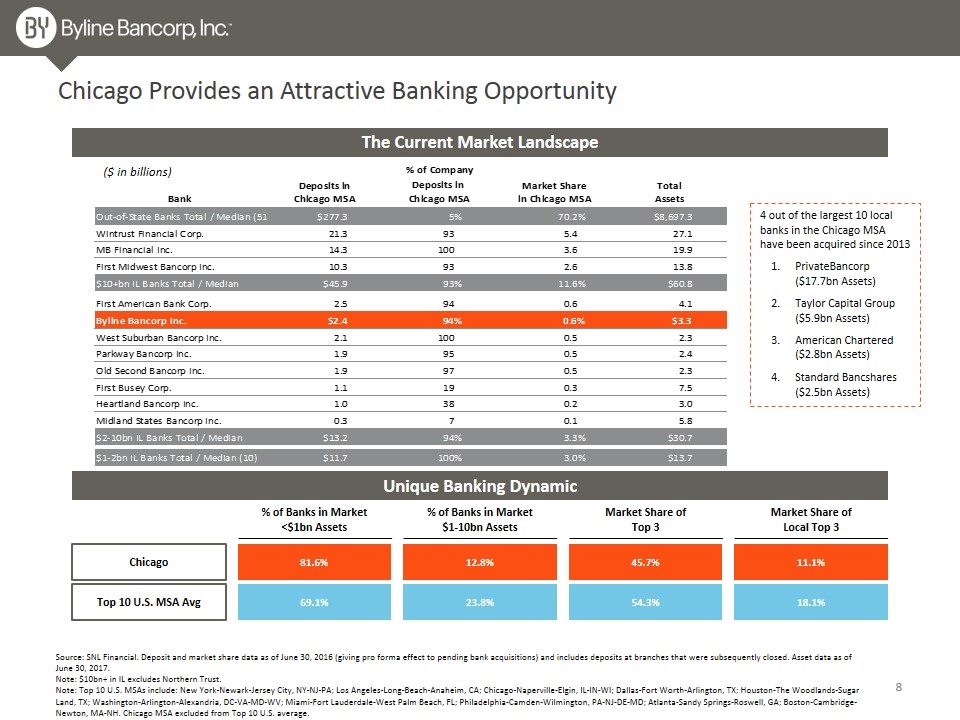
Chicago Provides an Attractive Banking Opportunity Source: SNL Financial. Deposit and market share data as of June 30, 2016 (giving pro forma effect to pending bank acquisitions) and includes deposits at branches that were subsequently closed. Asset data as of June 30, 2017. Note: $10bn+ in IL excludes Northern Trust. Note: Top 10 U.S. MSAs include: New York-Newark-Jersey City, NY-NJ-PA; Los Angeles-Long-Beach-Anaheim, CA; Chicago-Naperville-Elgin, IL-IN-WI; Dallas-Fort Worth-Arlington, TX; Houston-The Woodlands-Sugar Land, TX; Washington-Arlington-Alexandria, DC-VA-MD-WV; Miami-Fort Lauderdale-West Palm Beach, FL; Philadelphia-Camden-Wilmington, PA-NJ-DE-MD; Atlanta-Sandy Springs-Roswell, GA; Boston-Cambridge-Newton, MA-NH. Chicago MSA excluded from Top 10 U.S. average. The Current Market Landscape Unique Banking Dynamic Top 10 U.S. MSA Avg Chicago % of Banks in Market <$1bn Assets % of Banks in Market $1-10bn Assets Market Share of Top 3 Market Share of Local Top 3 81.6% 12.8% 45.7% 11.1% 69.1% 23.8% 54.3% 18.1% ($ in billions) 4 out of the largest 10 local banks in the Chicago MSA have been acquired since 2013 PrivateBancorp ($17.7bn Assets) Taylor Capital Group ($5.9bn Assets) American Chartered ($2.8bn Assets) Standard Bancshares ($2.5bn Assets)
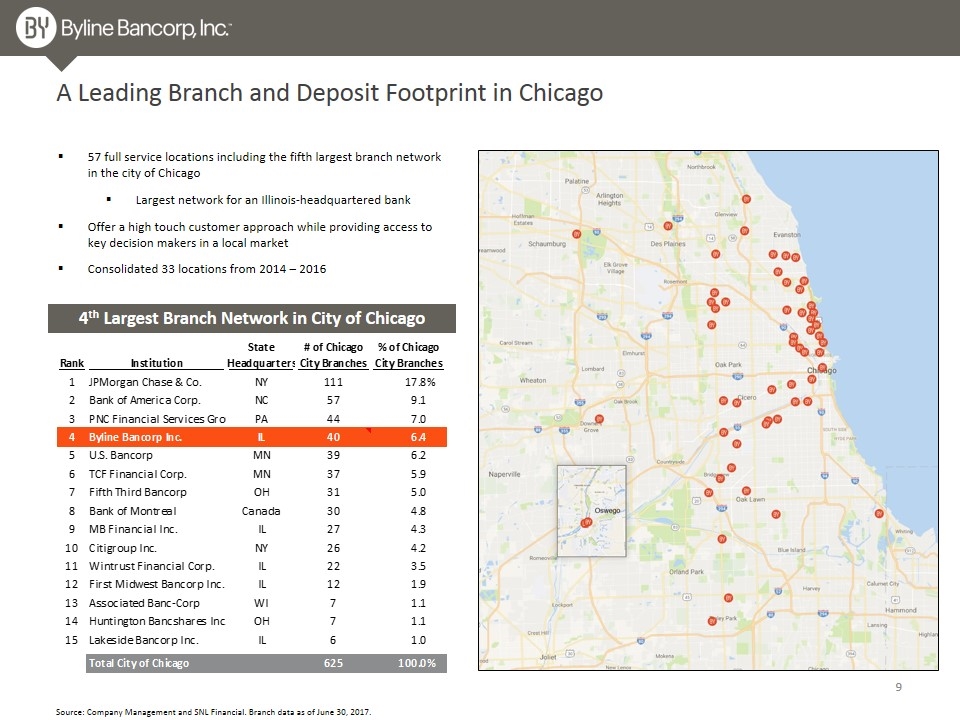
A Leading Branch and Deposit Footprint in Chicago 57 full service locations including the fifth largest branch network in the city of Chicago Largest network for an Illinois-headquartered bank Offer a high touch customer approach while providing access to key decision makers in a local market Consolidated 33 locations from 2014 – 2016 Source: Company Management and SNL Financial. Branch data as of June 30, 2017. 4th Largest Branch Network in City of Chicago
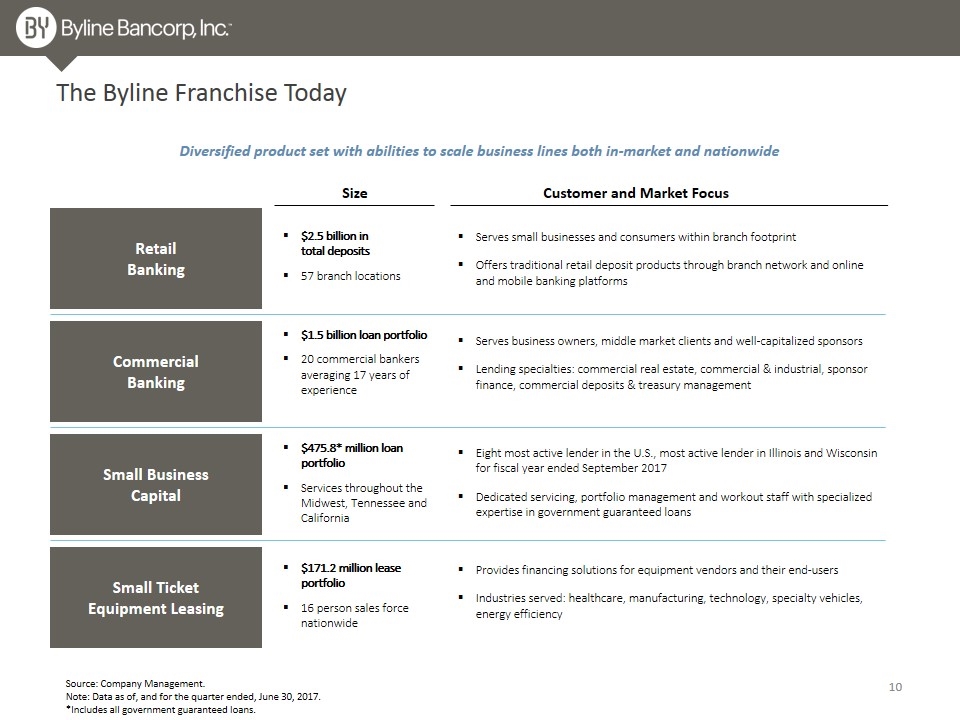
The Byline Franchise Today Retail Banking Commercial Banking Small Business Capital Small Ticket Equipment Leasing Diversified product set with abilities to scale business lines both in-market and nationwide Size Customer and Market Focus $2.5 billion in total deposits 57 branch locations Serves small businesses and consumers within branch footprint Offers traditional retail deposit products through branch network and online and mobile banking platforms $1.5 billion loan portfolio 20 commercial bankers averaging 17 years of experience Serves business owners, middle market clients and well-capitalized sponsors Lending specialties: commercial real estate, commercial & industrial, sponsor finance, commercial deposits & treasury management $475.8* million loan portfolio Services throughout the Midwest, Tennessee and California Eight most active lender in the U.S., most active lender in Illinois and Wisconsin for fiscal year ended September 2017 Dedicated servicing, portfolio management and workout staff with specialized expertise in government guaranteed loans $171.2 million lease portfolio 16 person sales force nationwide Provides financing solutions for equipment vendors and their end-users Industries served: healthcare, manufacturing, technology, specialty vehicles, energy efficiency Source: Company Management. Note: Data as of, and for the quarter ended, June 30, 2017. *Includes all government guaranteed loans.
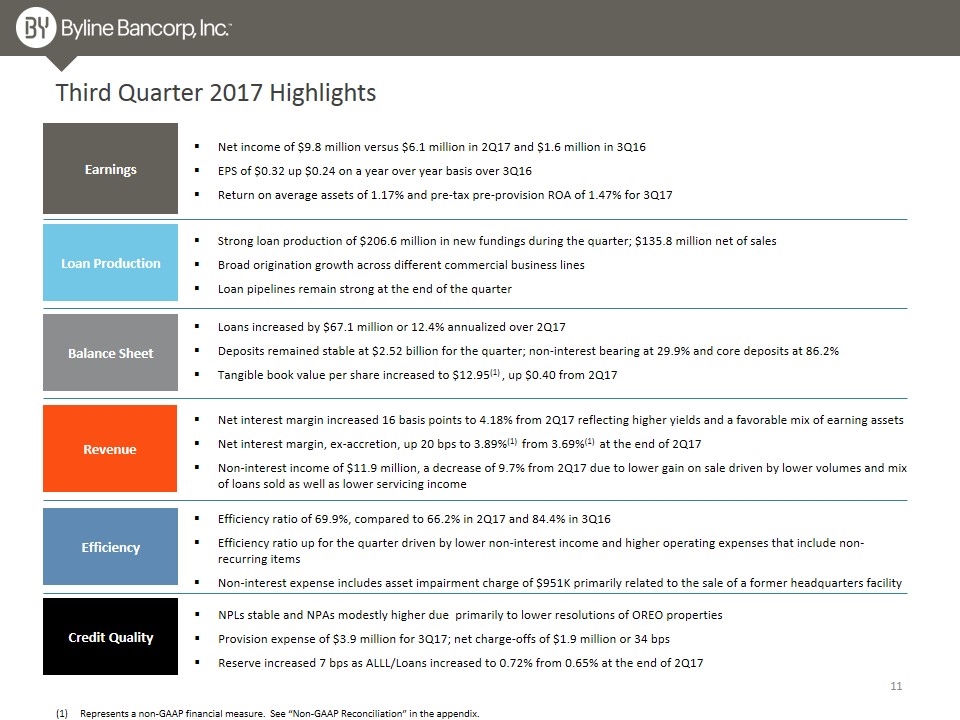
Third Quarter 2017 Highlights Earnings Revenue Loan Production Balance Sheet Efficiency Net income of $9.8 million versus $6.1 million in 2Q17 and $1.6 million in 3Q16 EPS of $0.32 up $0.24 on a year over year basis over 3Q16 Return on average assets of 1.17% and pre-tax pre-provision ROA of 1.47% for 3Q17 Net interest margin increased 16 basis points to 4.18% from 2Q17 reflecting higher yields and a favorable mix of earning assets Net interest margin, ex-accretion, up 20 bps to 3.89%(1) from 3.69%(1) at the end of 2Q17 Non-interest income of $11.9 million, a decrease of 9.7% from 2Q17 due to lower gain on sale driven by lower volumes and mix of loans sold as well as lower servicing income Loans increased by $67.1 million or 12.4% annualized over 2Q17 Deposits remained stable at $2.52 billion for the quarter; non-interest bearing at 29.9% and core deposits at 86.2% Tangible book value per share increased to $12.95(1) , up $0.40 from 2Q17 Efficiency ratio of 69.9%, compared to 66.2% in 2Q17 and 84.4% in 3Q16 Efficiency ratio up for the quarter driven by lower non-interest income and higher operating expenses that include non-recurring items Non-interest expense includes asset impairment charge of $951K primarily related to the sale of a former headquarters facility Credit Quality Strong loan production of $206.6 million in new fundings during the quarter; $135.8 million net of sales Broad origination growth across different commercial business lines Loan pipelines remain strong at the end of the quarter NPLs stable and NPAs modestly higher due primarily to lower resolutions of OREO properties Provision expense of $3.9 million for 3Q17; net charge-offs of $1.9 million or 34 bps Reserve increased 7 bps as ALLL/Loans increased to 0.72% from 0.65% at the end of 2Q17 Represents a non-GAAP financial measure. See “Non-GAAP Reconciliation” in the appendix.
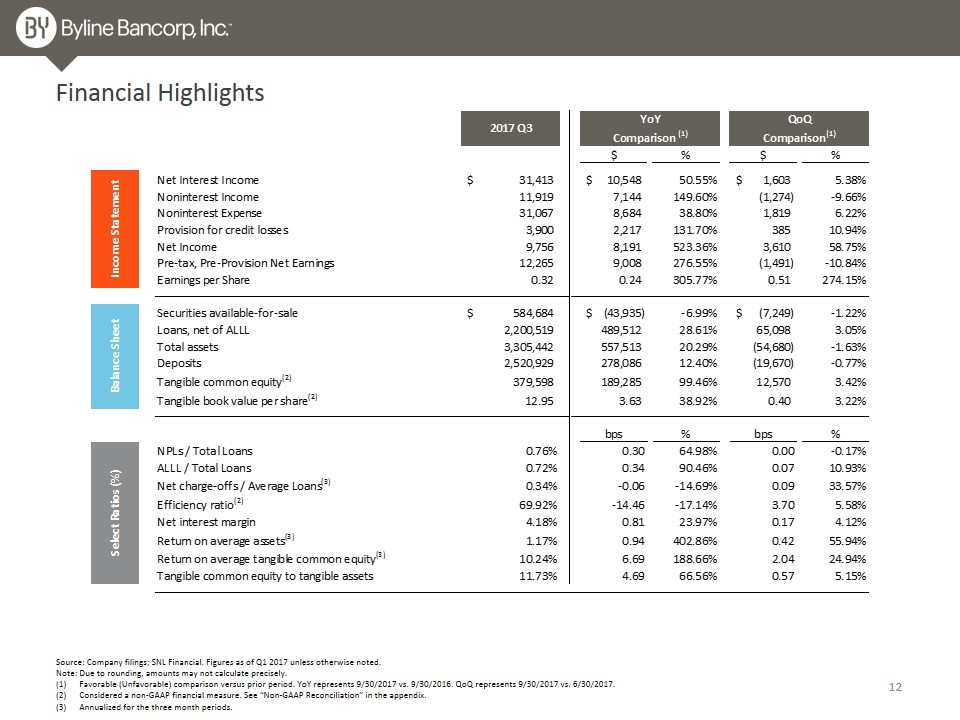
Financial Highlights Source: Company filings; SNL Financial. Figures as of Q1 2017 unless otherwise noted. Note: Due to rounding, amounts may not calculate precisely. Favorable (Unfavorable) comparison versus prior period. YoY represents 9/30/2017 vs. 9/30/2016. QoQ represents 9/30/2017 vs. 6/30/2017. Considered a non-GAAP financial measure. See “Non-GAAP Reconciliation” in the appendix. Annualized for the three month periods.
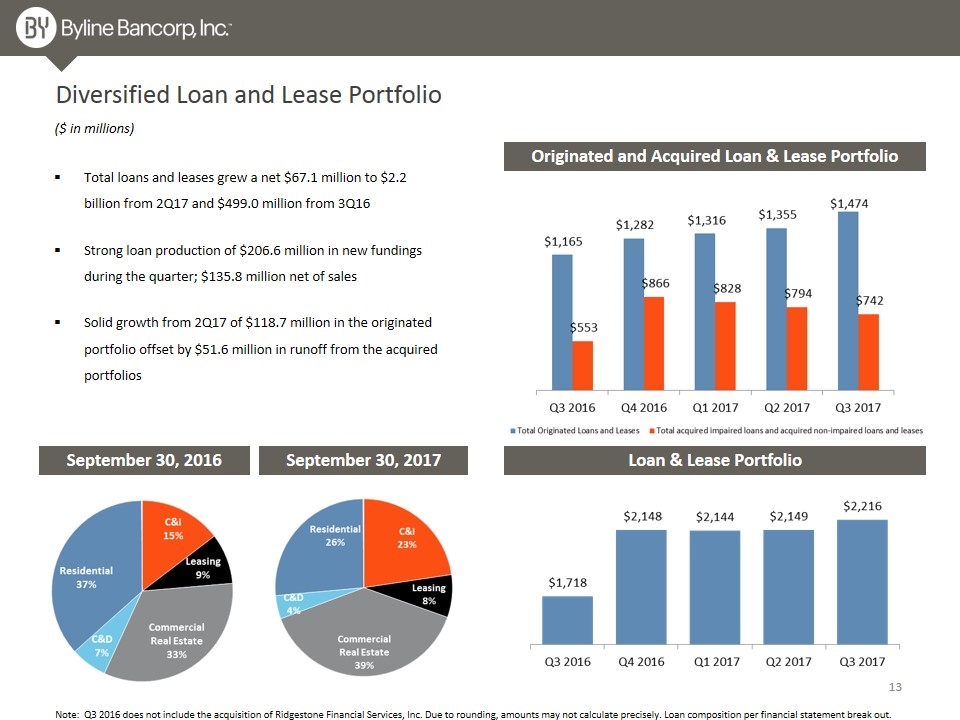
Diversified Loan and Lease Portfolio Loan & Lease Portfolio September 30, 2016 September 30, 2017 ($ in millions) Note: Q3 2016 does not include the acquisition of Ridgestone Financial Services, Inc. Due to rounding, amounts may not calculate precisely. Loan composition per financial statement break out. Originated and Acquired Loan & Lease Portfolio Total loans and leases grew a net $67.1 million to $2.2 billion from 2Q17 and $499.0 million from 3Q16 Strong loan production of $206.6 million in new fundings during the quarter; $135.8 million net of sales Solid growth from 2Q17 of $118.7 million in the originated portfolio offset by $51.6 million in runoff from the acquired portfolios

Total deposits remained stable for 3Q17 and at $2.5 billion Non-interest bearing remained strong at 29.9% Overall total deposit costs increased by 3 bps compared to 2Q17 Improvement in deposit mix as core deposits increase to 86.2% driven by growth in Money Market accounts offsetting the decline in CDs Significant Core Deposit Base Core Deposits(1) / Total Deposits ($ in millions) Deposit Composition Note: Q3 2016 does not include the acquisition of Ridgestone Financial Services, Inc. (1) Core deposits defined as all deposits excluding time deposits exceeding $100,000. $2,243 $2,541 $2,521 $2,490 $2,576 Cost of Interest Bearing Deposits
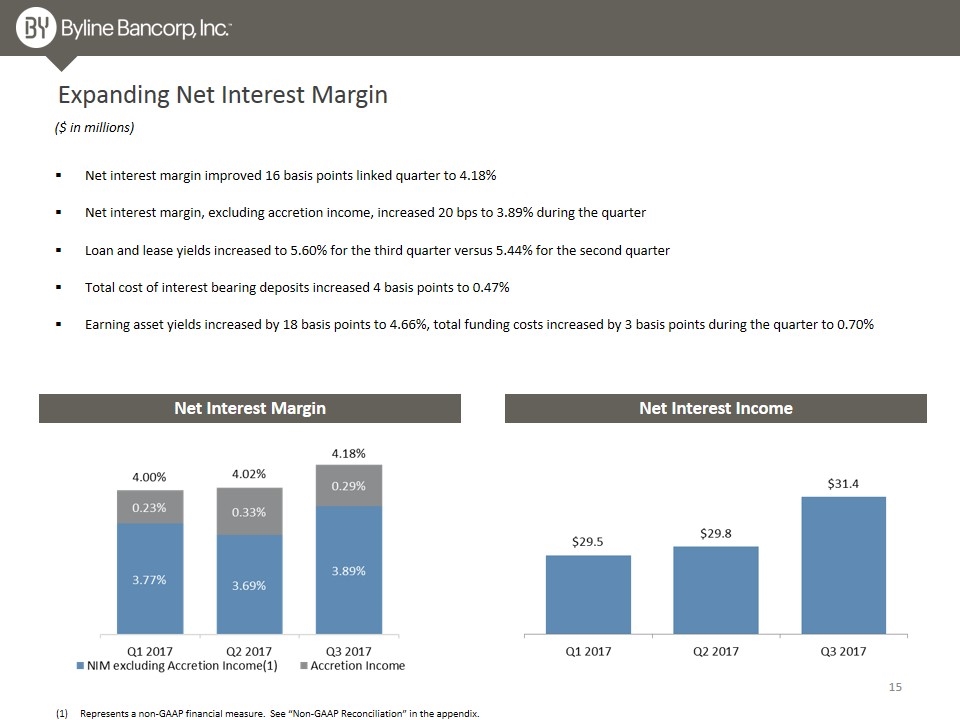
Expanding Net Interest Margin Net interest margin improved 16 basis points linked quarter to 4.18% Net interest margin, excluding accretion income, increased 20 bps to 3.89% during the quarter Loan and lease yields increased to 5.60% for the third quarter versus 5.44% for the second quarter Total cost of interest bearing deposits increased 4 basis points to 0.47% Earning asset yields increased by 18 basis points to 4.66%, total funding costs increased by 3 basis points during the quarter to 0.70% Net Interest Margin Net Interest Income Represents a non-GAAP financial measure. See “Non-GAAP Reconciliation” in the appendix. ($ in millions)
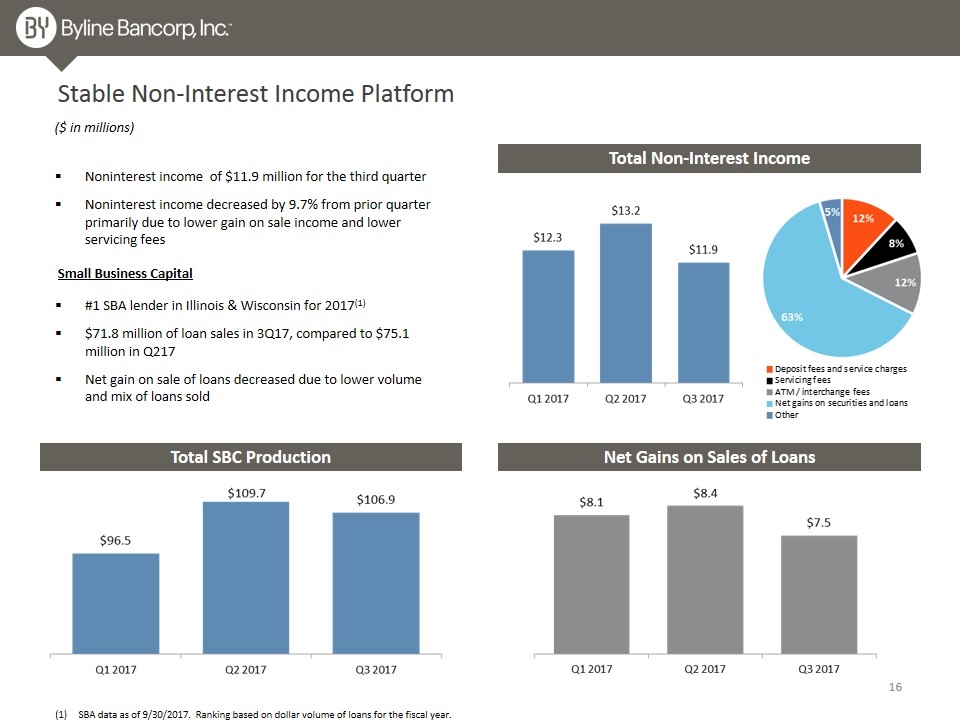
Total Non-Interest Income Stable Non-Interest Income Platform Noninterest income of $11.9 million for the third quarter Noninterest income decreased by 9.7% from prior quarter primarily due to lower gain on sale income and lower servicing fees ($ in millions) Total SBC Production Net Gains on Sales of Loans #1 SBA lender in Illinois & Wisconsin for 2017(1) $71.8 million of loan sales in 3Q17, compared to $75.1 million in Q217 Net gain on sale of loans decreased due to lower volume and mix of loans sold Small Business Capital (1) SBA data as of 9/30/2017. Ranking based on dollar volume of loans for the fiscal year.
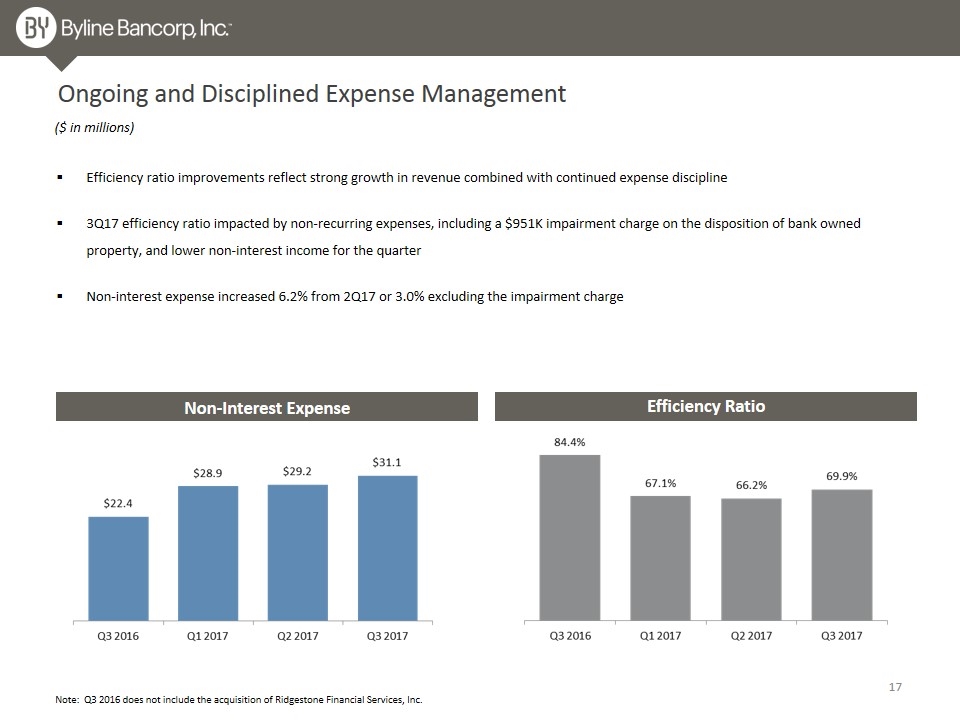
Ongoing and Disciplined Expense Management Efficiency ratio improvements reflect strong growth in revenue combined with continued expense discipline 3Q17 efficiency ratio impacted by non-recurring expenses, including a $951K impairment charge on the disposition of bank owned property, and lower non-interest income for the quarter Non-interest expense increased 6.2% from 2Q17 or 3.0% excluding the impairment charge ($ in millions) Efficiency Ratio Note: Q3 2016 does not include the acquisition of Ridgestone Financial Services, Inc. Non-Interest Expense
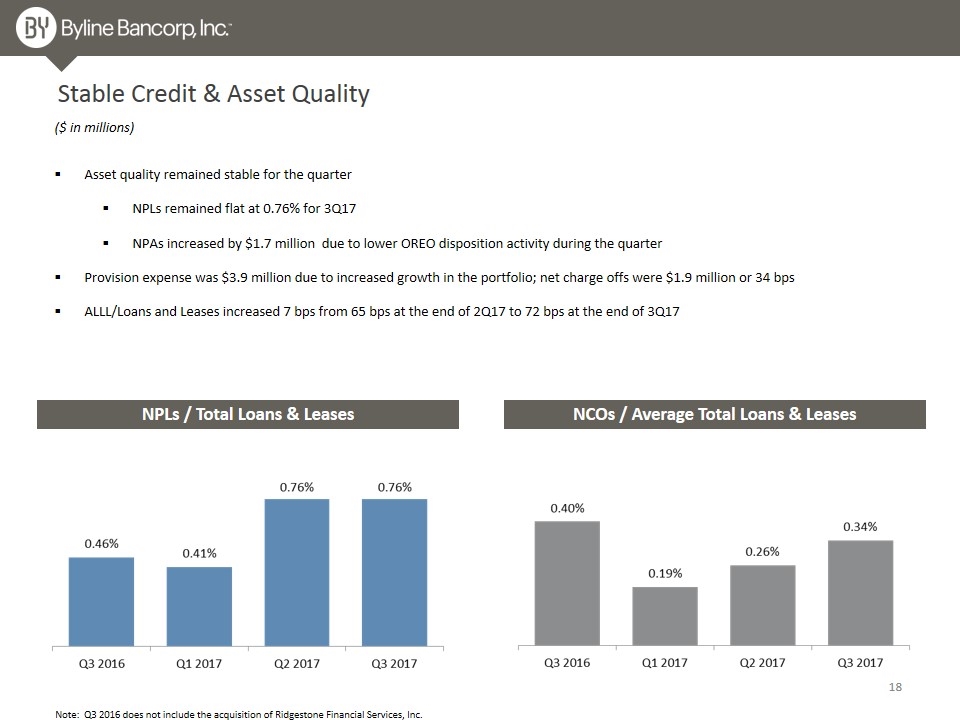
Stable Credit & Asset Quality Asset quality remained stable for the quarter NPLs remained flat at 0.76% for 3Q17 NPAs increased by $1.7 million due to lower OREO disposition activity during the quarter Provision expense was $3.9 million due to increased growth in the portfolio; net charge offs were $1.9 million or 34 bps ALLL/Loans and Leases increased 7 bps from 65 bps at the end of 2Q17 to 72 bps at the end of 3Q17 NPLs / Total Loans & Leases NCOs / Average Total Loans & Leases Note: Q3 2016 does not include the acquisition of Ridgestone Financial Services, Inc. ($ in millions)
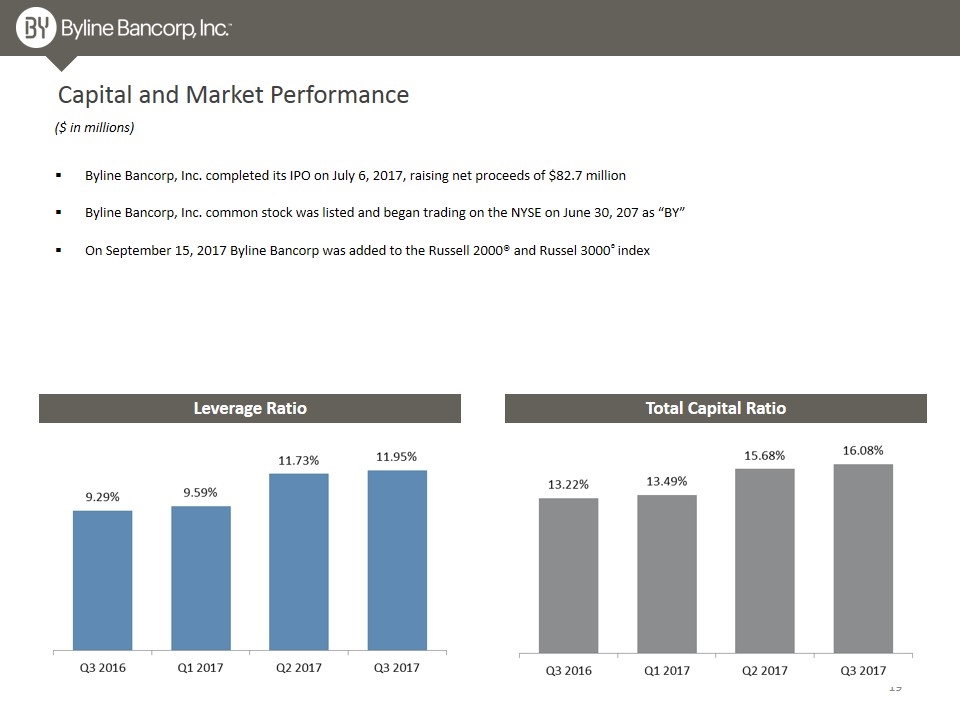
Capital and Market Performance Leverage Ratio Total Capital Ratio ($ in millions) Byline Bancorp, Inc. completed its IPO on July 6, 2017, raising net proceeds of $82.7 million Byline Bancorp, Inc. common stock was listed and began trading on the NYSE on June 30, 207 as “BY” On September 15, 2017 Byline Bancorp was added to the Russell 2000® and Russel 3000® index
Appendix
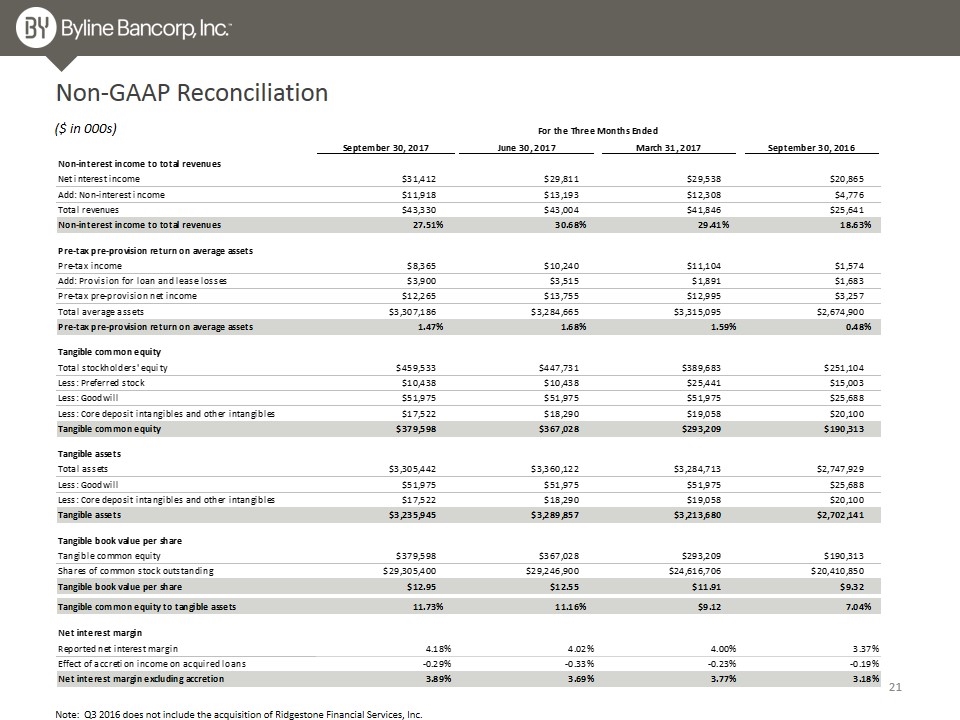
Non-GAAP Reconciliation ($ in 000s) Note: Q3 2016 does not include the acquisition of Ridgestone Financial Services, Inc.
