Attached files
| file | filename |
|---|---|
| EX-99.1 - ASHLAND GLOBAL HOLDINGS INC | ex991.htm |
| 8-K - ASHLAND GLOBAL HOLDINGS INC | form8k.htm |

Fourth-Quarter Fiscal 2017 Earnings November 6, 2017 / efficacy usability allure integrity profitability

Forward-Looking StatementsThis presentation contains forward-looking statements within the meaning of Section 27A of the Securities Act of 1933, as amended and Section 21E of the Securities Exchange Act of 1934, as amended. Ashland has identified some of these forward-looking statements with words such as “anticipates,” “believes,” “expects,” “estimates,” “is likely,” “predicts,” “projects,” “forecasts,” “objectives,” “may,” “will,” “should,” “plans” and “intends” and the negative of these words or other comparable terminology. Ashland may from time to time make forward-looking statements in its annual reports, quarterly reports and other filings with the SEC, news releases and other written and oral communications. These forward-looking statements are based on Ashland’s expectations and assumptions, as of the date such statements are made, regarding Ashland’s future operating performance and financial condition, as well as the economy and other future events or circumstances. Ashland’s expectations and assumptions include, without limitation, internal forecasts and analyses of current and future market conditions and trends, management plans and strategies, operating efficiencies and economic conditions (such as prices, supply and demand, cost of raw materials, and the ability to recover raw-material cost increases through price increases), and risks and uncertainties associated with the following: the impact of acquisitions and/or divestitures Ashland has made or may make, including the acquisition of Pharmachem (including the possibility that Ashland may not realize the anticipated benefits from such transactions); Ashland’s substantial indebtedness (including the possibility that such indebtedness and related restrictive covenants may adversely affect Ashland’s future cash flows, results of operations, financial condition and its ability to repay debt); the potential that Ashland does not realize all of the expected benefits of the separation of its Valvoline business; and severe weather, natural disasters, cyber events and legal proceedings and claims (including product recalls, environmental and asbestos matters). Various risks and uncertainties may cause actual results to differ materially from those stated, projected or implied by any forward-looking statements, including, without limitation, risks and uncertainties affecting Ashland that are described in Ashland’s most recent Form 10-K (including Item 1A Risk Factors) filed with the SEC, which is available on Ashland’s website at http://investor.ashland.com or on the SEC’s website at http://www.sec.gov. Ashland believes its expectations and assumptions are reasonable, but there can be no assurance that the expectations reflected herein will be achieved. Unless legally required, Ashland undertakes no obligation to update any forward-looking statements made in this presentation whether as a result of new information, future events or otherwise. Information on Ashland’s website is not incorporated into or a part of this presentation.Regulation G: Adjusted ResultsThe information presented herein regarding certain unaudited adjusted results does not conform to generally accepted accounting principles in the United States (U.S. GAAP) and should not be construed as an alternative to the reported results determined in accordance with U.S. GAAP. Ashland has included this non-GAAP information to assist in understanding the operating performance of the company and its reportable segments. The non-GAAP information provided may not be consistent with the methodologies used by other companies. All non-GAAP information related to previous Ashland filings with the SEC has been reconciled with reported U.S. GAAP results. Although Ashland provides forward-looking guidance for adjusted EBITDA, adjusted EPS and free cash flow, Ashland is not reaffirming or providing forward-looking guidance for U.S. GAAP-reported financial measures or a reconciliation of forward-looking non-GAAP financial measures to the most directly comparable U.S. GAAP measure because it is unable to predict with reasonable certainty the ultimate outcome of certain significant items without unreasonable effort. 2
Fourth Quarter Summary

Ashland Global Holdings Inc.Adjusted Results Summary1 4 HighlightsSales up 17%; acquisitions and currency contributing 10 percentage points and 1 percentage point, respectivelyReported net loss of $58 million; loss from continuing operations of $53 million or $0.84 per diluted shareEBITDA up 13% to $161 millionAdjusted EPS equaled $0.78Excl. intangible amortization, adjusted EPS would have been $1.04Key DriversAll three reportable segments show organic year-over-year (YOY) improvementsAcquisitions make strong contributionsTax rate lower than expected due to income mix Ashland‘s earnings release dated November 6, 2017, available on Ashland's website at http://investor.ashland.com, reconciles adjusted amounts to amounts reported under GAAP.

Specialty IngredientsAdjusted Results Summary1 HighlightsSales up 12%Gross profit margin up 150 bpsEBITDA up 12%Key DriversStrong Pharmachem contribution; increased EBITDA from the business excluding acquisition impactGross profit improvement driven by gains in Personal Care, Pharma and better asset utilization, more than offset greater-than-anticipated raw material inflationAdditional pricing actions introduced during the quarterSG&A increase driven primarily by acquisition and currency Ashland‘s earnings release dated November 6, 2017, available on Ashland's website at http://investor.ashland.com, reconciles adjusted amounts to amounts reported under GAAP. 5
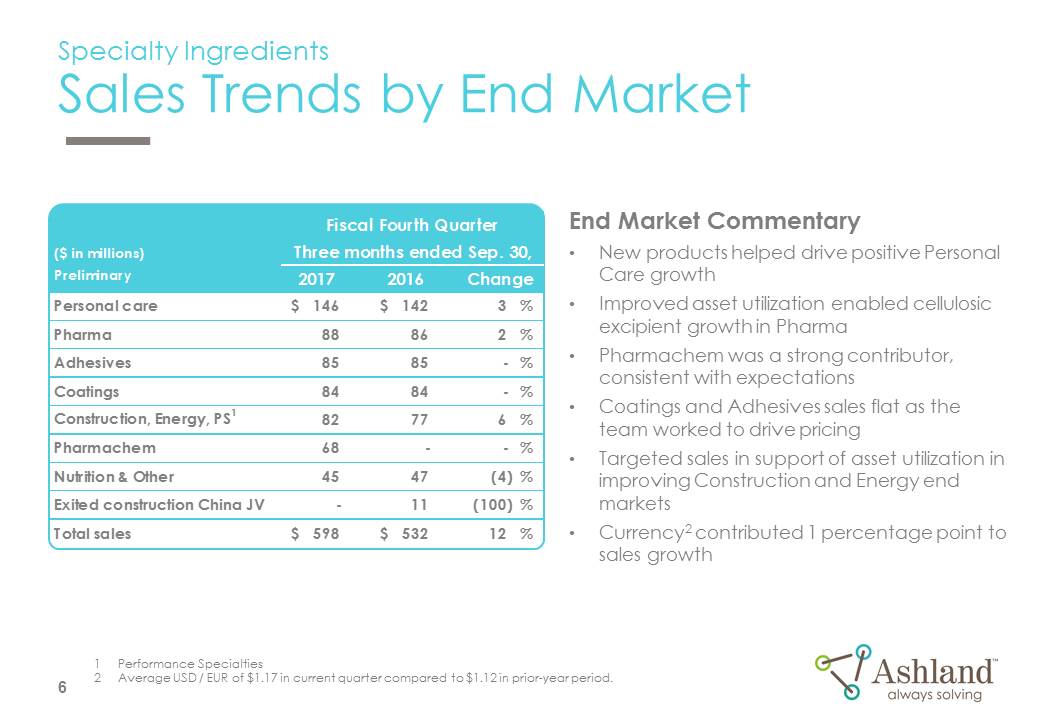
Specialty IngredientsSales Trends by End Market 6 End Market CommentaryNew products helped drive positive Personal Care growthImproved asset utilization enabled cellulosic excipient growth in PharmaPharmachem was a strong contributor, consistent with expectationsCoatings and Adhesives sales flat as the team worked to drive pricingTargeted sales in support of asset utilization in improving Construction and Energy end marketsCurrency2 contributed 1 percentage point to sales growth Performance SpecialtiesAverage USD / EUR of $1.17 in current quarter compared to $1.12 in prior-year period.
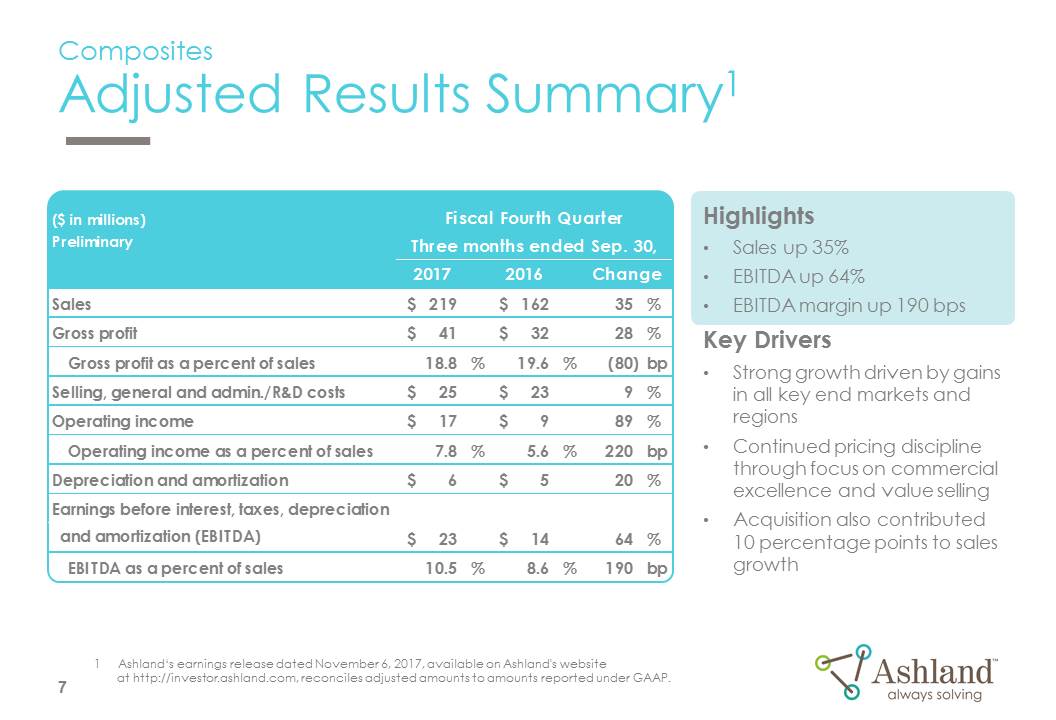
CompositesAdjusted Results Summary1 Ashland‘s earnings release dated November 6, 2017, available on Ashland's website at http://investor.ashland.com, reconciles adjusted amounts to amounts reported under GAAP. 7 HighlightsSales up 35%EBITDA up 64%EBITDA margin up 190 bpsKey DriversStrong growth driven by gains in all key end markets and regionsContinued pricing discipline through focus on commercial excellence and value sellingAcquisition also contributed 10 percentage points to sales growth

Intermediates & SolventsAdjusted Results Summary1 Ashland‘s earnings release dated November 6, 2017, available on Ashland's website at http://investor.ashland.com, reconciles adjusted amounts to amounts reported under GAAP. 8 HighlightsSales up 5%EBITDA increased to $10 millionEBITDA margin increased to 15.9%Key DriversStrong price escalation during the quarterMarket demand remains healthy

Fiscal Year Summary

Ashland Global Holdings Inc.Fiscal Year 2017 Summary1 Ashland‘s earnings release dated November 6, 2017, available on Ashland's website at http://investor.ashland.com, reconciles free cash flow to amounts reported under GAAP. See Appendix D for a reconciliation of adjusted EBITDA. Definition of free cash flow: operating cash flow less capital expenditures and other items Ashland has deemed non-operational (if applicable). 10 Full Year HighlightsSales up 8% to $3.3 billionSales growth in all three segmentsResults include the impact of ~$85 million of YOY raw material cost increases and unfavorable FXCompleted final Valvoline (VVV) separationAcquired Pharmachem and a composites facility in Etain, FranceOperating cash flow of $255 millionCapital expenditures of $199 millionFree cash flow2 (FCF) of $56 million, inclusive of ~$80 million of one-time separation-related paymentsBoard reauthorized remaining $500 million on the $1 billion share repurchase authorization

Outlook Summary

Ashland Global Holdings Inc.First-Quarter Fiscal 2018 Outlook HighlightsExpect Q1 adjusted EPS in the range of $0.35 - $0.45 vs. $0.14 prior yearBased on an effective tax rate of 10 percentKey DriversSpecialty IngredientsContinued contribution from PharmachemExcluding acquisitions, improving YOY sales growthSeasonality consistent with historical patternsContinued gains driven by better asset utilizationCoatings expected to return to growth; positive traction seen in October resultsPrice vs. raw material costs nearing parity in a volatile and inflationary environmentComposites: continued growth and pricing disciplineI&S: continued price recovery in BDO and related derivatives 12

Ashland Global Holdings Inc.Fiscal Year 2018 Outlook 13 For fiscal 2017, loss from continuing operations per diluted share was $1.69 and adjusted earnings from continuing operations per diluted share was $2.44. Ashland‘s earnings release dated November 6, 2017, available on Ashland's website at http://investor.ashland.com, reconciles adjusted amounts to amounts reported under GAAP. HighlightsAdjusted EPS outlook in the range of $3.20 - $3.40 representing YOY growth in the range of ~30 - 40%1Growth driven by:$0.50 - $0.70 base earnings growth~$0.12 impact from acquisitions / divestitures made during FY20172~$0.14 favorable FX rates, driven primarily by the Euro3 (assumed $1.17 USD/EUR for full year)Based on an effective tax rate of 10% for the yearCash tax rate in the range of 20 – 25%FCF4 greater than $220 million, consistent with Investor Day expectations Assumes estimated operating income impact, less interest expense from Pharmachem debt, effective tax rate of 35%, 64 million diluted share outstanding.Estimated currency sensitivity, primarily driven by the Euro, of approximately $1.5 million of annual adjusted EBITDA or YOY Euro cent change.Definition of free cash flow: operating cash flow less capital expenditures and other items Ashland has deemed non-operational (if applicable).

Appendix A: Bridges

Specialty IngredientsSales and Adjusted EBITDA Bridges ($ millions)Preliminary 15 Acquisitions include Pharmachem Laboratories, Inc. 0% Q4 2016 Volume / Mix 532 598 0% 1% 11% Sales Price FX Acq/Div/Other1 Q4 2017 2 Q4 2016 Volume/ Mix 126 141 3 (2) 2 10 Adjusted EBITDA Margin SG&A FX Q4 2017 Acq/Div/Other1

CompositesSales and Adjusted EBITDA Bridges ($ millions)Preliminary 16 Acquisitions include the composites facility in Etain, France. 13% Q4 2016 Volume / Mix 162 219 9% 2% 11% Sales Price FX Acq/Div/Other1 Q4 2017 5 Q4 2016 Volume/ Mix 14 23 2 (1) 1 2 Adjusted EBITDA Margin SG&A FX Q4 2017 Acq/Div/Other1

Intermediates & SolventsSales and Adjusted EBITDA Bridges ($ millions)Preliminary 17 (6%) Q4 2016 Volume / Mix 60 63 8% 3% 0% Sales Price FX Acq/Div/Other Q4 2017 0 Q4 2016 Volume/ Mix 3 10 8 (1) 0 0 Adjusted EBITDA Margin SG&A FX Q4 2017 Acq/Div/Other

Appendix B: Key Items and Balance Sheet
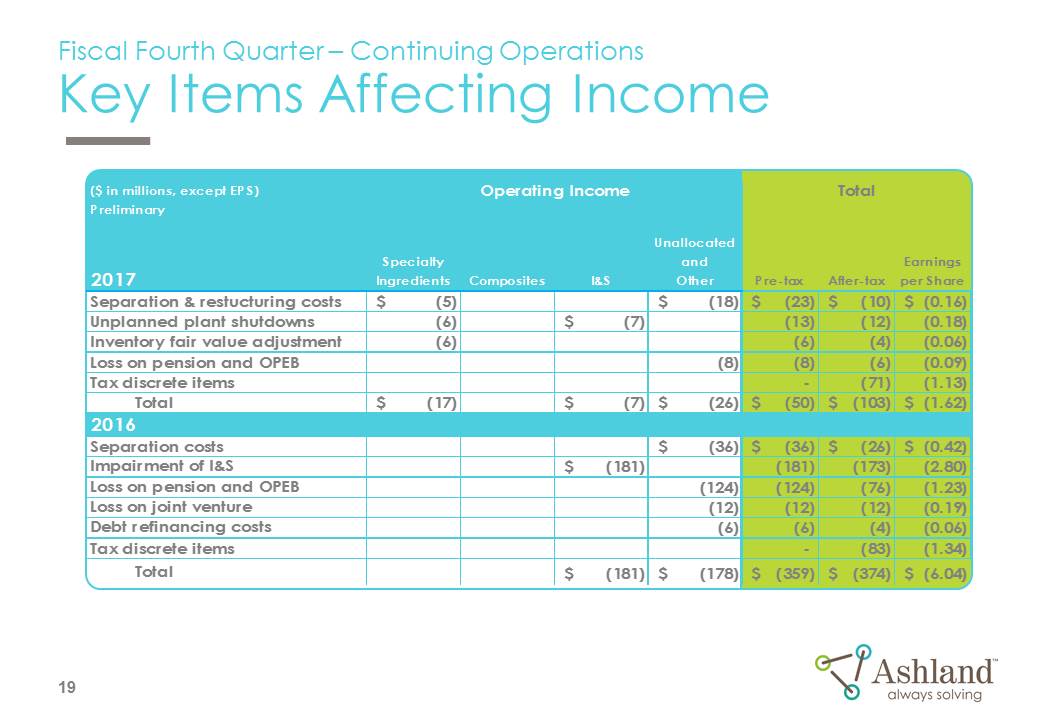
Fiscal Fourth Quarter – Continuing OperationsKey Items Affecting Income 19

Liquidity and Net Debt ($ in millions) 20

Appendix C: Business Profiles 12 Months Ended September 30, 2017

Corporate Profile By business unit By geography 1 For 12 months ended September 30, 2017.2 Ashland includes only U.S. and Canada in its North America designation. North America240% Asia Pacific18% LatinAmerica/Other - 9% Europe 33% SpecialtyIngredients68% Intermediates and Solvents8% Composites24% Sales1 - $3.3 Billion 22

Corporate Profile For 12 months ended September 30, 2017. See Appendix D for reconciliation to amounts reported under GAAP. NYSE Ticker Symbol: ASH Total Employees: ~6,500 Outside North America ~50% Number of Countries in Which Ashland Has Sales: More than 100 SpecialtyIngredients81% Intermediates and Solvents4% Adjusted EBITDA1 - $570 Million 23
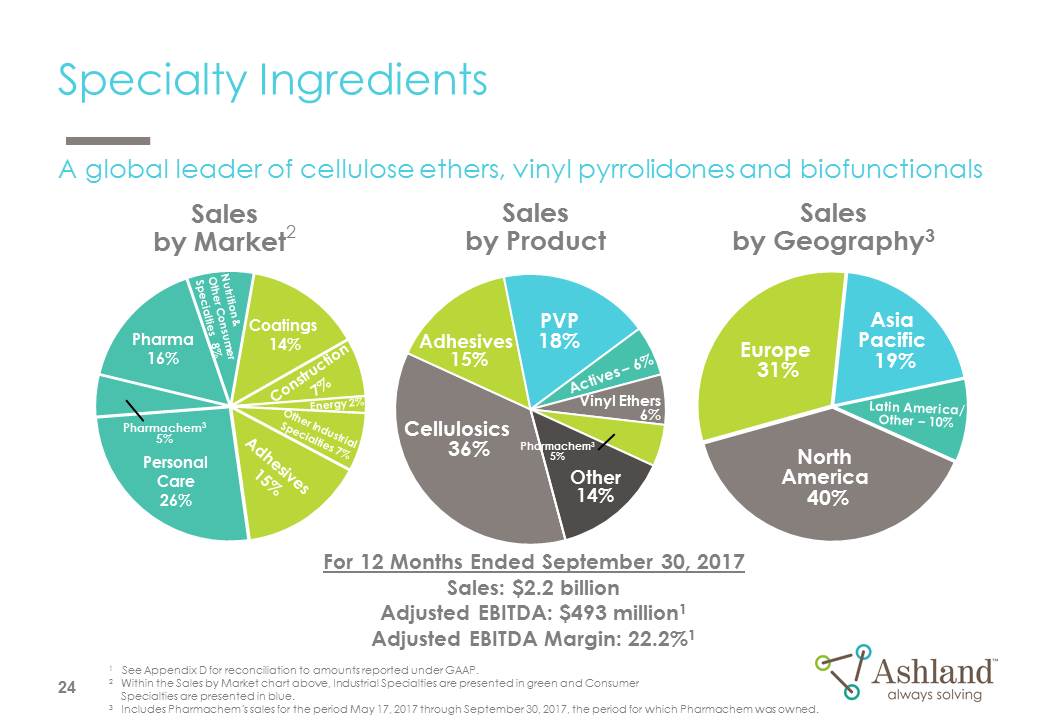
Specialty Ingredients Salesby Market2 For 12 Months Ended September 30, 2017Sales: $2.2 billionAdjusted EBITDA: $493 million1Adjusted EBITDA Margin: 22.2%1 Salesby Product Cellulosics 36% PVP18% Adhesives 15% North America 40% AsiaPacific 19% Europe 31% Latin America/Other – 10% Actives – 6% Vinyl Ethers6% Salesby Geography3 1 See Appendix D for reconciliation to amounts reported under GAAP.2 Within the Sales by Market chart above, Industrial Specialties are presented in green and Consumer Specialties are presented in blue.3 Includes Pharmachem’s sales for the period May 17, 2017 through September 30, 2017, the period for which Pharmachem was owned. 24 A global leader of cellulose ethers, vinyl pyrrolidones and biofunctionals Pharmachem3 5% Pharmachem3 5%

Composites Salesby Geography For 12 Months Ended September 30, 2017Sales: $779 millionAdjusted EBITDA: $89 million1Adjusted EBITDA Margin: 11.4%1 Salesby Product UPR/VER283% Gel coats and other17% Construction: Residential19% Marine 23% Construction:Industrial39% Salesby Market North America47% Asia Pacific – 15% Europe30% Latin America/Other 8% Transportation 11% Construction: Infrastructure 8% 1 See Appendix D for reconciliation to amounts reported under GAAP.2 UPR stands for unsaturated polyester resins and VER stands for vinyl ester resins. 25 A global leader in unsaturated polyester resins, vinyl ester resins and gel coats
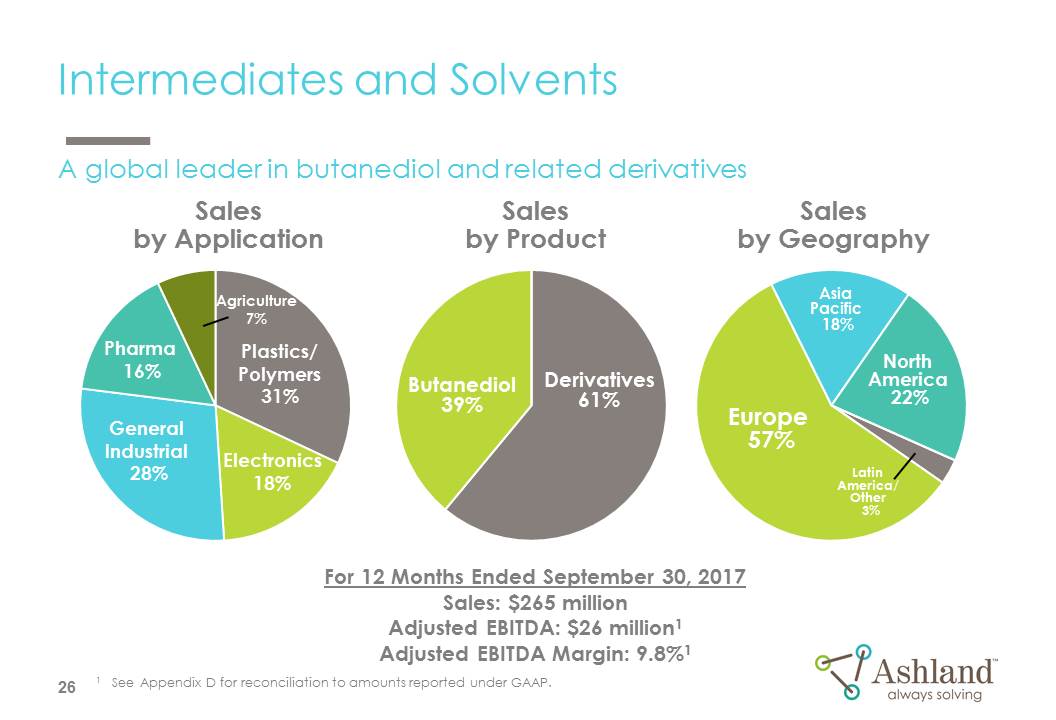
Intermediates and Solvents Salesby Geography For 12 Months Ended September 30, 2017Sales: $265 millionAdjusted EBITDA: $26 million1Adjusted EBITDA Margin: 9.8%1 Salesby Product Butanediol39% Derivatives61% GeneralIndustrial 28% Plastics/Polymers31% Salesby Application North America 22% Asia Pacific 18% Europe 57% Latin America/Other 3% 1 See Appendix D for reconciliation to amounts reported under GAAP. 26 A global leader in butanediol and related derivatives Pharma 16% Agriculture7%

Appendix D: Non-GAAP Reconciliation1 Although Ashland provides forward looking guidance for adjusted EBITDA in this presentation, Ashland is not reaffirming or providing forward-looking guidance for U.S. GAAP reported financial measures or a reconciliation of forward-looking non-GAAP financial measures to the most directly comparable U.S. GAAP measure because it is unable to predict with reasonable certainty the ultimate outcome of certain significant items without unreasonable effort.
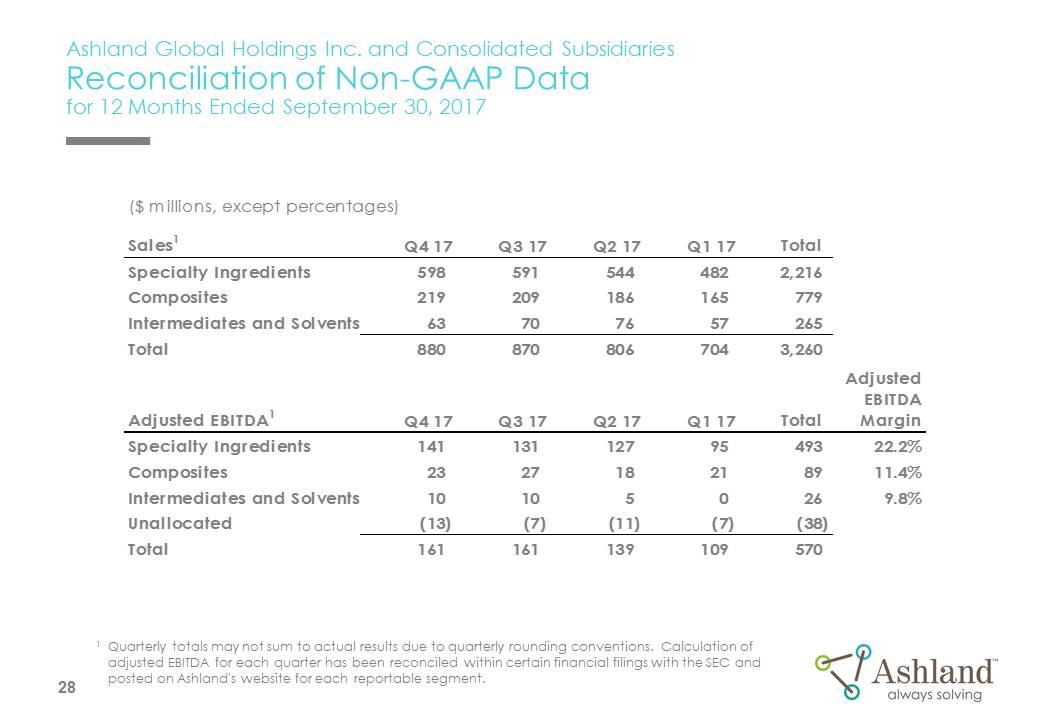
Ashland Global Holdings Inc. and Consolidated SubsidiariesReconciliation of Non-GAAP Data for 12 Months Ended September 30, 2017 North America2__% Asia Pacific__% LatinAmerica/Other - _% Europe __% AshlandSpecialtyIngredients__% AshlandPerformanceMaterials__% Valvoline__% 1 Quarterly totals may not sum to actual results due to quarterly rounding conventions. Calculation of adjusted EBITDA for each quarter has been reconciled within certain financial filings with the SEC and posted on Ashland's website for each reportable segment. 28

® Registered trademark, Ashland or its subsidiaries, registered in various countries™ Trademark, Ashland or its subsidiaries, registered in various countries