Attached files
| file | filename |
|---|---|
| EX-99.1 - EX-99.1_PR_P2DATA_CARDINAL - REATA PHARMACEUTICALS INC | reta-ex991_11.htm |
| 8-K - 8-K CARDINAL DATA RELEASE - REATA PHARMACEUTICALS INC | reta-8k_20171103.htm |
Primary phase 2 analyses from CARDINAL: a Phase 2/3 Study of Bardoxolone Methyl in Patients with Alport Syndrome 2017 American Society of Nephrology Meeting Geoffrey A. Block1, Pablo E. Pergola2, Lesley Inker3, Peter A. McCullough4, Melanie Chin5, Colin J. Meyer5, Michelle N. Rheault6, Clifford E. Kashtan6, David G. Warnock7 1 Denver Nephrology, Denver, CO; 2 Renal Associates, San Antonio, TX; 3 Tufts Medical Center, Boston, MA; 4 Baylor University Medical Center, Dallas, TX; 5 Reata Pharmaceuticals, Irving, TX; 6 University of Minnesota, Minneapolis, MN; 7 UAB, Birmingham, AL Exhibit 99.2
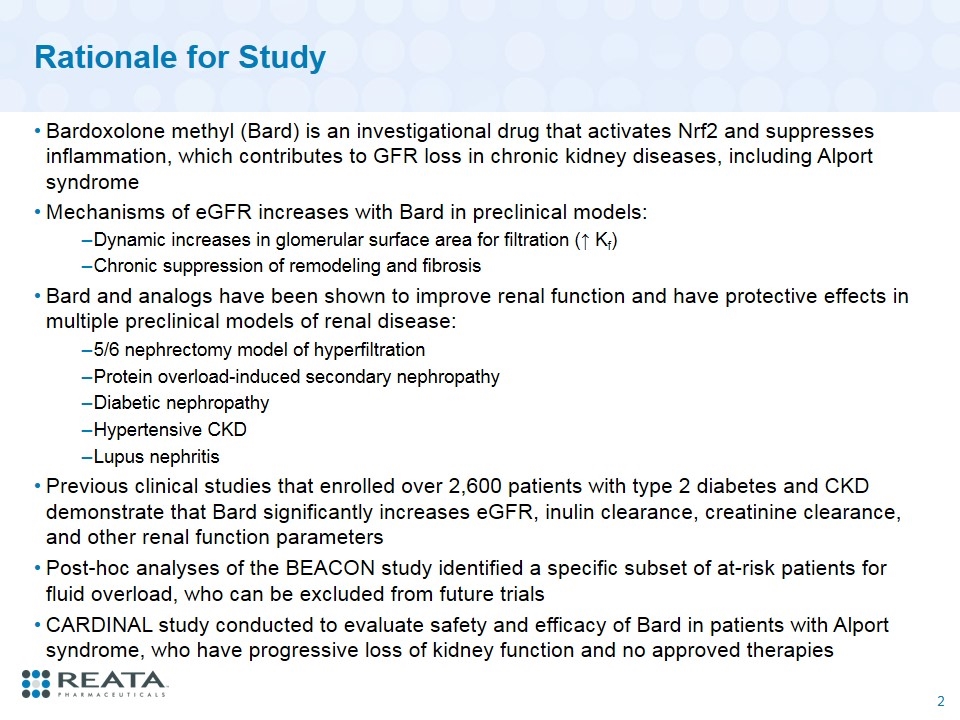
Rationale for Study Bardoxolone methyl (Bard) is an investigational drug that activates Nrf2 and suppresses inflammation, which contributes to GFR loss in chronic kidney diseases, including Alport syndrome Mechanisms of eGFR increases with Bard in preclinical models: Dynamic increases in glomerular surface area for filtration (↑ Kf) Chronic suppression of remodeling and fibrosis Bard and analogs have been shown to improve renal function and have protective effects in multiple preclinical models of renal disease: 5/6 nephrectomy model of hyperfiltration Protein overload-induced secondary nephropathy Diabetic nephropathy Hypertensive CKD Lupus nephritis Previous clinical studies that enrolled over 2,600 patients with type 2 diabetes and CKD demonstrate that Bard significantly increases eGFR, inulin clearance, creatinine clearance, and other renal function parameters Post-hoc analyses of the BEACON study identified a specific subset of at-risk patients for fluid overload, who can be excluded from future trials CARDINAL study conducted to evaluate safety and efficacy of Bard in patients with Alport syndrome, who have progressive loss of kidney function and no approved therapies
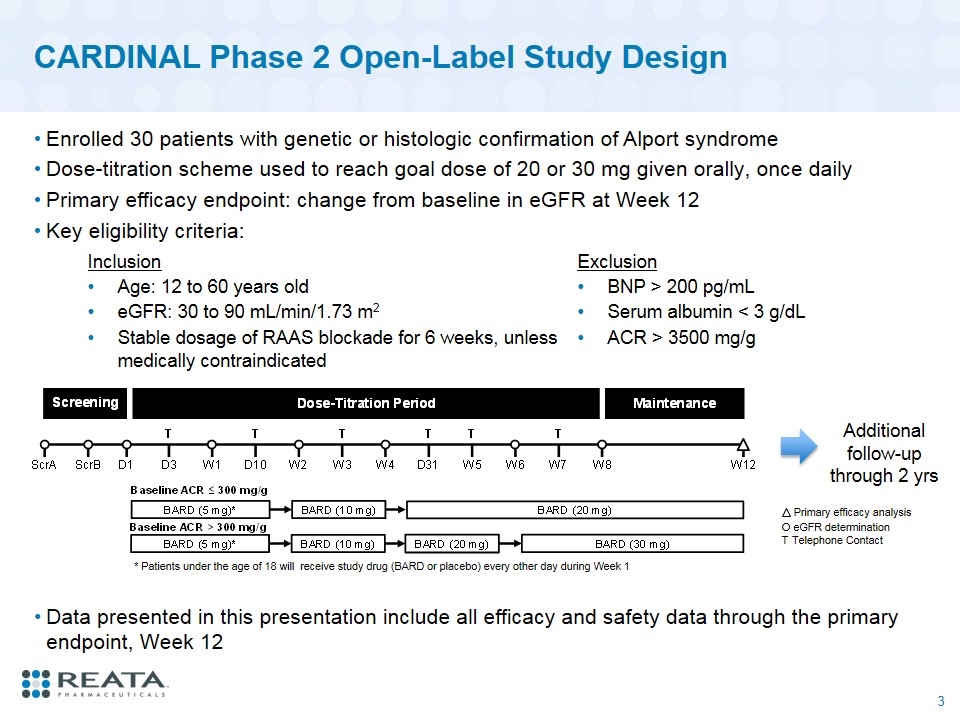
CARDINAL Phase 2 Open-Label Study Design Enrolled 30 patients with genetic or histologic confirmation of Alport syndrome Dose-titration scheme used to reach goal dose of 20 or 30 mg given orally, once daily Primary efficacy endpoint: change from baseline in eGFR at Week 12 Key eligibility criteria: O eGFR determination T Telephone Contact Primary efficacy analysis * Patients under the age of 18 will receive study drug (BARD or placebo) every other day during Week 1 Inclusion Exclusion Age: 12 to 60 years old BNP > 200 pg/mL eGFR: 30 to 90 mL/min/1.73 m2 Serum albumin < 3 g/dL Stable dosage of RAAS blockade for 6 weeks, unless medically contraindicated ACR > 3500 mg/g Additional follow-up through 2 yrs Data presented in this presentation include all efficacy and safety data through the primary endpoint, Week 12
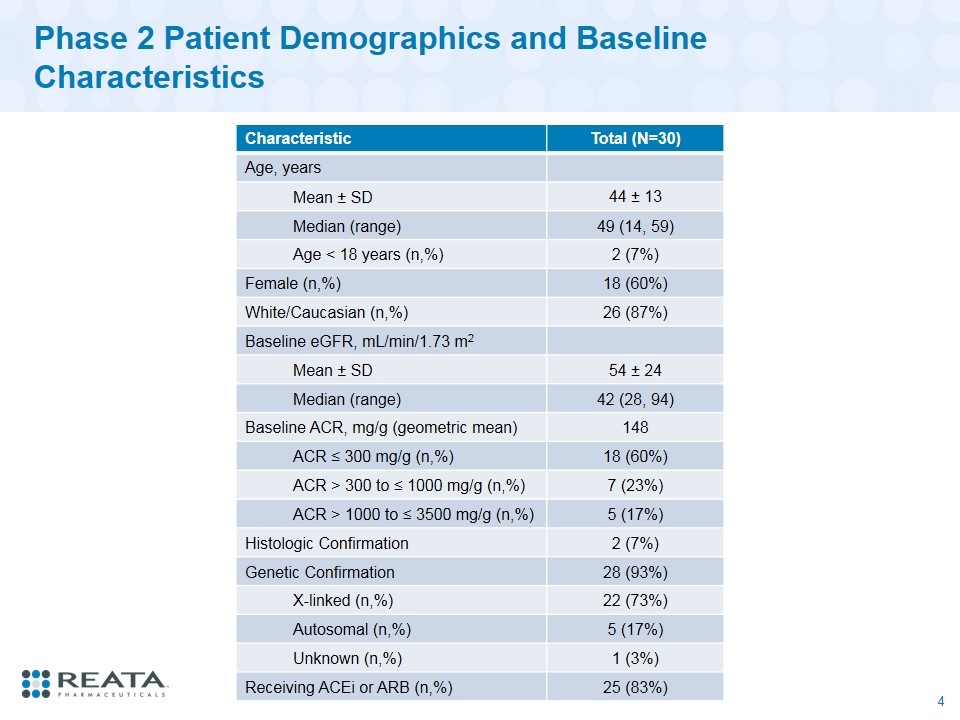
Phase 2 Patient Demographics and Baseline Characteristics Characteristic Total (N=30) Age, years Mean ± SD 44 ± 13 Median (range) 49 (14, 59) Age < 18 years (n,%) 2 (7%) Female (n,%) 18 (60%) White/Caucasian (n,%) 26 (87%) Baseline eGFR, mL/min/1.73 m2 Mean ± SD 54 ± 24 Median (range) 42 (28, 94) Baseline ACR, mg/g (geometric mean) 148 ACR ≤ 300 mg/g (n,%) 18 (60%) ACR > 300 to ≤ 1000 mg/g (n,%) 7 (23%) ACR > 1000 to ≤ 3500 mg/g (n,%) 5 (17%) Histologic Confirmation 2 (7%) Genetic Confirmation 28 (93%) X-linked (n,%) 22 (73%) Autosomal (n,%) 5 (17%) Unknown (n,%) 1 (3%) Receiving ACEi or ARB (n,%) 25 (83%)
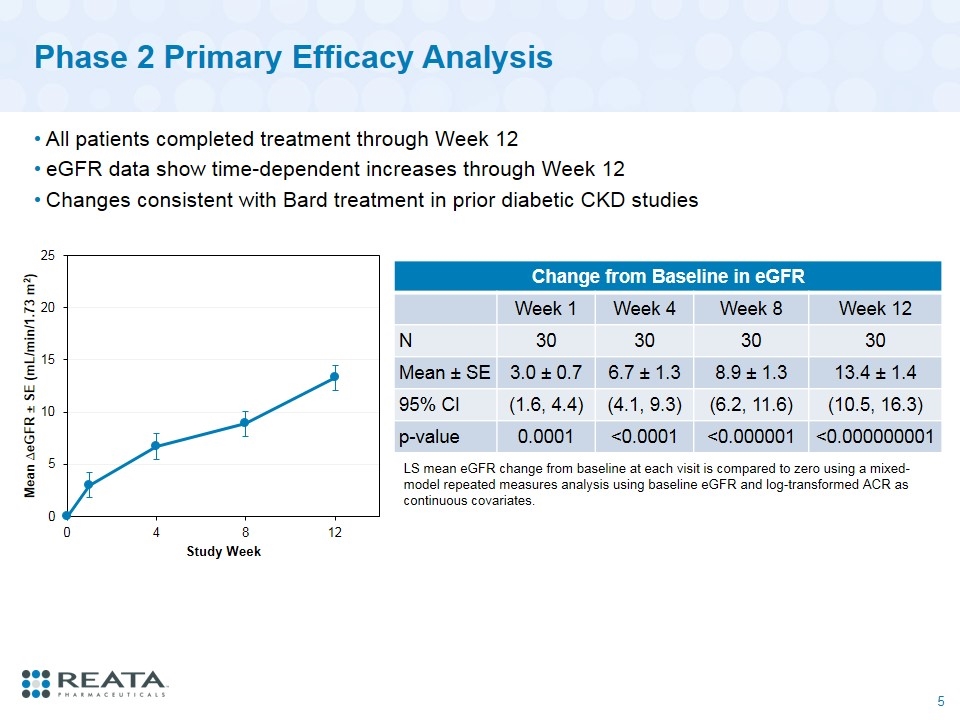
Phase 2 Primary Efficacy Analysis All patients completed treatment through Week 12 eGFR data show time-dependent increases through Week 12 Changes consistent with Bard treatment in prior diabetic CKD studies Change from Baseline in eGFR Week 1 Week 4 Week 8 Week 12 N 30 30 30 30 Mean ± SE 3.0 ± 0.7 6.7 ± 1.3 8.9 ± 1.3 13.4 ± 1.4 95% CI (1.6, 4.4) (4.1, 9.3) (6.2, 11.6) (10.5, 16.3) p-value 0.0001 <0.0001 <0.000001 <0.000000001 LS mean eGFR change from baseline at each visit is compared to zero using a mixed-model repeated measures analysis using baseline eGFR and log-transformed ACR as continuous covariates.
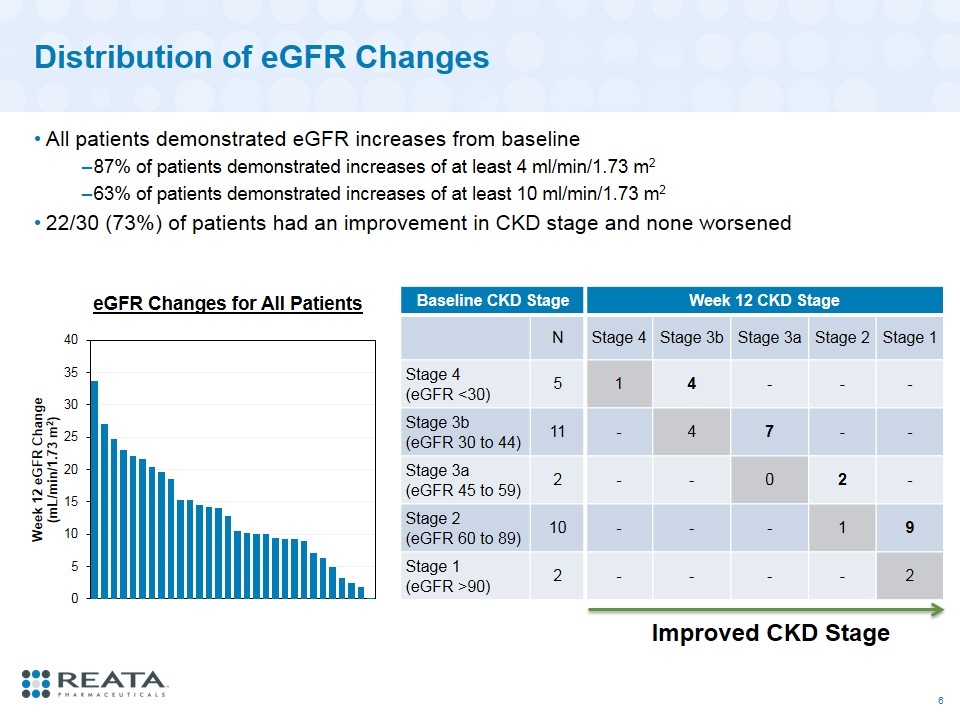
Distribution of eGFR Changes All patients demonstrated eGFR increases from baseline 87% of patients demonstrated increases of at least 4 ml/min/1.73 m2 63% of patients demonstrated increases of at least 10 ml/min/1.73 m2 22/30 (73%) of patients had an improvement in CKD stage and none worsened Baseline CKD Stage Week 12 CKD Stage N Stage 4 Stage 3b Stage 3a Stage 2 Stage 1 Stage 4 (eGFR <30) 5 1 4 - - - Stage 3b (eGFR 30 to 44) 11 - 4 7 - - Stage 3a (eGFR 45 to 59) 2 - - 0 2 - Stage 2 (eGFR 60 to 89) 10 - - - 1 9 Stage 1 (eGFR >90) 2 - - - - 2 Improved CKD Stage eGFR Changes for All Patients
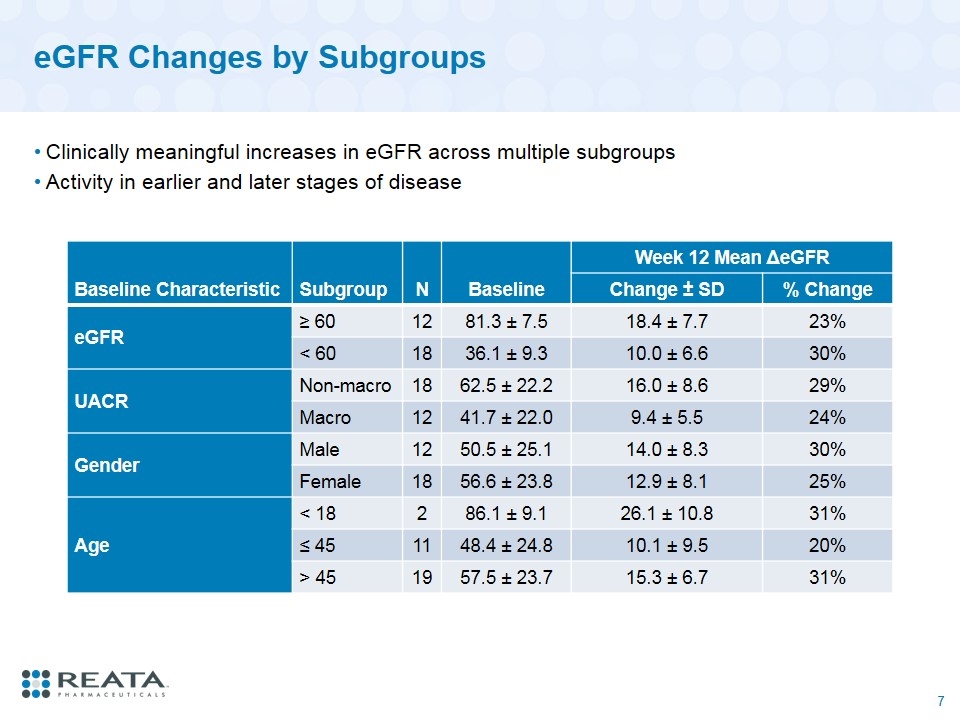
eGFR Changes by Subgroups Clinically meaningful increases in eGFR across multiple subgroups Activity in earlier and later stages of disease Baseline Characteristic Subgroup N Baseline Week 12 Mean ΔeGFR Change ± SD % Change eGFR ≥ 60 12 81.3 ± 7.5 18.4 ± 7.7 23% < 60 18 36.1 ± 9.3 10.0 ± 6.6 30% UACR Non-macro 18 62.5 ± 22.2 16.0 ± 8.6 29% Macro 12 41.7 ± 22.0 9.4 ± 5.5 24% Gender Male 12 50.5 ± 25.1 14.0 ± 8.3 30% Female 18 56.6 ± 23.8 12.9 ± 8.1 25% Age < 18 2 86.1 ± 9.1 26.1 ± 10.8 31% ≤ 45 11 48.4 ± 24.8 10.1 ± 9.5 20% > 45 19 57.5 ± 23.7 15.3 ± 6.7 31%
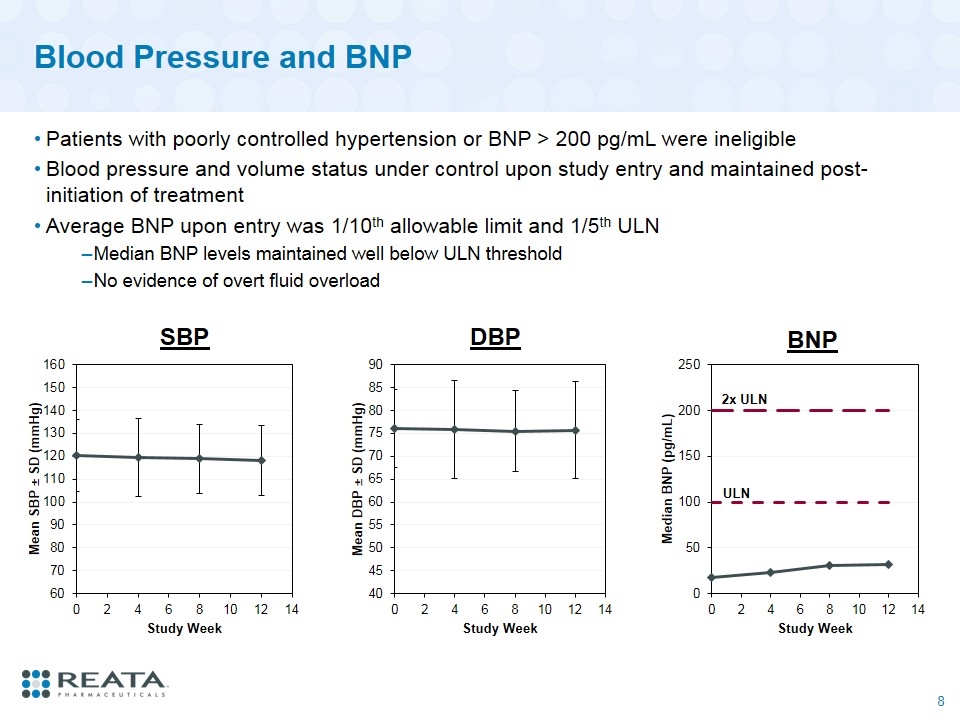
Blood Pressure and BNP Patients with poorly controlled hypertension or BNP > 200 pg/mL were ineligible Blood pressure and volume status under control upon study entry and maintained post-initiation of treatment Average BNP upon entry was 1/10th allowable limit and 1/5th ULN Median BNP levels maintained well below ULN threshold No evidence of overt fluid overload SBP DBP 2x ULN BNP ULN
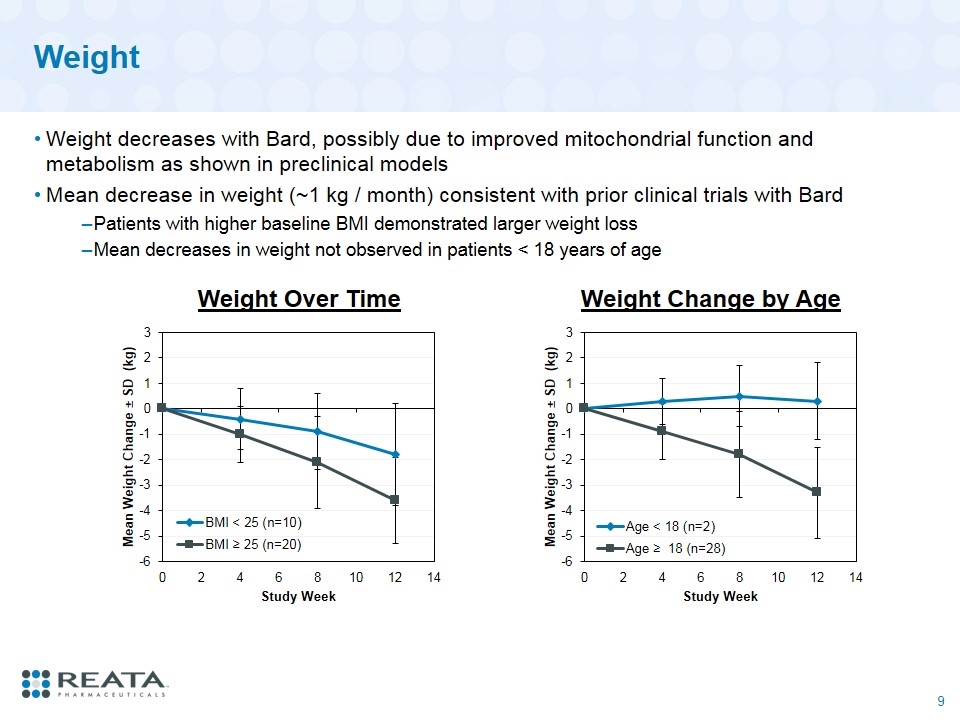
Weight Weight decreases with Bard, possibly due to improved mitochondrial function and metabolism as shown in preclinical models Mean decrease in weight (~1 kg / month) consistent with prior clinical trials with Bard Patients with higher baseline BMI demonstrated larger weight loss Mean decreases in weight not observed in patients < 18 years of age Weight Change by Age Weight Over Time
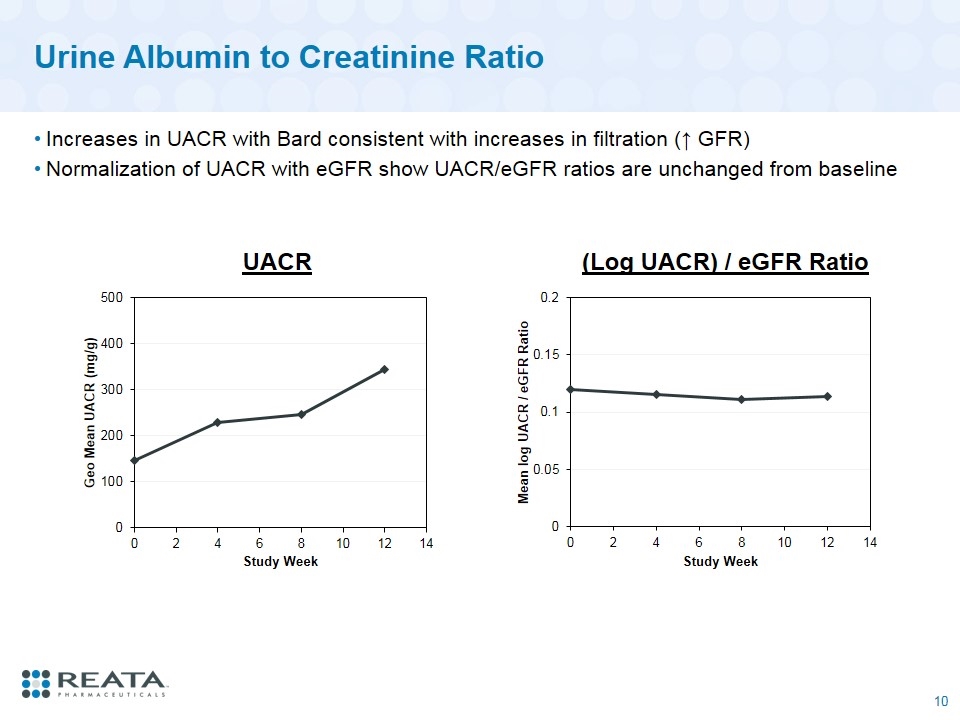
Urine Albumin to Creatinine Ratio Increases in UACR with Bard consistent with increases in filtration (↑ GFR) Normalization of UACR with eGFR show UACR/eGFR ratios are unchanged from baseline UACR (Log UACR) / eGFR Ratio
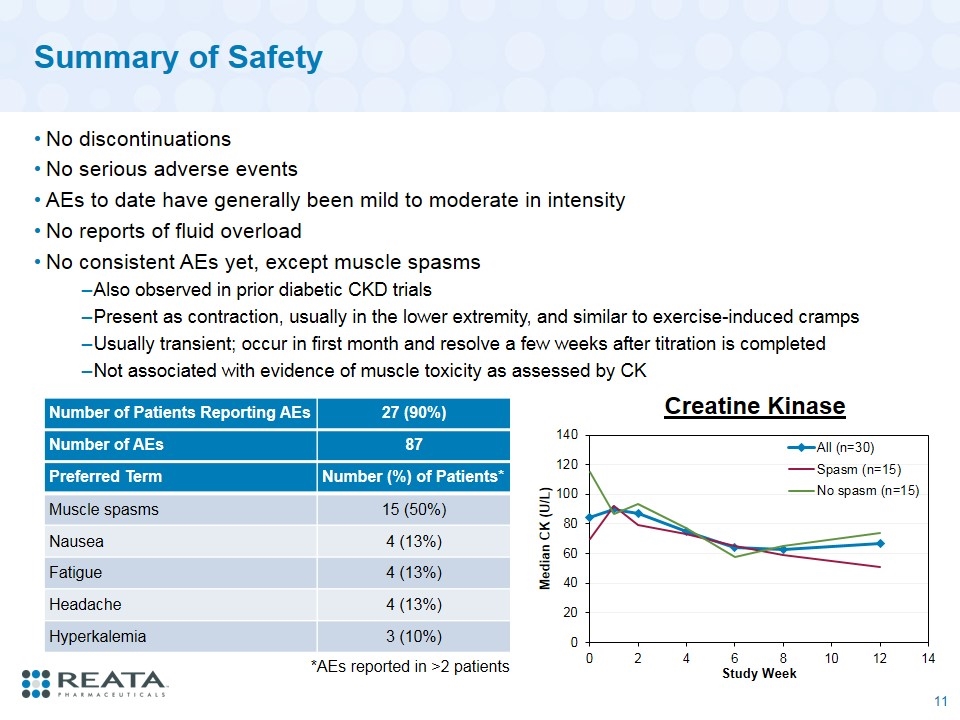
Summary of Safety No discontinuations No serious adverse events AEs to date have generally been mild to moderate in intensity No reports of fluid overload No consistent AEs yet, except muscle spasms Also observed in prior diabetic CKD trials Present as contraction, usually in the lower extremity, and similar to exercise-induced cramps Usually transient; occur in first month and resolve a few weeks after titration is completed Not associated with evidence of muscle toxicity as assessed by CK Number of Patients Reporting AEs 27 (90%) Number of AEs 87 Preferred Term Number (%) of Patients* Muscle spasms 15 (50%) Nausea 4 (13%) Fatigue 4 (13%) Headache 4 (13%) Hyperkalemia 3 (10%) *AEs reported in >2 patients Creatine Kinase
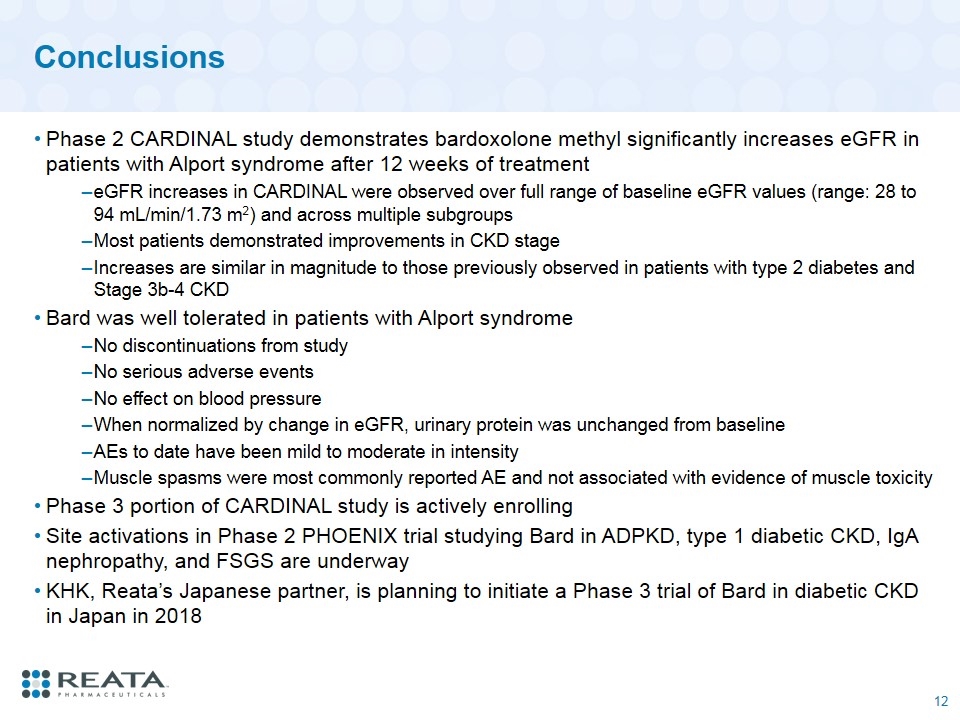
Conclusions Phase 2 CARDINAL study demonstrates bardoxolone methyl significantly increases eGFR in patients with Alport syndrome after 12 weeks of treatment eGFR increases in CARDINAL were observed over full range of baseline eGFR values (range: 28 to 94 mL/min/1.73 m2) and across multiple subgroups Most patients demonstrated improvements in CKD stage Increases are similar in magnitude to those previously observed in patients with type 2 diabetes and Stage 3b-4 CKD Bard was well tolerated in patients with Alport syndrome No discontinuations from study No serious adverse events No effect on blood pressure When normalized by change in eGFR, urinary protein was unchanged from baseline AEs to date have been mild to moderate in intensity Muscle spasms were most commonly reported AE and not associated with evidence of muscle toxicity Phase 3 portion of CARDINAL study is actively enrolling Site activations in Phase 2 PHOENIX trial studying Bard in ADPKD, type 1 diabetic CKD, IgA nephropathy, and FSGS are underway KHK, Reata’s Japanese partner, is planning to initiate a Phase 3 trial of Bard in diabetic CKD in Japan in 2018
