Attached files
| file | filename |
|---|---|
| 8-K - 8-K - ITC Holdings Corp. | a17-25161_18k.htm |
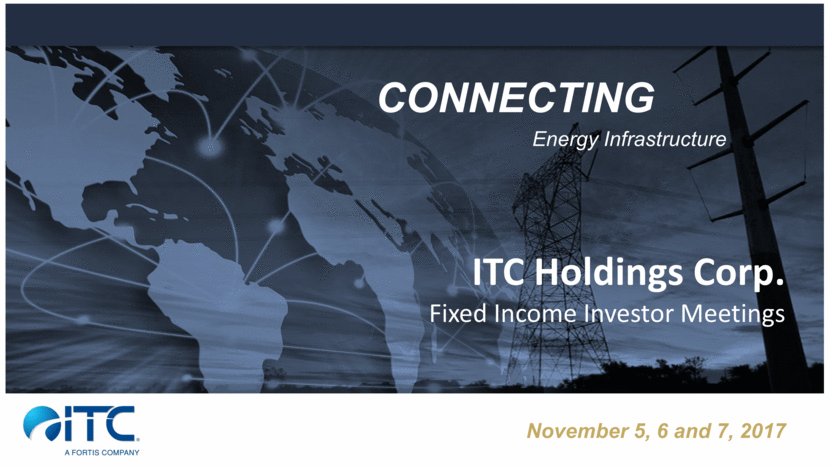
Energy Infrastructure CONNECTING ITC Holdings Corp. Fixed Income Investor Meetings November 5, 6 and 7, 2017
Safe Harbor Language & Legal Disclosure This presentation is for your information only and is not intended to be distributed to or reviewed by anyone other than you. This presentation does not constitute an offer to sell or a solicitation of an offer to buy any securities. If ITC Holdings Corp. (“ITC”) were to conduct an offering of securities in the future, unless such securities are registered, they may be offered only in transactions that are exempt from registration under the Securities Act of 1933 (the “Securities Act”) and applicable state securities laws. Before investing in any of ITC’s securities, investors should read ITC’s registration statement or offering memorandum, as applicable, for such offering and the other documents ITC files with the Securities and Exchange Commission (the “SEC”) for more complete information about ITC and any potential offering. ITC has not authorized anyone to provide you with any other information and ITC takes no responsibility for other information others may give you. This presentation contains summaries believed to be accurate with respect to certain reports and documents, but reference is made to the actual reports and documents for complete information. All such summaries are qualified in their entirety by such reference. Under no circumstances is this presentation or the information contained herein to be construed as a prospectus, offering memorandum or advertisement, and neither any part of this written or oral presentation nor any information or statement contained herein or therein shall form the basis of or be relied upon in connection with any contract or commitment whatsoever. Note, a securities rating is not a recommendation to buy, sell or hold securities and may be subject to revision or withdrawal at any time. This presentation contains non-GAAP financial measures that management believes are important financial measures for ITC, but are not financial measures as defined by GAAP. These non-GAAP financial measures should be reviewed in conjunction with the relevant GAAP financial measures and are not presented as alternative measures of operating revenue, net cash provided by operating activities and total funded debt as determined in accordance with GAAP. Reconciliations of these non-GAAP financial measures to the most directly comparable GAAP financial measures are presented in the Appendixes to this presentation. 2
Safe Harbor Language & Legal Disclosure This presentation contains certain statements that describe ITC management’s beliefs concerning ITC’s future business conditions, plans and prospects, growth opportunities, the outlook for ITC’s business and the electric transmission industry, and expectations with respect to various legal and regulatory proceedings based upon information currently available. Such statements are “forward-looking” statements within the meaning of the Private Securities Litigation Reform Act of 1995. Wherever possible, ITC has identified these forward-looking statements by words such as “will,” “may,” “anticipates,” “believes,” “intends,” “estimates,” “expects,” “projects,” “likely” and similar phrases. These forward-looking statements are based upon assumptions ITC management believes are reasonable. Such forward-looking statements are based on estimates and assumptions and subject to significant risks and uncertainties which could cause ITC’s actual results, performance and achievements to differ materially from those expressed in, or implied by, these statements, including, among other things, (a) the risks and uncertainties disclosed in ITC’s annual report on Form 10-K and ITC’s quarterly reports on Form 10-Q filed with the SEC from time to time. Because ITC’s forward-looking statements are based on estimates and assumptions that are subject to significant business, economic and competitive uncertainties, many of which are beyond ITC’s control or are subject to change, actual results could be materially different and any or all of ITC’s forward-looking statements may turn out to be wrong. They speak only as of the date made and can be affected by assumptions ITC might make or by known or unknown risks and uncertainties. Many factors mentioned in this document and in ITC’s annual and quarterly reports will be important in determining future results. Consequently, ITC cannot assure you that ITC’s expectations or forecasts expressed in such forward-looking statements will be achieved. Actual future results may vary materially. Except as required by law, ITC undertakes no obligation to publicly update any of ITC’s forward-looking or other statements, whether as a result of new information, future events, or otherwise. 3
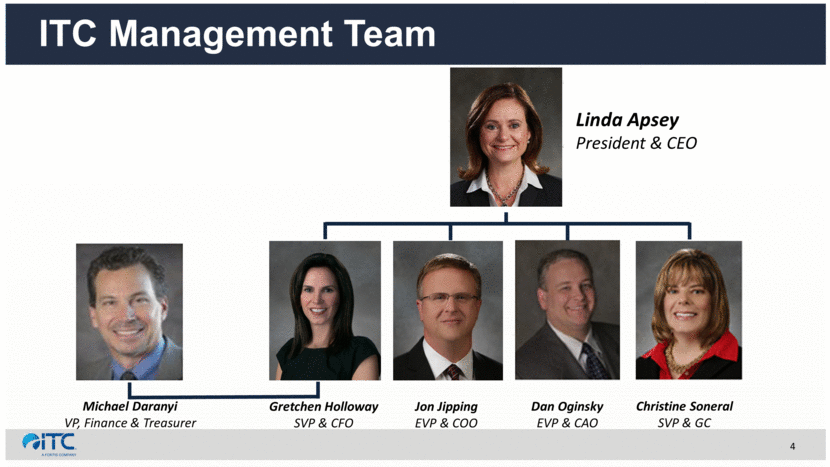
ITC Management Team Linda Apsey President & CEO Gretchen Holloway SVP & CFO Jon Jipping EVP & COO Dan Oginsky EVP & CAO Christine Soneral SVP & GC Michael Daranyi VP, Finance & Treasurer 4
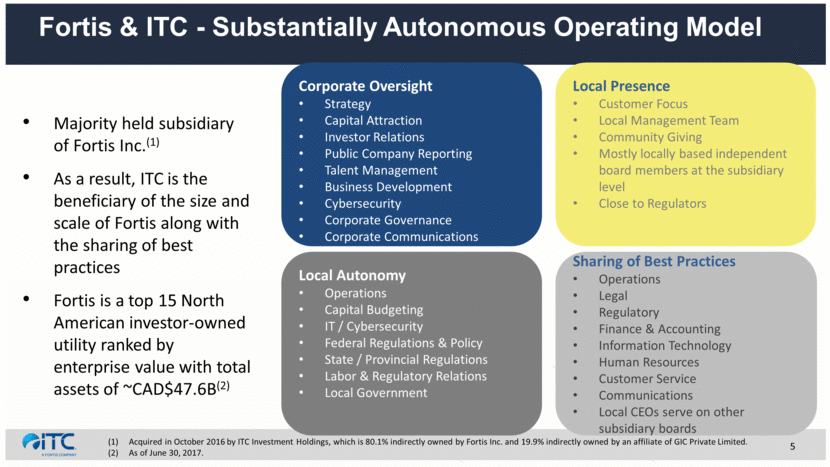
Fortis & ITC - Substantially Autonomous Operating Model Local Presence Customer Focus Local Management Team Community Giving Mostly locally based independent board members at the subsidiary level Close to Regulators Sharing of Best Practices Operations Legal Regulatory Finance & Accounting Information Technology Human Resources Customer Service Communications Local CEOs serve on other subsidiary boards Corporate Oversight Strategy Capital Attraction Investor Relations Public Company Reporting Talent Management Business Development Cybersecurity Corporate Governance Corporate Communications Local Autonomy Operations Capital Budgeting IT / Cybersecurity Federal Regulations & Policy State / Provincial Regulations Labor & Regulatory Relations Local Government Majority held subsidiary of Fortis Inc.(1) As a result, ITC is the beneficiary of the size and scale of Fortis along with the sharing of best practices Fortis is a top 15 North American investor-owned utility ranked by enterprise value with total assets of ~CAD$47.6B(2) Acquired in October 2016 by ITC Investment Holdings, which is 80.1% indirectly owned by Fortis Inc. and 19.9% indirectly owned by an affiliate of GIC Private Limited. As of June 30, 2017. 5
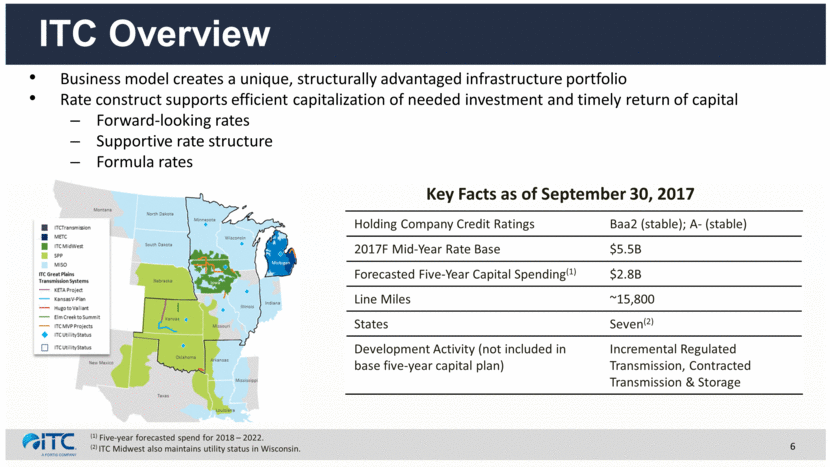
ITC Overview Business model creates a unique, structurally advantaged infrastructure portfolio Rate construct supports efficient capitalization of needed investment and timely return of capital Forward-looking rates Supportive rate structure Formula rates Key Facts as of September 30, 2017 (1) Five-year forecasted spend for 2018 – 2022. (2) ITC Midwest also maintains utility status in Wisconsin. Holding Company Credit Ratings Baa2 (stable); A- (stable) 2017F Mid-Year Rate Base $5.5B Forecasted Five-Year Capital Spending(1) $2.8B Line Miles ~15,800 States Seven(2) Development Activity (not included in base five-year capital plan) Incremental Regulated Transmission, Contracted Transmission & Storage 6
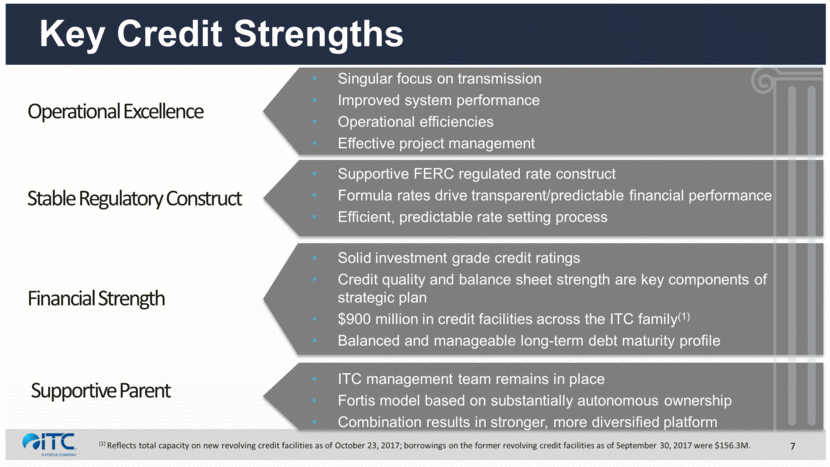
Key Credit Strengths Stable Regulatory Construct Operational Excellence Supportive FERC regulated rate construct Formula rates drive transparent/predictable financial performance Efficient, predictable rate setting process Financial Strength Supportive Parent Singular focus on transmission Improved system performance Operational efficiencies Effective project management Solid investment grade credit ratings Credit quality and balance sheet strength are key components of strategic plan $900 million in credit facilities across the ITC family(1) Balanced and manageable long-term debt maturity profile ITC management team remains in place Fortis model based on substantially autonomous ownership Combination results in stronger, more diversified platform (1) Reflects total capacity on new revolving credit facilities as of October 23, 2017; borrowings on the former revolving credit facilities as of September 30, 2017 were $156.3M. 7
Best-In-Class Operations TOP 10% For Safety Performance TOP 25% Reliability Performance Systems with at least RELIABLE SAFE SECURE STATE-OF-THE-ART ADVANCED TECHNOLOGY RESILIENT Application of Sources: Edison Electric Institute (EEI) 2015 Safety Survey, SGS 2015 National Benchmark Survey, ITC system data. 8
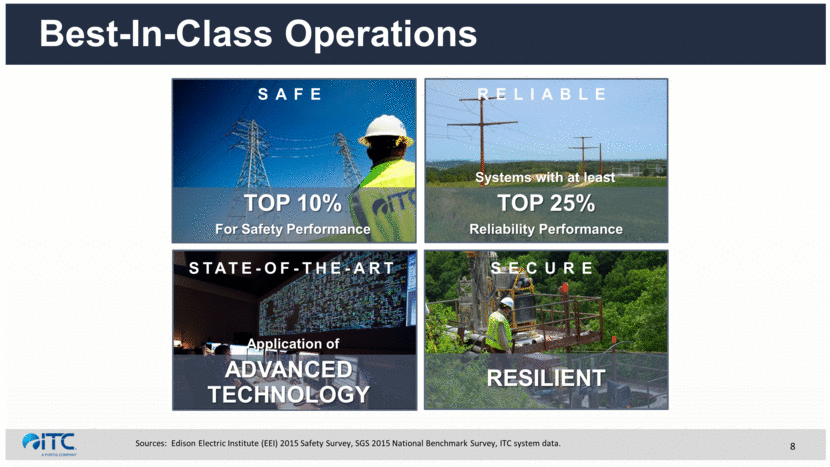
Strong Regulatory Relationships with FERC FERC has consistently promoted policies to facilitate and support transmission investment Key Facts: Independent regulatory commission with five appointed commissioners, one who serves as chair No more than three commissioners can be from the same political party Commissioners serve five year, staggered terms, with one commissioner’s term ending each year Currently consists of three commissioners with two remaining nominees outstanding States have jurisdiction over siting of transmission facilities and related matters, as well as oversight of environmental compliance ITC is regulated by eight states: Illinois, Iowa, Kansas, Michigan, Minnesota, Missouri, Oklahoma & Wisconsin Energy Policy Act of 1992 mandated open access transmission tariffs 1992 – Order 2000 provided for voluntary RTO formation and regional wholesale energy markets 1999 – FERC adoption of independence incentives 2003 – Order 679 established incentives for transmission investment 2006 – Order 890 expanded regional planning mandate and subsumed Order 888 that established regional planning and open transmission access 2007 – Order 1000 provided guidelines for regional planning and cost allocation, will facilitate inter-regional project development, and introduce competition 2011 – Policy Statement on Promoting Transmission Investment Through Pricing Reform 2012 – Opinion 531 Modified methodology for calculating transmission returns to support continued investment 2014 – Energy Policy Act directed FERC to provide financial incentives for transmission 2005 – Year FERC Actions 9
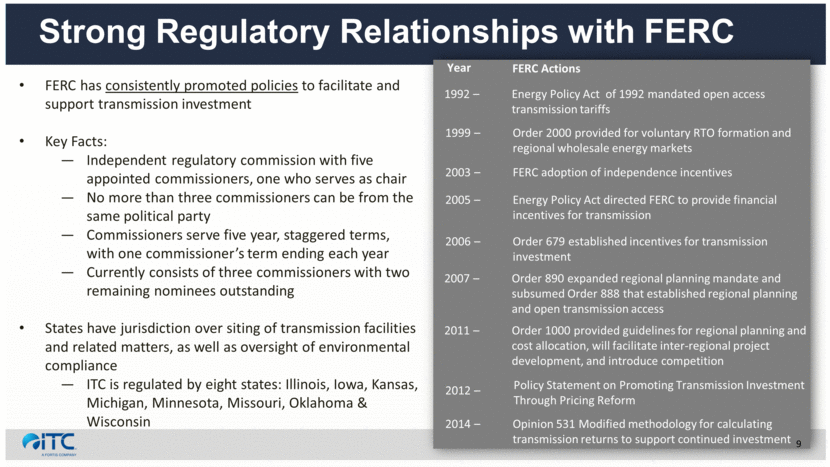
Differentiated Rate Construct ITC Regulated Operating Companies Typical State Regulated Electric Utility Rates and Rate Setting Formula Rate FERC approved forward looking rate-setting mechanism with true-up Annual adjustment to rates based on projected revenue requirement Fixed rates between multi-year rate cases Rate increases require formal rate cases in which prudence must be defended Rate making process is often historical looking, adversarial, protracted and may delay recovery of costs Regulation FERC jurisdiction for rate regulation State / federal regulation Potentially multiple state jurisdictions Rate Construct Supportive return on equity and capital structures to facilitate transmission investment Periodic rate cases to reset ROEs and capital structures that may or may not support capital investment objectives Outcome Pure play transmission business Invest in transmission to improve reliability, reduce congestion, and facilitate access to all generation Achieved ROE generally equal to approved ROE at the operating companies Maintain vertically integrated model Investments in transmission considered in the broader context of other opportunities Achieved ROE often underperforms due to regulatory lag and disallowances 10
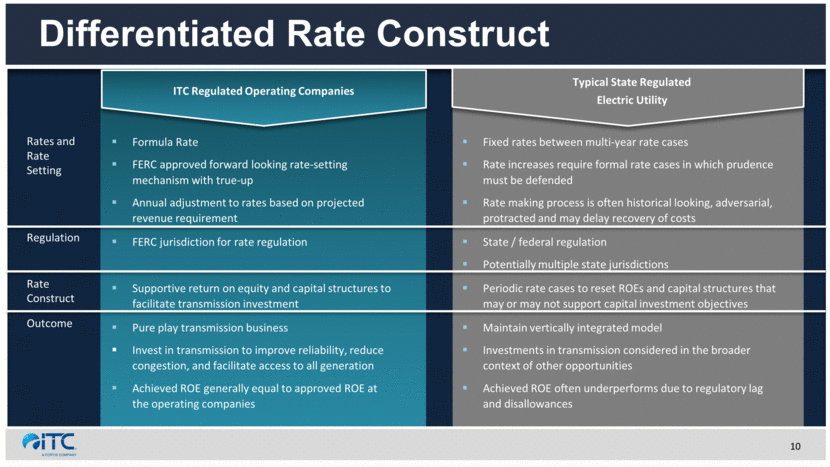
Recent Regulatory Developments FERC Quorum MISO ROE Complaints Initial Complaint –FERC Order issued in September 2016 setting the base ROE of 10.32% and high-end of the zone at 11.35% (Nov 2013 – Feb 2015) and also going forward from the date of the FERC order Second Complaint –Presiding ALJ issued an initial decision in June 2016, recommending a base ROE of 9.70% for the second refund period with a high-end of the zone at 10.68% (Feb 2015 –May 2016) and going forward from the date of a final FERC order on the Second Complaint FERC has yet to rule on the Second Complaint and may not rule until 2018; however, there is no statutory deadline on when FERC must rule On September 29, 2017 the MISO transmission owners moved for an order to dismiss the Second Complaint With the departure of Commissioner Bay in early 2017, FERC lacked a quorum In August, quorum was restored with the appointment of Commissioners Neil Chatterjee (current Chair) and Powelson, these appointments combined with sitting Commissioner LaFleur establishes a quorum Nominees for remaining seats are Richard Glick (Democrat) and Kevin McIntyre (Republican) Given backlog of other issues, a decision on Second MISO Complaint is not expected until 2018 11
Historical Capital Investments Innovative Model To Address Decades of Underinvestment Advocacy To Develop 21st Century Transmission Grid $ in millions ~$7 billion in accrued capital investments(1) (1) Total capital investments since inception through September 30, 2017. For 2016 and 2017, amounts reflect cash capital investments. Execution To Drive Strategic, Operational & Financial Performance 12 $0 $100 $200 $300 $400 $500 $600 $700 $800 $900 2003 2004 2005 2006 2007 2008 2009 2010 2011 2012 2013 2014 2015 2016 2017
Building the Grid of the Future 2018-2022 Key Initiatives Execute on base capital plan and complete major capital projects on time and on budget to maintain operational excellence Pursue actionable development projects & strategic acquisitions incremental to the current base capital plan Sources of Organic Growth Reliability, security and maintenance of existing regulated systems New customer connection requests driven by customer needs Economic and efficient transmission solutions Key Macro Trends Grid modernization to meet system demands Shift from coal to more renewable resources Evolving security and compliance requirements- greater resiliency in transmission systems Local Trends Transmission system needs to serve regional versus local needs 13
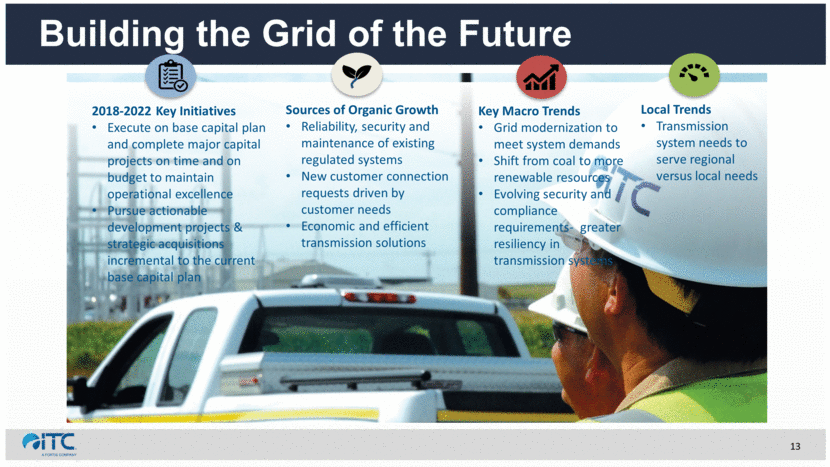
Development Approach Disciplined growth through new development projects is a key strategic objective and incorporates the following parameters: 14 Regulated or sufficiently contracted New systems with identified need for base capital investments Large footprint supports incremental development opportunities Proven track record Strategically compelling Immediately and sustainably value accretive Increased flexibility in capital deployment and enhanced growth portfolio Value enhancing to stand-alone plan Credit quality enhancing through diversified rate base and increased scale Maintain strong current credit metrics Maintains credit quality
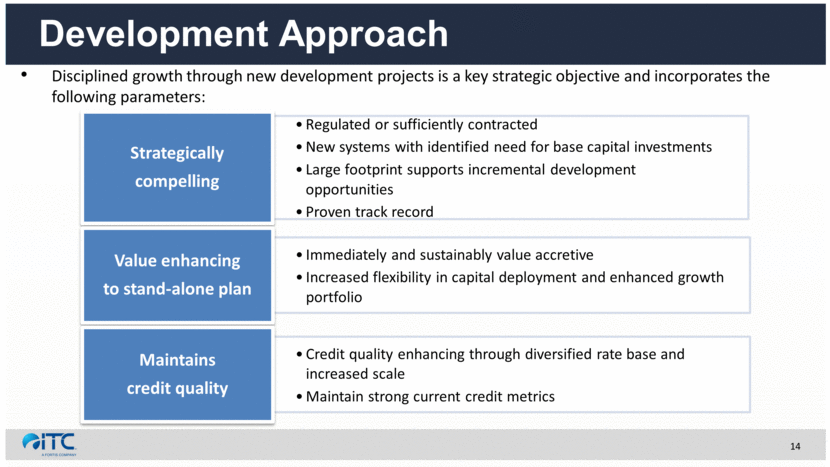
2018 – 2022 Capital Investment Outlook Capital Expenditures ($s in millions) Reflects average rate base growth, includes impact of bonus depreciation. Midyear Rate Base Growth(1) ($s in billions) $2.8B Five-Year Capital Plan Base 4.8% CAGR 15 $5.5 $5.9 $6.4 $6.7 $6.9 $7.0 2017F 2018F 2019F 2020F 2021F 2022F $674 $567 $533 $529 $539 2018F 2019F 2020F 2021F 2022F
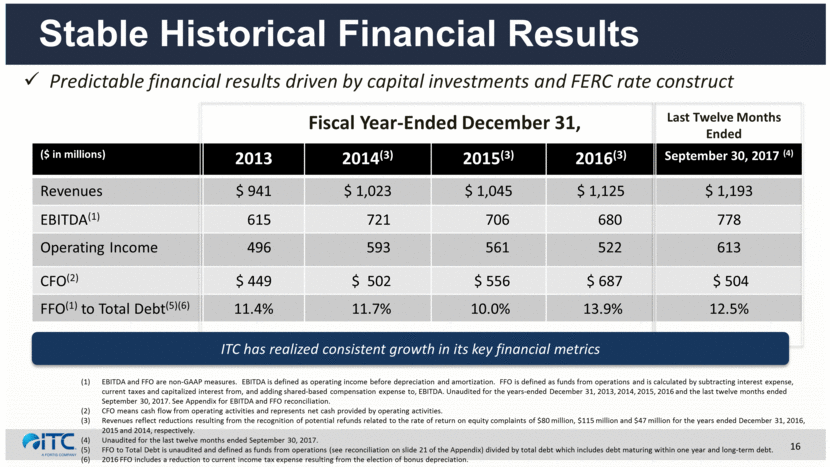
Stable Historical Financial Results Predictable financial results driven by capital investments and FERC rate construct ($ in millions) 2013 2014(3) 2015(3) 2016(3) September 30, 2017 (4) Revenues $ 941 $ 1,023 $ 1,045 $ 1,125 $ 1,193 EBITDA(1) 615 721 706 680 778 Operating Income 496 593 561 522 613 CFO(2) $ 449 $ 502 $ 556 $ 687 $ 504 FFO(1) to Total Debt(5)(6) 11.4% 11.7% 10.0% 13.9% 12.5% Fiscal Year-Ended December 31, Last Twelve Months Ended ITC has realized consistent growth in its key financial metrics EBITDA and FFO are non-GAAP measures. EBITDA is defined as operating income before depreciation and amortization. FFO is defined as funds from operations and is calculated by subtracting interest expense, current taxes and capitalized interest from, and adding shared-based compensation expense to, EBITDA. Unaudited for the years-ended December 31, 2013, 2014, 2015, 2016 and the last twelve months ended September 30, 2017. See Appendix for EBITDA and FFO reconciliation. CFO means cash flow from operating activities and represents net cash provided by operating activities. Revenues reflect reductions resulting from the recognition of potential refunds related to the rate of return on equity complaints of $80 million, $115 million and $47 million for the years ended December 31, 2016, 2015 and 2014, respectively. Unaudited for the last twelve months ended September 30, 2017. FFO to Total Debt is unaudited and defined as funds from operations (see reconciliation on slide 21 of the Appendix) divided by total debt which includes debt maturing within one year and long-term debt. 2016 FFO includes a reduction to current income tax expense resulting from the election of bonus depreciation. 16
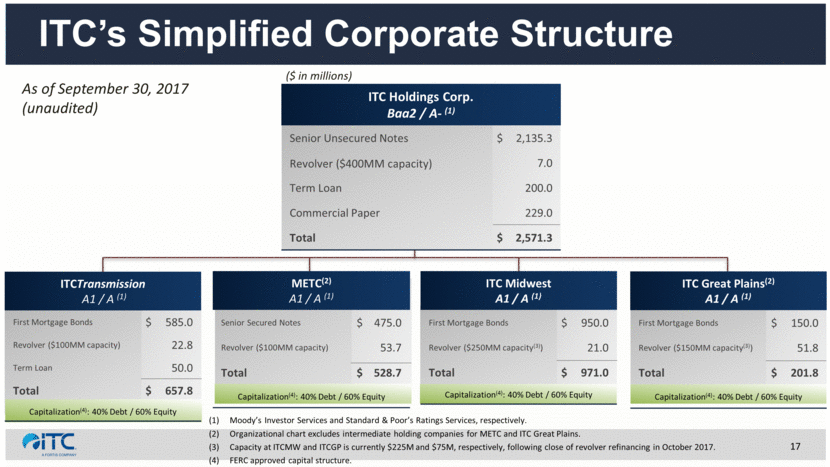
ITC’s Simplified Corporate Structure ITCTransmission A1 / A (1) First Mortgage Bonds $ 585.0 Revolver ($100MM capacity) 22.8 Term Loan 50.0 Total $ 657.8 Capitalization(4): 40% Debt / 60% Equity METC(2) A1 / A (1) Senior Secured Notes $ 475.0 Revolver ($100MM capacity) 53.7 Total $ 528.7 Capitalization(4): 40% Debt / 60% Equity ITC Midwest A1 / A (1) First Mortgage Bonds $ 950.0 Revolver ($250MM capacity(3)) 21.0 Total $ 971.0 Capitalization(4): 40% Debt / 60% Equity ITC Great Plains(2) A1 / A (1) First Mortgage Bonds $ 150.0 Revolver ($150MM capacity(3)) 51.8 Total $ 201.8 Capitalization(4): 40% Debt / 60% Equity ITC Holdings Corp. Baa2 / A- (1) Senior Unsecured Notes $ 2,135.3 Revolver ($400MM capacity) 7.0 Term Loan 200.0 Commercial Paper 229.0 Total $ 2,571.3 ($ in millions) As of September 30, 2017 (unaudited) Moody’s Investor Services and Standard & Poor’s Ratings Services, respectively. Organizational chart excludes intermediate holding companies for METC and ITC Great Plains. Capacity at ITCMW and ITCGP is currently $225M and $75M, respectively, following close of revolver refinancing in October 2017. FERC approved capital structure. 17
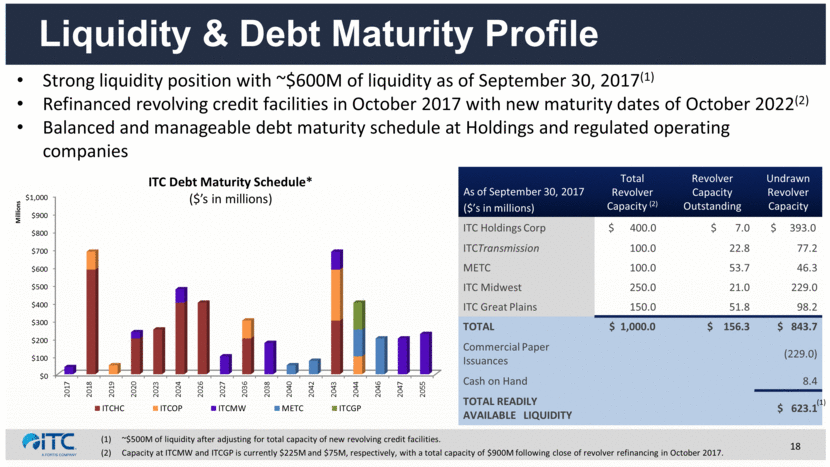
Liquidity & Debt Maturity Profile 18 Strong liquidity position with ~$600M of liquidity as of September 30, 2017(1) Refinanced revolving credit facilities in October 2017 with new maturity dates of October 2022(2) Balanced and manageable debt maturity schedule at Holdings and regulated operating companies Total Revolver Capacity (2) Revolver Capacity Outstanding Undrawn Revolver Capacity ITC Holdings Corp $ 400.0 $ 7.0 $ 393.0 ITCTransmission 100.0 22.8 77.2 METC 100.0 53.7 46.3 ITC Midwest 250.0 21.0 229.0 ITC Great Plains 150.0 51.8 98.2 TOTAL $ 1,000.0 $ 156.3 $ 843.7 Commercial Paper Issuances (229.0) Cash on Hand 8.4 TOTAL READILY AVAILABLE LIQUIDITY $ 623.1 ~$500M of liquidity after adjusting for total capacity of new revolving credit facilities. Capacity at ITCMW and ITCGP is currently $225M and $75M, respectively, with a total capacity of $900M following close of revolver refinancing in October 2017. As of September 30, 2017 ($’s in millions) 18 (1) $0 $100 $200 $300 $400 $500 $600 $700 $800 $900 $1,000 2017 2018 2019 2020 2023 2024 2026 2027 2036 2038 2040 2042 2043 2044 2046 2047 2055 Millions ITC Debt Maturity Schedule* ($’s in millions) ITCHC ITCOP ITCMW METC ITCGP
Energy Infrastructure CONNECTING Appendix
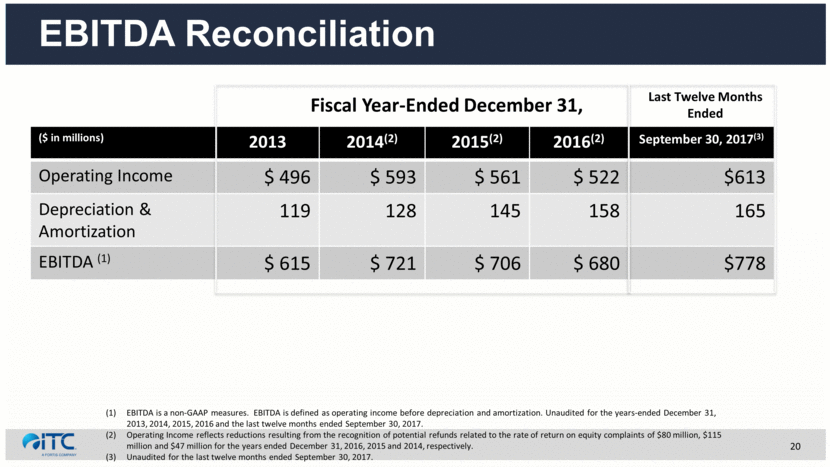
EBITDA Reconciliation ($ in millions) 2013 2014(2) 2015(2) 2016(2) September 30, 2017(3) Operating Income $ 496 $ 593 $ 561 $ 522 $613 Depreciation & Amortization 119 128 145 158 165 EBITDA (1) $ 615 $ 721 $ 706 $ 680 $778 Fiscal Year-Ended December 31, Last Twelve Months Ended EBITDA is a non-GAAP measures. EBITDA is defined as operating income before depreciation and amortization. Unaudited for the years-ended December 31, 2013, 2014, 2015, 2016 and the last twelve months ended September 30, 2017. Operating Income reflects reductions resulting from the recognition of potential refunds related to the rate of return on equity complaints of $80 million, $115 million and $47 million for the years ended December 31, 2016, 2015 and 2014, respectively. Unaudited for the last twelve months ended September 30, 2017. 20
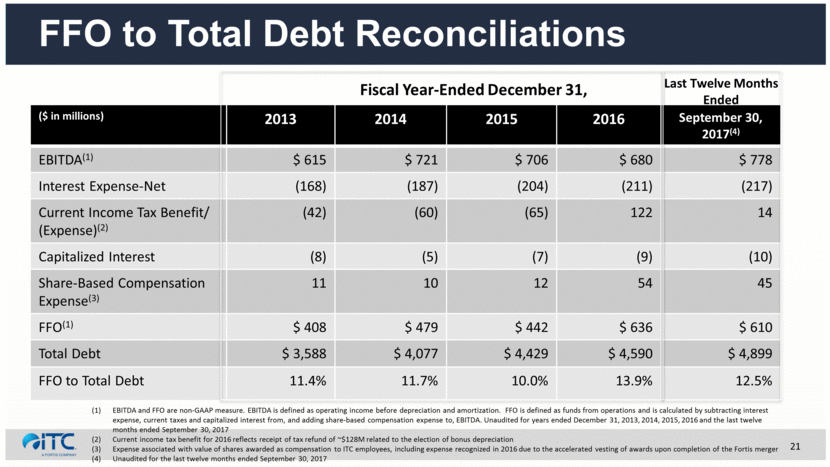
FFO to Total Debt Reconciliations ($ in millions) 2013 2014 2015 2016 September 30, 2017(4) EBITDA(1) $ 615 $ 721 $ 706 $ 680 $ 778 Interest Expense-Net (168) (187) (204) (211) (217) Current Income Tax Benefit/ (Expense)(2) (42) (60) (65) 122 14 Capitalized Interest (8) (5) (7) (9) (10) Share-Based Compensation Expense(3) 11 10 12 54 45 FFO(1) $ 408 $ 479 $ 442 $ 636 $ 610 Total Debt $ 3,588 $ 4,077 $ 4,429 $ 4,590 $ 4,899 FFO to Total Debt 11.4% 11.7% 10.0% 13.9% 12.5% Fiscal Year-Ended December 31, Last Twelve Months Ended EBITDA and FFO are non-GAAP measure. EBITDA is defined as operating income before depreciation and amortization. FFO is defined as funds from operations and is calculated by subtracting interest expense, current taxes and capitalized interest from, and adding share-based compensation expense to, EBITDA. Unaudited for years ended December 31, 2013, 2014, 2015, 2016 and the last twelve months ended September 30, 2017 Current income tax benefit for 2016 reflects receipt of tax refund of ~$128M related to the election of bonus depreciation Expense associated with value of shares awarded as compensation to ITC employees, including expense recognized in 2016 due to the accelerated vesting of awards upon completion of the Fortis merger Unaudited for the last twelve months ended September 30, 2017 21
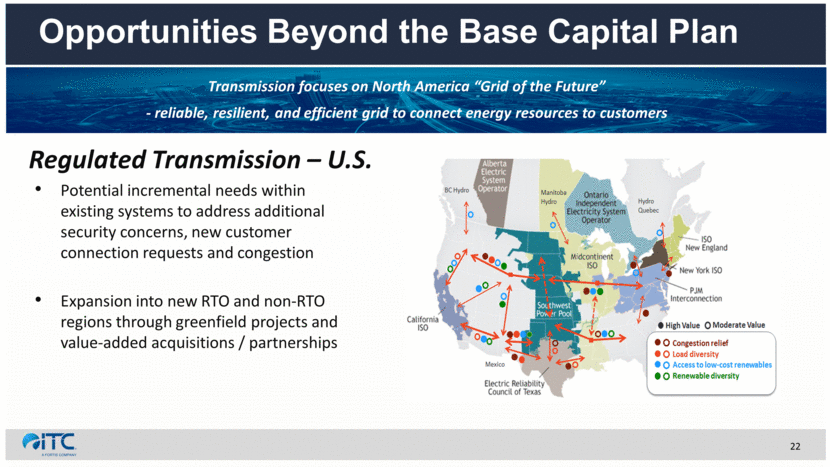
Opportunities Beyond the Base Capital Plan Transmission focuses on North America “Grid of the Future” - reliable, resilient, and efficient grid to connect energy resources to customers Potential incremental needs within existing systems to address additional security concerns, new customer connection requests and congestion Expansion into new RTO and non-RTO regions through greenfield projects and value-added acquisitions / partnerships Regulated Transmission – U.S. 22
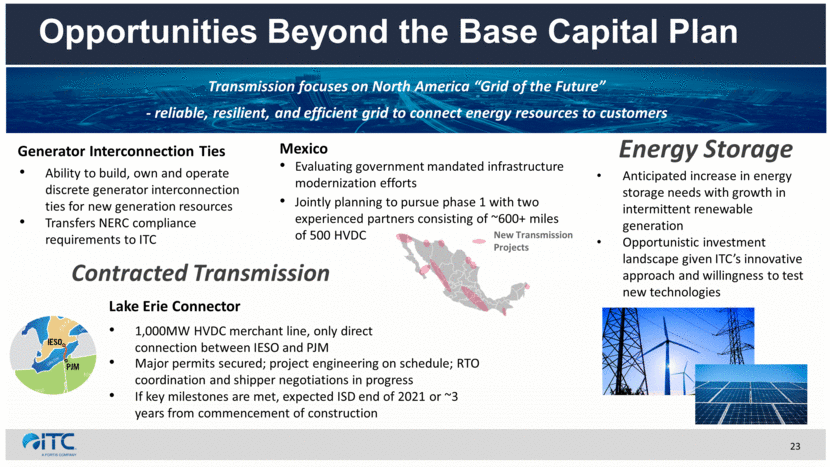
Opportunities Beyond the Base Capital Plan Mexico Evaluating government mandated infrastructure modernization efforts Energy Storage Generator Interconnection Ties New Transmission Projects Major permits secured; project engineering on schedule; RTO coordination and shipper negotiations in progress If key milestones are met, expected ISD end of 2021 or ~3 years from commencement of construction Lake Erie Connector 1,000MW HVDC merchant line, only direct connection between IESO and PJM Contracted Transmission Anticipated increase in energy storage needs with growth in intermittent renewable generation Opportunistic investment landscape given ITC’s innovative approach and willingness to test new technologies Ability to build, own and operate discrete generator interconnection ties for new generation resources Transfers NERC compliance requirements to ITC Transmission focuses on North America “Grid of the Future” - reliable, resilient, and efficient grid to connect energy resources to customers 23 Jointly planning to pursue phase 1 with two experienced partners consisting of ~600+ miles of 500 HVDC
