Attached files
| file | filename |
|---|---|
| 8-K - 8-K - FIRSTENERGY CORP | a8-kdated11032017.htm |

FirstEnergy
Unlocking the Value of the Regulated Businesses
Charles E. Jones, President and CEO
November 2017
EEI Financial Conference
Lake Buena Vista, FL

November 2017
Forward-Looking Statements
EEI Financial Conference 2
This presentation includes forward-looking statements based on information currently available to management. Such statements are subject to certain risks and uncertainties. These statements include declarations regarding management's intents,
beliefs and current expectations. These statements typically contain, but are not limited to, the terms “anticipate,” “potential,” “expect,” "forecast," "target," "will," "intend," “believe,” "project," “estimate," "plan" and similar words. Forward-looking
statements involve estimates, assumptions, known and unknown risks, uncertainties and other factors that may cause actual results, performance or achievements to be materially different from any future results, performance or achievements
expressed or implied by such forward-looking statements, which may include the following: the ability to experience growth in the Regulated Distribution and Regulated Transmission segments and the effectiveness of our strategy to transition to a fully
regulated business profile; the accomplishment of our regulatory and operational goals in connection with our transmission and distribution investment plans, including, but not limited to, our planned transition to forward-looking formula rates; changes
in assumptions regarding economic conditions within our territories, assessment of the reliability of our transmission system, or the availability of capital or other resources supporting identified transmission investment opportunities; the ability to
accomplish or realize anticipated benefits from strategic and financial goals, including, but not limited to, the ability to continue to reduce costs and to successfully execute our financial plans designed to improve our credit metrics and strengthen our
balance sheet; success of legislative and regulatory solutions for generation assets that recognize their environmental or energy security benefits, including the Notice of Proposed Rulemaking released by the Secretary of Energy and action by the
Federal Energy Regulatory Commission (FERC); the risks and uncertainties associated with the lack of viable alternative strategies regarding the Competitive Energy Services (CES) segment, thereby causing FirstEnergy Solutions Corp. (FES), and
likely FirstEnergy Nuclear Operating Company (FENOC), to restructure its substantial debt and other financial obligations with its creditors or seek protection under United States bankruptcy laws and the losses, liabilities and claims arising from such
bankruptcy proceeding, including any obligations at FirstEnergy Corp.; the risks and uncertainties at the CES segment, including FES, and its subsidiaries, and FENOC, related to wholesale energy and capacity markets and the viability and/or success
of strategic business alternatives, such as pending and potential CES generating unit asset sales, the potential conversion of the remaining generation fleet from competitive operations to a regulated or regulated-like construct or the potential need to
deactivate additional generating units, which could result in further substantial write-downs and impairments of assets; the substantial uncertainty as to FES’ ability to continue as a going concern and substantial risk that it may be necessary for FES,
and likely FENOC, to seek protection under United States bankruptcy laws; the risks and uncertainties associated with litigation, arbitration, mediation and like proceedings, including, but not limited to, any such proceedings related to vendor
commitments, such as long-term fuel and transportation agreements; the uncertainties associated with the deactivation of older regulated and competitive units, including the impact on vendor commitments, such as long-term fuel and transportation
agreements, and as it relates to the reliability of the transmission grid, the timing thereof; the impact of other future changes to the operational status or availability of our generating units and any capacity performance charges associated with unit
unavailability; changing energy, capacity and commodity market prices including, but not limited to, coal, natural gas and oil prices, and their availability and impact on margins; costs being higher than anticipated and the success of our policies to
control costs and to mitigate low energy, capacity and market prices; replacement power costs being higher than anticipated or not fully hedged; our ability to improve electric commodity margins and the impact of, among other factors, the increased
cost of fuel and fuel transportation on such margins; the uncertainty of the timing and amounts of the capital expenditures that may arise in connection with any litigation, including New Source Review litigation, or potential regulatory initiatives or
rulemakings (including that such initiatives or rulemakings could result in our decision to deactivate or idle certain generating units); changes in customers' demand for power, including, but not limited to, changes resulting from the implementation of
state and federal energy efficiency and peak demand reduction mandates; economic or weather conditions affecting future sales, margins and operations such as a polar vortex or other significant weather events, and all associated regulatory events
or actions; changes in national and regional economic conditions affecting us, our subsidiaries and/or our major industrial and commercial customers, and other counterparties with which we do business, including fuel suppliers; the impact of labor
disruptions by our unionized workforce; the risks associated with cyber-attacks and other disruptions to our information technology system that may compromise our generation, transmission and/or distribution services and data security breaches of
sensitive data, intellectual property and proprietary or personally identifiable information regarding our business, employees, shareholders, customers, suppliers, business partners and other individuals in our data centers and on our networks; the
impact of the regulatory process and resulting outcomes on the matters at the federal level and in the various states in which we do business including, but not limited to, matters related to rates; the impact of the federal regulatory process on FERC-
regulated entities and transactions, in particular FERC regulation of wholesale energy and capacity markets, including PJM Interconnection, L.L.C. (PJM) markets and FERC-jurisdictional wholesale transactions; FERC regulation of cost-of-service
rates; and FERC’s compliance and enforcement activity, including compliance and enforcement activity related to North American Electric Reliability Corporation’s mandatory reliability standards; the uncertainties of various cost recovery and cost
allocation issues resulting from American Transmission Systems, Incorporated's realignment into PJM; the ability to comply with applicable state and federal reliability standards and energy efficiency and peak demand reduction mandates; other
legislative and regulatory changes, including the new federal administration's required review and potential revision of environmental requirements, including, but not limited to, the effects of the United States Environmental Protection Agency’s Clean
Power Plan, Coal Combustion Residuals regulations, Cross-State Air Pollution Rule and Mercury and Air Toxics Standards programs, including our estimated costs of compliance, Clean Water Act (CWA) waste water effluent limitations for power
plants, and CWA 316(b) water intake regulation; adverse regulatory or legal decisions and outcomes with respect to our nuclear operations (including, but not limited to, the revocation or non-renewal of necessary licenses, approvals or operating
permits by the Nuclear Regulatory Commission or as a result of the incident at Japan's Fukushima Daiichi Nuclear Plant); issues arising from the indications of cracking in the shield building at Davis-Besse; changing market conditions that could affect
the measurement of certain liabilities and the value of assets held in our Nuclear Decommissioning Trusts, pension trusts and other trust funds, and cause us and/or our subsidiaries to make additional contributions sooner, or in amounts that are larger
than currently anticipated; the impact of changes to significant accounting policies; the impact of any changes in tax laws or regulations or adverse tax audit results or rulings; the ability to access the public securities and other capital and credit
markets in accordance with our financial plans, the cost of such capital and overall condition of the capital and credit markets affecting us and our subsidiaries; further actions that may be taken by credit rating agencies that could negatively affect us
and/or our subsidiaries’ access to financing, increase the costs thereof, increase requirements to post additional collateral to support, or accelerate payments under outstanding commodity positions, letters of credit and other financial guarantees, and
the impact of these events on the financial condition and liquidity of FirstEnergy Corp. and/or its subsidiaries, specifically FES and its subsidiaries; issues concerning the stability of domestic and foreign financial institutions and counterparties with
which we do business; and the risks and other factors discussed from time to time in our United States Securities and Exchange Commission (SEC) filings, and other similar factors. Dividends declared from time to time on FirstEnergy Corp.'s common
stock during any period may in the aggregate vary from prior periods due to circumstances considered by FirstEnergy Corp.'s Board of Directors at the time of the actual declarations. A security rating is not a recommendation to buy or hold securities
and is subject to revision or withdrawal at any time by the assigning rating agency. Each rating should be evaluated independently of any other rating. These forward-looking statements are also qualified by, and should be read in conjunction with the
other cautionary statements and risks that are included in our filings with the SEC, including but not limited to the most recent Annual Report on Form 10-K and any subsequent Quarterly Reports on Form 10-Q. The foregoing review of factors also
should not be construed as exhaustive. New factors emerge from time to time, and it is not possible for management to predict all such factors, nor assess the impact of any such factor on our business or the extent to which any factor, or combination
of factors, may cause results to differ materially from those contained in any forward-looking statements. We expressly disclaim any current intention to update, except as required by law, any forward-looking statements contained herein as a result of
new information, future events or otherwise.

Non-GAAP Financial Matters
November 2017EEI Financial Conference 3
This presentation contains references to non-GAAP financial measures including Operating earnings (losses). In addition, Basic
Earnings (Loss) Per Share - Operating, calculated on a segment basis, is also a non-GAAP financial measure. Generally, a non-GAAP
financial measure is a numerical measure of a company’s historical or future financial performance, financial position, or cash flows
that either excludes or includes amounts that are not normally excluded or included in the most directly comparable measure
calculated and presented in accordance with accounting principles generally accepted in the United States (GAAP). Operating
earnings (losses) are not calculated in accordance with GAAP because they exclude the impact of “special items”. Special items
represent charges incurred or benefits realized that management believes are not indicative of, or may obscure trends useful in
evaluating the company’s ongoing core activities and results of operations or otherwise warrant separate classification. Special items
are not necessarily non-recurring. Basic Earnings (Loss) Per Share - Operating for each segment is calculated by dividing segment
Operating earnings (losses), which exclude special items as discussed above, by the basic weighted average shares outstanding for
the period. Management uses non-GAAP financial measures such as Operating earnings (losses) to evaluate the company’s
performance and manage its operations and frequently references these non-GAAP financial measures in its decision-making, using
them to facilitate historical and ongoing performance comparisons. Additionally, management uses Basic Earnings (Loss) Per Share -
Operating by segment to further evaluate the company’s performance by segment and references this non-GAAP financial measure in
its decision-making. Management believes that the non-GAAP financial measures of Operating earnings (losses) and Basic Earnings
(Loss) Per Share - Operating by segment provide consistent and comparable measures of performance of its businesses on an
ongoing basis. Management also believes that such measures are useful to shareholders and other interested parties to understand
performance trends and evaluate the company against its peer group by presenting period-over-period operating results without the
effect of certain charges or benefits that may not be consistent or comparable across periods or across the company’s peer group. All
of these non-GAAP financial measures are intended to complement, and are not considered as alternatives to, the most directly
comparable GAAP financial measures. Also, the non-GAAP financial measures may not be comparable to similarly titled measures
used by other entities.
Pursuant to the requirements of Regulation G, FirstEnergy has provided quantitative reconciliations within this presentation of the non-
GAAP financial measures to the most directly comparable GAAP financial measures. Refer to appendix slide 24.

Agenda
■ FirstEnergy Overview
■ Transition to a Regulated Utility
■ Regulated Businesses
– Transmission
– Distribution
■ Competitive Energy Services
■ Closing Remarks / Q&A
November 2017EEI Financial Conference 4

FirstEnergy Overview
November 2017EEI Financial Conference 5
OH
VA
WV
PA
MD
NJ
MI
INIL
Jointly Owned Plant
Regulated Plants
Competitive Generating Plants
230, 345 and 500 kV Transmission Lines
Competitive retail footprint
Utility footprint
OUR MISSION
We are a forward-thinking electric utility powered by a diverse team of employees committed to
making customers’ lives brighter, the environment better and our communities stronger.
~24,500+ Miles
Transmission Lines
$43B
2016 Total Assets
$15B
2016 Annual Revenues
~6 Million
Total Customers
~17,000 MW
Total Generation
13 Regulated
Utility Companies

FirstEnergy’s Transition to a Regulated Model
November 2017EEI Financial Conference 6
Past
2011A
Present
2016A Future
Capacity
Competitive | Regulated
22,810 MW
87% | 13%
16,952 MW
78% | 22% Regulated only
CapEx ($M)
CES
Distribution
Transmission
$757
$1,127
$194
$550
$1,281
$1,001
–
~$1,300 per year through 2019
$800-$1,200 per year through 2021
Rate Base ($M)
Distribution (Dx) and
Transmission (Tx)
Dx: $11,015
Tx: $1,720
Dx: $12,540
Tx: $4,710
Expected Rate Base CAGR of ~4%
for Dx from 2016-2019 and ~9% for
Tx from 2016-2021
CES % of Total
Operating Earnings 37% 23% –
Diversified utility and merchant
power holding company
Commodity-exposed, merchant power
business is no longer viewed as core
Diversified utility holding company
with stable, predictable cash flows
Rating Agency Business
Risk Profile
Higher Risk
Integrated Profile
Low Risk
Fully Regulated Profile
November 2017EEI Financial Conference 7
Energizing the Future
2014 – 2017F
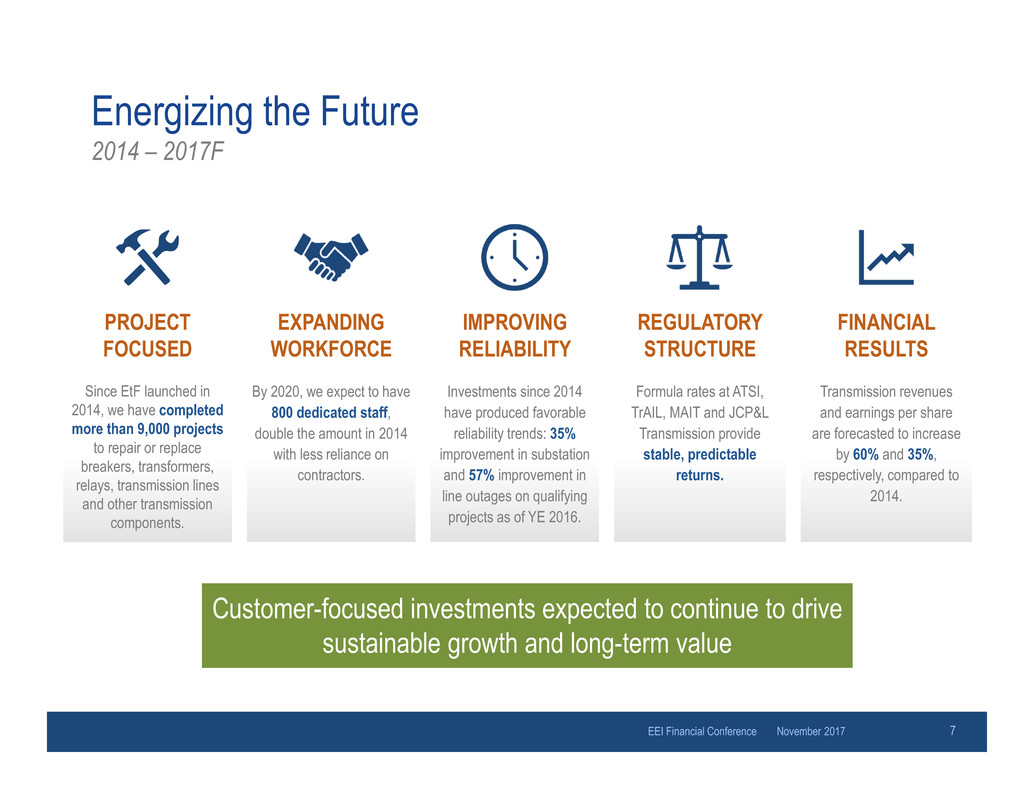
PROJECT
FOCUSED
Since EtF launched in
2014, we have completed
more than 9,000 projects
to repair or replace
breakers, transformers,
relays, transmission lines
and other transmission
components.
EXPANDING
WORKFORCE
By 2020, we expect to have
800 dedicated staff,
double the amount in 2014
with less reliance on
contractors.
REGULATORY
STRUCTURE
FINANCIAL
RESULTS
Transmission revenues
and earnings per share
are forecasted to increase
by 60% and 35%,
respectively, compared to
2014.
IMPROVING
RELIABILITY
Investments since 2014
have produced favorable
reliability trends: 35%
improvement in substation
and 57% improvement in
line outages on qualifying
projects as of YE 2016.
Customer-focused investments expected to continue to drive
sustainable growth and long-term value
Formula rates at ATSI,
TrAIL, MAIT and JCP&L
Transmission provide
stable, predictable
returns.

November 2017EEI Financial Conference 8
Energizing the Future
Proven Sustainable Growth Delivering Long-Term Value
Introduction/Theme
• Thousands of miles of transmission lines connect generating plants to our
homes and businesses, delivering the fuel that powers our lives and our
economy.
• First built at the turn of the last century, this complex network continues to
be a modern marvel.
• But, what began as a system of wires, poles and towers today is a vast
infrastructure of advanced technologies that keep power flowing at the
speed of light: more efficiently, effectively and responsively.
• Ongoing enhancements help the system continue to keep up with our
changing world.
• The pace of that change, however, has quickened as the system is
expanded and new technologies are added to make it stronger, smarter and
more capable than ever.
Energizing the Future
• The cornerstone of these efforts is Energizing the Future, FirstEnergy’s
long-term transmission investment initiative to upgrade and enhance the
electrical grid to meet the future needs of our customers.
• Between 2014 and 2017 we invested more than $4 billion in our
infrastructure, successfully completing the initial phase of our effort.
• Projects included the 100-mile Bruce Mansfield-Glen Willow transmission
line, a 345-kilovolt circuit connecting the Mansfield Plant in Pennsylvania, to
the new Glen Willow substation near Cleveland. Built almost entirely on
existing structures, this line was completed with minimal disturbance to the
landscape.
• Building transmission infrastructure is never easy – and sometimes
requires some creative thinking. In Pennsylvania, a helicopter helped us
string a line over the Pennsylvania Turnpike without disrupting traffic.
• In West Virginia we built a static VAR compensator and switching station
on the side of a mountain. The rugged terrain required 400,000 cubic yards
of fill to create a foundation and a 2.2-mile transmission line to connect with
an expanding natural gas processing facility nearby. The project supports
West Virginia’s growing shale gas industry and will enhance reliability for
Mon Power customers.
• The Oak Mound-Waldo Run project, also in West Virginia, included a
138-kilovolt (kV) transmission line connecting the two substations in Mon
Power’s northern West Virginia territory.
• In New Jersey, we completed an 11.5-mile transmission line in Mercer,
Middlesex and Monmouth counties, benefiting some 34,000 customers of
Jersey Central Power & Light.
• We plan to invest approximately $1 billion annually through 2021 on
Energizing the Future projects in Ohio, Pennsylvania, West Virginia,
Maryland and New Jersey, with another $20 billion in additional investment
potential beyond that timeframe.
An Eye on the Future
• Keeping the grid operating safely, reliably and cost-effectively is an
ongoing effort. It takes planning, preparation and protection – and dedicated
employees.
• With an eye toward our future growth and the help of ever-evolving smart
technologies, our transmission system will continue to be the backbone of
our system . . . and the electrical superhighway that feeds our customers
and our communities.
[Narration over, among other things, graphics of transmission
infrastructure and capital programs.]

Energizing the Future
Focused Investments for Customer Reliability Improvement
November 2017EEI Financial Conference 9
0.000
0.100
0.200
0.300
0.400
0.500
0.600
0.700
2012 2013 2014 2015 2016
T
O
F
Transmission Outage Frequency Trend
Realizing benefits by remaining focused on smaller-scale projects primarily
in ATSI, and beginning to move East
square4 Upgrade the condition and health of the existing system: approximately 5% of substation equipment and
transmission lines in ATSI
square4 Improve system performance and reliability
square4 Increase automation and communication within the system
square4 Enhance communication infrastructure and cyber/physical security
0.0%
5.0%
10.0%
15.0%
20.0%
25.0%
30.0%
35.0%
0
100
200
300
400
500
600
700
2013 2014 2015 2016
%
I
m
p
r
o
v
e
m
e
n
t
O
u
t
a
g
e
C
o
u
n
t
s
ATSI Outages
ATSI 69kV+ Outages % Improvement (from prior year)
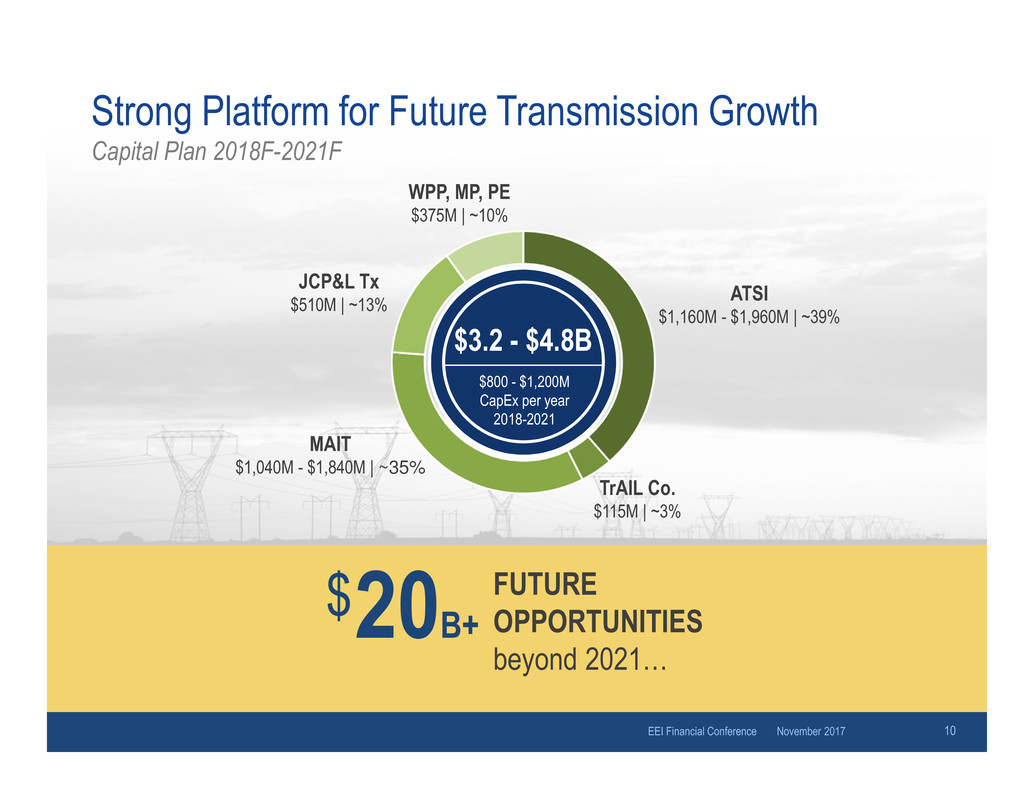
ATSI
$1,160M - $1,960M | ~39%
JCP&L Tx
$510M | ~13%
MAIT
$1,040M - $1,840M | ~35%
WPP, MP, PE
$375M | ~10%
TrAIL Co.
$115M | ~3%
Strong Platform for Future Transmission Growth
Capital Plan 2018F-2021F
November 2017EEI Financial Conference 10
20B+ FUTURE OPPORTUNITIES
beyond 2021…
$
$3.2 - $4.8B
$800 - $1,200M
CapEx per year
2018-2021
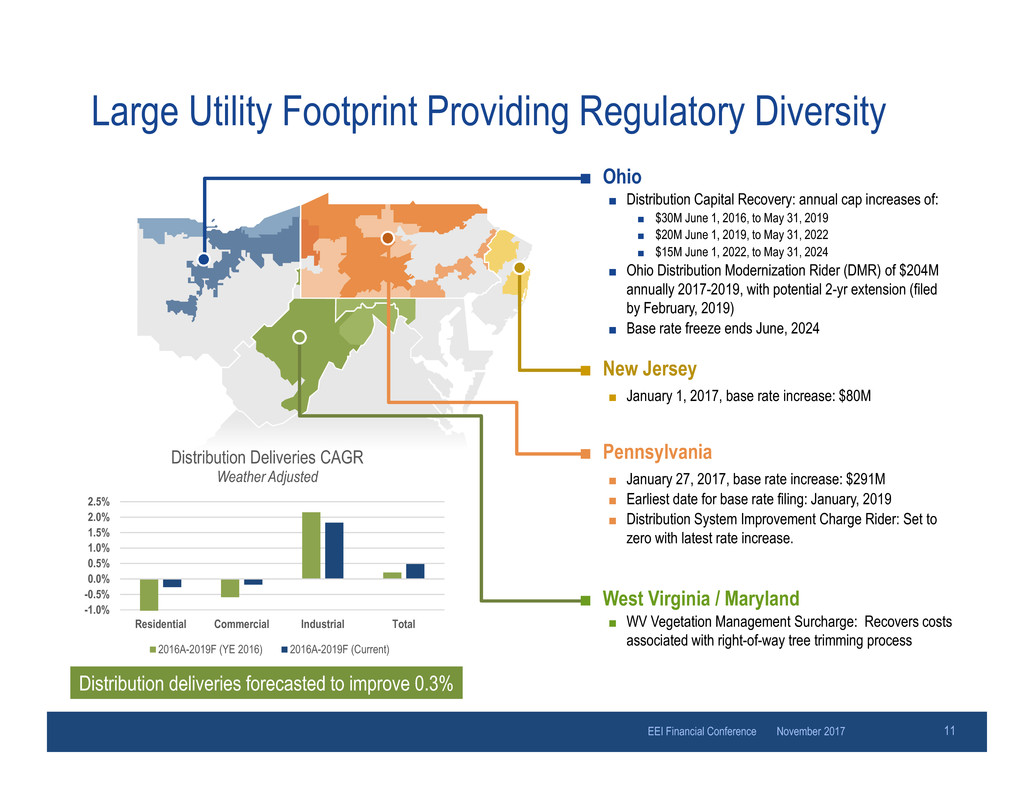
Large Utility Footprint Providing Regulatory Diversity
■ Ohio
■ Distribution Capital Recovery: annual cap increases of:
■ $30M June 1, 2016, to May 31, 2019
■ $20M June 1, 2019, to May 31, 2022
■ $15M June 1, 2022, to May 31, 2024
■ Ohio Distribution Modernization Rider (DMR) of $204M
annually 2017-2019, with potential 2-yr extension (filed
by February, 2019)
■ Base rate freeze ends June, 2024
■ New Jersey
■ January 1, 2017, base rate increase: $80M
■ Pennsylvania
■ January 27, 2017, base rate increase: $291M
■ Earliest date for base rate filing: January, 2019
■ Distribution System Improvement Charge Rider: Set to
zero with latest rate increase.
■ West Virginia / Maryland
■ WV Vegetation Management Surcharge: Recovers costs
associated with right-of-way tree trimming process
-1.0%
-0.5%
0.0%
0.5%
1.0%
1.5%
2.0%
2.5%
Residential Commercial Industrial Total
Distribution Deliveries CAGR
Weather Adjusted
2016A-2019F (YE 2016) 2016A-2019F (Current)
Distribution deliveries forecasted to improve 0.3%
November 2017EEI Financial Conference 11

2016A Weather-
Adjusted Operating
EPS(1)
2019F
Operating EPS
Regulated Operating Earnings Growth
The Scale of our Regulated Footprint Positions FirstEnergy for Sustained Growth
November 2017EEI Financial Conference 12
Targeting 5% - 7% Compound Annual Growth Rate
Incremental 3% with Ohio DMR
$2.46
Traditional Utility
Growth
2016A– 2019F
Including Ohio
DMR8% - 10%
1 CAGR calculated using a 2016 operating earnings (non-GAAP) for Regulated Distribution and Regulated Transmission segments of $2.46 per share which includes ($0.13) from the impact of weather.
See slide 24 in the Appendix for reconciliation between GAAP and Operating (non-GAAP) earnings.
5% - 7%
+ Future Growth
Opportunities
1
November 2017EEI Financial Conference 13
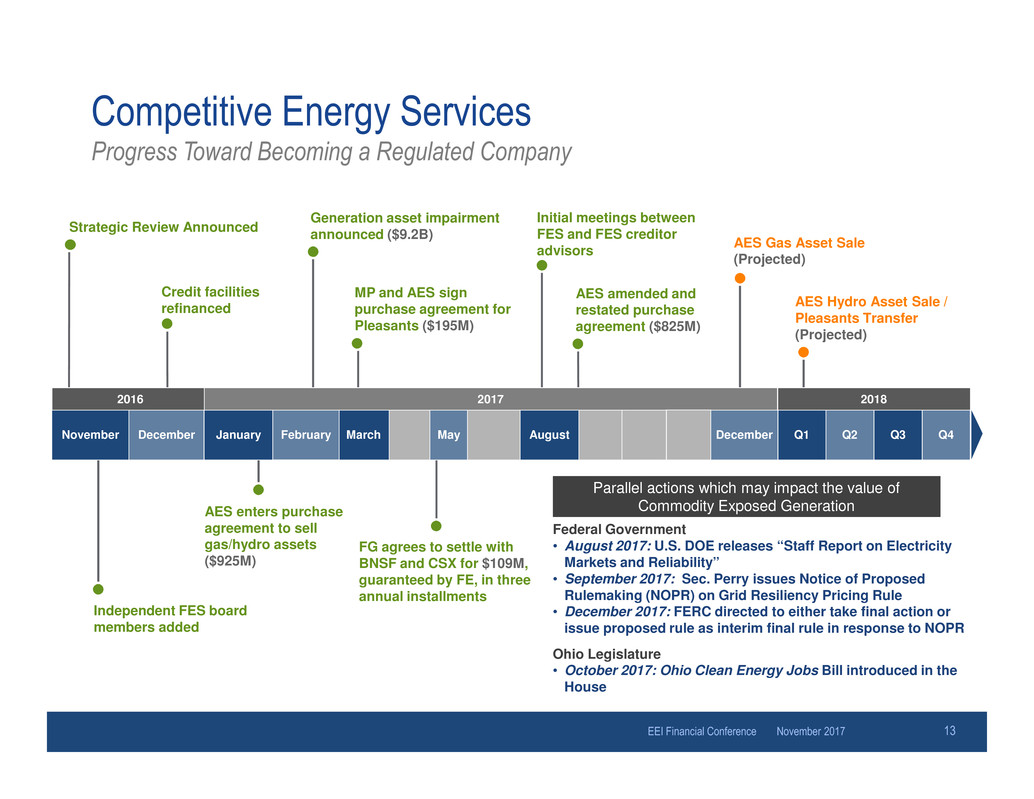
Competitive Energy Services
Progress Toward Becoming a Regulated Company
Parallel actions which may impact the value of
Commodity Exposed Generation
Strategic Review Announced Initial meetings between FES and FES creditor
advisors
Independent FES board
members added
AES Hydro Asset Sale /
Pleasants Transfer
(Projected)
AES Gas Asset Sale
(Projected)
Generation asset impairment
announced ($9.2B)
November DecemberAugust Q3Q1 Q2December May Q4January
20182016
March
FG agrees to settle with
BNSF and CSX for $109M,
guaranteed by FE, in three
annual installments
MP and AES sign
purchase agreement for
Pleasants ($195M)
AES enters purchase
agreement to sell
gas/hydro assets
($925M)
Federal Government
• August 2017: U.S. DOE releases “Staff Report on Electricity
Markets and Reliability”
• September 2017: Sec. Perry issues Notice of Proposed
Rulemaking (NOPR) on Grid Resiliency Pricing Rule
• December 2017: FERC directed to either take final action or
issue proposed rule as interim final rule in response to NOPR
Ohio Legislature
• October 2017: Ohio Clean Energy Jobs Bill introduced in the
House
Credit facilities
refinanced
AES amended and
restated purchase
agreement ($825M)
February
2017

■ Committed to investment-grade
credit ratings at all regulated
entities and FE Corp.
■ $4.9B of available liquidity as of
9/30/17
■ Expect at least $1.5B of equity
through 2019
■ 10 operating companies across 6
states
■ ~6M customers
■ Expected Rate Base CAGR of ~4%,
2016A-2019F
Unlocking the Full Value of FirstEnergy for Investors
November 2017EEI Financial Conference 14
■ 3 operating companies; FERC-
regulated formula returns
■ Expected Rate Base CAGR of ~9%,
2016A-2021F
■ $20B+ capital project runway
beyond 2021
Transmission Distribution Balance Sheet
Targeting 5 – 7% CAGR through 2019, incremental 3% with OH DMR Building a Stronger Balance Sheet
November 2017EEI Financial Conference 15
Appendix
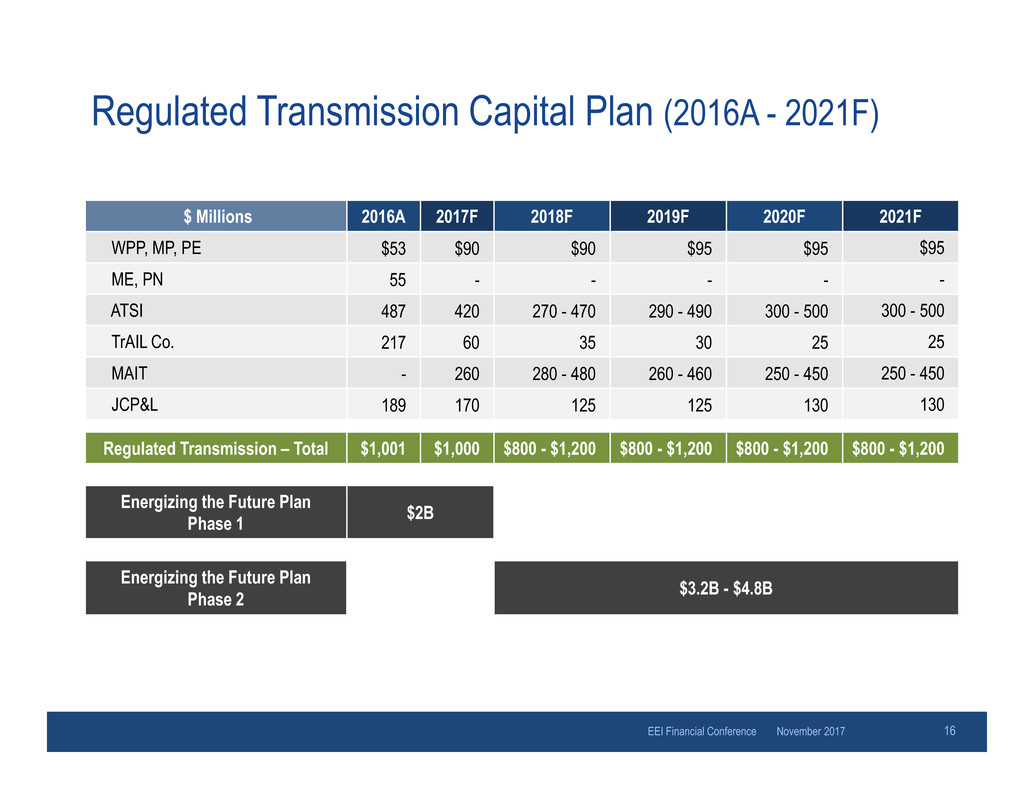
Regulated Transmission Capital Plan (2016A - 2021F)
November 2017EEI Financial Conference 16
$ Millions 2016A 2017F 2018F 2019F 2020F 2021F
WPP, MP, PE $53 $90 $90 $95 $95 $95
ME, PN 55 - - - - -
ATSI 487 420 270 - 470 290 - 490 300 - 500 300 - 500
TrAIL Co. 217 60 35 30 25 25
MAIT - 260 280 - 480 260 - 460 250 - 450 250 - 450
JCP&L 189 170 125 125 130 130
Regulated Transmission – Total $1,001 $1,000 $800 - $1,200 $800 - $1,200 $800 - $1,200 $800 - $1,200
Energizing the Future Plan
Phase 1 $2B
Energizing the Future Plan
Phase 2 $3.2B - $4.8B
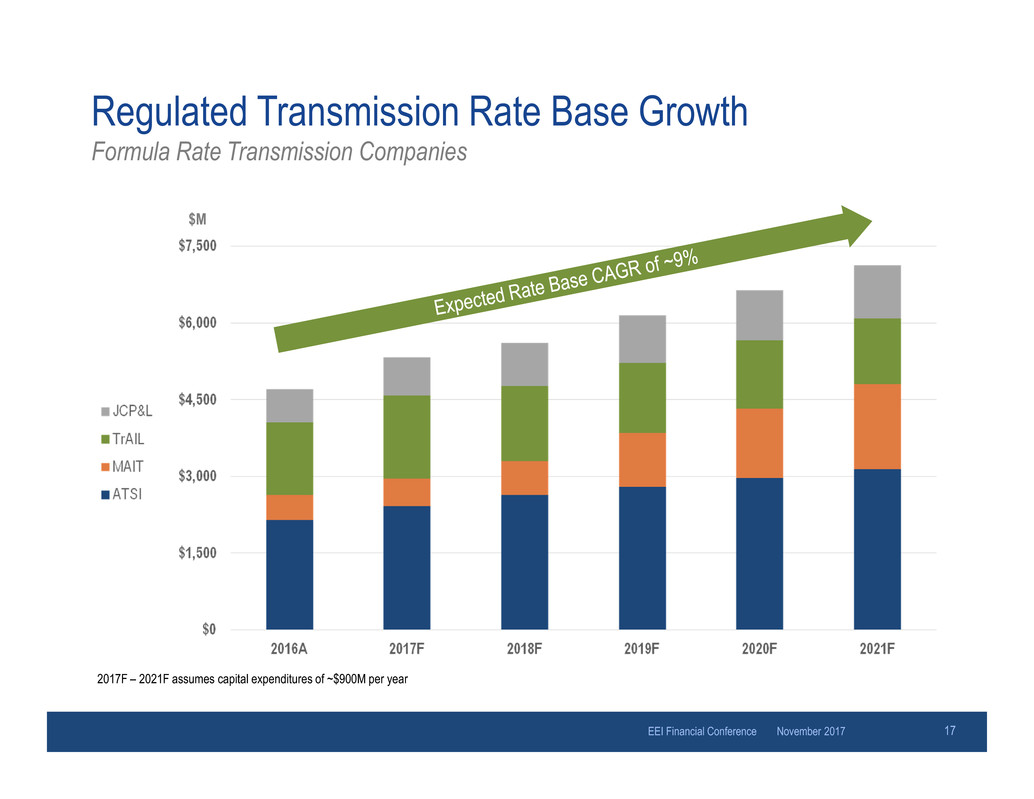
Regulated Transmission Rate Base Growth
Formula Rate Transmission Companies
November 2017EEI Financial Conference 17
$M
2017F – 2021F assumes capital expenditures of ~$900M per year

Weather-Adjusted Distribution Deliveries
November 2017EEI Financial Conference 18
Residential
Commercial Industrial
M MWH 2016A 2017F 2018F 2019F 2016A-2019F CAGR %
Sub-Total 43.1 42.9 43.0 42.9 -0.2%
OH 15.4 15.1 15.3 15.3 -0.1%
PA 13.0 12.9 12.8 12.8 -0.5%
WV 3.7 3.7 3.8 3.8 1.0%
NJ 9.0 9.0 9.0 8.9 -0.6%
MD 2.1 2.1 2.1 2.1 0.7%
M MWH 2016A 2017F 2018F 2019F 2016A-2019F CAGR %
Sub-Total 50.1 51.1 52.2 52.9 1.8%
OH 20.3 20.3 20.4 20.5 0.4%
PA 20.2 20.9 21.1 21.2 1.6%
WV 5.8 6.1 6.8 7.3 7.8%
NJ 2.2 2.2 2.1 2.0 -2.1%
MD 1.6 1.7 1.8 1.8 3.4%
M MWH 2016A 2017F 2018F 2019F 2016A-2019F CAGR %
Sub-Total 53.2 53.3 53.3 52.8 -0.3%
OH 17.0 16.9 17.0 16.8 -0.4%
PA 18.3 18.4 18.2 17.9 -0.7%
WV 5.5 5.4 5.6 5.6 1.0%
NJ 9.3 9.4 9.3 9.2 -0.2%
MD 3.2 3.2 3.3 3.2 0.3%
M MWH 2016A 2017F 2018F 2019F 2016A-2019F CAGR %
Total 146.5 147.4 148.5 148.6 0.5%
OH 52.6 52.4 52.7 52.6 -
PA 51.5 52.2 52.1 51.9 0.3%
WV 15.0 15.3 16.2 16.7 3.8%
NJ 20.5 20.6 20.3 20.1 -0.6%
MD 6.9 7.0 7.1 7.1 1.2%
Total Deliveries
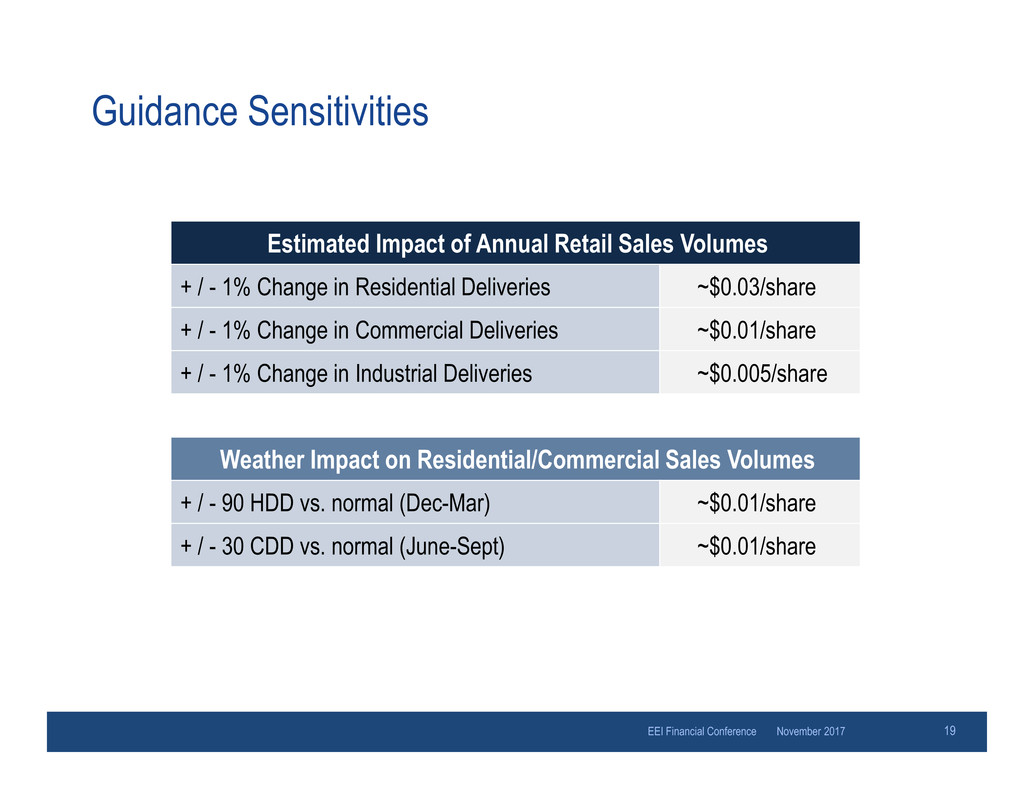
Guidance Sensitivities
November 2017EEI Financial Conference 19
Estimated Impact of Annual Retail Sales Volumes
+ / - 1% Change in Residential Deliveries ~$0.03/share
+ / - 1% Change in Commercial Deliveries ~$0.01/share
+ / - 1% Change in Industrial Deliveries ~$0.005/share
Weather Impact on Residential/Commercial Sales Volumes
+ / - 90 HDD vs. normal (Dec-Mar) ~$0.01/share
+ / - 30 CDD vs. normal (June-Sept) ~$0.01/share
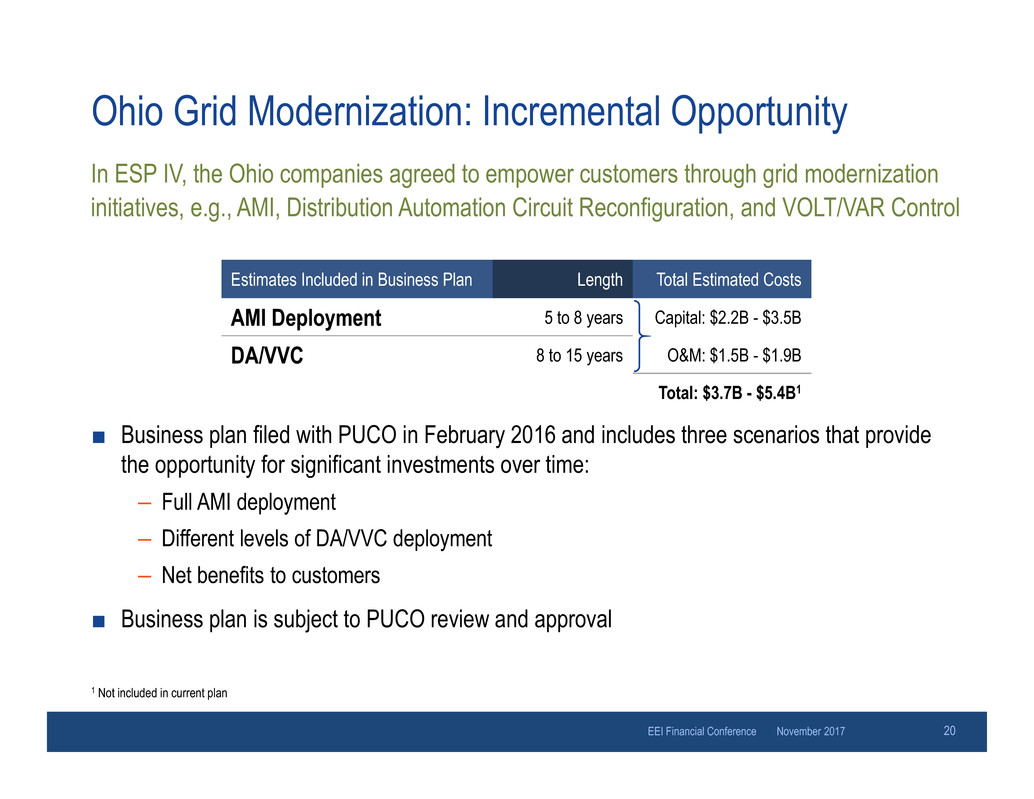
Ohio Grid Modernization: Incremental Opportunity
■ Business plan filed with PUCO in February 2016 and includes three scenarios that provide
the opportunity for significant investments over time:
– Full AMI deployment
– Different levels of DA/VVC deployment
– Net benefits to customers
■ Business plan is subject to PUCO review and approval
November 2017EEI Financial Conference
Estimates Included in Business Plan Length Total Estimated Costs
AMI Deployment 5 to 8 years Capital: $2.2B - $3.5B
DA/VVC 8 to 15 years O&M: $1.5B - $1.9B
Total: $3.7B - $5.4B1
1 Not included in current plan
In ESP IV, the Ohio companies agreed to empower customers through grid modernization
initiatives, e.g., AMI, Distribution Automation Circuit Reconfiguration, and VOLT/VAR Control
20
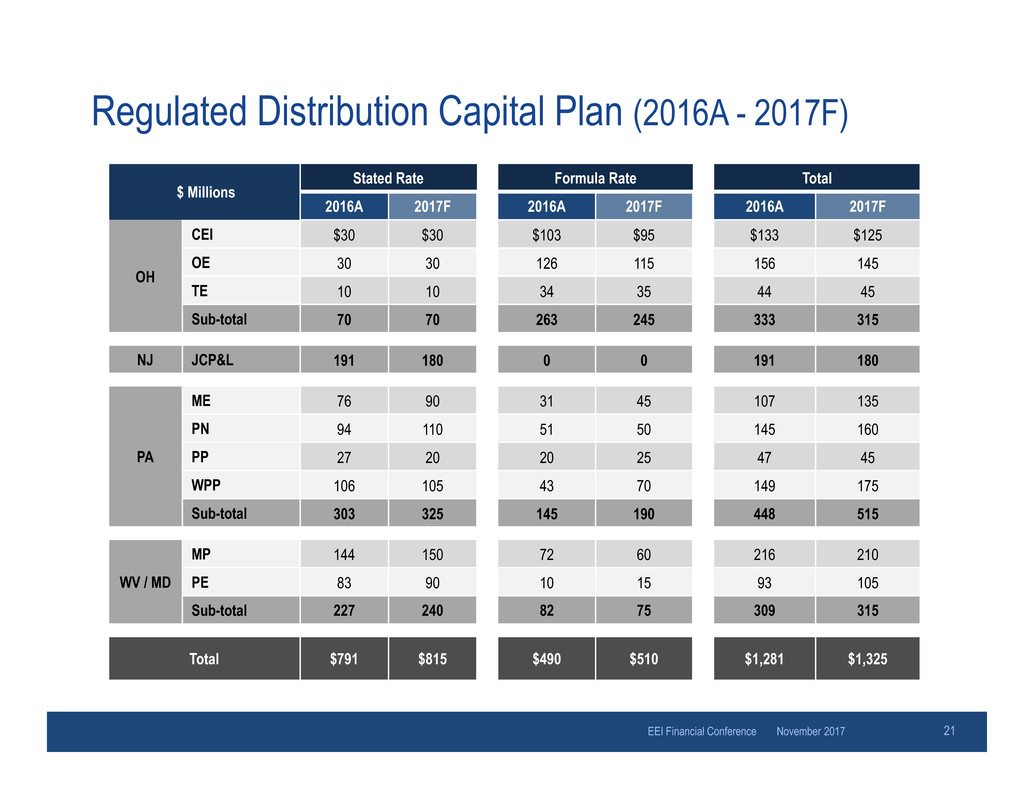
Regulated Distribution Capital Plan (2016A - 2017F)
November 2017EEI Financial Conference 21
$ Millions
Stated Rate Formula Rate Total
2016A 2017F 2016A 2017F 2016A 2017F
OH
CEI $30 $30 $103 $95 $133 $125
OE 30 30 126 115 156 145
TE 10 10 34 35 44 45
Sub-total 70 70 263 245 333 315
NJ JCP&L 191 180 0 0 191 180
PA
ME 76 90 31 45 107 135
PN 94 110 51 50 145 160
PP 27 20 20 25 47 45
WPP 106 105 43 70 149 175
Sub-total 303 325 145 190 448 515
WV / MD
MP 144 150 72 60 216 210
PE 83 90 10 15 93 105
Sub-total 227 240 82 75 309 315
Total $791 $815 $490 $510 $1,281 $1,325
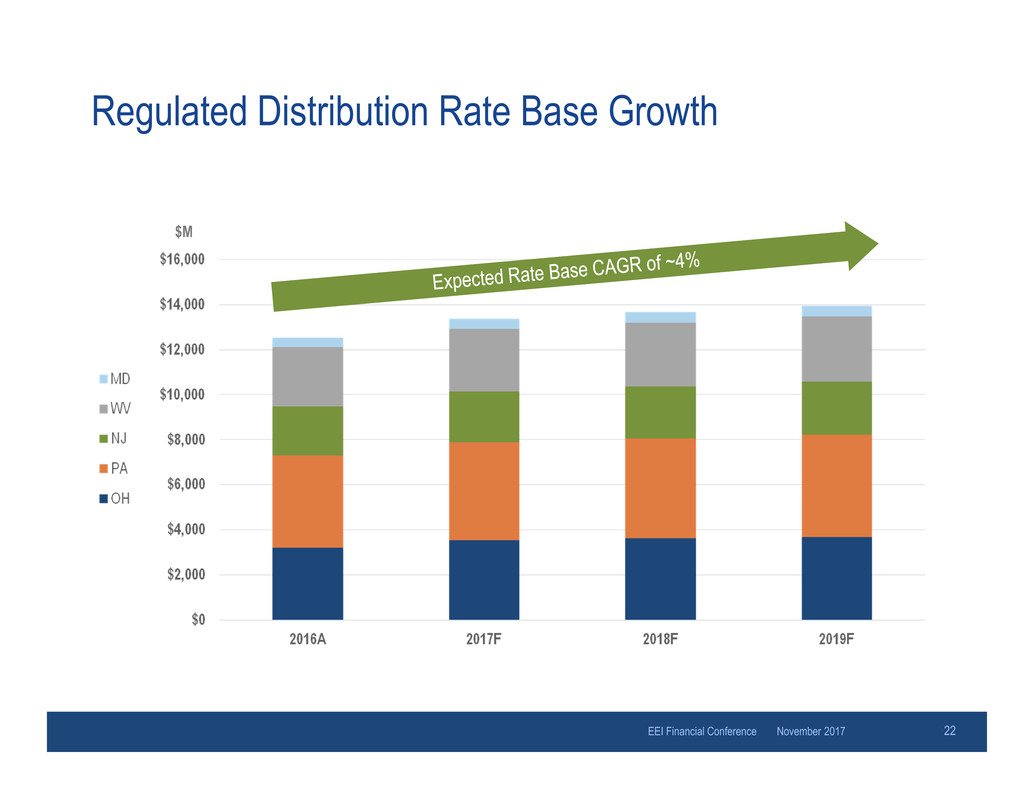
Regulated Distribution Rate Base Growth
November 2017EEI Financial Conference 22
$M
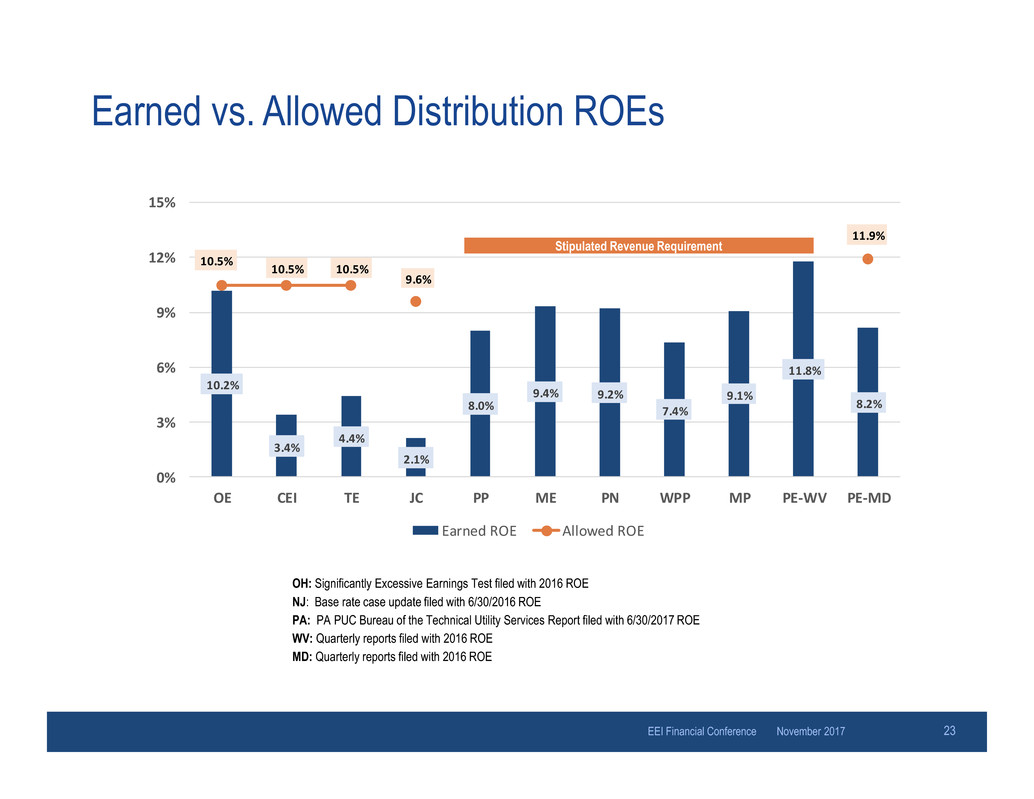
Earned vs. Allowed Distribution ROEs
OH: Significantly Excessive Earnings Test filed with 2016 ROE
NJ: Base rate case update filed with 6/30/2016 ROE
PA: PA PUC Bureau of the Technical Utility Services Report filed with 6/30/2017 ROE
WV: Quarterly reports filed with 2016 ROE
MD: Quarterly reports filed with 2016 ROE
10.2%
3.4%
4.4%
2.1%
8.0%
9.4% 9.2%
7.4%
9.1%
11.8%
8.2%
10.5% 10.5% 10.5%
9.6%
11.9%
0%
3%
6%
9%
12%
15%
OE CEI TE JC PP ME PN WPP MP PE-WV PE-MD
Earned ROE Allowed ROE
Stipulated Revenue Requirement
23November 2017EEI Financial Conference

November 2017EEI Financial Conference 24
2016A GAAP to Operating (Non-GAAP) Earnings1
Reconciliation
(In millions, except per share amounts)
Per share amounts for the special items and earnings drivers above and throughout these materials are based on the after-tax effect of each item divided by the weighted average basic shares outstanding for the period. The current
and deferred income tax effect was calculated by applying the subsidiaries‘ statutory tax rate to the pre-tax amount with the exception of Asset impairment/Plant exit costs that included an impairment of goodwill, of which $433 million
of the $800 million pre-tax impairment was non-deductible for tax purposes, and valuation allowances against state and local NOL carryforwards of $159 million. With the exception of these items included in Asset impairment/Plant
exit costs, the income tax rates range from 35% to 41%.
1 Operating earnings exclude special items as described in the reconciliation table above and is a non-GAAP financial measure.

FirstEnergy Investor Relations Contacts
For our e-mail distribution list, please contact:
Linda M. Nemeth, Executive Assistant to Vice President
nemethl@FirstEnergyCorp.com
330-384-2509
Shareholder Inquiries:
Irene M. Prezelj, Vice President
prezelji@FirstEnergyCorp.com
330-384-3859
Shareholder Services (American Stock Transfer and Trust Company, LLC)
firstenergy@amstock.com
1-800-736-3402
Meghan G. Beringer, Director
mberinger@FirstEnergyCorp.com
330-384-5832
Jake M. Mackin, Manager
mackinj@FirstEnergyCorp.com
330-384-4829
25November 2017EEI Financial Conference
