Attached files
| file | filename |
|---|---|
| 8-K - FORM 8-K - ROYAL GOLD INC | tv478387_8k.htm |
| EX-99.1 - EXHIBIT 99.1 - ROYAL GOLD INC | tv478387_ex99-1.htm |
NASDAQ: RGLD First Fiscal Quarter 2018 Results November 2, 2017 Royal Gold, Inc. Exhibit 99.2

NASDAQ: RGLD | 2 This presentation contains certain forward - looking statements within the meaning of the Private Securities Litigation Reform Act of 1995 . Such forward - looking statements involve known and unknown risks, uncertainties, and other factors that could cause actual results to differ materially from the projections and estimates contained herein and include, but are not limited to : sequential growth catalyst and estimated production at Rainy River, Cortez Crossroads and Peñasquito Pyrite Leach in calendar 2017 and 2018 ; ability of Rainy River project to complete main tailings storage facility and ramp - up to capacity ; estimated revenue and percentages of future revenue expected from the Company’s stream and royalty portfolio ; expected start - up date for Cortez Crossroads ; expected start - up date for and estimated production from the Pyrite Leach project ; estimated production at each of Rainy River, Cortez Crossroads and the Pyrite Leach project ; the expected increase in the gold stream rate at Wassa and Prestea in calendar year 2018 ; improving throughput and recovery at Mount Milligan ; expected effective tax rate, depreciation, depletion and amortization, interest expense and debt repayments for fiscal year 2018 ; mine life and reserves estimates and forecasts of throughput, recoveries and production from the operators of our stream and royalty interests ; and lack of additional funding requirements ; and statements concerning cash flow generation, quickly delivering, embedded growth, diverse portfolio, strong margins, lean structure, strategic capital allocation, equity stewardship, and dividend returns . Factors that could cause actual results to differ materially from these forward - looking statements include, among others : the risks inherent in the operation of mining properties ; a decreased price environment for gold and other metals on which our stream and royalty interests are determined ; performance of and production at properties, and variation of actual production from the production estimates and forecasts made by the operators of those stream and royalty properties ; decisions and activities of the Company’s management affecting margins, use of capital and changes in strategy ; unexpected operating costs, decisions and activities of the operators of the Company’s stream and royalty properties ; changes in operators’ mining and processing techniques or stream or royalty calculation methodologies ; resolution of regulatory and legal proceedings ; unanticipated grade, geological, metallurgical, environmental, processing or other problems at the properties ; revisions or inaccuracies in technical reports, reserve, resources and production estimates ; changes in project parameters as plans of the operators are refined ; the results of current or planned exploration activities ; errors or disputes in calculating stream deliveries and royalty payments, or deliveries or payments under stream or royalty agreements ; the liquidity and future financial needs of the Company ; economic and market conditions ; the impact of future acquisitions and stream and royalty financing transactions ; the impact of issuances of additional common stock ; and risks associated with conducting business in foreign countries, including application of foreign laws to contract and other disputes, environmental laws, enforcement and uncertain political and economic environments . These risks and other factors are discussed in more detail in the Company’s public filings with the Securities and Exchange Commission . Statements made herein are as of the date hereof and should not be relied upon as of any subsequent date . The Company’s past performance is not necessarily indicative of its future performance . The Company disclaims any obligation to update any forward - looking statements . Third - party information : Certain information provided in this presentation has been provided to the Company by the operators of properties subject to our stream and royalty interests, or is publicly available information filed by these operators with applicable securities regulatory bodies, including the Securities and Exchange Commission . The Company has not verified, and is not in a position to verify, and expressly disclaims any responsibility for the accuracy, completeness or fairness of such third - party information and refers readers to the public reports filed by the operators for information regarding those properties . Cautionary Statement

NASDAQ: RGLD | Today’s Speakers Tony Jensen President and CEO Stefan Wenger CFO and Treasurer 3

NASDAQ: RGLD | Revenue of $112 million Earnings of $0.44 per share Cash flow from operations of $72 million Volume of 88,000 GEO’s Dividends of $16 million Repayment of another $50 million of debt >$900 million of liquidity No capital commitments Rainy River – declared commercial production , is our 40th producing property Solid Performance in Q1 FY18 4

NASDAQ: RGLD | Notable volume guidance updates going into the end of calendar 2017 CY 2017 Update 1 Information has been provided to the Company by the operators of those properties or is publicly available information filed by these operators. Please see page 2. 2 See slide 13 for details on the scope of Royal Gold’s streaming and these royalty interests. Gold forecast 235koz - 255koz from low end of 260k - 290koz 1 Copper guidance unchanged at low end of 55 - 65Mlbs 1 Stream on 35% of gold and 18.75% of silver 2 5 Pueblo Viejo Gold narrowed to 635koz - 650koz from 625koz - 650koz 1 Stream on 7.5% of gold and 75% of silver 2 Wassa and Prestea Reiterated full year guidance of 255koz to 280koz 1 Stream on 9.25% of gold; increasing to 10.5% in CY18 2 Mount Milligan

NASDAQ: RGLD | Sequential growth catalysts in calendar 2017 and 2018, bought and paid for Embedded Growth 1 Information has been provided to the Company by the operators of those properties or is publicly available information filed by these operators. Please see page 2. 2 See slide 13 for details on the scope of Royal Gold’s streaming and royalty interests. New Gold: Commercial production began October 2017 1 Stream on 6.5% of gold and 60% of silver 1 3.9Moz gold in reserves; 10.0Moz silver in reserves 1,2 6 Cortez Crossroads - 2018 Barrick: CY18 startup expected 1 and stripping underway 4.5% NVR & 5% GSR royalty 2 3.2Moz gold in reserves 1 Peñasquito Leach – CQ418 Goldcorp: Commissioning accelerated to CQ4 2018 1 Progress at 9/30/17: 40% complete 1 Expected to add 1Moz gold, 44Moz silver to mine life 1 Rainy River - 2017

NASDAQ: RGLD | Commercial Production at Rainy River Rainy River - 2017 1 Information has been provided to the Company by the operators of those properties or is publicly available information filed by these operators. Please see page 2. 2 See slide 13 for details on the scope of Royal Gold’s streaming and these royalty interests. Rainy River - 2017 Rainy River - 2017 7 Ball Mill and SAG Mill Tailings Starter Facility Favorable jurisdiction in Canada 204 km 2 land package Schedule 2 Amendment completed Approval received to complete construction of the main tailings storage facility Commercial production declared October 19, which was 2 weeks ahead of schedule 1 Achieved 18,500 tonnes per day, or 88% of capacity for the period Oct 1 - 24 1 Land Position

NASDAQ: RGLD | 1 Producing properties not highlighted in the map include Allan, Bald Mountain, Canadian Malartic , Dolores, Don Mario, El Limon, Gold Hill, Goldstrike , Gwalia, Holt, King of the Hills, Las Cruces, Leeville , Marigold, Meekathara , Mulatos , Rambler North, Robinson, Ruby Hill, Skyline, Soledad Mountain, South Laverton, Southern Cross, Taparko , Twin Creeks, Wharf, Williams, and others. 2 Reflects portfolio on October 30, 2017. 3 In FQ1 2018. Diverse Portfolio 8 Rainy River is our 40 th producing property 195 total property interests(all minerals); 40 producing and 21 in development 2 87% of revenue from precious metals 3 89% of revenue from Canada, Chile, US, Mexico and Dominican Republic 3

NASDAQ: RGLD | <1.6x net debt to EBITDA, 1 liquidity of over $900 million, both at 9 - 30 - 17 $45m Repaid March 31, 2017 $50m Repaid June 30, 2017 $50m Repaid Sept 5, 2017 Quickly Delevering 9 1 The term “EBITDA” is a non - GAAP financial measure. See slide 14 for additional information.

NASDAQ: RGLD | FQ1 Revenue of $112 million Effective tax rate of 22.1% for FQ1 FY18 effective tax rate forecast range is 20% - 25% FQ1 DD&A of $450 per GEO FY18 DD&A forecast range is $450 - $500 per GEO Strong liquidity of >$900 million Focus on using free cash flow to reduce debt No additional funding requirements 1 FQ1 18 Financial Results 1 Assuming no changes to our existing portfolio. Date Item ($USD millions) September 30, 2017 Undrawn Revolver $800m September 30, 2017 Working Capital $116m September 30, 2017 Total Available Liquidity $916m Additional Near Term Commitments $0 10
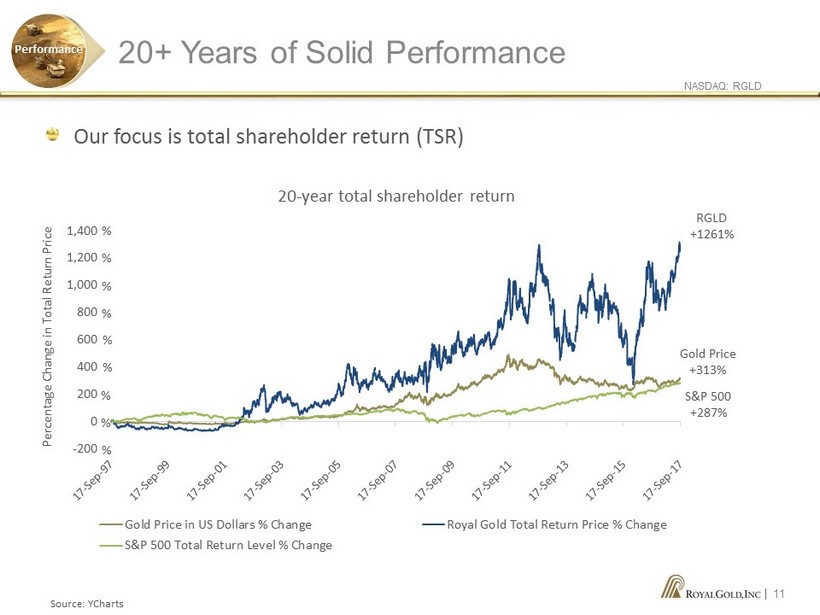
NASDAQ: RGLD | Source: YCharts 20+ Years of Solid Performance Performance 11 -200 0 200 400 600 800 1,000 1,200 1,400 Gold Price in US Dollars % Change Royal Gold Total Return Price % Change S&P 500 Total Return Level % Change RGLD +1261% S&P 500 +287% Gold Price +313% % % % % % % % % % 20 - year total shareholder return Percentage Change in Total Return Price Our focus is total shareholder return (TSR)
1660 Wynkoop Street, #1000 Denver, CO 80202 303.573.1660 info@royalgold.com www.royalgold.com NASDAQ: RGLD
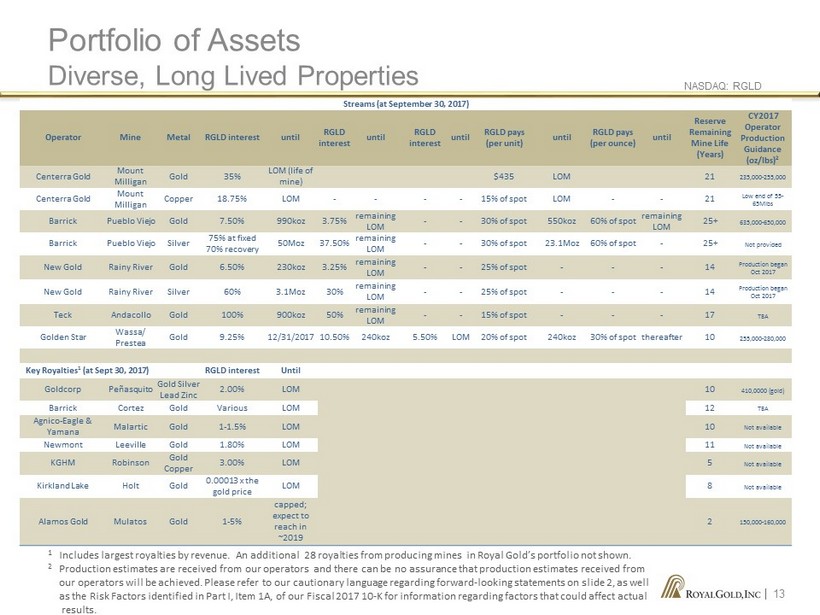
NASDAQ: RGLD | Streams (at September 30, 2017) Operator Mine Metal RGLD interest until RGLD interest until RGLD interest until RGLD pays (per unit) until RGLD pays (per ounce) until Reserve Remaining Mine Life (Years) CY2017 Operator Production Guidance (oz/ lbs ) 2 Centerra Gold Mount Milligan Gold 35% LOM (life of mine) $435 LOM 21 235,000 - 255,000 Centerra Gold Mount Milligan Copper 18.75% LOM - - - - 15% of spot LOM - - 21 Low end of 55 - 65Mlbs Barrick Pueblo Viejo Gold 7.50% 990koz 3.75% remaining LOM - - 30% of spot 550koz 60% of spot remaining LOM 25+ 635,000 - 650,000 Barrick Pueblo Viejo Silver 75% at fixed 70% recovery 50Moz 37.50% remaining LOM - - 30% of spot 23.1Moz 60% of spot - 25+ Not provided New Gold Rainy River Gold 6.50% 230koz 3.25% remaining LOM - - 25% of spot - - - 14 Production began Oct 2017 New Gold Rainy River Silver 60% 3.1Moz 30% remaining LOM - - 25% of spot - - - 14 Production began Oct 2017 Teck Andacollo Gold 100% 900koz 50% remaining LOM - - 15% of spot - - - 17 TBA Golden Star Wassa/ Prestea Gold 9.25% 12/31/2017 10.50% 240koz 5.50% LOM 20% of spot 240koz 30% of spot thereafter 10 255,000 - 280,000 Key Royalties 1 (at Sept 30 , 2017) RGLD interest Until Goldcorp Peñasquito Gold Silver Lead Zinc 2.00% LOM 10 410,0000 (gold) Barrick Cortez Gold Various LOM 12 TBA Agnico - Eagle & Yamana Malartic Gold 1 - 1.5% LOM 10 Not available Newmont Leeville Gold 1.80% LOM 11 Not available KGHM Robinson Gold Copper 3.00% LOM 5 Not available Kirkland Lake Holt Gold 0.00013 x the gold price LOM 8 Not available Alamos Gold Mulatos Gold 1 - 5% capped; expect to reach in ~2019 2 150,000 - 160,000 Portfolio of Assets Diverse, Long Lived Properties 1 Includes largest royalties by revenue. An additional 28 royalties from producing mines in Royal Gold’s portfolio not shown . 2 Production estimates are received from our operators and there can be no assurance that production estimates received from our operators will be achieved. Please refer to our cautionary language regarding forward - looking statements on slide 2, as well as the Risk Factors identified in Part I, Item 1A, of our Fiscal 2017 10 - K for information regarding factors that could affect a ctual results. 13

NASDAQ: RGLD | Non - GAAP Financial Measures Non - GAAP financial measures are intended to provide additional information only and do not have any standard meaning prescribed by generally accepted accounting principles (“GAAP”) . These measures should not be considered in isolation or as a substitute for measures of performance prepared in accordance with GAAP . Our management uses Adjusted EBITDA and Adjusted Net Income as measures of operating performance to assist in comparing performance from period to period on a consistent basis ; as a measure for planning and forecasting overall expectations and for evaluating actual results against such expectations ; in communications with the board of directors, stockholders, analysts and investors concerning our financial performance ; as useful comparisons to the performance of our competitors ; and as metrics of certain management incentive compensation calculations . We believe that these measures are used by and are useful to investors and other users of our financial statements in evaluating our operating performance because they provide an additional tool to evaluate our performance without regard to special and non - core items, which can vary substantially from company to company depending upon accounting methods, book value of assets and capital structure . We have provided reconciliations of all non - GAAP measures to their nearest U . S . GAAP measures and have consistently applied the adjustments within our reconciliations in arriving at each non - GAAP measure . We consider these items to be necessary adjustments for purposes of evaluating our ongoing business performance and are often considered non - recurring . Such adjustments are subjective and involve significant management judgment . Adjusted EBITDA Reconciliation Adjusted EBITDA is defined by the Company as net income (loss) plus depreciation, depletion and amortization, non - cash charges, income tax expense, interest and other expense, and any impairment of mining assets, less non - controlling interests in operating loss (income) of consolidated subsidiaries, interest and other income, and any royalty portfolio restructuring gains or losses . Other companies may define and calculate this measure differently . Adjusted EBITDA identifies the cash generated in a given period that will be available to fund the Company's future operations, growth opportunities, shareholder dividends and to service the Company's debt obligations . This information differs from measures of performance determined in accordance with U . S . GAAP and should not be considered in isolation or as a substitute for measures of performance determined in accordance with U . S . GAAP . See the table below for a reconciliation of net income to Adjusted EBITDA . Non - GAAP Financial Measures and Adjusted EBITDA Reconciliation 14 For The Three Months Ended September 30, (Unaudited, in thousands) 2017 2016 Net income 26,548$ 26,955$ Depreciation, depletion and amortization 39,692 40,102 Non-cash employee stock compensation 2,373 4,144 Interest and other, net 7,600 6,748 Income tax expense 7,544 7,188 Non-controlling interests in operating loss of consolidated subsidiaries 2,083 2,984 Adjusted EBITDA 85,840$ 88,121$

1660 Wynkoop Street, #1000 Denver, CO 80202 303.573.1660 info@royalgold.com www.royalgold.com NASDAQ: RGLD