Attached files
| file | filename |
|---|---|
| 8-K - 8-K - Tesla, Inc. | tsla-8k_20171101.htm |
Exhibit 99.1
|
|
|
Tesla Third Quarter 2017 Update
•Surpassed 250,000 vehicles delivered since inception •Record Model S and Model X net orders and deliveries in Q3 2017 •About 100,000 Model S and X deliveries projected for 2017 •Model 3 production steadily increasing •Cash balance of $3.5B entering Q4 2017
|

In Q3, we delivered the 250,000th Tesla. This is a significant milestone as the Tesla fleet is now about 100 times larger than it was five years ago, just before the launch of Model S.
During Q3, we received record net orders for Model S and Model X, setting the stage for what should be an all-time record for deliveries of these vehicles in Q4. With the addition of Model 3 as a compelling, high-performance and long-range electric vehicle that is also affordable, the Tesla fleet should grow even faster in the years ahead.
Shifting road transportation from internal combustion engines to electric powertrains is only half the Tesla story. We are also experiencing growing demand for our Powerwall and Powerpack energy storage products for residential and commercial applications, and we are increasing production of these products. Energy generation with Solar Roof will become a bigger portion of our business next year as we ramp production at Gigafactory 2 in Buffalo. Sustainable energy generation and storage is a critical part of Tesla’s mission and will drive long‑term revenue growth and profits.
ADVANCING SUSTAINABLE TRANSPORT
|
The initial phase of manufacturing any new vehicle is always challenging, and the Model 3 production ramp is no exception – particularly given our focus on highly automated manufacturing processes that will ultimately result in higher volumes at significantly lower costs. Model 3 has been designed for manufacturability, so the car itself is not difficult to build. That said, the Model 3 production process will be vastly more automated than the production process of Model S, Model X or almost any other car on the market today, and bringing this level of automation online is simply challenging in the early stages of the ramp. We continue to make progress resolving early bottlenecks related to these issues, and there remain no fundamental problems with our supply chain or any of our production processes.
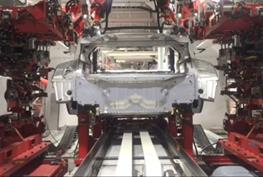
Several manufacturing lines, such as drive unit, seat assembly, paint shop and stamping, have demonstrated a manufacturing ability in excess of 1,000 units per week during burst builds of short duration. Other lines, such as battery pack assembly, body shop welding and final vehicle assembly, have demonstrated burst builds of about 500 units per week and are ramping up quickly. Likewise, cell production at Gigafactory 1 continues to ramp, and current cell production makes it one of the largest battery cell manufacturing facilities in the world. |
Model 3 Body Shop Welding (Video Embedded) |

|
Demand for Model 3 is not going to be a constraint for quite a long time. The global net reservations for Model 3 continued to grow significantly in Q3.
In Q3, we delivered 25,915 Model S and Model X vehicles and 222 Model 3 vehicles, for a total of 26,137 deliveries. Combined Model S and Model X deliveries in Q3 grew 18% globally compared to Q2 and 4.5% versus the same quarter one year ago. Consequently, both Model S and Model X gained further market share in the US luxury vehicle market. In addition, our used vehicle sales more than doubled from the prior quarter.
Model S and X combined net orders in Q3 also hit an all-time record in our North American, European and Asian markets individually, driven primarily by increased awareness of Tesla from the Model 3 launch and the addition of new stores internationally. |
50-Stall Supercharger Station in Shanghai |

We continue to update our Autopilot software and recently made significant improvements to the Autosteer function. The Tesla AI team, which is fundamental to achieving full autonomy, strengthened dramatically this year, with a number of the world’s best AI engineers and researchers joining our company. We plan to continue building Tesla AI until it is one of the best teams in the world, not just in automotive, where Tesla is already the leader, but across all industries. This applies to both software and hardware.
Now that the foundation of the Tesla vision neural net is right, which was an exceptionally difficult problem, as it must fit into far less computing power than is typically used, we expect a rapid rollout of additional functionality over the next several months and are progressing rapidly towards our goal of a coast-to-coast drive with no one touching the controls.
During Q3, we opened 18 new store and service locations for a total of 318 locations globally. The number of service locations increased by 6% in Q3, while we managed to increase our technician capacity by 10% per service center. Our mobile service fleet has expanded to 160 service units in Q3, and we are expecting this number to almost double by the end of this year. Reaction to both the speed and convenience of our mobile service has been very positive, with customer satisfaction for this offering at nearly 100% during the quarter.
We added 126 new Supercharger stations in Q3, for a total of more than 1,000 stations and over 7,000 Supercharging connectors worldwide. Our network of destination chargers is even larger. At the end of the quarter, there were 7,200 destination charger locations worldwide, which increased the availability of destination charging for our customers by nearly 18% in one quarter. We recently opened a Supercharger station with 50 connectors in Shanghai, China. Such high-density stations will become more common in other high traffic areas in the future. We also introduced new Superchargers for parking garages and city centers. Superchargers in city centers are more compact, easier to install, and have a high charging rate of 72 kW. This is helping us to accelerate and scale Supercharging availability for our customers, in line with the expected growth of our fleet.
ADVANCING SUSTAINABLE ENERGY
Deployment of the 100 MW / 129 MWh energy storage project for South Australia is underway, and we are well on track to meet our 100-day deadline. Energy storage enables a more efficient, cost-effective and sustainable way to build and manage utility grid scale applications, and we expect this project to lay the groundwork for many similar projects, but at an even larger scale, in the years ahead.
|
South Australia Energy Storage Project
|
In the aftermath of Hurricane Maria, the island of Puerto Rico was left largely without electricity. In response, we have sent solar panels, Powerpacks and hundreds of Powerwall energy storage systems to Puerto Rico. We are also actively working with various organizations to offer Tesla’s energy generation and storage solutions that are cost effective and can provide long-term distributed energy to the island.
We are also continuing to expand the presence of solar and storage product placement in our stores and service centers. As a result of these efforts, we are seeing a growing number of Tesla vehicle customers also purchasing our energy generation and storage systems, which validates our strategy to cross-sell these products.
In Q3, we deployed 110 MWh of energy storage systems, growing 12% from the prior quarter and increasing 138% year-over-year, driven mainly by increased Powerwall deliveries. To date, we have also installed more than 80% of the Powerpacks for the South Australia project; however, revenue will not be recognized until full deployment of the project. |

We also deployed 109 MW of energy generation systems in Q3. The lower deployments are in large part a result of deliberately deemphasizing commercial and industrial solar energy projects with low profit and limited cash generation. Approximately 46% of the residential solar energy systems deployed in Q3 were sold, rather than leased, up from 13% in Q3 2016, a continuing trend that drives revenue growth and improves cash generation. We are expecting cash sales to surpass 50% of residential solar revenue in Q4. Solar Roof installations will initially ramp slowly in Q4 as we move the production process from Fremont to Gigafactory 2 in Buffalo. As we fine tune and standardize the production and installation process, we expect to ramp Solar Roof production considerably in 2018.
Revenue & Gross Margin
|
|
Three Months Ended |
|
|
Change |
|
|||||||||||||
|
|
September 30, |
|
|
June 30, |
|
|
September 30, |
|
|
|
|
|
|
|
|
|||
|
|
2017 |
|
|
2017 |
|
|
2016 |
|
|
QoQ |
|
YoY |
|
|||||
|
Automotive revenue ($000) |
$ |
2,362,889 |
|
|
$ |
2,286,616 |
|
|
$ |
2,148,727 |
|
|
|
3 |
% |
|
10 |
% |
|
Automotive gross margin – GAAP |
|
18.3 |
% |
|
|
27.9 |
% |
|
|
29.4 |
% |
|
|
-964 |
bp |
|
-1,111 |
bp |
|
Automotive gross margin excluding SBC and ZEV credit - Non-GAAP |
|
18.7 |
% |
|
|
25.0 |
% |
|
|
25.0 |
% |
|
|
-628 |
bp |
|
-628 |
bp |
|
• |
Automotive revenue grew 10% as compared to Q3 2016 mainly due to a 4.5% increase in Model S and Model X volumes. ZEV credit sales were less than $1 million in Q3 as compared to $100 million in Q2 and $139 million in Q3 last year. |
|
• |
Approximately 21% of Q3 deliveries were subject to lease accounting, which is roughly consistent with Q2. Initially for Model 3, we will not be offering a lease financing option, which will result in upfront revenue recognition of the vehicle and improved cash flows from Model 3 deliveries. |
|
• |
Non-GAAP automotive gross margin temporarily declined to 18.7%, which was in line with our expectations. The gross margin declined primarily because of a significant increase in Model 3 manufacturing costs to support the limited initial level of production. |
|
• |
Model S and Model X gross margin declined from Q2 primarily due to one-time price adjustments for discontinued trims and unfavorable trim mix. Numerous actions to improve Model S and Model X gross margin are underway. Consequently, we expect Model S and Model X gross margin to improve in upcoming quarters. |
|
|
Three Months Ended |
|
|
Change |
|
|||||||||||||
|
September 30, |
|
|
June 30, |
|
|
September 30, |
|
|
|
|
|
|
|
|
||||
|
|
2017 |
|
|
2017 |
|
|
2016 |
|
|
QoQ |
|
YoY |
|
|||||
|
Energy generation and storage revenue ($000) |
$ |
317,505 |
|
|
$ |
286,780 |
|
|
$ |
23,334 |
|
|
|
11 |
% |
|
1261 |
% |
|
Energy generation and storage gross margin |
|
25.3 |
% |
|
|
28.9 |
% |
|
|
-4.1 |
% |
|
|
-368 |
bp |
|
2,932 |
bp |
|
• |
Energy generation and storage revenue increased 11% in Q3 compared to Q2 2017 as energy storage sales continue to accelerate. |
|
• |
Gross margin was 25.3%, as compared to 28.9% in Q2 2017, due to energy storage products becoming a larger mix of revenue. Energy generation and storage gross margin should decline in Q4 mainly due to seasonality of generation by solar assets as well as increasing mix of energy storage sales. As Gigafactory 1 continues to increase production, gross margin of energy storage products should continue to improve due to better capacity utilization and additional manufacturing cost reductions. |
Other Highlights
|
• |
Service and Other revenue increased predominantly due to strong growth in used car sales. We expect Service and Other revenue to increase further in Q4. |
|
• |
Service and Other gross loss increased slightly to $63 million, driven largely by an expansion of our service network in preparation for a rapid expansion of our fleet of vehicles. Service and Other losses are expected to reduce substantially in each subsequent coming quarter as our fleet grows and service centers become more utilized. Gross profit from used car sales was approximately break-even in Q3. |
|
• |
Our GAAP operating expenses increased sequentially by 8% compared to Q2, primarily due to higher selling expenses in preparation for large increases in vehicle deliveries, expenses associated with record net orders, and one-time expenses of about $30 million. |
|
• |
Customer deposits grew 14% sequentially in Q3, driven primarily by higher demand for Model S, Model X, and Model 3. |
|
• |
Shares outstanding as of September 30, 2017 were approximately 168 million. Fully diluted share count as of September 30, 2017 was approximately 179 million. |
Cash Flow and Liquidity
|
|
Three Months Ended |
|
|
Change |
|
|||||||||||||
|
September 30, |
|
|
June 30, |
|
|
September 30, |
|
|
|
|
|
|
|
|
||||
|
($000) |
2017 |
|
|
2017 |
|
|
2016 |
|
|
QoQ |
|
YoY |
|
|||||
|
Cash flows (used in) provided by operating activities |
$ |
(300,562 |
) |
|
$ |
(200,172 |
) |
|
$ |
423,649 |
|
|
|
-50 |
% |
|
-171 |
% |
|
Collateralized lease borrowing |
|
80,752 |
|
|
|
149,320 |
|
|
|
173,144 |
|
|
|
-46 |
% |
|
-53 |
% |
|
Operating cash flows plus collateralized lease borrowing |
$ |
(219,810 |
) |
|
$ |
(50,852 |
) |
|
$ |
596,793 |
|
|
|
-332 |
% |
|
-137 |
% |
|
• |
Cash outflow from operating activities during Q3 benefited from the management of working capital. Lower inventory of new and used vehicles and higher customer deposits improved working capital, with a partial offset due to higher accounts receivables. |
|
• |
In August, we completed the issuance of $1.8 billion of Senior Notes due 2025 at an interest rate of 5.3%. We also used cash to terminate a revolving credit facility by repaying the outstanding balance of $325 million. At the end of Q3, our gross cash balance increased to $3.5 billion. |
|
• |
Capital expenditures were $1.1 billion in Q3. The majority of capital expenditures were attributable to Model 3 and Gigafactory 1 production capacity increases. |
OUTLOOK
Based on the recent acceleration in order growth, we now expect that Model S and Model X are on pace for about 100,000 deliveries in 2017, an increase of 30% compared to 2016. Notwithstanding these increased deliveries, we plan to produce about 10% fewer Model S and Model X in Q4 compared to Q3 because of the reallocation of some of the manufacturing workforce towards Model 3 production. As a result, inventory level of finished Model S and X vehicles should continue to decline.
We expect Model 3 non-GAAP gross margin to reach breakeven by end of Q4, because of increased capacity utilization, and it should improve rapidly in 2018 to our target of 25%. Our recent production challenges may affect short-term costs, but they have no impact on our 25% gross margin target, since there has been no change to our projections for material, labor and overhead costs per vehicle.
Due to a higher mix of temporarily lower margin Model 3 deliveries in Q4 compared to Q3, we expect non-GAAP automotive gross margin to temporarily decline slightly in Q4 to about 15% and then recover starting in Q1. Gross profit is expected to grow more than operating costs in Q4 compared to Q3, while operating costs are expected to be flat to up slightly in Q4. Between cash on hand, future cash flows and available lines of credit, we believe that we are well capitalized to accommodate the revised ramp of Model 3 production to 5,000 per week. Upon achieving this production level, we expect to generate significant cash flows from operating activities.
Capital expenditures are expected to be approximately $1 billion in Q4, driven largely by milestone payments on Model 3 production equipment, as well as Gigafactory 1, and further expansion of stores, service centers, delivery hubs and the Supercharger network.
Model 3 represents a significant milestone in the coming of age of electric vehicles. We aspire to transform other segments of the automotive market in the future. At the unveiling of the Tesla Semi on November 16, 2017, we will demonstrate just how compelling electric drive will be for the global trucking industry. We look forward to showing you something truly incredible.
Deepak Ahuja, Chief Financial Officer
Elon Musk, Chairman & CEO
Tesla will provide a live webcast of its third quarter 2017 financial results conference call beginning at 2:30 p.m. PT on November 1, 2017, at ir.tesla.com. This webcast will also be available for replay for approximately one year thereafter.
NON-GAAP FINANCIAL INFORMATION
Consolidated financial information has been presented in accordance with GAAP as well as on a non-GAAP basis to supplement our consolidated financial results. Our non-GAAP financial measures include non-GAAP gross margin, non-GAAP net income (loss) attributable to common stockholders, non-GAAP net income (loss) attributable to common stockholders on a per share basis, and operating cash flows plus change in collateralized lease borrowing. Management believes that it is useful to supplement its GAAP financial statements with this non-GAAP information because management uses such information internally for its operating, budgeting and financial planning purposes. These non-GAAP financial measures also facilitate management’s internal comparisons to Tesla’s historical performance as well as comparisons to the operating results of other companies. Management also believes that presentation of the non-GAAP financial measures provides useful information to our investors regarding our financial condition and results of operations because it allows investors greater transparency to the information used by Tesla management in its financial and operational decision-making so that investors can see through the eyes of Tesla management regarding important financial metrics that Tesla management uses to run the business as well as allows investors to better understand Tesla’s performance. Non-GAAP information is not prepared under a comprehensive set of accounting rules and therefore, should only be read in conjunction with financial information reported under U.S. GAAP when understanding Tesla’s operating performance. A reconciliation between GAAP and non-GAAP financial information is provided below.
FORWARD-LOOKING STATEMENTS
Certain statements in this shareholder letter, including statements in the “Outlook” section; statements relating to the progress Tesla is making with respect to product and software development, such as Model 3, Solar Roof and Autopilot; statements regarding growth in the number of Tesla store, service center, delivery hub, Supercharger and destination charger locations and in other service and repair capabilities; statements relating to the production, production rate and delivery timing of products such as Model 3 and Solar Roof and completion of energy generation and storage projects; statements regarding growth of our energy business and means to achieve such growth; growth in demand and orders for Tesla products and the catalysts for that growth; the ability to achieve product demand, volume, production, delivery, inventory, deployment, revenue, cash generation, cash flow, leasing, gross margin, spending, capital expenditure and profitability targets; productivity improvements and capacity expansion plans, such as for Gigafactory 1; and statements regarding Gigafactory 1 and Gigafactory 2 timing, plans and output expectations, including those related to battery and photovoltaic cell and other production, are “forward-looking statements” that are subject to risks and uncertainties. These forward-looking statements are based on management’s current expectations, and as a result of certain risks and uncertainties, actual results may differ materially from those projected. The following important factors, without limitation, could cause actual results to differ materially from those in the forward-looking statements: the risk of delays in the manufacture, production, delivery and/or completion of our vehicles and energy products, particularly Model 3; the ability to design and achieve and grow simultaneous and separate market acceptance of Model S, Model X and their variants, as well as new vehicle models, specifically Model 3; the ability of suppliers to meet quality and part delivery expectations at increasing volumes, especially with respect to Model 3 parts; adverse foreign exchange movements; any failures by Tesla products to perform as expected or if product recalls occur; Tesla’s ability to continue to reduce or control manufacturing and other costs; consumers’ willingness to adopt electric vehicles; competition in the automotive and energy product markets generally and the alternative fuel vehicle market and the premium sedan, premium SUV and small to medium-sized sedan markets in particular; Tesla’s ability to establish, maintain and strengthen the Tesla brand; Tesla’s ability to manage future growth effectively as we rapidly grow, especially internationally; the unavailability, reduction or elimination of government and economic incentives for electric vehicles and energy products; Tesla’s ability to establish, maintain and strengthen its relationships with strategic partners such as Panasonic; potential difficulties in finalizing, performing and realizing potential benefits under definitive agreements for Gigafactory 1 and Gigafactory 2, maintaining Gigafactory 1 and Gigafactory 2 implementation schedules, output and cost estimates; and Tesla’s ability to execute on its strategy for new store, delivery hub, service center, Supercharger and other locations and capabilities. More information on potential factors that could affect our financial results is included from time to time in our Securities and Exchange Commission filings and reports, including the risks identified under the section captioned “Risk Factors” in our quarterly report on Form 10-Q filed with the SEC on August 4, 2017. Tesla disclaims any obligation to update information contained in these forward-looking statements whether as a result of new information, future events, or otherwise.
|
Investor Relations Contact: Jeff Evanson Investor Relations ir@tesla.com |
|
|
|
Press Contact: Dave Arnold Communications press@tesla.com
|
Condensed Consolidated Statements of Operations
(Unaudited)
(In thousands, except per share data)
|
|
Three Months Ended |
|
|
Nine Months Ended |
|
||||||||||||||
|
|
September 30, |
|
|
June 30 |
|
|
September 30, |
|
|
September 30, |
|
|
September 30, |
|
|||||
|
|
2017 |
|
|
2017 |
|
|
2016 |
|
|
2017 |
|
|
2016 |
|
|||||
|
Revenues |
|
|
|
|
|
|
|
|
|
|
|
|
|
|
|
|
|
|
|
|
Automotive sales |
$ |
2,076,731 |
|
|
$ |
2,013,852 |
|
|
$ |
1,917,442 |
|
|
$ |
6,125,643 |
|
|
$ |
3,849,558 |
|
|
Automotive leasing |
|
286,158 |
|
|
|
272,764 |
|
|
|
231,285 |
|
|
|
813,462 |
|
|
|
507,085 |
|
|
Total automotive revenue |
|
2,362,889 |
|
|
|
2,286,616 |
|
|
|
2,148,727 |
|
|
|
6,939,105 |
|
|
|
4,356,643 |
|
|
Energy generation and storage |
|
317,505 |
|
|
|
286,780 |
|
|
|
23,334 |
|
|
|
818,229 |
|
|
|
50,009 |
|
|
Services and other |
|
304,281 |
|
|
|
216,161 |
|
|
|
126,375 |
|
|
|
713,168 |
|
|
|
308,849 |
|
|
Total revenues |
|
2,984,675 |
|
|
|
2,789,557 |
|
|
|
2,298,436 |
|
|
|
8,470,502 |
|
|
|
4,715,501 |
|
|
Cost of revenues |
|
|
|
|
|
|
|
|
|
|
|
|
|
|
|
|
|
|
|
|
Automotive sales |
|
1,755,622 |
|
|
|
1,472,578 |
|
|
|
1,355,102 |
|
|
|
4,724,849 |
|
|
|
2,895,483 |
|
|
Automotive leasing |
|
175,224 |
|
|
|
175,433 |
|
|
|
161,959 |
|
|
|
516,683 |
|
|
|
310,176 |
|
|
Total automotive cost of revenues |
|
1,930,846 |
|
|
|
1,648,011 |
|
|
|
1,517,061 |
|
|
|
5,241,532 |
|
|
|
3,205,659 |
|
|
Energy generation and storage |
|
237,288 |
|
|
|
203,762 |
|
|
|
24,281 |
|
|
|
592,823 |
|
|
|
50,553 |
|
|
Services and other |
|
367,401 |
|
|
|
271,169 |
|
|
|
120,359 |
|
|
|
852,446 |
|
|
|
295,310 |
|
|
Total cost of revenues (1) |
|
2,535,535 |
|
|
|
2,122,942 |
|
|
|
1,661,701 |
|
|
|
6,686,801 |
|
|
|
3,551,522 |
|
|
Gross profit |
|
449,140 |
|
|
|
666,615 |
|
|
|
636,735 |
|
|
|
1,783,701 |
|
|
|
1,163,979 |
|
|
Operating expenses |
|
|
|
|
|
|
|
|
|
|
|
|
|
|
|
|
|
|
|
|
Research and development (1) |
|
331,622 |
|
|
|
369,774 |
|
|
|
214,302 |
|
|
|
1,023,436 |
|
|
|
588,448 |
|
|
Selling, general and administrative (1) |
|
652,998 |
|
|
|
537,757 |
|
|
|
336,811 |
|
|
|
1,794,210 |
|
|
|
976,173 |
|
|
Total operating expenses |
|
984,620 |
|
|
|
907,531 |
|
|
|
551,113 |
|
|
|
2,817,646 |
|
|
|
1,564,621 |
|
|
(Loss) income from operations |
|
(535,480 |
) |
|
|
(240,916 |
) |
|
|
85,622 |
|
|
|
(1,033,945 |
) |
|
|
(400,642 |
) |
|
Interest income |
|
5,531 |
|
|
|
4,785 |
|
|
|
2,858 |
|
|
|
13,406 |
|
|
|
6,351 |
|
|
Interest expense (2)(3) |
|
(117,109 |
) |
|
|
(108,441 |
) |
|
|
(46,713 |
) |
|
|
(324,896 |
) |
|
|
(133,706 |
) |
|
Other (expense) income, net |
|
(24,390 |
) |
|
|
(41,208 |
) |
|
|
(11,756 |
) |
|
|
(83,696 |
) |
|
|
(9,952 |
) |
|
(Loss) income before income taxes |
|
(671,448 |
) |
|
|
(385,780 |
) |
|
|
30,011 |
|
|
|
(1,429,131 |
) |
|
|
(537,949 |
) |
|
Provision for income taxes |
|
(285 |
) |
|
|
15,647 |
|
|
|
8,133 |
|
|
|
40,640 |
|
|
|
15,628 |
|
|
Net (loss) income |
|
(671,163 |
) |
|
|
(401,427 |
) |
|
|
21,878 |
|
|
|
(1,469,771 |
) |
|
|
(553,577 |
) |
|
Net loss attributable to noncontrolling interests and redeemable noncontrolling interests |
|
(51,787 |
) |
|
|
(65,030 |
) |
|
|
— |
|
|
|
(183,721 |
) |
|
|
— |
|
|
Net (loss) income attributable to common Stockholders |
$ |
(619,376 |
) |
|
$ |
(336,397 |
) |
|
$ |
21,878 |
|
|
$ |
(1,286,050 |
) |
|
$ |
(553,577 |
) |
|
Net (loss) income per share of common stock attributable to common stockholders |
|
|
|
|
|
|
|
|
|
|
|
|
|
|
|
|
|
|
|
|
Basic |
$ |
(3.70 |
) |
|
$ |
(2.04 |
) |
|
$ |
0.15 |
|
|
$ |
(7.80 |
) |
|
$ |
(3.94 |
) |
|
Diluted |
$ |
(3.70 |
) |
|
$ |
(2.04 |
) |
|
$ |
0.14 |
|
|
$ |
(7.80 |
) |
|
$ |
(3.94 |
) |
|
Weighted average shares used in computing net income (loss) per share of common stock |
|
|
|
|
|
|
|
|
|
|
|
|
|
|
|
|
|
|
|
|
Basic |
|
167,294 |
|
|
|
165,212 |
|
|
|
148,991 |
|
|
|
164,897 |
|
|
|
140,581 |
|
|
Diluted |
|
167,294 |
|
|
|
165,212 |
|
|
|
156,935 |
|
|
|
164,897 |
|
|
|
140,581 |
|
|
Notes: |
|
|
|
|
|
|
|
|
|
|
|
|
|
|
|
|
|
|
|
|
(1) Includes stock-based compensation expense of the following for the periods presented: |
|
|
|
|
|
|
|
|
|
|
|
|
|
|
|
|
|
|
|
|
Cost of revenue |
$ |
10,166 |
|
|
$ |
7,466 |
|
|
$ |
8,939 |
|
|
$ |
27,663 |
|
|
$ |
21,837 |
|
|
Research and development |
|
51,066 |
|
|
|
57,794 |
|
|
|
40,220 |
|
|
|
158,052 |
|
|
|
113,328 |
|
|
Selling, general and administrative |
|
51,421 |
|
|
|
50,782 |
|
|
|
40,384 |
|
|
|
146,697 |
|
|
|
111,347 |
|
|
Total stock-based compensation expense |
$ |
112,653 |
|
|
$ |
116,042 |
|
|
$ |
89,543 |
|
|
$ |
332,412 |
|
|
$ |
246,512 |
|
|
|
|
|
|
|
|
|
|
|
|
|
|
|
|
|
|
|
|
|
|
|
(2) Interest expense includes non-cash interest expense related to convertible notes and other borrowing for the periods presented: |
$ |
62,731 |
|
|
$ |
65,682 |
|
|
$ |
33,100 |
|
|
$ |
179,609 |
|
|
$ |
93,900 |
|
|
|
|
|
|
|
|
|
|
|
|
|
|
|
|
|
|
|
|
|
|
|
(3) Interest expense includes the following as a result of the assumed debt from SolarCity: |
|
|
|
|
|
|
|
|
|
|
|
|
|
|
|
|
|
|
|
|
Interest expense (excluding amortization of debt discount and fees) - recourse debt |
$ |
8,943 |
|
|
$ |
12,093 |
|
|
$ |
— |
|
|
$ |
33,219 |
|
|
$ |
— |
|
|
Interest expense (excluding amortization of debt discount and fees) - non-recourse debt |
|
24,508 |
|
|
|
23,694 |
|
|
|
— |
|
|
|
72,286 |
|
|
|
— |
|
|
|
$ |
33,451 |
|
|
$ |
35,787 |
|
|
$ |
— |
|
|
$ |
105,505 |
|
|
$ |
— |
|
Condensed Consolidated Balance Sheets
(Unaudited)
(In thousands)
|
|
|
September 30, |
|
|
December 31, |
|
||
|
|
|
2017 |
|
|
2016 |
|
||
|
Assets |
|
|
|
|
|
|
|
|
|
Current assets |
|
|
|
|
|
|
|
|
|
Cash and cash equivalents |
|
$ |
3,530,030 |
|
|
$ |
3,393,216 |
|
|
Restricted cash |
|
|
138,181 |
|
|
|
105,519 |
|
|
Accounts receivable, net |
|
|
607,734 |
|
|
|
499,142 |
|
|
Inventory |
|
|
2,471,382 |
|
|
|
2,067,454 |
|
|
Prepaid expenses and other current assets |
|
|
321,406 |
|
|
|
194,465 |
|
|
Total current assets |
|
|
7,068,733 |
|
|
|
6,259,796 |
|
|
Operating lease vehicles, net |
|
|
3,834,234 |
|
|
|
3,134,080 |
|
|
Solar energy systems, leased and to be leased, net |
|
|
6,287,965 |
|
|
|
5,919,880 |
|
|
Property, plant and equipment, net |
|
|
9,394,397 |
|
|
|
5,982,957 |
|
|
Goodwill and intangible assets, net |
|
|
417,474 |
|
|
|
376,145 |
|
|
MyPower customer notes receivable, net of current portion |
|
|
463,878 |
|
|
|
506,302 |
|
|
Restricted cash, net of current portion |
|
|
408,544 |
|
|
|
268,165 |
|
|
Other assets |
|
|
231,849 |
|
|
|
216,751 |
|
|
Total assets |
|
$ |
28,107,074 |
|
|
$ |
22,664,076 |
|
|
Liabilities and Equity |
|
|
|
|
|
|
|
|
|
Current liabilities |
|
|
|
|
|
|
|
|
|
Accounts payable |
|
$ |
2,385,778 |
|
|
$ |
1,860,341 |
|
|
Accrued liabilities and other |
|
|
1,477,784 |
|
|
|
1,210,028 |
|
|
Deferred revenue |
|
|
951,734 |
|
|
|
763,126 |
|
|
Resale value guarantees |
|
|
543,336 |
|
|
|
179,504 |
|
|
Customer deposits |
|
|
686,084 |
|
|
|
663,859 |
|
|
Current portion of long-term debt and capital leases (1) |
|
|
424,224 |
|
|
|
1,150,147 |
|
|
Total current liabilities |
|
|
6,468,940 |
|
|
|
5,827,005 |
|
|
Long-term debt and capital leases, net of current portion (1) |
|
|
9,584,197 |
|
|
|
5,969,500 |
|
|
Deferred revenue, net of current portion |
|
|
1,082,870 |
|
|
|
851,790 |
|
|
Resale value guarantees, net of current portion |
|
|
2,410,220 |
|
|
|
2,210,423 |
|
|
Other long-term liabilities |
|
|
2,382,830 |
|
|
|
1,891,449 |
|
|
Total liabilities |
|
|
21,929,057 |
|
|
|
16,750,167 |
|
|
Redeemable noncontrolling interests in subsidiaries |
|
|
402,943 |
|
|
|
367,039 |
|
|
Convertible senior notes (1)(2) |
|
|
357 |
|
|
|
8,784 |
|
|
Total stockholders' equity |
|
|
4,711,480 |
|
|
|
4,752,911 |
|
|
Noncontrolling interests in subsidiaries |
|
|
1,063,237 |
|
|
|
785,175 |
|
|
Total liabilities and equity |
|
$ |
28,107,074 |
|
|
$ |
22,664,076 |
|
|
|
|
|
|
|
|
|
|
|
|
(1) Breakdown of our debt is as follows: |
|
|
|
|
|
|
|
|
|
Recourse debt |
|
$ |
6,886,184 |
|
|
$ |
4,630,886 |
|
|
Non-recourse debt |
|
$ |
2,539,051 |
|
|
$ |
2,375,782 |
|
|
(2) |
Our common stock price exceeded the conversion threshold price of our convertible senior notes due 2018 (2018 Notes) issued in May 2013; therefore, the 2018 Notes are convertible at the holder’s option during the second quarter of 2017. As such, the carrying value of the 2018 Notes was classified as a current liability as of June 30, 2017 and the difference between the principal amount and the carrying value of the 2018 Notes was reflected as convertible debt in mezzanine equity on our condensed consolidated balance sheet as of June 30, 2017. |
Condensed Consolidated Statement of Cash Flows
(Unaudited)
(In thousands)
|
|
|
Three Months Ended |
|
|
Nine Months Ended |
|
||||||||||||||
|
|
|
September 30, |
|
|
June 30, |
|
|
September 30, |
|
|
September 30, |
|
|
September 30, |
|
|||||
|
|
|
2017 |
|
|
2017 |
|
|
2016 |
|
|
2017 |
|
|
2016 |
|
|||||
|
Cash Flows From Operating Activities |
|
|
|
|
|
|
|
|
|
|
|
|
|
|
|
|
|
|
|
|
|
Net (loss) income |
|
$ |
(671,163 |
) |
|
$ |
(401,427 |
) |
|
$ |
21,878 |
|
|
$ |
(1,469,771 |
) |
|
$ |
(553,577 |
) |
|
Adjustments to reconcile net (loss) income to net cash (used in) provided by operating activities: |
|
|
|
|
|
|
|
|
|
|
|
|
|
|
|
|
|
|
|
|
|
Depreciation and amortization |
|
|
400,624 |
|
|
|
389,171 |
|
|
|
280,468 |
|
|
|
1,166,397 |
|
|
|
620,160 |
|
|
Stock-based compensation |
|
|
112,653 |
|
|
|
116,042 |
|
|
|
89,543 |
|
|
|
332,412 |
|
|
|
246,512 |
|
|
Losses related to the SolarCity acquisition |
|
|
18,225 |
|
|
|
- |
|
|
|
- |
|
|
|
29,796 |
|
|
|
- |
|
|
Other |
|
|
88,867 |
|
|
|
177,135 |
|
|
|
67,481 |
|
|
|
364,262 |
|
|
|
158,551 |
|
|
Changes in operating assets and liabilities, net of effect of business combinations |
|
|
(249,768 |
) |
|
|
(481,093 |
) |
|
|
(35,721 |
) |
|
|
(993,641 |
) |
|
|
(147,266 |
) |
|
Net cash (used in) provided by operating activities |
|
|
(300,562 |
) |
|
|
(200,172 |
) |
|
|
423,649 |
|
|
|
(570,545 |
) |
|
|
324,380 |
|
|
Cash Flows From Investing Activities |
|
|
|
|
|
|
|
|
|
|
|
|
|
|
|
|
|
|
|
|
|
Capital expenditures |
|
|
(1,116,434 |
) |
|
|
(959,068 |
) |
|
|
(247,611 |
) |
|
|
(2,628,126 |
) |
|
|
(759,190 |
) |
|
Payments for the cost of solar energy systems, leased and to be leased |
|
|
(128,293 |
) |
|
|
(198,844 |
) |
|
|
- |
|
|
|
(547,085 |
) |
|
|
- |
|
|
Business combinations, net of cash acquired |
|
|
- |
|
|
|
- |
|
|
|
- |
|
|
|
(109,147 |
) |
|
|
- |
|
|
Maturities of short-term marketable securities |
|
|
- |
|
|
|
- |
|
|
|
- |
|
|
|
- |
|
|
|
16,667 |
|
|
Change in restricted cash and other |
|
|
(70,205 |
) |
|
|
(57,304 |
) |
|
|
(20,395 |
) |
|
|
(172,733 |
) |
|
|
(79,156 |
) |
|
Net cash used in investing activities |
|
|
(1,314,932 |
) |
|
|
(1,215,216 |
) |
|
|
(268,006 |
) |
|
|
(3,457,091 |
) |
|
|
(821,679 |
) |
|
Cash Flows From Financing Activities |
|
|
|
|
|
|
|
|
|
|
|
|
|
|
|
|
|
|
|
|
|
Net cash flows from debt activities |
|
|
1,898,696 |
|
|
|
(203,412 |
) |
|
|
(571,032 |
) |
|
|
2,553,831 |
|
|
|
(41,715 |
) |
|
Collateralized borrowing |
|
|
80,752 |
|
|
|
149,320 |
|
|
|
173,144 |
|
|
|
416,427 |
|
|
|
557,669 |
|
|
Net cash flows from noncontrolling interests |
|
|
41,643 |
|
|
|
381,253 |
|
|
|
- |
|
|
|
501,203 |
|
|
|
- |
|
|
Proceeds from issuance of common stock in public offerings, net of underwriting fees |
|
|
- |
|
|
|
- |
|
|
|
- |
|
|
|
400,175 |
|
|
|
1,701,734 |
|
|
Other |
|
|
80,415 |
|
|
|
101,606 |
|
|
|
77,018 |
|
|
|
257,386 |
|
|
|
153,461 |
|
|
Net cash provided by (used in) financing activities |
|
|
2,101,506 |
|
|
|
428,767 |
|
|
|
(320,870 |
) |
|
|
4,129,022 |
|
|
|
2,371,149 |
|
|
Effect of exchange rate changes on cash and cash equivalents |
|
|
8,094 |
|
|
|
15,952 |
|
|
|
3,183 |
|
|
|
35,428 |
|
|
|
13,499 |
|
|
Net increase (decrease) in cash and cash equivalents |
|
|
494,106 |
|
|
|
(970,669 |
) |
|
|
(162,044 |
) |
|
|
136,814 |
|
|
|
1,887,349 |
|
|
Cash and cash equivalents at beginning of period |
|
|
3,035,924 |
|
|
|
4,006,593 |
|
|
|
3,246,301 |
|
|
|
3,393,216 |
|
|
|
1,196,908 |
|
|
Cash and cash equivalents at end of period |
|
$ |
3,530,030 |
|
|
$ |
3,035,924 |
|
|
$ |
3,084,257 |
|
|
$ |
3,530,030 |
|
|
$ |
3,084,257 |
|
Supplemental Consolidated Financial Information
|
|
|
Three Months Ended |
|
|
Nine Months Ended |
|
||||||||||||||
|
|
|
September 30, |
|
|
June 30, |
|
|
September 30, |
|
|
September 30, |
|
|
September 30, |
|
|||||
|
Free Cash Flow ($000) |
|
2017 |
|
|
2017 |
|
|
2016 |
|
|
2017 |
|
|
2016 |
|
|||||
|
Cash flows (used in) provided by operating activities |
|
$ |
(300,562 |
) |
|
$ |
(200,172 |
) |
|
$ |
423,649 |
|
|
$ |
(570,545 |
) |
|
$ |
324,380 |
|
|
Capital expenditures |
|
|
(1,116,434 |
) |
|
|
(959,068 |
) |
|
|
(247,611 |
) |
|
|
(2,628,126 |
) |
|
|
(759,190 |
) |
|
Free cash flow |
|
$ |
(1,416,996 |
) |
|
$ |
(1,159,240 |
) |
|
$ |
176,038 |
|
|
$ |
(3,198,671 |
) |
|
$ |
(434,810 |
) |
Reconciliation of GAAP to Non-GAAP Financial Information
(Unaudited)
(In thousands, except per share data)
|
|
|
Three Months Ended |
|
|
Nine Months Ended |
|
||||||||||||||
|
|
|
September 30, |
|
|
June 30, |
|
|
September 30, |
|
|
September 30, |
|
|
September 30, |
|
|||||
|
|
|
2017 |
|
|
2017 |
|
|
2016 |
|
|
2017 |
|
|
2016 |
|
|||||
|
Automotive gross profit - GAAP |
|
$ |
432,043 |
|
|
$ |
638,605 |
|
|
$ |
631,666 |
|
|
$ |
1,697,573 |
|
|
$ |
1,150,984 |
|
|
Stock-based compensation expense |
|
|
10,166 |
|
|
|
7,466 |
|
|
|
8,939 |
|
|
|
27,663 |
|
|
|
21,837 |
|
|
ZEV credit revenue recognized |
|
|
(575 |
) |
|
|
(100,000 |
) |
|
|
(138,541 |
) |
|
|
(100,575 |
) |
|
|
(195,592 |
) |
|
Automotive gross profit excluding SBC and ZEV credit - Non-GAAP |
|
$ |
441,634 |
|
|
$ |
546,071 |
|
|
$ |
502,064 |
|
|
$ |
1,624,661 |
|
|
$ |
977,229 |
|
|
|
|
|
|
|
|
|
|
|
|
|
|
|
|
|
|
|
|
|
|
|
|
Automotive gross margin - GAAP |
|
|
18.3 |
% |
|
|
27.9 |
% |
|
|
29.4 |
% |
|
|
24.5 |
% |
|
|
26.4 |
% |
|
Stock-based compensation expense |
|
|
0.4 |
% |
|
|
0.3 |
% |
|
|
0.4 |
% |
|
|
0.4 |
% |
|
|
0.5 |
% |
|
ZEV credit revenue recognized |
|
|
0.0 |
% |
|
|
-3.3 |
% |
|
|
-4.8 |
% |
|
|
-1.1 |
% |
|
|
-3.4 |
% |
|
Automotive gross margin excluding SBC and ZEV credit - Non-GAAP |
|
|
18.7 |
% |
|
|
25.0 |
% |
|
|
25.0 |
% |
|
|
23.8 |
% |
|
|
23.5 |
% |
|
|
|
|
|
|
|
|
|
|
|
|
|
|
|
|
|
|
|
|
|
|
|
Net (loss) income attributable to common stockholders - GAAP |
|
$ |
(619,376 |
) |
|
$ |
(336,397 |
) |
|
$ |
21,878 |
|
|
$ |
(1,286,050 |
) |
|
$ |
(553,577 |
) |
|
Stock-based compensation expense |
|
|
112,653 |
|
|
|
116,042 |
|
|
|
89,543 |
|
|
|
332,412 |
|
|
|
246,512 |
|
|
Losses related to the SolarCity acquisition |
|
|
18,225 |
|
|
|
— |
|
|
|
— |
|
|
|
29,796 |
|
|
|
— |
|
|
Net (loss) income attributable to common stockholders - Non-GAAP |
|
$ |
(488,498 |
) |
|
$ |
(220,355 |
) |
|
$ |
111,421 |
|
|
$ |
(923,842 |
) |
|
$ |
(307,065 |
) |
|
|
|
|
|
|
|
|
|
|
|
|
|
|
|
|
|
|
|
|
|
|
|
Net (loss) income per share attributable to common stockholders, basic - GAAP |
|
$ |
(3.70 |
) |
|
$ |
(2.04 |
) |
|
$ |
0.15 |
|
|
$ |
(7.80 |
) |
|
$ |
(3.94 |
) |
|
Stock-based compensation expense |
|
|
0.67 |
|
|
|
0.71 |
|
|
|
0.60 |
|
|
|
2.02 |
|
|
|
1.76 |
|
|
Losses related to the SolarCity acquisition |
|
|
0.11 |
|
|
|
— |
|
|
|
— |
|
|
|
0.18 |
|
|
|
— |
|
|
Net (loss) income per share attributable to common stockholders, basic - Non-GAAP |
|
$ |
(2.92 |
) |
|
$ |
(1.33 |
) |
|
$ |
0.75 |
|
|
$ |
(5.60 |
) |
|
$ |
(2.18 |
) |
|
Shares used in per share calculation, basic - GAAP and Non-GAAP |
|
|
167,294 |
|
|
|
165,212 |
|
|
|
148,991 |
|
|
|
164,897 |
|
|
|
140,581 |
|
|
|
|
|
|
|
|
|
|
|
|
|
|
|
|
|
|
|
|
|
|
|
|
Net (loss) income per share attributable to common stockholders, diluted - GAAP |
|
$ |
(3.70 |
) |
|
$ |
(2.04 |
) |
|
$ |
0.14 |
|
|
$ |
(7.80 |
) |
|
$ |
(3.94 |
) |
|
Stock-based compensation expense |
|
|
0.67 |
|
|
|
0.71 |
|
|
|
0.57 |
|
|
|
2.02 |
|
|
|
1.76 |
|
|
Losses related to the SolarCity acquisition |
|
|
0.11 |
|
|
|
— |
|
|
|
— |
|
|
|
0.18 |
|
|
|
— |
|
|
Net (loss) income per share attributable to common stockholders, diluted - Non-GAAP |
|
$ |
(2.92 |
) |
|
$ |
(1.33 |
) |
|
$ |
0.71 |
|
|
$ |
(5.60 |
) |
|
$ |
(2.18 |
) |
|
Shares used in per share calculation, diluted - GAAP and Non-GAAP |
|
|
167,294 |
|
|
|
165,212 |
|
|
|
156,935 |
|
|
|
164,897 |
|
|
|
140,581 |
|