Attached files
| file | filename |
|---|---|
| 8-K - 8-K INVESTOR PRESENTATION - OCEANFIRST FINANCIAL CORP | ocfc8-kinvestorpresentatio.htm |
Investor Presentation
November 2017
OceanFirst Financial Corp.

OceanFirst Financial Corp.
Forward-Looking Statements
In addition to historical information, the Form 10-K contains certain forward-looking statements within the
meaning of the Private Securities Litigation Reform Act of 1995 which are based on certain assumptions and
describe future plans, strategies and expectations of the Company. These forward-looking statements are
generally identified by use of the words “believe”, “expect”, “intend”, “anticipate”, “estimate”, “project”, “will”,
“should”, “may”, “view”, “opportunity”, “potential”, or similar expressions or expressions of confidence. The
Company’s ability to predict results or the actual effect of plans or strategies is inherently uncertain. Factors
which could have a material adverse effect on the operations of the Company and its subsidiaries include, but
are not limited to, those items discussed under Item 1A. Risk Factors herein and the following: changes in
interest rates, general economic conditions, levels of unemployment in the Bank’s lending area, real estate
market values in the Bank’s lending area, future natural disasters and increases to flood insurance premiums,
the level of prepayments on loans and mortgage-backed securities, legislative/regulatory changes, monetary
and fiscal policies of the U.S. Government including policies of the U.S. Treasury and the FRB, the quality or
composition of the loan or investment portfolios, demand for loan products, deposit flows, competition, demand
for financial services in the Company’s market area, accounting principles and guidelines and the Bank's ability
to successfully integrate acquired operations. These risks and uncertainties should be considered in evaluating
forward-looking statements and undue reliance should not be placed on such statements. These risks and
uncertainties are further discussed in the Company’s Annual Report on Form 10-K for the year ended
December 31, 2016 and subsequent securities filings and should be considered in evaluating forward-looking
statements and undue reliance should not be placed on such statements. The Company does not undertake,
and specifically disclaims any obligation, to publicly release the result of any revisions which may be made to
any forward-looking statements to reflect events or circumstances after the date of such statements or to
reflect the occurrence of anticipated or unanticipated events.
2

OceanFirst Milestones – 115 Years of Growth
3
Founded,
Point Pleasant,
NJ
Branch Expansion
Into
Middlesex County
1902
1985
IPO To
Mutual
Depositors
1996
Established
Commercial
Lending
Created OceanFirst
Foundation
Branch Expansion
Into
Monmouth County
1999
Established
Trust and
Asset Management
2014 2015
Colonial American
Bank Acquired
Cape Bancorp
Acquired
2016
OceanFirst
Foundation Exceeds
$25 Million In
Cumulative Grants
Ocean Shore
Holding Co.
Acquired
2000
Commercial LPO
Expansion into
Mercer County
Announced Merger
Agreement with
Sun Bancorp, Inc.
2017

Serving Central and Southern New Jersey Markets
• OceanFirst is the largest Bank
headquartered in Central and
Southern New Jersey
• $5.4 billion in assets
• Branches located in 7 counties
• Market Cap $904 million
• Average Daily Share Volume of
117,000
OceanFirst Headquarters
OceanFirst Retail Branches,
Commercial Loan Production Offices,
and Wealth Management Office
30 million people, or approximately
10% of the total U.S. population,
reside within a 2-hour drive* and
7.3 million reside in market area**
4
*Includes New York – Newark NY-NJ-PA-CT CSA and
Philadelphia – Reading – Camden CSA.
**Refer to Appendix 2 for market area.

5
Atlantic City loan portfolio exposure totals
1.0% of total loans
OceanFirst Loan Portfolio Diversification by Geography
Least
Concentrated
Most
Concentrated
Opportunity for organic commercial loan
growth

Experienced Leadership
Name
Position
# of Years
at OCFC
# of Years
In Banking
Previous
Experience
Christopher D. Maher Chairman, President, Chief Executive Officer 4 29 Patriot National Bancorp; Dime Community Bancshares
Michael J. Fitzpatrick Executive Vice President, Chief Financial Officer 25 36 KPMG
Joseph R. Iantosca Executive Vice President, Chief Administrative Officer 13 39 BISYS Banking Solutions; Newtrend LLC; Brooklyn Federal Savings
Joseph J. Lebel III Executive Vice President, Chief Banking Officer 11 33
Wachovia Bank N.A.;
First Fidelity
Steven J. Tsimbinos Executive Vice President, General Counsel 7 23
Thacher Proffit & Wood;
Lowenstein Sandler PC
Grace M. Vallacchi Executive Vice President, Chief Risk Officer - 25 Office of the Comptroller of the Currency; First Fidelity; First Union
• Substantial insider ownership of 15.3% – aligned with shareholders’ interests
OceanFirst Bank ESOP 4.6%
Directors & Senior Executive Officers 6.7%
Director and Proxy Officer Stock Ownership Guidelines
OceanFirst Foundation 4.0%
From April 28, 2017 Proxy Statement and SEC Schedule 13G filings.
6

Deep Bench of Experienced Executives
Name
Position
# of Years
at OCFC
# of Years
In Banking
Previous
Experience
Gary S. Hett First Senior Vice President, Director of Human Resources 4 44
Patriot National
Bancorp;
Dime Community
Bancshares
David R. Howard First Senior Vice President, Direct Banking 4 27
Guggenheim
Partners;
GE Capital
Angela K. Ho Senior Vice President, Principal Accounting Officer 1 11
Northfield Bank;
Signature Bank;
KPMG
Michael C. Reda Senior Vice President, Chief Information Officer - 30
Patriot National
Bancorp;
Fidelity
7
Strategic Focus
8
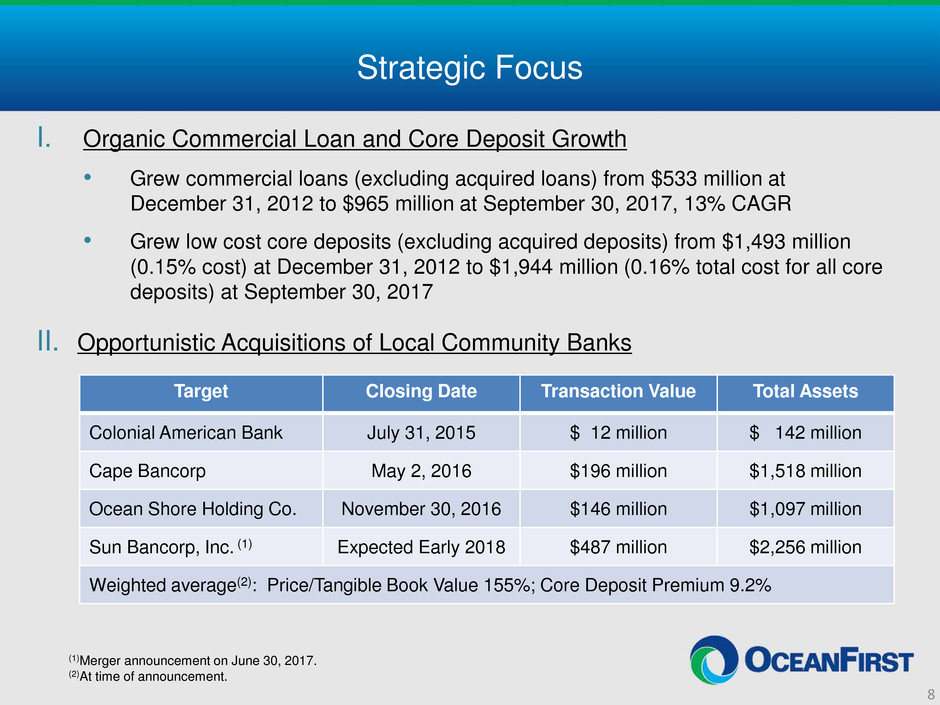
I. Organic Commercial Loan and Core Deposit Growth
• Grew commercial loans (excluding acquired loans) from $533 million at
December 31, 2012 to $965 million at September 30, 2017, 13% CAGR
• Grew low cost core deposits (excluding acquired deposits) from $1,493 million
(0.15% cost) at December 31, 2012 to $1,944 million (0.16% total cost for all core
deposits) at September 30, 2017
II. Opportunistic Acquisitions of Local Community Banks
Target Closing Date Transaction Value Total Assets
Colonial American Bank July 31, 2015 $ 12 million $ 142 million
Cape Bancorp May 2, 2016 $196 million $1,518 million
Ocean Shore Holding Co. November 30, 2016 $146 million $1,097 million
Sun Bancorp, Inc. (1) Expected Early 2018 $487 million $2,256 million
Weighted average(2): Price/Tangible Book Value 155%; Core Deposit Premium 9.2%
(1)Merger announcement on June 30, 2017.
(2)At time of announcement.

Strategic Focus (Continued)
9
III. Conservative Risk Management
• Credit Risk
Reduced non-performing loans from $43.4 million (2.8% of loans) at December 31, 2012 to
$15.1 million (0.39% of loans) at September 30, 2017
Strong credit culture – experienced and independent credit administration, resulting in nominal
loss history (Net charge-offs over prior four full years averaged 10.5 basis points excluding
charge-offs from bulk loan sales)
• Interest Rate Risk
Core deposits (all deposits except time deposits) are 85.7% of total deposits at September 30,
2017
Grew core deposits (excluding acquisitions) by $185.7 million in 2017, or 7.0% annualized, and
by $170 million in 2016, or 10.2%
• Regulatory/Compliance Risk
Regulatory approvals received for three acquisitions in a timely manner
Outstanding CRA rating received October 2015
Total Shareholder Return December 31, 2012 to September 30, 2017 –
129%, 19.0% CAGR

Strategic Focus (Continued)
10
IV. Direct Banking Initiative
• Current suite of digital offerings is at top of market for community banks
Website Apple Pay Finance Works
Online Banking Platform U Choose Rewards Online Account Opening
Mobile Application Pop Money Biometric ID Verification
Bill Pay Text Banking Card Valet
• Focused effort to transform customer usage to efficient channels
Enhancing branch staff training and goals specific to digital capabilities
One-on-one training and videos with customers on mobile and online tools
Upgrading account opening capabilities will enable staff outside the physical branch
Expanding use of video tellers to support in-person transactions in a more efficient manner
than traditionally staffed branches
Ensuring our digital capabilities remain top of market and meet customer expectations
• Increased digital usage will result in increased efficiency and customer retention
Especially important with acquisitions, conversions, and branch consolidations
Seamless customer experience will reinforce established OceanFirst brand
Strategic Focus (Continued)
11
V. Transition of Branch Service Area Model
• Currently 46 branches with an average branch size of $95MM
• Consolidated 15 branches in 2017
Customer retention is above expectations
• Target average branch size >$100MM
• Will continue to place non-branch electronic service facilities in strategic locations
that would not support a fully-staffed branch
• Significant expense savings realized from these 15 branches with approximately
25% to be deployed in direct banking and commercial initiatives

Highlights – 2017
12
Third Quarter
• Core EPS of $0.45(1), an increase from $0.40(1) in Q3 2016
13.63% ROTE(1)(2) & 1.11% ROA(1)(2)
Net interest margin of 3.50%
• Deposits increased $173.4 million reducing the loan to deposit ratio to
89.0%, while the cost of deposits increased only one basis point to 0.29% at
September 30, 2017
• Asset quality improved as non-performing loans decreased to $15.1 million,
or 0.39% as a percentage of total loans
• The pending Sun Bancorp, Inc. (NASDAQ: SNBC) acquisition announced on
June 30, 2017, valued at approximately $487 million, has received
shareholder approvals and regulatory approval from the Federal Reserve
Bank of Philadelphia. Pending regulatory approval from the Office of the
Comptroller of the Currency, the Company expects to close the transaction in
January 2018
(1)Amounts and ratios exclude merger related and branch consolidation expenses, net of tax.
(2)Amounts are annualized.

Valued at approximately $487 million – 85% stock,
15% cash
• Price/TBV – 169% [156% net of DTA]
• Core deposit premium – 12.7%
Financially compelling:
• 2019E EPS accretion of 3.6% in addition to double
digit accretion from Cape and Ocean Shore
acquisitions
• Earnback of approximately 3.5 years
Overview of Sun Bancorp, Inc.
13
Branch Map Transaction Summary1
Financial Highlights2
Total Assets ($M) $2,168 ROAA 0.50%
Gross Loans ($M) $1,589 ROATCE 3.90%
Total Deposits ($M) $1,683 NIM 3.25%
TCE / TA 13.6% Yield on Loans 4.20%
Cash & Securities / Total Assets 16.9% Cost of Deposits 0.39%
NPAs / Total Assets3 0.19% Efficiency Ratio 77%
Source: SNL Financial.
1 As of June 30, 2017.
2 As of or for the quarter ended September 30, 2017.
3 NPAs defined as nonaccrual loans and leases and real estate owned, excluding renegotiated loans and leases, as of September 30, 2017.
SNBC has 15 branches
within 3 miles of an
OCFC branch
- OCFC Branches
- SNBC Branches
- Loan Office
Favorable Competitive Position
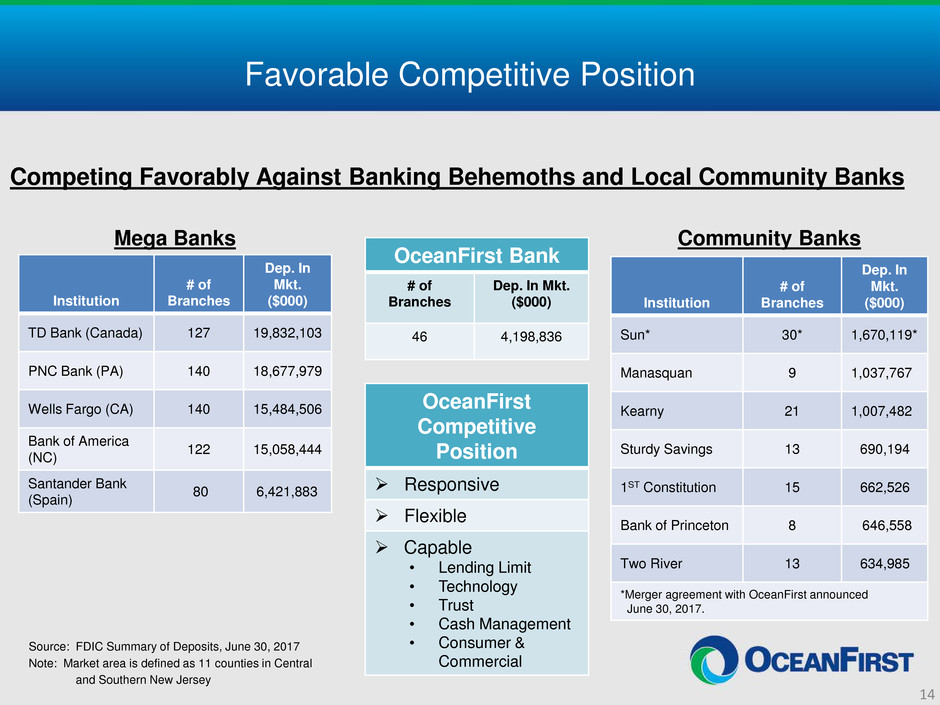
Competing Favorably Against Banking Behemoths and Local Community Banks
Source: FDIC Summary of Deposits, June 30, 2017
Note: Market area is defined as 11 counties in Central
and Southern New Jersey
Institution
# of
Branches
Dep. In
Mkt.
($000)
TD Bank (Canada) 127 19,832,103
PNC Bank (PA) 140 18,677,979
Wells Fargo (CA) 140 15,484,506
Bank of America
(NC) 122 15,058,444
Santander Bank
(Spain) 80 6,421,883
OceanFirst Bank
# of
Branches
Dep. In Mkt.
($000)
46 4,198,836
Institution
# of
Branches
Dep. In
Mkt.
($000)
Sun* 30* 1,670,119*
Manasquan 9 1,037,767
Kearny 21 1,007,482
Sturdy Savings 13 690,194
1ST Constitution 15 662,526
Bank of Princeton 8 646,558
Two River 13 634,985
*Merger agreement with OceanFirst announced
June 30, 2017.
OceanFirst
Competitive
Position
Responsive
Flexible
Capable
• Lending Limit
• Technology
• Trust
• Cash Management
• Consumer &
Commercial
Mega Banks Community Banks
14

Strategic Deposit Composition Transition
Non-
Interest
Checking
Non-
Interest
Checking
Interest Checking
Interest Checking
WAR 0.25%
MMDA &
Savings
MMDA &
Savings
MMDA & Savings
WAR 0.13%
Time Deposits
Time
Deposits
Time
Deposits
WAR 1.02%
0 400 800 1,200 1,600 2,000 2,400 2,800 3,200 3,600 4,000 4,400
Dec 1996
Dec 2011
September
2017
(In Millions)
47% 53%
September 30, 2017
Deposits by Customer
Segment
Consumer Commercial
Total
Cost of
Deposits
0.29%(1)
15
(1)Deposit costs are average for most recent quarter.

Online Banking & Bill Pay
In the most recent quarter, 45% of
deposit customers used online
banking and an average of 65,000 bills
were paid with online bill pay service
each month.
Check Card
Rewards program promotes usage driving
over $560 million of card transactions in
the last year with related fee income of
$6.8 million.
Full Suite of Technology and Delivery Systems
16
Corporate Cash Management
Remote Deposit Capture (RDC)
processed over 627,000 checks so
far this year for our most important
business customers.
ATM & Interactive Teller (ITM)
The intelligent ATM fleet is supplemented
with video teller ITMs now servicing seven
remote locations from central tellers.
Mobile Banking
Consistently adopting mobile-
centric options including P2P,
eWallet, biometrics and
wearables.
Customers using self-service
channels in September 2017
• 23,100 deposits totaling
$169.2 million.
• 13% of transaction volume and
24% of transaction value of
customer-presented deposits
for the Bank.

Strategic Loan Composition Transition
Investment
CRE(A)
Owner-
Occupied
CRE
Owner-
Occupied
CRE
C&I
C&I
Consumer
(Home
Equity)
Consumer
(Home
Equity)
Residential
Real Estate
Residential
Real Estate
Residential
Real Estate
0 400 800 1,200 1,600 2,000 2,400 2,800 3,200 3,600 4,000
Dec 1996
Dec 2011
September 2017
(In Millions)
Investment
CRE
&
Note (A): Investment CRE as a percent of risk-based capital is 237% at September 30, 2017.
48%
52%
September 30, 2017
Loans by Customer Segment
Consumer Commercial
17

Credit Underwriting Remains Conservative: Commercial Loan
Production 2016 and 2017
(Dollars in thousands)
Commercial
Loan Originations
Year Nine Months
Ended Ended
December 31, 2016 September 30, 2017
Commercial Loan
Portfolio at
September 30, 2017
Amount $261,301 $319,364 $1,873,355
Weighted average rate 4.13% 4.42% 4.41%
Weighted average debt service coverage ── 2.9X 2.3X
Weighted average loan-to-value (CRE only) 70% 60% 57%
Weighted average risk rating(1) 4.5 4.5 4.7
(1)Risk rating is on a scale from 1 (best) to 9 (worst). A rating of 4.5 represents an equivalent S&P rating of BBB.
18

19
OceanFirst Maintains Conservative CRE Portfolio Relative to Peers
0 200 400 600 800 1,000 1,200
Peer 1
Peer 2
OceanFirst Bank
Peer 3
Peer 4
Peer 5
Peer 6
Peer 7
Peer 8
Peer 9
Peer 10
Peer 11
Peer Group Average
Peer 12
Peer 13
Peer 14
Peer 15
Peer 16
Peer 17
Peer 18
(%)
CRE to Total Risk Based Capital
June 30, 2017
6/30/2017 6/30/2015
372
968
Capacity to grow Investor
CRE by $374 million while
remaining under 300% (A).
222
Domestic CRE Loans (Construction, Multifamily & Other Nonfarm Non-residential)
to Total Risk Based Capital. Supervisory guideline is 300% of TRBC.
Peers include: BMTC, DCOM, EGBN, FCF, FFIC, FISI, FLIC, INDB, LBAI, NFBK, ORIT, PGC, SASR, STBA,
TMP, TOWN, UVSP and WSFS.
Source: BankRegData.com
(A) Pro forma with Sun Bank, CRE to Total Risk Based Capital is 277% and capacity to grow investor CRE by $160 million while remaining below 300%.
300

Highlights – Risk Management 2017
• Interest Rate Risk Management
Core deposits(1) are 85.7% of total deposits, a significant hedge against a
rising rate environment
Non-interest bearing deposits are 18.0% of total deposits
Approximately $210 million of excess liquidity in interest-bearing deposits at
September 30, 2017; available for investment in future quarters
• Credit Risk Management
In 2017, $7.8 million of residential loans with high risk characteristics were
sold
(1)Core deposits are all deposits except time deposits.
20

Effective Interest Rate Risk Management
0.0%
20.0%
40.0%
60.0%
80.0%
100.0%
Mortgage Loans Consumer Loans Commercial Loans
(CRE & C&I)
Securities Total Assets
(Weighted Average)
Borrowings Deposits
Adjustable/Floating Fixed Core Deposits, Administered
Duration
Rate Characteristics
0.0
1.0
2.0
3.0
4.0
Securities Mortgage Loans Consumer Loans Commercial Loans Total Assets
(Weighted Average)
FHLB Term
Borrowings
Time Deposits
Ye
ar
s
All asset categories managed with limited duration
At September 30, 2017
21

Term Borrowings Extended as Interest Rate Hedge
0.00
10.00
20.00
30.00
40.00
50.00
60.00
70.00
80.00
90.00
2017 2018 2019 2020 2021 2022
M
ill
io
ns
o
f D
ol
la
rs
Maturity Periods
TOTAL
$259.2MM
1.76% AVG. COST
At September 30, 2017
22

0.00%
0.20%
0.40%
0.60%
0.80%
0.00%
0.50%
1.00%
1.50%
2.00%
2.50%
3.00%
2011 2012 2013 2014 2015 2016 YTD Q3
2017
N
et loan charge-offs as percent of average loans
N
on
-p
er
fo
rm
in
g
lo
an
s
as
p
er
ce
nt
o
f t
ot
al
lo
an
s
re
ce
iv
ab
le
Residential Consumer Commercial Real Estate Commercial Net Charge-Offs
Credit Metrics Reflect Conservative Culture
(1)Net charge-off ratio for 2014 excludes charge-off related to bulk sale of non-performing residential and consumer
mortgage loans. Including this charge-off, the ratio is 0.45%.
Half of the net
charge-offs relate to
the sale of three
high risk acquired
loan pools
(1)
23
2.77% 2.80%
2.88%
1.06%
0.91%
0.35%
0.58% 0.38% 0.17% 0.15% 0.07% 0.15% 0.06% NET CHARGE-OFFS
0.39%

Net Interest Margin
Expanded Net Interest Margin to Outperform both Historical Level and Peer Group
2.00%
2.20%
2.40%
2.60%
2.80%
3.00%
3.20%
3.40%
3.60%
3.80%
2007 2008 2009 2010 2011 2012 2013 2014 2015 2016 Q1 2017 Q2 2017 Q3 2017
Historical Average (1996 – 2016) Net Interest Margin (3.29%)
YTD 2017
consolidated
NIM at 3.54%
includes 19 BP
of net accretable
yield from
purchase
accounting
adjustments and
prepayment fees
3.62
3.37
3.15
3.25
3.35
3.45
3.55
3.65
OceanFirst Bank
OceanFirst Bank: Significant expansion since 2015
Peers: Steady decline since 2014 until recent quarter
24
Peers
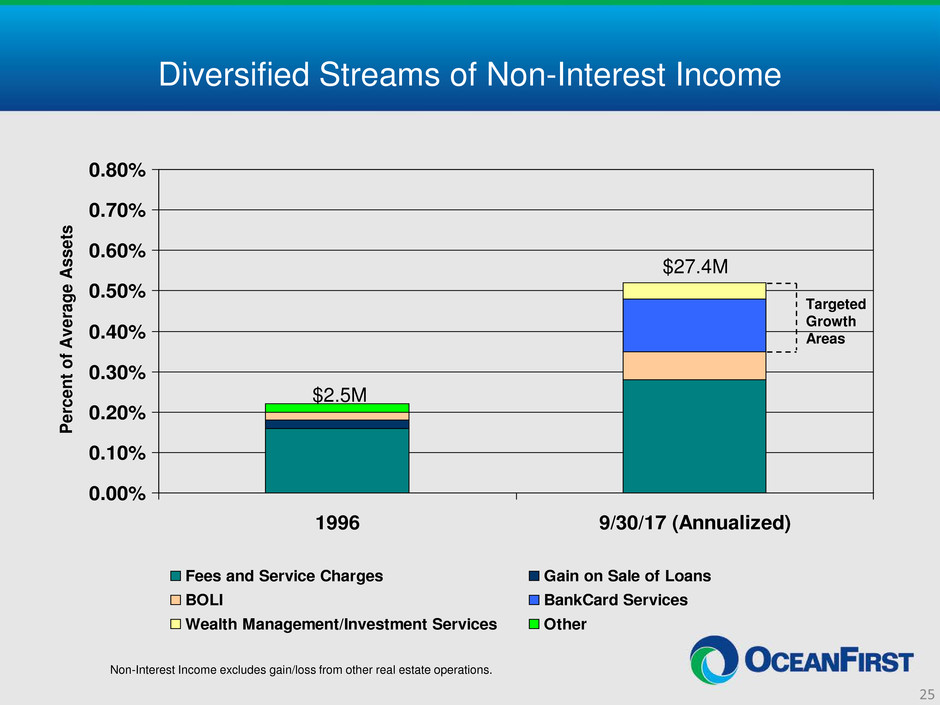
Diversified Streams of Non-Interest Income
0.00%
0.10%
0.20%
0.30%
0.40%
0.50%
0.60%
0.70%
0.80%
1996 9/30/17 (Annualized)
P
er
ce
nt
o
f A
ve
ra
ge
A
ss
et
s
Fees and Service Charges Gain on Sale of Loans
BOLI BankCard Services
Wealth Management/Investment Services Other
$2.5M
$27.4M
Targeted
Growth
Areas
Non-Interest Income excludes gain/loss from other real estate operations.
25

Generating Consistent Attractive Returns
7.0%
9.0%
11.0%
13.0%
2009 2010 2011 2012 2013 2014 2015 2016 YTD Q3 2017
(Annualized)
0.70%
0.80%
0.90%
1.00%
1.10%
Return on Tangible Equity Return on Assets
(1)For 2013, excludes after-tax impact of $3.1 million in charges related to strategic advance restructuring and branch consolidation.
(2)For 2015, 2016 and 2017, excludes merger related expenses. For 2016, also excludes Federal Home Loan Bank prepayment fee and loss on
sale of investment securities. For 2017, also excludes the effect of accelerated stock award expense and branch consolidation expense.
(1)
R
eturn on A
ssets
R
et
ur
n
on
T
an
gi
bl
e
C
om
m
on
E
qu
ity
26
12.9%
1.05%
(2) (2) (2)

Accelerating EPS Growth
27
$0.40
$0.80
$1.20
$1.60
$2.00
2011 2012 2013 2014 2015 2016 YTD Q3 2017
(Annualized)
Core Diluted EPS Reported Diluted EPS
(2)
(1)For 2013, excludes after-tax impact of $3.1 million in charges related to strategic advance restructuring and branch consolidation.
(2)For 2015, 2016 and 2017, excludes merger related expenses. For 2016, also excludes Federal Home Loan Bank prepayment fee and loss on
sale of investment securities. For 2017, also excludes the effect of accelerated stock award expense and branch consolidation expense.
(1) (2) (2)
2017 YTD

Prudently Managing Excess Capital in Near Term
$8.8 $8.6 $8.2 $8.2 $8.7
$12.6
$14.4
$2.1
$11.9
$8.1 $9.2 $6.5
$1.9
$0.0
$5.0
$10.0
$15.0
$20.0
$25.0
2011 2012 2013 2014 2015 2016 2017
A
nn
ua
l R
et
ur
n
of
C
ap
ita
l (
M
ill
io
ns
)
Cash Dividends Stock Repurchases
Notes: Stock Repurchases – $15.52 Average Cost per Share.
In Q4 2015 through Q3 2016, stock repurchases suspended as capital
was allocated to Cape and Ocean Shore acquisitions.
28
(9 Months)
Increased Quarterly
Dividend by 15% in Q4
2016, from $0.13 per
share to $0.15 per share
Why OCFC…?
• Fundamental franchise value
Preeminent community bank in Central and Southern New Jersey
Superior deposit profile
Significant commercial loan growth since December 2012; current focus on recent
portfolio integrations
Conservative credit culture
• Solid financial performance
Consistent attractive returns
Strong balance sheet and capital base
• Seasoned and effective management team
Substantial insider ownership – aligned with shareholders’ interests
Fully capable of executing on 5-year growth plan
29

Attractive Valuation Metrics
OCFC Peers(1)
30
Valuation
Price / Tangible Book Value 216% 225%
Price / 2017 Estimated EPS 17.0x 18.6x
Price / 2018 Estimated EPS 15.7x 17.1x
Core Deposit Premium(2) 12.5% 13.6%
Cash Dividend Yield 2.1% 2.1%
1) Peers include: AROW, BMTC, DCOM, EGBN, FFIC, FISI, FLIC, LBAI, NFBK, ORIT, PGC, SASR,
TMP, UVSP and WSFS
2) Core Deposits for FISI, SASR, UVSP and WSFS as of September 30, 2017 from Bank Call Reports;
Core Deposits for AROW, BMTC, DCOM, EGBN, FFIC, FLIC, LBAI, NFBK, ORIT, PGC and TMP as
of June 30, 2017 from Bank Call Reports
Note: Financial data as of September 30, 2017 (except FFIC and FLIC); market data as of October 27,
2017; OCFC stock price of $29.12. Source: SNL Financial

Appendix
31

OceanFirst Financial Corp. – Analyst Coverage
APPENDIX 1
Investor Relations Contacts
Christopher D. Maher
Chairman, President and
Chief Executive Officer
732-240-4500 Ext. 7504
cmaher@oceanfirst.com
Michael J. Fitzpatrick
Executive Vice President and
Chief Financial Officer
732-240-4500 Ext. 7506
mfitzpatrick@oceanfirst.com
Jill A. Hewitt
Senior Vice President and
Investor Relations Officer
732-240-4500 Ext. 7513
jhewitt@oceanfirst.com
32
Company
Analyst
Recommendation
Price
Target
Keefe Bruyette & Woods Collyn Gilbert Outperform $32.00
Sandler O’Neill & Partners Frank Schiraldi Buy $29.00
Piper Jaffray Matt Breese Overweight $31.00
FIG Partners David Bishop Outperform $33.00
Merion Capital Group Joe Gladue Outperform $32.00
D.A. Davidson Russell Gunther Buy $33.00
Hovde Group Brian Zabora Outperform $33.00

Market Demographics
Central
New Jersey(1)
Southern
New Jersey(2)
Philadelphia
Metro(3)
Total Bank Offices in Market 830 487 841
Total Bank Deposits in Market $89.4 billion $39.2 billion $97.4 billion
Number of OceanFirst Offices 29 23
% of OceanFirst Deposits 50 50
Market Rank 10 5
Market Share (%) 2.2 5.1
Population 2,434,160 1,829,011 3,027,447
Projected 2018-2023
Population Growth (%)
5.2 (3.8) 3.6
Data as of June 30, 2017.
Source: SNL Financial
Notes: 1 – Includes Monmouth, Ocean, Middlesex and Mercer counties, New Jersey
2 – Includes Burlington, Atlantic, Cape May, Camden, Gloucester, Salem and Cumberland counties, New Jersey
3 – Includes Philadelphia, Bucks and Montgomery counties, Pennsylvania
APPENDIX 2
Expansion
opportunity
33

Commercial Portfolio Metrics
APPENDIX 3
Commercial Real Estate (CRE)
Owner-Occupied
Investor
Total
$ 555.4 million
1,134.4 million
$1,689.8 million
% of Total Loan Portfolio 43.3%
Average Size of CRE Loans $796,000
Largest CRE Loan $24.0 million
Pipeline as of September 30, 2017 $37.8 million
Weighted Average Yield 4.40%
Weighted Average Repricing Term 5.6 years
Commercial Loans (C&I)
Total Portfolio $183.5 million
% of Total Loan Portfolio 4.7%
Average Size of Commercial Loans $309,000
Largest Commercial Loan $17.2 million
Pipeline as of September 30, 2017 $20.4 million
Weighted Average Yield 4.05%
Weighted Average Repricing Term 5.4 years
Note: The maximum loan exposure to a single borrower, including CRE and C&I loans,
was $35.1 million. Legal lending limit of $69 million in loans to one borrower.
34

Commercial Portfolio Segmentation
APPENDIX 3
(Cont’d)
Total Commercial Loan Exposure
by Industry Classification
Arts/Entertainment/
Recreation, 3.5%
Real Estate Investment,
52.5%
Other Services, 3.5%
Retail Trade, 5.7%
Public Administration,
2.1%
Miscellaneous, 5.2%
Manufacturing, 2.7%
Educational Services,
3.2%
Accommodations/ Food
Services, 8.0%
Healthcare, 6.0%
Wholesale Trade, 3.1%
Construction, 4.5%
Real Estate Investment by
Property Classification
Residential
Development, 9.7%
Industrial/
Warehouse, 5.6%
Single Purpose,
8.3%
Miscellaneous, 8.3%
Motel, 5.5%
Multi-Family, 7.4%
Retail Store, 8.2%
Shopping Center,
10.7%
Development, 5.8%
Office, 30.5%
Diversified portfolio provides
protection against industry-
specific credit events.
As of September 30, 2017.
35

Residential Portfolio Metrics
APPENDIX 4
Residential Real Estate
Total Portfolio $1,678.1 million
% of Total Loan Portfolio 43.0%
Average size of mortgage loans $214,000
% of loans for second homes 19%
Portfolio weighted average loan-to-value ratio (using original or most recent appraisal)
- Loans originated during 2017
58%
65%
Portfolio average FICO score
- Loans originated during 2017
755
764
% of loans outside the New York/New Jersey market 1.9%
As of September 30, 2017, unless otherwise noted.
36
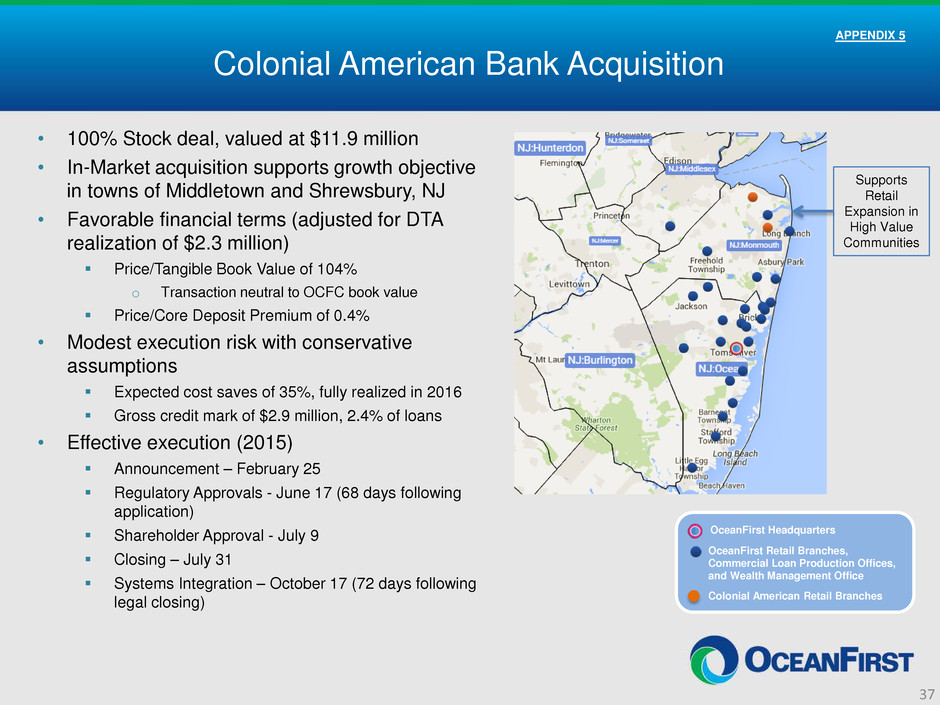
Colonial American Bank Acquisition
• 100% Stock deal, valued at $11.9 million
• In-Market acquisition supports growth objective
in towns of Middletown and Shrewsbury, NJ
• Favorable financial terms (adjusted for DTA
realization of $2.3 million)
Price/Tangible Book Value of 104%
o Transaction neutral to OCFC book value
Price/Core Deposit Premium of 0.4%
• Modest execution risk with conservative
assumptions
Expected cost saves of 35%, fully realized in 2016
Gross credit mark of $2.9 million, 2.4% of loans
• Effective execution (2015)
Announcement – February 25
Regulatory Approvals - June 17 (68 days following
application)
Shareholder Approval - July 9
Closing – July 31
Systems Integration – October 17 (72 days following
legal closing)
APPENDIX 5
Supports
Retail
Expansion in
High Value
Communities
OceanFirst Headquarters
OceanFirst Retail Branches,
Commercial Loan Production Offices,
and Wealth Management Office
Colonial American Retail Branches
37

Cape Bancorp Acquisition
• Creates the preeminent New Jersey based community
banking franchise operating throughout central and
southern New Jersey
• 85% stock and 15% cash, valued at $196 million
• Favorable financial terms
Price/Tangible Book Value of 139%
Price/Core Deposit Premium of 4.4%
Expected accretion to GAAP EPS of 17% in 2017
Expected tangible book value dilution of 7.2%, projected
earnback of approximately 3.3 years using the cross-over
method and 3.8 years on a simple tangible book value
earnback calculation
• Modest execution risk with conservative assumptions
Expected cost saves of 33%, fully realized by end of 2016
Expected one-time, pre-tax transaction expenses of
$15.5 million
Gross credit mark of $25.5 million, 2.3% of loans
• Effective execution (2016)
Announcement – January 5
Regulatory Approvals – March 28 (52 days following application)
Shareholder Approvals – April 25
Closing – May 2
Systems Integration – completed October 15
APPENDIX 6
38
OceanFirst Headquarters
OceanFirst Retail Branches,
Commercial Loan Production Offices,
and Wealth Management Office
Cape Bank Retail Branches and
Commercial Loan Offices

39
Ocean Shore Holding Co. Acquisition
- OCFC
Branches
- OSHC
Branches
APPENDIX 7
• Reinforces OceanFirst as the preeminent New Jersey
based community banking franchise operating
throughout central and southern New Jersey
• 80% stock and 20% cash, valued at $181 million
• Favorable financial terms(1)
Price/Tangible Book Value of 132%
Price/Core Deposit Premium of 4.9%
Expected accretion to GAAP EPS of over 5% in 2018
Expected tangible book value dilution of 3.1%, projected
earnback of approximately 3.7 years using the cross-over
method and 4.1 years on a simple tangible book value
earnback calculation
• Modest execution risk with conservative assumptions
Expected cost saves of 53%, fully realized by end of 2017
Expected one-time, pre-tax transaction expenses of $19 million
Gross credit mark of $10.0 million, 1.25% of loans
• Effective execution (2016)
Announcement – July 13, 2016
Regulatory Approvals – October 27, 2016 (72 days following
application)
Shareholder Approvals – November 22, 2016
Closing – November 30, 2016
Systems Integration – completed May 19, 2017
(1)At time of announcement
40
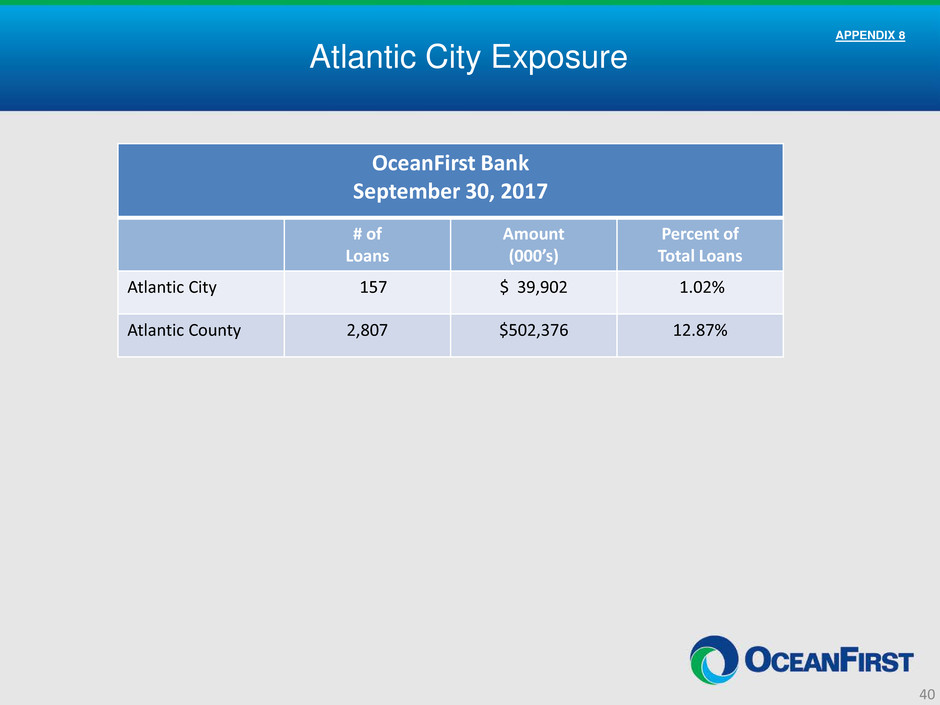
Atlantic City Exposure
OceanFirst Bank
September 30, 2017
# of
Loans
Amount
(000’s)
Percent of
Total Loans
Atlantic City 157 $ 39,902 1.02%
Atlantic County 2,807 $502,376 12.87%
APPENDIX 8

Serving Our Communities
• OceanFirst Foundation
As of September 30, 2017, over $33.0 million has been granted to
organizations serving the Bank’s market
Provided $500,000 in grants dedicated to assisting our neighbors
after Superstorm Sandy hit the Jersey Shore in 2012
First foundation established during a mutual conversion to IPO
(July 1996)
Completed merger of Cape Foundation into OceanFirst
Foundation in 2016 and anticipate merger of Ocean City Home
Foundation in 2017
As of September 30, 2017, OceanFirst Foundation has assets of
$34.5 million
APPENDIX 9
41
