Attached files
| file | filename |
|---|---|
| 8-K - 8-K - IMPERIAL OIL LTD | d482426d8k.htm |
Business Update November 1 Exhibit 99.1
Cautionary statement Statements of future events or conditions in this report, including projections, targets, expectations, estimates, and business plans are forward-looking statements. Actual future financial and operating results, including demand growth and energy source mix; production growth and mix; project plans, dates, costs and capacities; production rates; production life and resource recoveries; cost savings; product sales; financing sources; and capital and environmental expenditures could differ materially depending on a number of factors, such as changes in the supply of and demand for crude oil, natural gas, and petroleum and petrochemical products and resulting price and margin impacts; limitations on transportation for accessing markets; political or regulatory events, including changes in law or government policy, applicable royalty rates and tax laws; the receipt, in a timely manner, of regulatory and third-party approvals; third party opposition to operations and projects; environmental risks inherent in oil and gas exploration and production activities; environmental regulation, including climate change and greenhouse gas restrictions; currency exchange rates; availability and allocation of capital; performance of third party service providers; unanticipated operational disruptions; management effectiveness; commercial negotiations; project management and schedules; response to unexpected technological developments; operational hazards and risks; disaster response preparedness; the ability to develop or acquire additional reserves; and other factors discussed in in Item 1A of Imperial Oil Limited’s Form 10-K for the year ended December 31, 2016 and in the management’s discussion and analysis of financial condition and results of operations contained in Item 7. Forward-looking statements are not guarantees of future performance and involve a number of risks and uncertainties, some that are similar to other oil and gas companies and some that are unique to Imperial Oil Limited. Imperial Oil Limited’s actual results may differ materially from those expressed or implied by its forward-looking statements and readers are cautioned not to place undue reliance on them. Imperial Oil Limited undertakes no obligation to update any forward-looking statements contained herein, except as required by applicable law. All financial information is presented in Canadian dollars, unless otherwise indicated. In these materials, certain natural gas volumes have been converted to barrels of oil equivalent (BOE) on the basis of six thousand cubic feet (Mcf) to one barrel (bbl). BOE may be misleading, particularly if used in isolation. A BOE conversion ratio of 6 Mcf to one bbl is based on an energy-equivalency conversion method primarily applicable at the burner tip and does not represent a value equivalency at the wellhead. Given that the value ratio based on the current price of crude oil as compared to natural gas is significantly different than the energy equivalency ratio of 6 Mcf to 1 bbl, using a 6:1 conversion ratio may be misleading as an indication of value. All reserves and contingent resources estimates provided in these materials are effective as of December 31, 2016, and based on definitions contained in the Canadian Oil and Gas Evaluation Handbook (COGEH) and are presented in accordance with National Instrument 51-101, as disclosed in Imperial’s Form 51-101F1 for the fiscal year ending December 31, 2016. Except as otherwise disclosed herein, reserves and contingent resource information are an estimate of the company’s working interest before royalties at year-end 2016, as determined by Imperial’s internal qualified reserves evaluator. Reserves are the estimated remaining quantities of oil and natural gas and related substances anticipated to be recoverable from known accumulations, from a given date forward, based on: analysis of drilling, geological, geophysical and engineering data, the use of established technology, and specified economic conditions, which are generally accepted as being reasonable. Proved reserves are those reserves which can be estimated with a high degree of certainty to be recoverable. Probable reserves are those additional reserves that are less certain to be recovered than proved reserves. Contingent resources do not constitute, and should not be confused with, reserves. Contingent resources are those quantities of petroleum considered to be potentially recoverable from known accumulations using established technology or technology under development, but are currently not considered to be commercially recoverable due to one or more contingencies. Contingencies that preclude the classification of Imperial’s contingent resources as reserves include, but are not limited to, the need for further design and the associated uncertainty in development costs and timelines; regulatory approvals; need for internal approvals to proceed with development; lack of market access; and the need for further delineation analysis to improve certainty of resources. Contingent resource volumes represented in these materials are technical best estimate volumes, considered to be a realistic estimate of the quantity that may actually be recovered; it is equally likely that the actual quantities recovered may be greater or less than the technical best estimate. Estimates of contingent resources have not been adjusted for risk based on the chance of development. There is uncertainty that it will be commercially viable to produce any portion of the resource, nor is there certainty as to the timing of any such development. Significant positive and negative factors relevant to the estimate include, but are not limited to, the commodity price environment and regulatory and tax uncertainty. The estimates of various classes of reserves (proved and probable) and of contingent resources in these materials represent arithmetic sums of multiple estimates of such classes for different properties, which statistical principles indicate may be misleading as to volumes that may actually be recovered. Readers should give attention to the estimates of individual classes of reserves and contingent resources and appreciate the differing probabilities of recovery associated with each class. The term “project” as used in these materials can refer to a variety of different activities and does not necessarily have the same meaning as in any government payment transparency reports.
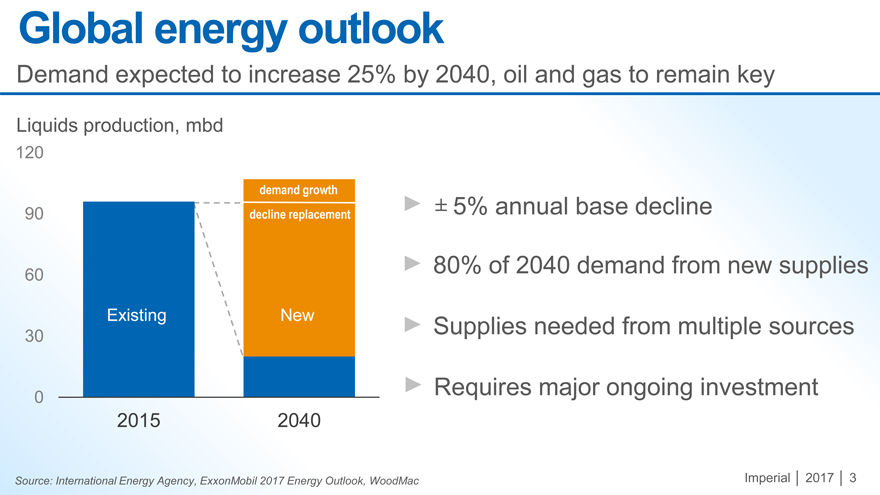
Imperial 2017 3 Source: International Energy Agency, ExxonMobil 2017 Energy Outlook, WoodMac 0 30 60 90 120 2015 2040 Liquids production, mbd Global energy outlook Demand expected to increase 25% by 2040, oil and gas to remain key New Existing demand growth ±5% annual base decline 80% of 2040 demand from new supplies Supplies needed from multiple sources Requires major ongoing investment decline replacement
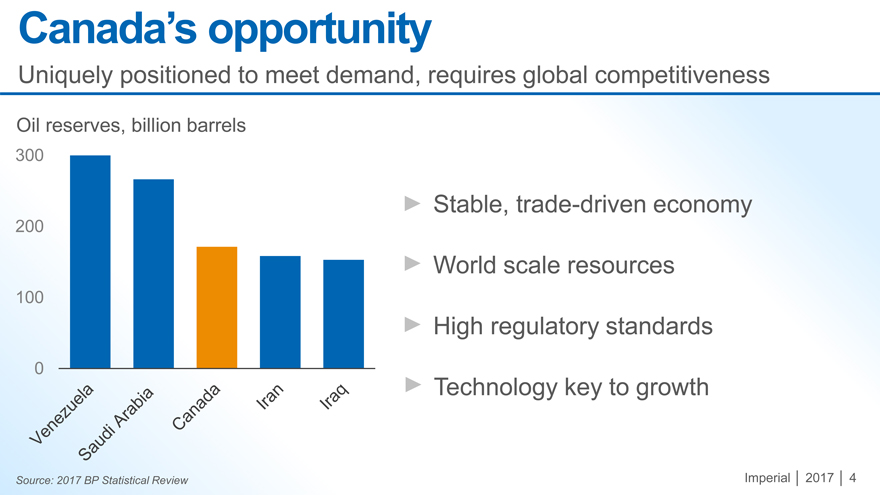
Imperial 2017 4 Source: 2017 BP Statistical Review 0 100 200 300 Canada’s opportunity Uniquely positioned to meet demand, requires global competitiveness Stable, trade-driven economy World scale resources High regulatory standards Technology key to growth Oil reserves, billion barrels
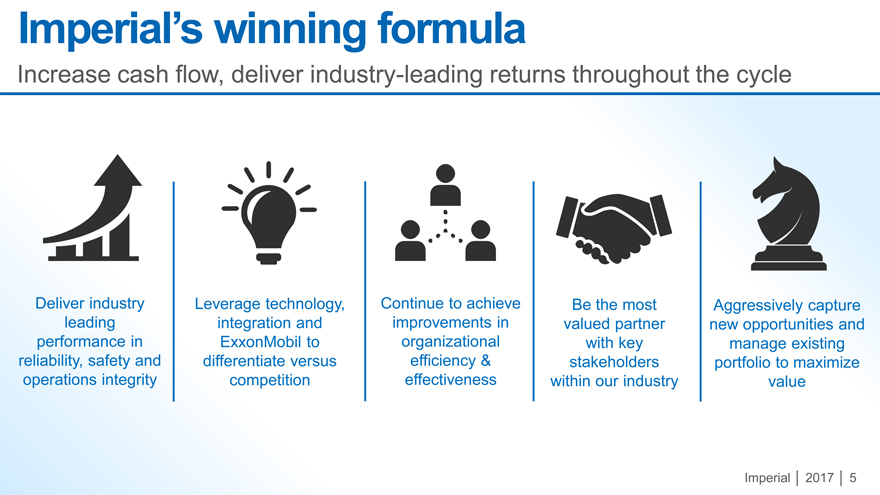
Deliver industry leading performance in reliability, safety and operations integrity Be the most valued partner with key stakeholders within our industry Leverage technology, integration and ExxonMobil to differentiate versus competition Aggressively capture new opportunities and manage existing portfolio to maximize value Continue to achieve improvements in organizational efficiency & effectiveness
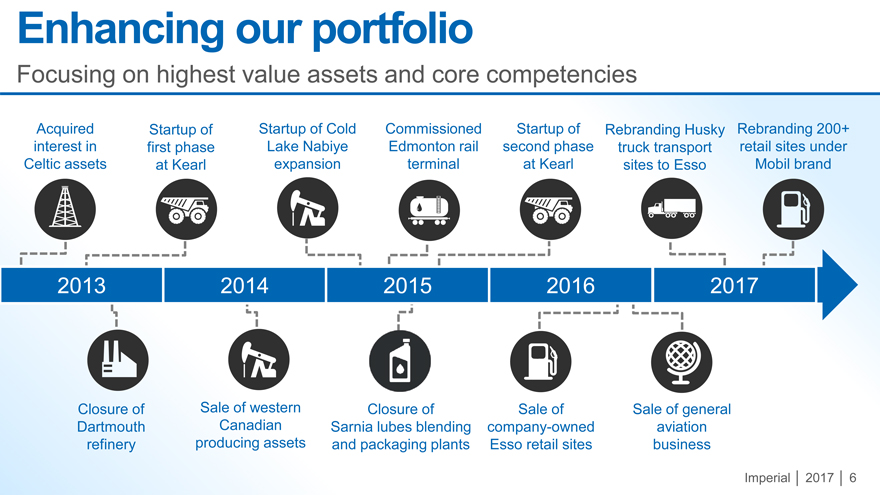
Startup of Cold Lake Nabiye expansion Rebranding Husky truck transport sites to Esso Commissioned Edmonton rail terminal Acquired interest in Celtic assets Startup of first phase at Kearl Startup of second phase at Kearl Rebranding 200+ retail sites under Mobil brand 2013 2014 2015 2016 2017 Sale of general aviation business Sale of western Canadian producing assets Sale of company-owned Esso retail sites Closure of Sarnia lubes blending and packaging plants Closure of Dartmouth refinery
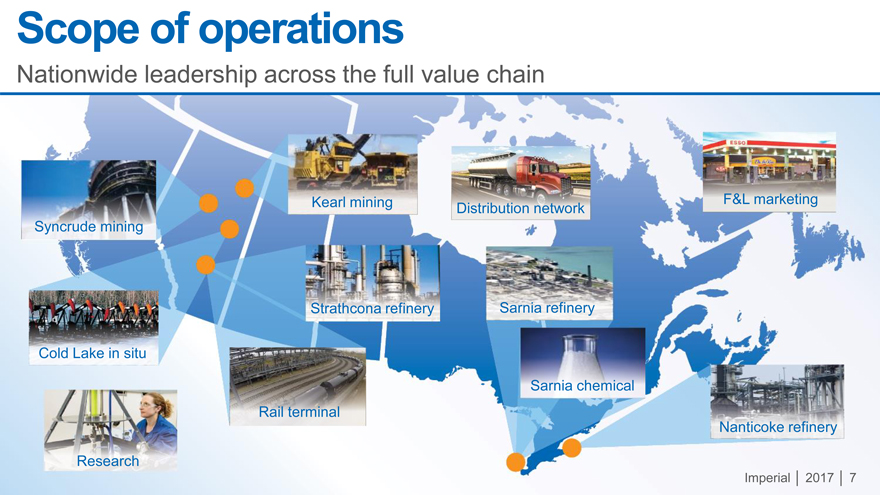
Imperial 2017 7 Scope of operations Nationwide leadership across the full value chain Syncrudemining Kearl mining Cold Lake in situ Rail terminal F&L marketing Strathcona refinery Sarnia chemical Sarnia refinery Nanticoke refinery Research Distribution network
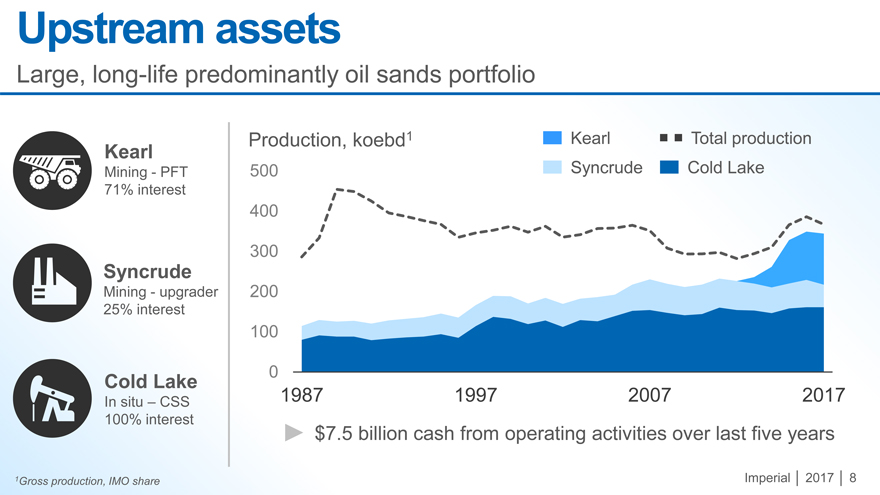
Imperial 2017 8 1Gross production, IMO share 0 100 200 300 400 500 1987 1997 2007 2017 Upstream assets Large, long-life predominantly oil sands portfolio Production, koebd1 Kearl Mining—PFT 71% interest Cold Lake In situ – CSS 100% interest Syncrude Mining—upgrader 25% interest $7.5 billion cash from operating activities over last five years Syncrude Cold Lake Kearl Total production
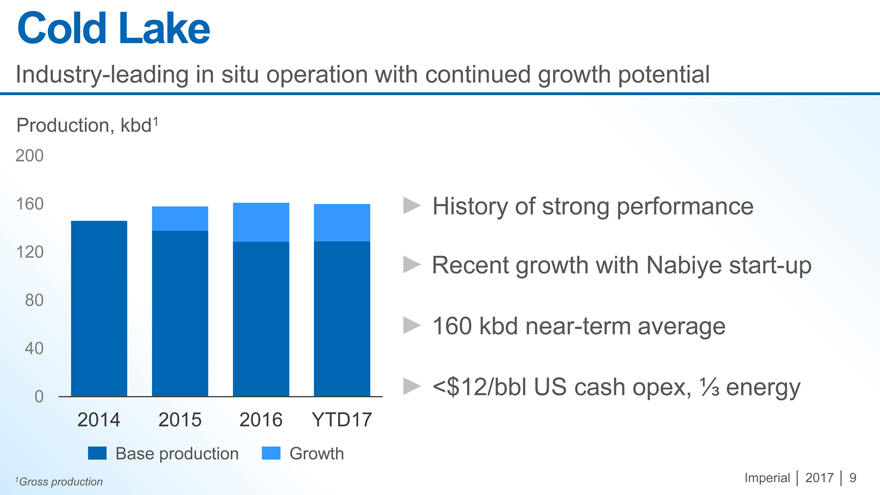
Imperial 2017 9 1Gross production Cold Lake Industry-leading in situ operation with continued growth potential Production, kbd1 0 40 80 120 160 200 2014 2015 2016 YTD17 Base production Growth History of strong performance Recent growth with Nabiyestart-up 160 kbdnear-term average <$12/bblUS cash opex, energy
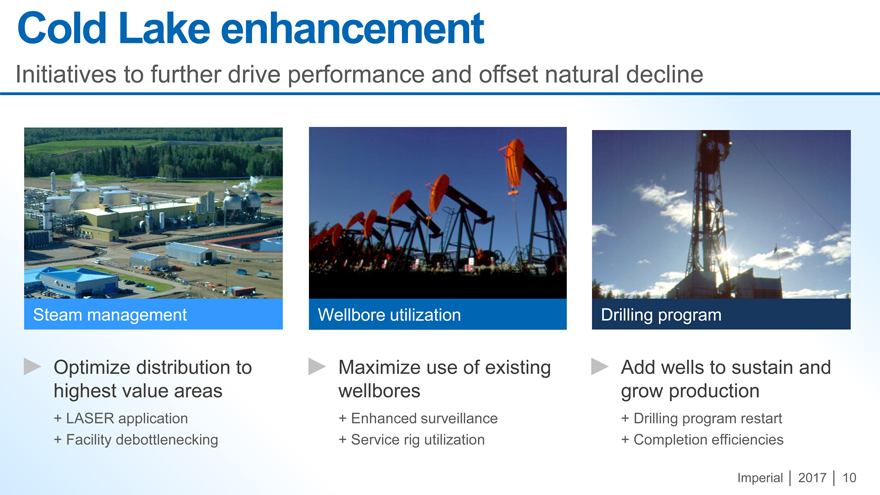
Imperial 2017 10 Cold Lake enhancement Initiatives to further drive performance and offset natural decline Steam management Drilling program Wellbore utilization Optimize distribution to highest value areas + LASER application + Facility debottlenecking Maximize use of existing wellbores + Enhanced surveillance + Service rig utilization Add wells to sustain and grow production + Drilling program restart + Completion efficiencies
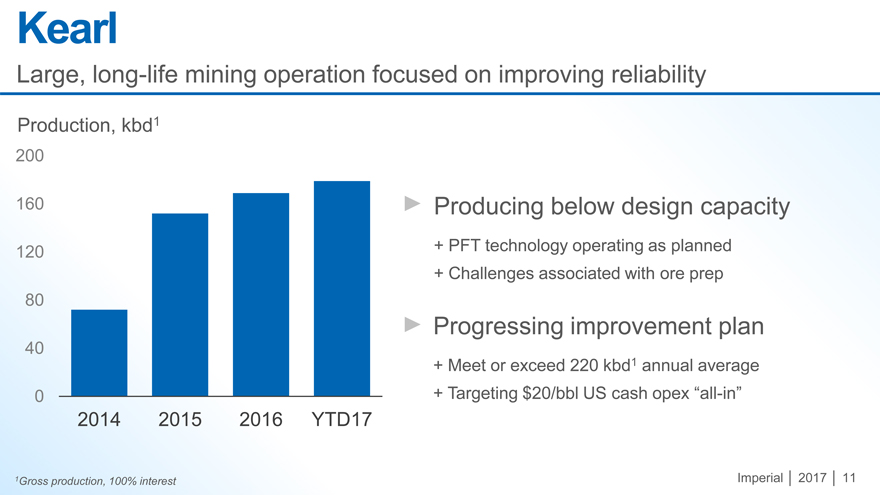
Imperial 2017 11 1Gross production, 100% interest 0 40 80 120 160 200 2014 2015 2016 YTD17 Kearl Large, long-life mining operation focused on improving reliability Production, kbd1 Producing below design capacity + PFT technology operating as planned + Challenges associated with ore prep Progressing improvement plan + Meet or exceed 220 kbd1annual average + Targeting $20/bblUS cash opex“all-in”
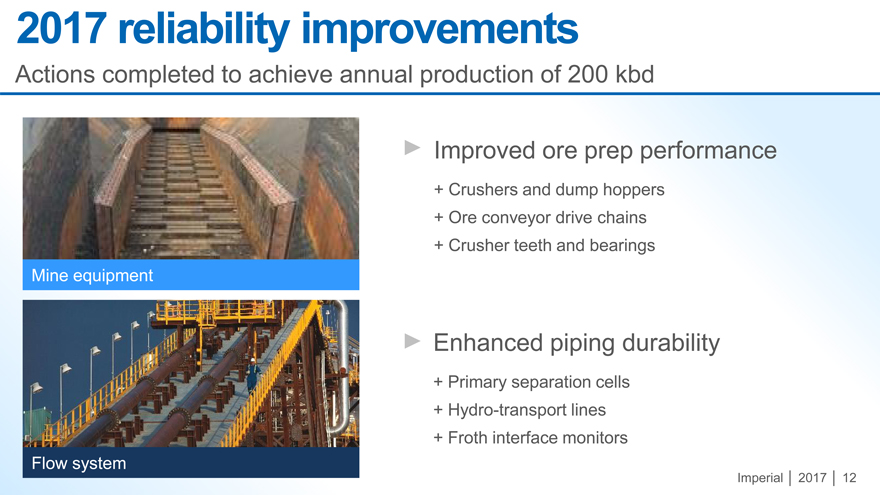
Imperial 2017 12 Flow system Mine equipment 2017 reliability improvements Actions completed to achieve annual production of 200 kbd Improved ore prep performance + Crushers and dump hoppers + Ore conveyor drive chains + Crusher teeth and bearings Enhanced piping durability + Primary separation cells + Hydro-transport lines + Froth interface monitors
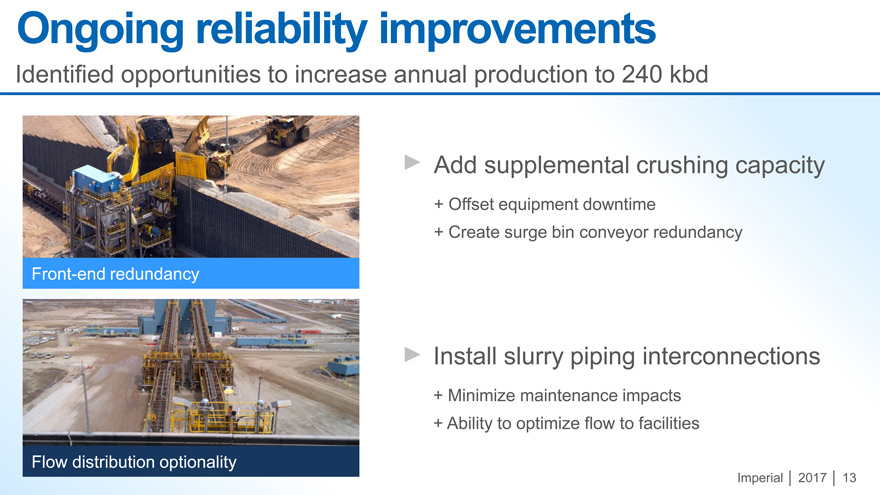
Imperial 2017 13 Front-end redundancy Flow distribution optionality Add supplemental crushing capacity + Offset equipment downtime + Create surge bin conveyor redundancy Install slurry piping interconnections + Minimize maintenance impacts + Ability to optimize flow to facilities Ongoing reliability improvements Identified opportunities to increase annual production to 240 kbd
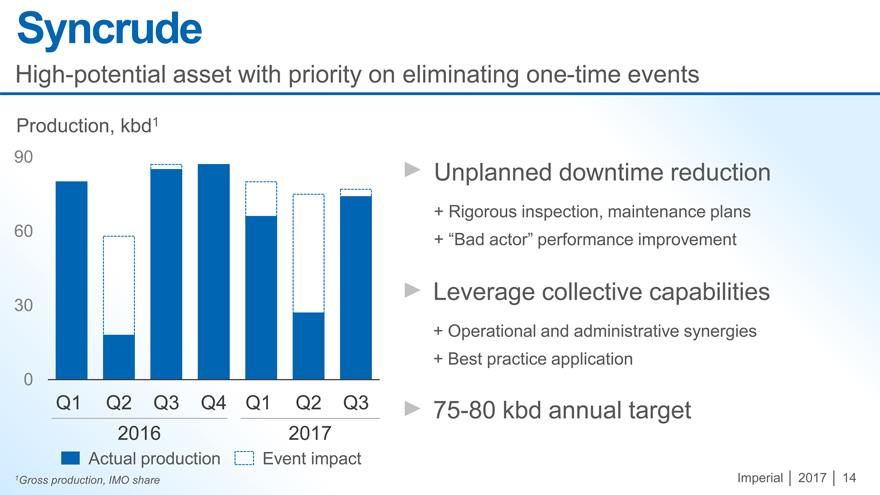
Imperial 2017 14 1Gross production, IMO share 0 30 60 90 Q1 Q2 Q3 Q4 Q1 Q2 Q3 Production, kbd1 Syncrude High-potential asset with priority on eliminating one-time events 2016 2017 Actual production Event impact Unplanned downtime reduction + Rigorous inspection, maintenance plans + “Bad actor” performance improvement Leverage collective capabilities + Operational and administrative synergies + Best practice application 75-80 kbdannual target
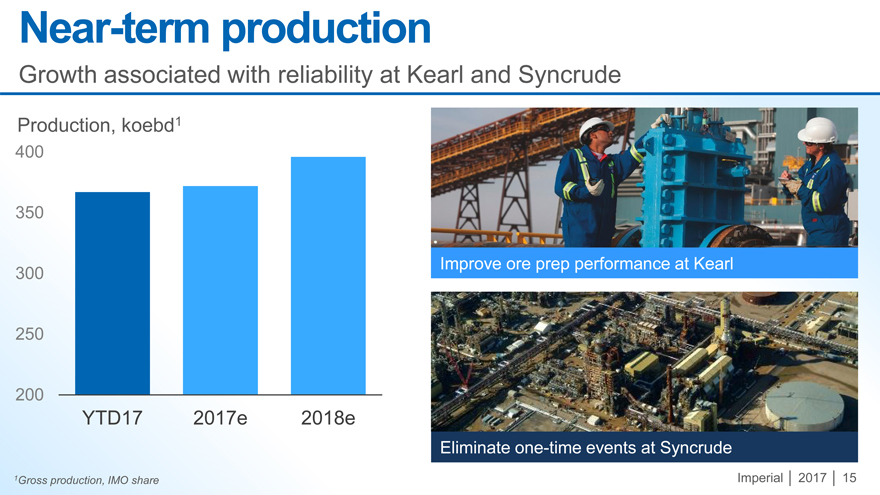
Imperial 2017 15 1Gross production, IMO share 200 250 300 350 400 YTD17 2017e 2018e Near-term production Growth associated with reliability at Kearl and Syncrude Production, koebd1 Improve ore prep performance at Kearl Eliminate one-time events at Syncrude
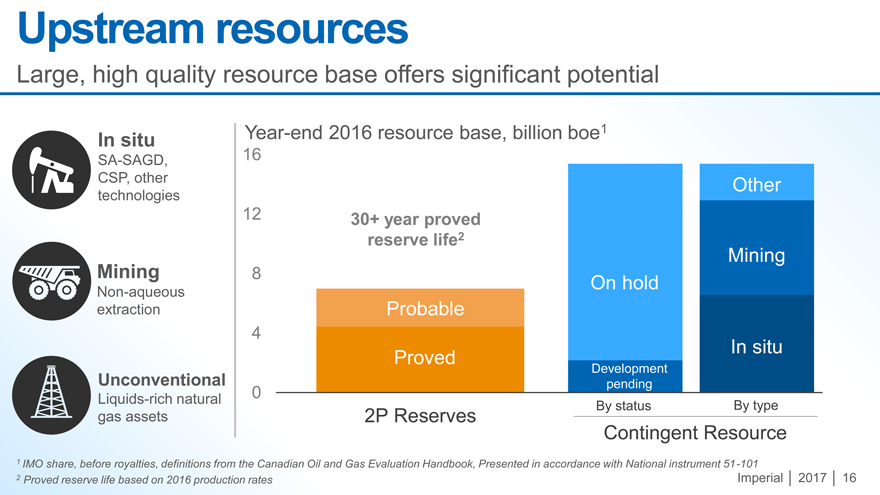
Imperial 2017 16 1 IMO share, before royalties, definitions from the Canadian Oil and Gas Evaluation Handbook, Presented in accordance with National instrument 51-101 2 Proved reserve life based on 2016 production rates Upstream resources Large, high quality resource base offers significant potential In situ SA-SAGD, CSP, other technologies Unconventional Liquids-rich natural gas assets Mining Non-aqueous extraction Year-end 2016 resource base, billion boe1 Contingent Resource 0 4 8 12 16 2P Reserves Probable Proved On hold Development pending 30+ year proved reserve life2 Mining In situ Other By status By type
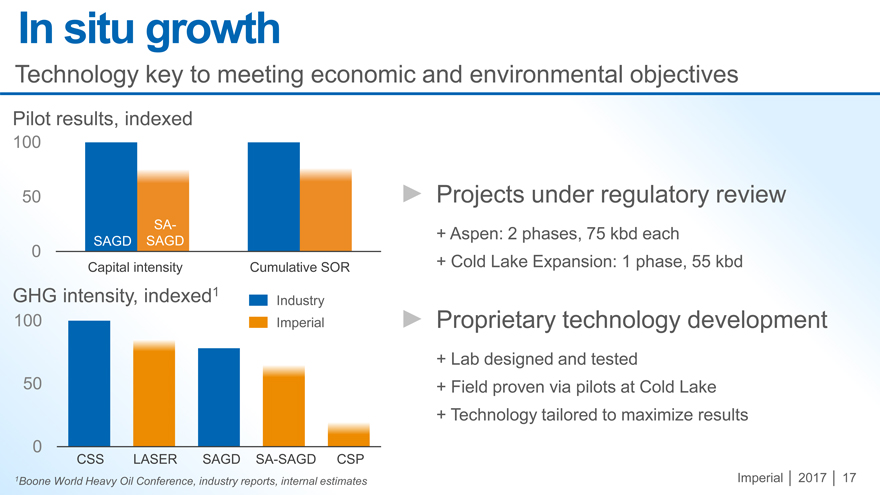
Imperial 2017 17 Technology key to meeting economic and environmental objectives Pilot results, indexed 0 50 100 SA-SAGD LASER CSS SAGD CSP GHG intensity, indexed1 1Boone World Heavy Oil Conference, industry reports, internal estimates Proprietary technology development + Lab designed and tested + Field proven via pilots at Cold Lake + Technology tailored to maximize results Projects under regulatory review + Aspen: 2 phases, 75 kbdeach + Cold Lake Expansion: 1 phase, 55 kbd Industry Imperial 0 50 100 Capital intensity Cumulative SOR SAGD SA-SAGD In situ growth
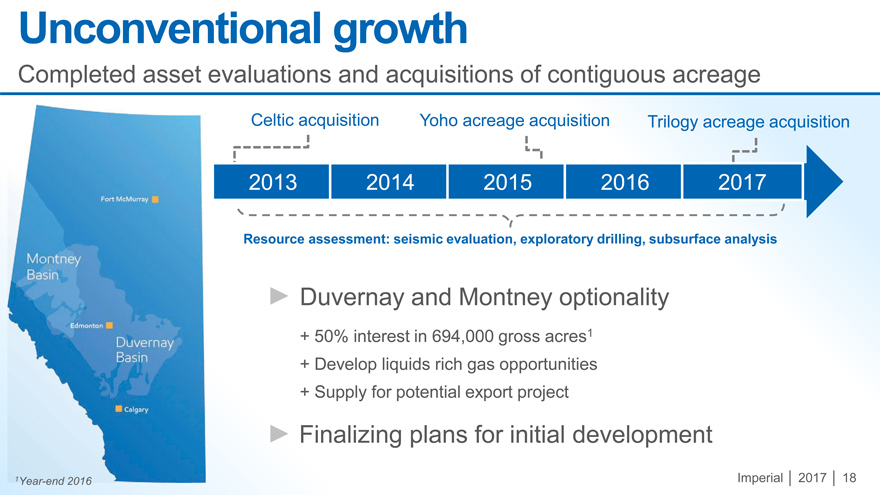
Imperial 2017 18 Unconventional growth Completed asset evaluations and acquisitions of contiguous acreage Celtic acquisition 2013 2014 2015 2016 2017 Trilogy acreage acquisition Yoho acreage acquisition Resource assessment: seismic evaluation, exploratory drilling, subsurface analysis Duvernayand Montneyoptionality + 50% interest in 694,000 gross acres1 + Develop liquids rich gas opportunities + Supply for potential export project Finalizing plans for initial development 1Year-end 2016
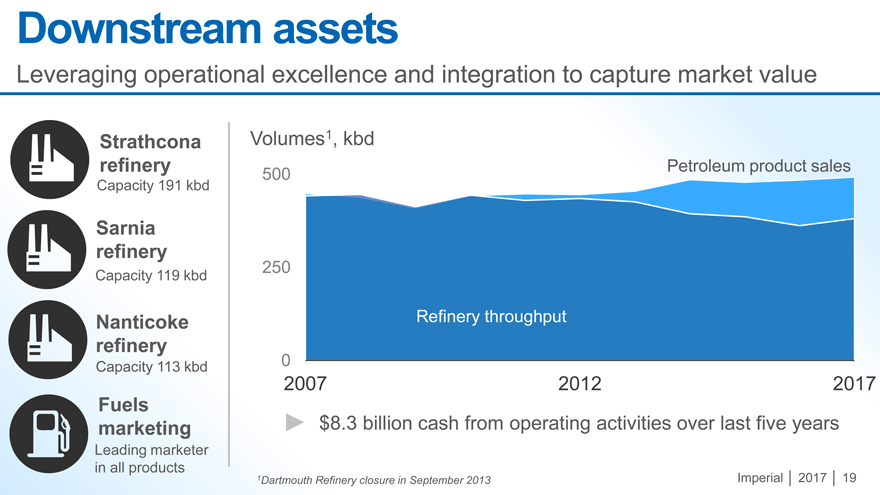
Imperial 2017 19 2007 2012 2017 0 250 500 Downstream assets Leveraging operational excellence and integration to capture market value Volumes1, kbd Strathcona refinery Fuels marketing Refinery throughput Sarnia refinery Nanticoke refinery Petroleum product sales Capacity 191 kbd Capacity 119 kbd Capacity 113 kbd Leading marketer in all products $8.3 billion cash from operating activities over last five years 1Dartmouth Refinery closure in September 2013
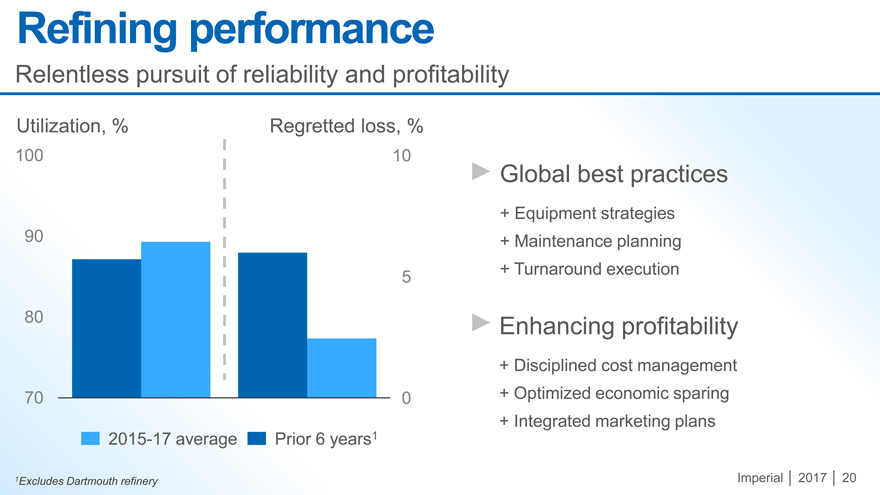
Imperial 2017 20 70 80 90 100 Refining performance Relentless pursuit of reliability and profitability Utilization, % Regretted loss, % Prior 6 years1 2015-17 average 1Excludes Dartmouth refinery Global best practices + Equipment strategies + Maintenance planning + Turnaround execution Enhancing profitability + Disciplined cost management + Optimized economic sparing + Integrated marketing plans
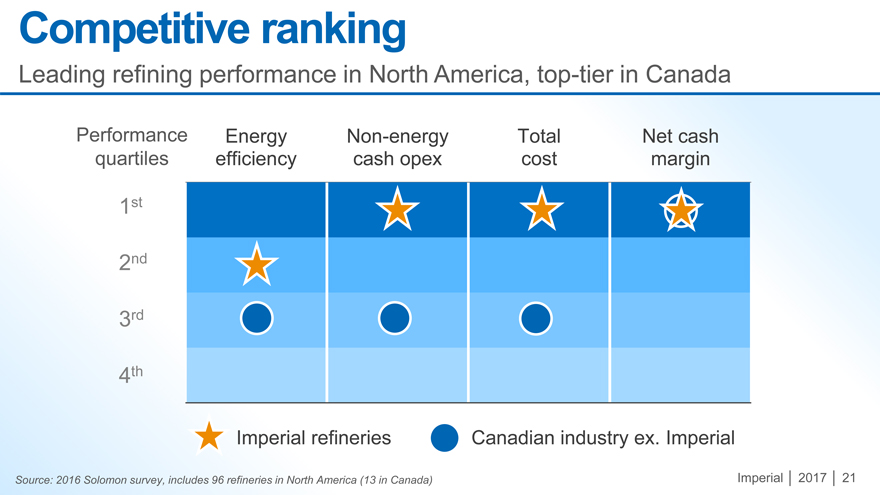
Imperial 2017 21 Source: 2016 Solomon survey, includes 96 refineries in North America (13 in Canada) Competitive ranking Leading refining performance in North America, top-tier in Canada Imperial refineries Canadian industry ex. Imperial 1st 2nd 3rd 4th Energyefficiency Non-energycash opex Totalcost Net cashmargin Performance quartiles
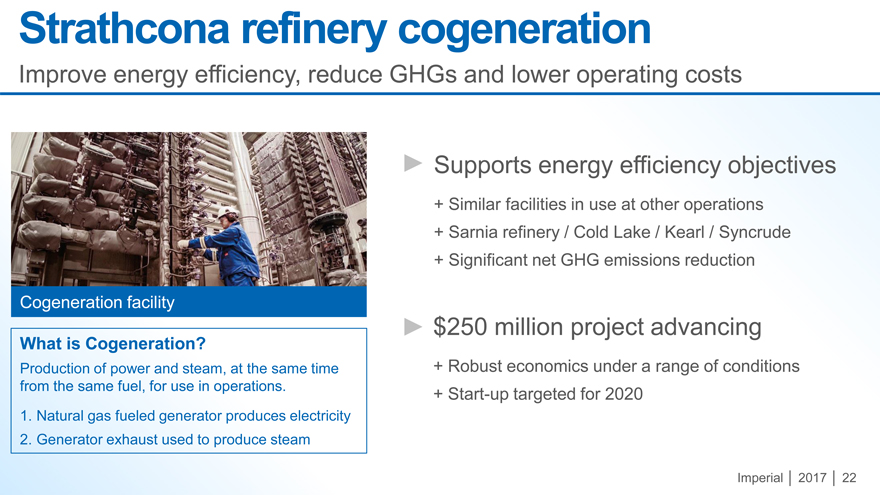
Imperial 2017 22 Strathcona refinery cogeneration Improve energy efficiency, reduce GHGs and lower operating costs Supports energy efficiency objectives + Similar facilities in use at other operations + Sarnia refinery / Cold Lake / Kearl / Syncrude + Significant net GHG emissions reduction $250 million project advancing + Robust economics under a range of conditions + Start-up targeted for 2020 What is Cogeneration? Production of power and steam, at the same time from the same fuel, for use in operations. 1.Natural gas fueled generator produces electricity 2.Generator exhaust used to produce steam Cogeneration facility
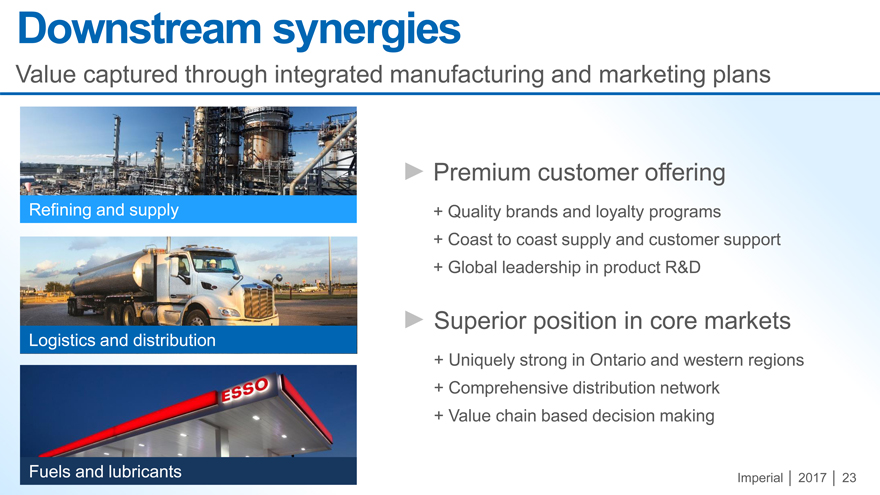
Imperial 2017 23 Refining and supply Downstream synergies Value captured through integrated manufacturing and marketing plans Superior position in core markets + Uniquely strong in Ontario and western regions + Comprehensive distribution network + Value chain based decision making Premium customer offering + Quality brands and loyalty programs + Coast to coast supply and customer support + Global leadership in product R&D Fuels and lubricants Logistics and distribution
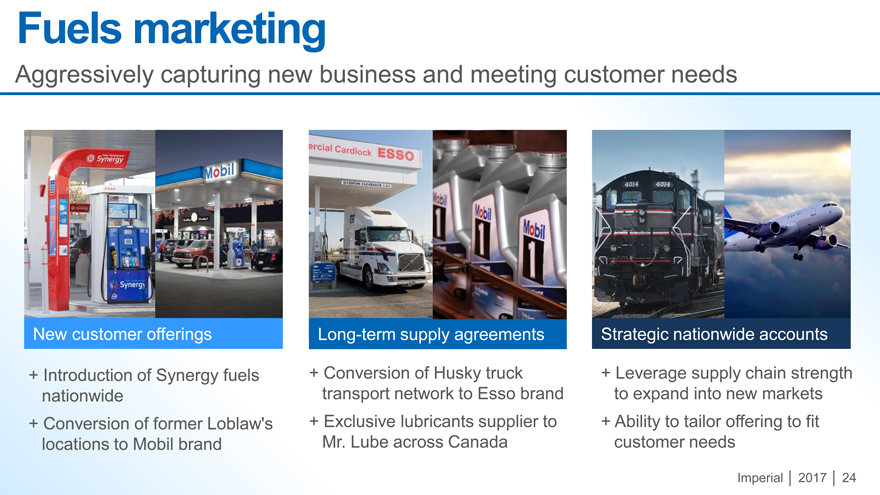
Imperial 2017 24 Fuels marketing Aggressively capturing new business and meeting customer needs New customer offerings Strategic nationwide accounts Long-term supply agreements + Introduction of Synergy fuels nationwide + Conversion of former Loblaw’s locations to Mobil brand + Conversion of Husky truck transport network to Esso brand + Exclusive lubricants supplier to Mr. Lube across Canada + Leverage supply chain strength to expand into new markets + Ability to tailor offering to fit customer needs
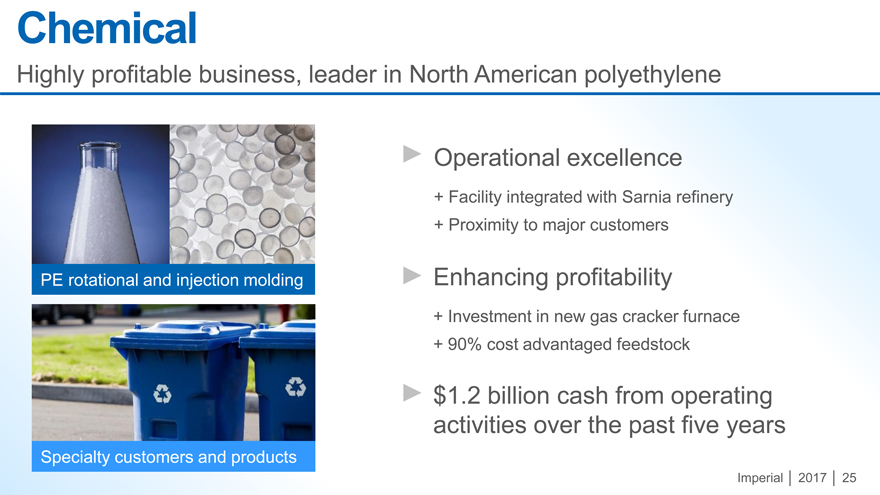
Imperial 2017 25 Chemical Highly profitable business, leader in North American polyethylene PE rotational and injection molding Specialty customers and products Operational excellence + Facility integrated with Sarnia refinery + Proximity to major customers Enhancing profitability + Investment in new gas cracker furnace + 90% cost advantaged feedstock $1.2 billion cash from operating activities over the past five years
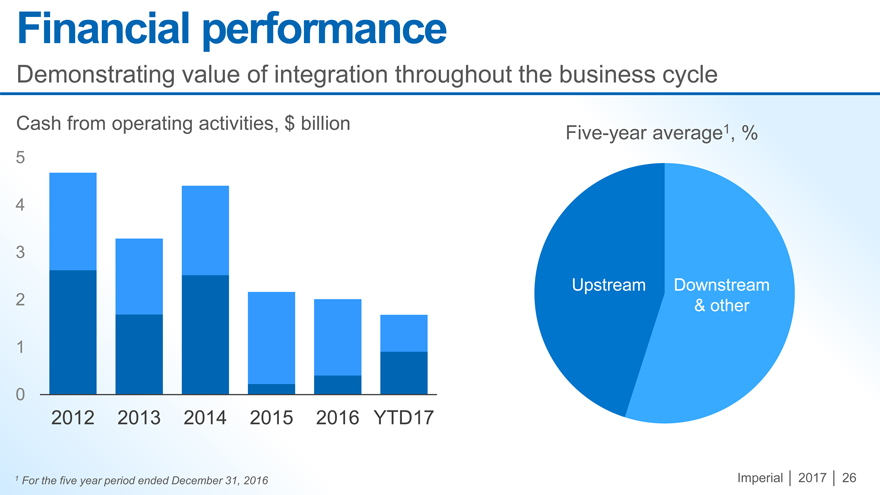
Demonstrating value of integration throughout the business cycle
Cash from operating activities, $ billion 1 Five-year average , % 5
4
3
2 Upstream Downstream & other
1
0
2012
2013 2014 2015 2016 YTD17
1 For the five year period ended December 31, 2016 Imperial 2017 26
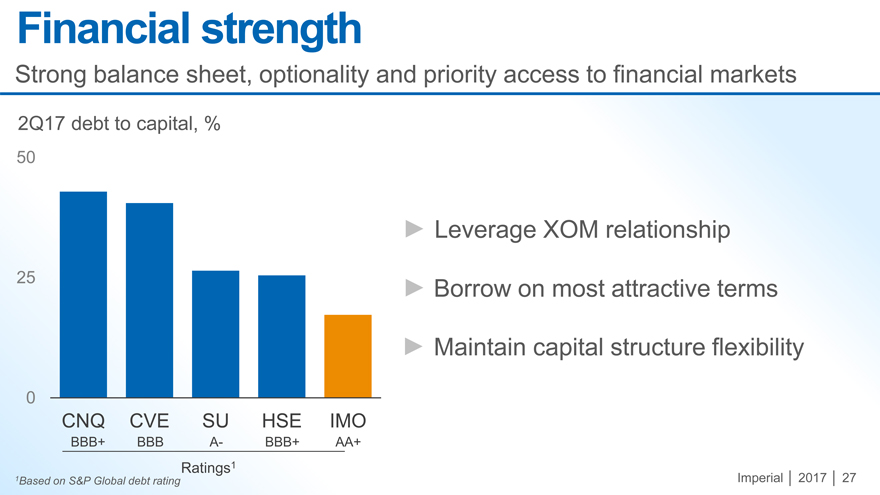
Financial strength
Strong
balance sheet, optionality and priority access to financial markets
2Q17 debt to capital, %
50
Leverage XOM relationship
25 Borrow on most attractive terms Maintain capital structure flexibility
0
CNQ CVE SU HSE IMO
BBB+ BBB A- BBB+ AA+
Ratings1
1Based on S&P Global debt rating Imperial 2017 27
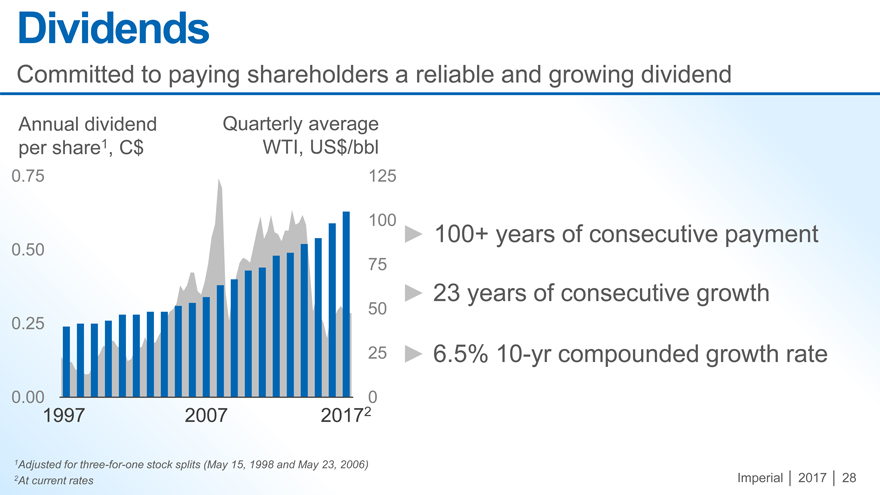
Dividends
Committed to
paying shareholders a reliable and growing dividend
Annual dividend Quarterly average per share1, C$ WTI, US$/bbl
0.75 125
100
100+ years of consecutive payment
0.50 75
23 years of consecutive growth
0.25 50
25 6.5% 10-yr compounded growth rate
0.00 0
1997 2007 20172
1Adjusted for three-for-one stock splits (May 15, 1998 and May 23, 2006)
2At current rates Imperial 2017 28
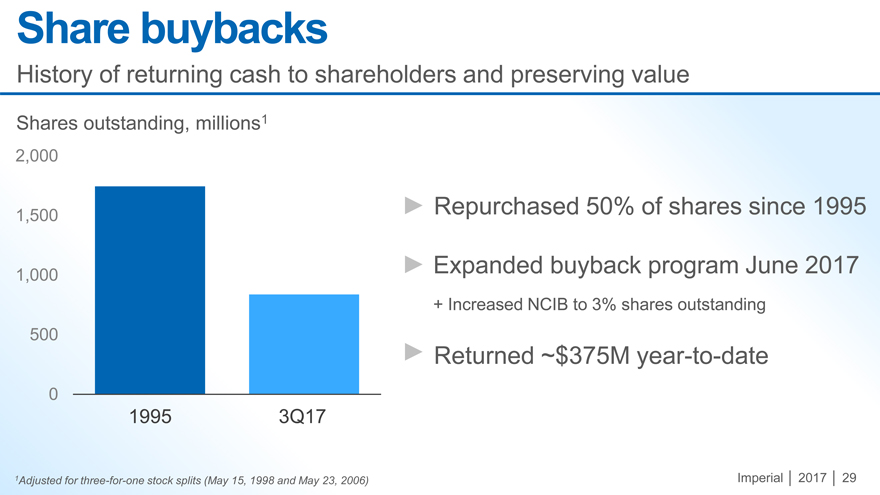
Share buybacks
History of
returning cash to shareholders and preserving value
Shares outstanding, millions1
2,000
1,500 Repurchased 50% of shares since 1995 1,000 Expanded buyback program June 2017
+ Increased NCIB to 3% shares outstanding 500
Returned ~$375M year-to-date
0
1995 3Q17
1Adjusted for three-for-one stock splits (May 15, 1998 and May 23, 2006) Imperial 2017 29
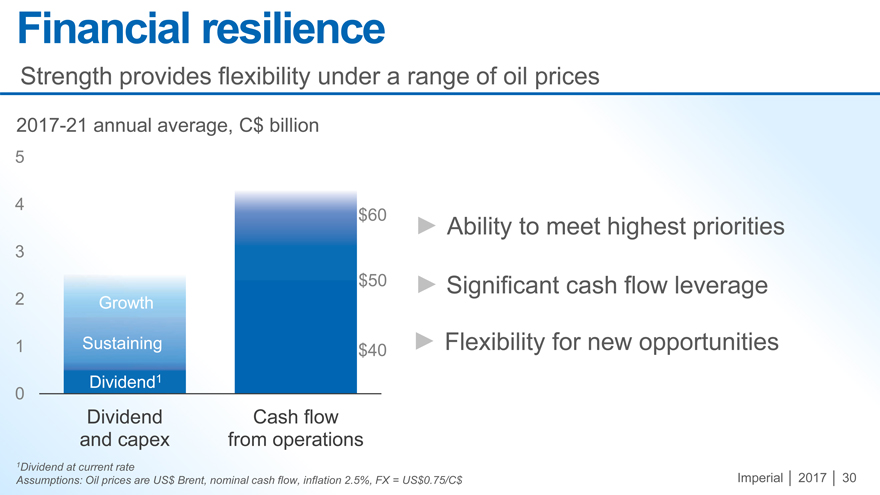
Financial resilience
Strength provides flexibility under a range of oil prices
2017-21 annual
average, C$ billion
5
4
$60 Ability to meet highest priorities
3
$50 Significant cash flow leverage
2 Growth
1 Sustaining $40 Flexibility for new opportunities
Dividend1 0
Dividend Cash flow and capex from operations
1Dividend at current rate
Assumptions: Oil prices are US$ Brent, nominal cash flow, inflation 2.5%, FX = US$0.75/C$ Imperial 2017 30
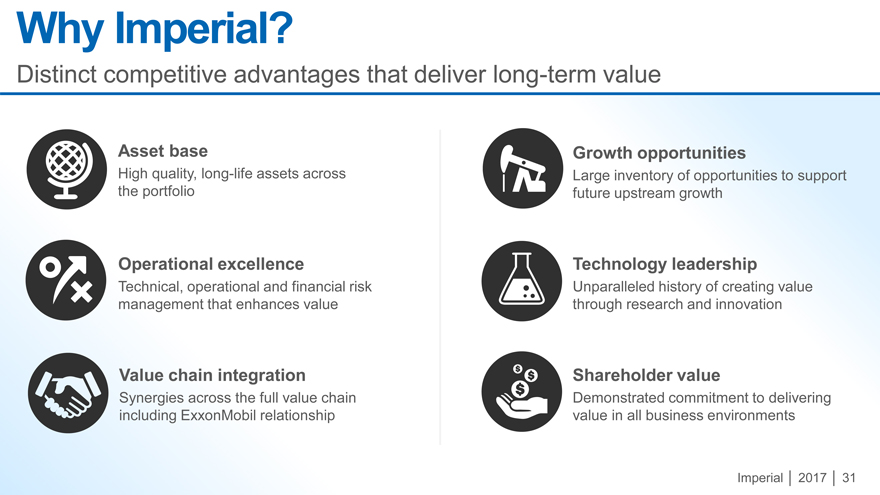
Why Imperial?
Distinct
competitive advantages that deliver long-term value
Asset base Growth opportunities
High quality, long-life assets across Large inventory of opportunities to support the portfolio future upstream growth
Operational excellence Technology leadership
Technical, operational and financial risk
Unparalleled history of creating value management that enhances value through research and innovation
Value chain integration Shareholder value
Synergies across the full value chain Demonstrated commitment to delivering including ExxonMobil relationship value in all business environments
Imperial 2017 31

Question period
For more information:
Dave Hughes
Manager, Investor Relations
+1 587.476.4743 dave.a.hughes@exxonmobil.com imperialoil.ca twitter.com/imperialOil linkedin.com/company/imperialOil youtube.com/imperialOil