Attached files
| file | filename |
|---|---|
| EX-99 - EX-99 - PUBLIC SERVICE ENTERPRISE GROUP INC | d485512dex99.htm |
| 8-K - FORM 8-K - PUBLIC SERVICE ENTERPRISE GROUP INC | d485512d8k.htm |
 Public
Service Enterprise Group PSEG Earnings Conference Call
3 rd Quarter 2017 October 31, 2017 EXHIBIT 99.1 |
| Forward-Looking Statements
Certain of the matters discussed in this presentation about our
and our subsidiaries’ future performance, including, without limitation, future revenues, earnings, strategies, prospects, consequences and all other statements that are not purely historical constitute “forward-looking statements”
within the meaning of the Private Securities Litigation Reform Act of 1995. Such forward-looking statements are subject to risks and uncertainties, which could cause actual results to differ
materially from those anticipated. Such statements are based on management’s beliefs as well as assumptions made by and information currently available to management. When used herein, the words
“anticipate,” “intend,” “estimate,” “believe,” “expect,” “plan,” “should,” “hypothetical,” “potential,” “forecast,” “project,” variations of such words and
similar expressions are intended to identify forward-looking statements. Factors that may cause actual results to differ are often presented with the forward-looking statements themselves. Other factors that could cause actual results to
differ materially from those contemplated in any forward-looking statements made by us herein are discussed in filings we make with the United States Securities and Exchange Commission (SEC) including our Annual Report on Form 10-K and subsequent reports on Form 10-Q and Form 8-K. These factors include, but are not limited to:
• fluctuations in wholesale power
and natural gas markets, including the potential impacts on the economic viability of our generation units; • our ability to obtain adequate fuel supply;
• any inability to manage our
energy obligations with available supply;
• increases in competition in
wholesale energy and capacity markets;
• changes in technology related to
energy generation, distribution and consumption and customer usage patterns; • economic downturns; • third party credit risk relating to our sale of generation output and purchase of
fuel; • adverse
performance of our decommissioning and defined benefit plan trust fund investments and changes in funding requirements; • changes in state and federal legislation and regulations;
• the impact of pending rate case
proceedings; •
regulatory, financial, environmental, health and safety risks associated with our ownership and operation of nuclear facilities; • adverse changes in energy industry laws, policies and regulations, including market
structures and transmission planning;
• changes in federal and state
environmental regulations and enforcement;
• delays in receipt of, or an
inability to receive, necessary licenses and permits;
• adverse outcomes of any legal,
regulatory or other proceeding, settlement, investigation or claim applicable to us and/or the energy industry; • changes in tax laws and regulations;
• the impact of our holding company
structure on our ability to meet our corporate funding needs, service debt and pay dividends; • lack of growth or slower growth in the number of customers or changes in customer
demand; • any
inability of Power to meet its commitments under forward sale obligations; • reliance on transmission facilities that we do not own or control and the impact on our
ability to maintain adequate transmission capacity;
• any inability to successfully
develop or construct generation, transmission and distribution projects; • any equipment failures, accidents, severe weather events or other incidents that impact our ability to provide safe and reliable service to our customers; • our inability to exercise control over the operations of generation facilities in which we
do not maintain a controlling interest;
• any inability to maintain
sufficient liquidity;
• any inability to realize
anticipated tax benefits or retain tax credits;
• challenges associated with
recruitment and/or retention of key executives and a qualified workforce; • the impact of our covenants in our debt instruments on our operations; and
• the impact of acts of terrorism,
cybersecurity attacks or intrusions. All of the
forward-looking statements made in this presentation are qualified by these cautionary statements and we cannot assure you that the results or developments anticipated by management
will be realized or even if realized, will have the expected
consequences to, or effects on, us or our business, prospects, financial condition, results of operations or cash flows. Readers are cautioned not to place undue reliance on these forward-looking statements in making any investment decision.
Forward-looking statements made in this presentation apply only as of the date of this presentation. While we may elect to update forward-looking statements from time to time, we specifically disclaim
any obligation to do so, even in light of new information or future events, unless otherwise required by applicable securities laws.
The forward-looking statements contained in this
presentation are intended to qualify for the safe harbor provisions of Section 27A of the Securities Act of 1933, as amended, and Section 21E of the Securities Exchange Act of 1934, as amended. 1 |
 GAAP
Disclaimer PSEG presents Operating Earnings and Adjusted Earnings Before
Interest, Taxes, Depreciation and Amortization (EBITDA) in addition to its
Net Income reported in accordance with accounting principles generally accepted in the United States (GAAP). Operating Earnings and Adjusted EBITDA are non-GAAP financial measures that differ from Net Income. Non-GAAP Operating
Earnings exclude the impact of returns (losses) associated with the Nuclear
Decommissioning Trust (NDT), Mark-to-Market (MTM) accounting and
material one-time items. Non-GAAP Adjusted EBITDA excludes the same items as our non-GAAP Operating Earnings measure as well as income tax expense, interest expense and depreciation and amortization. The last two slides in this
presentation (Slides A and B) include a list of items excluded from Net Income/(Loss)
to reconcile to non-GAAP Operating Earnings and non-GAAP Adjusted
EBITDA with a reference to those slides included on each of the slides where the non-GAAP information appears. Management uses non-GAAP Operating Earnings in its internal analysis, and in communications with investors and analysts, as a
consistent measure for comparing PSEG’s financial performance to previous
financial results. Management believes non-GAAP Adjusted EBITDA is
useful to investors and other users of our financial statements in evaluating operating performance because it provides them with an additional tool to compare business performance across companies and across periods. Management also
believes that non-GAAP Adjusted EBITDA is widely used by investors to measure
operating performance without regard to items such as income tax expense,
interest expense and depreciation and amortization, which can vary substantially from company to company depending upon, among other things, the book value of assets, capital structure and whether assets were constructed or
acquired. Non-GAAP Adjusted EBITDA also allows investors and other users to assess
the underlying financial performance of our fleet before
management’s decision to deploy capital. The presentation of non-GAAP Operating Earnings and non-GAAP Adjusted EBITDA is intended to complement, and should not be considered an alternative to, the presentation of Net Income, which is an
indicator of financial performance determined in accordance with GAAP. In addition,
non-GAAP Operating Earnings and non-GAAP Adjusted EBITDA as
presented in this release may not be comparable to similarly titled measures used by other companies. Due to the forward looking nature of non-GAAP Operating Earnings and non-GAAP Adjusted EBITDA guidance, PSEG is unable to
reconcile these non-GAAP financial measures to the most directly comparable GAAP
financial measure. Management is unable to project certain
reconciling items, in particular MTM and NDT gains (losses), for future periods due to market volatility. These materials and other financial releases can be found on the PSEG website at www.pseg.com, under the
Investors tab. From time to time, PSEG, PSE&G and PSEG Power release
important information via postings on their corporate website at http://investor.pseg.com. Investors and other interested parties are encouraged to
visit the corporate website to review new postings. The “email alerts” link
at http://investor.pseg.com may be
used to enroll to receive automatic email alerts and/or really simple
syndication (RSS) feeds regarding new postings at http://investor.pseg.com/rss. 2 |
 PSEG
2017 Q3 Review
Ralph Izzo Chairman, President and Chief Executive Officer |
 PSEG Q3 2017 – Solid results; executing well on major initiatives Third Quarter Highlights Net Income of $0.78 vs. Net Income of $0.64 per share in Q3 2016 Non-GAAP Operating Earnings* of $0.82 vs. $0.88 per share in Q3 2016 PSE&G results benefitted from increased investment in electric and gas transmission and distribution
PSEG Power results aided by continued cost control and improved nuclear
performance Unseasonably mild weather weighed on results of both
businesses Operational Excellence
Nuclear fleet achieved a capacity factor of ~96% for Q3 and ~95% for the
year-to-date 2017 period Disciplined Capital
Investment PSE&G investing ~$3.1 billion to upgrade transmission,
replace cast-iron pipe and improve the resilience of electric
distribution system in 2017 and PSEG Power investing ~$1.2 billion constructing three new, highly efficient gas-fired CCGTs Regulatory & Policy Focus FERC seeking response to Department of Energy (DOE) proposed rulemaking to preserve the viability
of fuel-secure, base load resources; Reply comments due November 7,
2017 Per Board of Public Utilities (BPU) agreement, PSE&G will delay
filing its Distribution Base Rate Case to no later than December 1, 2017;
decision by BPU on Infrastructure Investment Proposal expected by
year-end * See Slides A and B for Items excluded from Net
Income to reconcile to Operating Earnings (non-GAAP).
4 |
 PSEG Q3
Summary Quarter ended September
30 *See Slide A for
Items excluded from Net Income to reconcile to Operating Earnings (non-GAAP). 5 $ millions (except EPS) 2017 2016 Change Net Income $ 395 $ 327 $ 68 Reconciling Items 22 117 (95) Operating Earnings (non-GAAP)* $ 417 $ 444 $ (27) EPS from Net Income $ 0.78 $ 0.64 $ 0.14 EPS from Operating Earnings (non-GAAP)* $ 0.82 $ 0.88 $ (0.06) |
 PSEG
Year-to-Date Summary Nine Months ended September
30 *See Slide A for Items
excluded from Net Income to reconcile to Operating Earnings (non-GAAP).
6 $ millions (except EPS) 2017 2016 Change Net Income $ 618 $ 985 $ (367) Reconciling Items 581 211 (370) Operating Earnings (non-GAAP)* $ 1,199 $ 1,196 $ 3 EPS from Net Income $ 1.22 $ 1.94 $ (0.72) EPS from Operating Earnings (non-GAAP)* $ 2.36 $ 2.36 $ - |
 PSEG
- Executing on Regulatory and Policy Initiatives
NJ Distribution Base Rate Proceeding
Agreed to delay rate review filing by one month to no later than December 1,
2017 Long-Term Infrastructure Investment Platform
In July, PSE&G filed for a 5-year, $2.7 billion extension of the Gas System
Modernization Program (GSMP2)
In October, the BPU approved $69 million of PSE&G’s request to extend its
investment in Energy Efficiency (EE)
A final BPU decision on the Infrastructure Investment Program (IIP) providing for
5-year investment programs expected by year-end
PSE&G preparing a multi-year extension filing for Energy Strong in coming
months PSE&G developing a large, multi-year EE investment program
to bring benefits to a broader group of customers
Preserve the Value of Nuclear Supply
Advocating for legislative strategy to recognize the value of nuclear energy under
terms and conditions that provide proper incentives for long-term
operation Ensure Federal Regulatory and Policy Framework
FERC/PJM considering DOE Notice of Proposed Rulemaking (NOPR) issues of
Price Formation and fuel-secure resource preservation
7 |
 Growth
in utility infrastructure investment drives increased growth in regulated
earnings contribution $2.80 -
$3.00E PSEG - Maintaining 2017 Non-GAAP Earnings Guidance $2.90 Non-GAAP Operating Earnings* Contribution by Subsidiary and 2017 Guidance 2016 2017E** PSE&G Power Enterprise/Other 60% 66% 32% 35% 8 * See Slide A for Items excluded from Net Income to reconcile to Operating Earnings (non-GAAP).
** Based on the mid-point of 2017 non-GAAP Operating Earnings guidance of $2.80
- $3.00 per share. E = Estimate.
|
 PSEG
2017 Q3 Operating Company Review
Dan Cregg EVP and Chief Financial Officer |
 PSEG
– Q3 Results by Subsidiary
GAAP Net Income/(Loss) 2017 2016 Change PSE&G $ 0.49 $ 0.50 $ (0.01) PSEG Power $ 0.27 $ 0.27 $ - PSEG Enterprise/Other $ 0.02 $(0.13) $ 0.15 Total PSEG $ 0.78 $ 0.64 $ 0.14 Non-GAAP Operating Earnings* 2017 2016 Change PSE&G $ 0.49 $ 0.50 $ (0.01) PSEG Power $ 0.31 $ 0.34 $ (0.03) PSEG Enterprise/Other $ 0.02 $ 0.04 $ (0.02) Total PSEG* $ 0.82 $ 0.88 $ (0.06) *See Slides A and B for Items excluded from Net Income/(Loss) to reconcile to Operating Earnings (non-GAAP) for PSEG, PSEG Power and
PSEG Enterprise/Other.
PSEG Q3 EPS Summary –
Quarter ended September 30
10 |
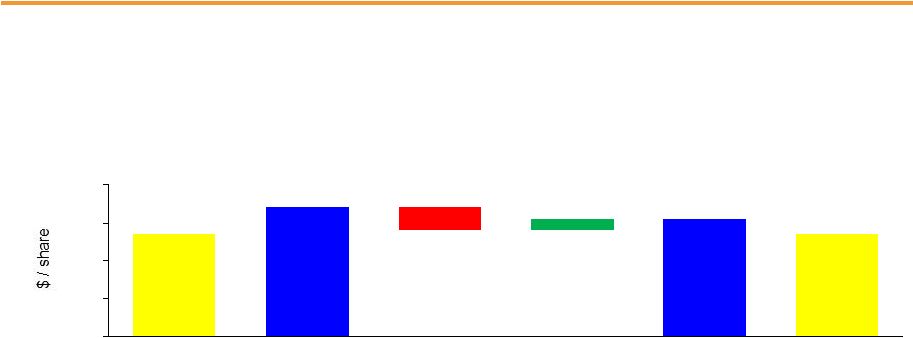
 PSEG EPS
Reconciliation – Q3 2017 versus Q3 2016
* See Slide A for Items excluded from Net Income to reconcile to Operating
Earnings (non-GAAP). Q3 2017
Net Income Q3 2016 Net Income PSEG Power PSE&G** Enterprise/ Other Q3 2016 Operating Earnings (non-GAAP)* Q3 2017 Operating Earnings (non-GAAP)* Utility investment, cost control and mild weather drive Q3 results Capacity 0.01 Lower Volume (0.02) Recontracting and Lower Prices (0.05) O&M 0.02 D&A, Interest and Taxes 0.01 Transmission 0.04 Energy Strong 0.02 Weather (0.03) Weather Norm Sales/ Demands (0.02) O&M 0.01 D&A (0.01) Taxes and Other (0.02) Absence of Tax Benefit and Interest Expense (0.02) (0.03) (0.01) $0.78 11 $0.64 $0.88 $0.82 $0.00 $0.20 $0.40 $0.60 $0.80 $1.00 ** Prior quarter results may not add to year-to-date totals due to rounding. |
 PSEG
– Year-to-Date Results by Subsidiary
GAAP Net Income/(Loss) 2017 2016 Change PSE&G $ 1.49 $ 1.37 $ 0.12 PSEG Power $ (0.26) $ 0.63 $ (0.89) PSEG Enterprise/Other $ (0.01) $ (0.06) $ 0.05 Total PSEG $ 1.22 $ 1.94 $ (0.72) Non-GAAP Operating Earnings* 2017 2016 Change PSE&G $ 1.49 $ 1.37 $ 0.12 PSEG Power $ 0.80 $ 0.88 $ (0.08) PSEG Enterprise/Other $ 0.07 $ 0.11 $ (0.04) Total PSEG* $ 2.36 $ 2.36 $ - PSEG YTD EPS Summary – Nine months ended September 30 12 *See Slides A and B for Items excluded from Net Income/(Loss) to reconcile to Operating Earnings (non-GAAP) for PSEG, PSEG Power and PSEG
Enterprise/Other. |
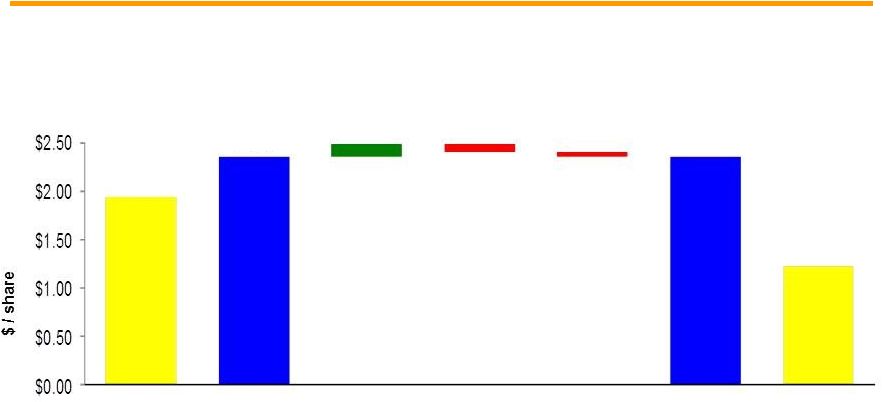 PSEG EPS
Reconciliation – YTD 2017 versus YTD 2016
• See Slide A for Items excluded from Net Income to reconcile to Operating Earnings (non-GAAP), Year-to-date columns.
Capacity 0.02 Higher Gas Send-out 0.02 Lower Volume (0.01) Recontracting and Lower Prices (0.18) O&M 0.07 Transmission 0.11 Electric and Gas Weather (0.03) Distribution O&M 0.03 Distribution D&A (0.02) Taxes and Other (0.02) YTD 2017 Net Income YTD 2016 Net Income PSEG Power PSE&G** Enterprise/ Other YTD 2016 Operating Earnings (non-GAAP)* YTD 2017 Operating Earnings (non-GAAP)* Interest Expense, Taxes and Other Utility investment and cost control drive year-to-date results (0.08) 0.12 (0.04) 13 $1.94 $2.36 $2.36 $1.22 Margin 0.05 ** Prior quarter results may not add to year-to-date totals due to rounding. |
 PSE&G 2017 Q3 Review |
 $0.50 0.01 0.00 $0.49 (0.02) 0.00 0.10 0.20 0.30 0.40 0.50 0.60 0.70 PSE&G EPS Reconciliation – Q3 2017 versus Q3 2016 Q3 2017 Net Income Q3 2016 Net Income Transmission 0.04 Energy Strong 0.02 Weather (0.03) Weather Norm Sales/Demands (0.02) O&M 0.01 D&A (0.01) Continued investment and cost containment contributed to margin, offset by mild weather Absence of Tax Benefit and Other 15 Prior quarter results may not add to year-to-date totals due to rounding |
 Q3 2017
weather significantly cooler than Q3 2016 and normal 2017
vs. 2016 vs. Normal PSE&G Monthly Weather Summary July August September Monthly Temperature Humidity Index (THI) Q3 2017 temperature-humidity index was ~27% lower than Q3 2016 and ~5% lower than normal Total Hours at 90°F or Higher Q3 2017 total hours at or above 90°F were 69% lower than Q3 2016 and 47% lower than normal 16 |
 PSE&G
– Q3 Highlights
PSE&G agreed to delay filing its distribution base rate case by one month to no
later than December 1; Filing will now be based on three months actual
and nine months forecasted data BPU decision on Infrastructure Investment
Program (IIP) proposal expected by year-end Filed for 2018 FERC
Formula Rate increase of $212 million to be effective January 1, 2018, reflects increase in transmission investment and a true-up of prior-year results
Anticipate filing a multi-year, Energy Strong extension and expansion program (ES2)
by year-end Operations
Regulatory and Market Environment PSE&G expects to invest approximately $3.1 billion of capital on its infrastructure in 2017, lower than the
plan of $3.4 billion due to a delay in timing on certain projects and better than
anticipated efficiencies PSE&G’s
2017 Net Income guidance range remains unchanged at $945 - $985 million Financial On a weather normalized basis, total electric sales were down slightly (0.6%) for the quarter and flat
for the trailing 12 months ended September 30
Q3 2017 weather was ~27% cooler than Q3 2016 and ~5% cooler than normal based on the
Temperature-Humidity Index; hot weather in late September (billed at
lower winter rates) was not enough to offset the mild August
17 |
 PSEG
Power 2017 Q3 Review |
 $0.27 $0.34 0.03 $0.31 $0.27 (0.06) 0.00 0.10 0.20 0.30 0.40 Capacity 0.01 Lower Volume (0.02) Recontracting and Lower Prices (0.05) PSEG Power EPS Reconciliation – Q3 2017 versus Q3 2016 O&M 0.02 D&A, Interest and Taxes 0.01 * See Slide B for Items excluded from Net Income/(Loss) to reconcile to non-GAAP Operating Earnings for PSEG Power.
Fewer outage-related days and cost control offset lower prices
Q3 2016
Operating Earnings* (non-GAAP) Q3 2017 Operating Earnings* (non-GAAP) Q3 2017 Net Income Q3 2016 Net Income 19 |
 PSEG Power
– Q3 Generation down 6% in response to mild weather
Total Nuclear Total Coal** Natural Gas * Excludes solar and Kalaeloa. ** Includes figures for Pumped Storage.
PSEG Power – Generation (GWh)* 14,110 13,304 PSEG Power – Capacity Factors (%) PSEG Power – Fuel Costs 20 6,863 8,209 1,493 1,242 5,754 3,853 0 5,000 10,000 15,000 2016 2017 Quarter ended September 30 2016 2017 Combined Cycle PJM and NY 73.6% 51.0% Coal** PA 69.8% 73.9% CT 5.4% 1.3% Nuclear 80.2% 96.1% Quarter ended September 30 ($ millions) 2016 2017 Gas $ 83 $ 63 Coal $ 29 $ 27 Total Fossil $ 112 $ 90 Nuclear $ 49 $ 51 Total Fuel Cost $ 161 $ 141 Total Generation (GWh ) 14,110 13,304 $ / MWh 11.41 10.60 |
 PSEG Power
– YTD Generation down 2% in response to mild weather
Total Nuclear Total Coal** Natural Gas * Excludes solar and Kalaeloa. ** Includes figures for Pumped Storage.
PSEG Power – Generation (GWh)* 39,756 39,090 PSEG Power – Capacity Factors (%) PSEG Power – Fuel Costs 21 22,265 24,130 3,432 4,036 14,059 10,924 0 10,000 20,000 30,000 40,000 2016 2017 Nine months ended September 30 2016 2017 Combined Cycle PJM and NY 62.5% 49.3% Coal** PA 61.9% 79.6% CT 3.8% 3.8% Nuclear 87.5% 95.2% Nine months ended September 30 ($ millions) 2016 2017 Gas $ 215 $ 224 Coal $ 78 $ 92 Total Fossil $ 293 $ 316 Nuclear $ 154 $ 153 Total Fuel Cost $ 447 $ 469 Total Generation (GWh)
39,756 39,090 $ / MWh 11.24 12.00 |
 PSEG Power
– Gross Margin Performance
$0 $10 $20 $30 $40 $50 2015 2016 2017 $40 Quarter ended September 30 Mild Summer weather tempered demand, energy prices and generation output PS Zone basis improved over Q3 2016, despite lower pricing Capacity revenues up slightly vs. Q3 2016 reflecting a step-up in New England
capacity pricing to $232 MW/day
Regional spark spreads compressed in the quarter
Regional Performance Region Q3 Gross Margin ($M) Q3 2017 Performance PJM $486 Lower prices and lower generation influenced by mild Summer weather New England $24 Higher capacity revenues offset lower generation and lower market prices New York $25 Higher generation was offset by decline in average hedge price and market prices PSEG Power Gross Margin ($/MWh) $42 $42 22 |
 Hedging
Update – Forecast of output unchanged
Contracted Energy* * HEDGE PERCENTAGES AND PRICES AS OF SEPTEMBER 30, 2017. REVENUES OF FULL REQUIREMENT LOAD DEALS BASED ON CONTRACT PRICE, INCLUDING
RENEWABLE ENERGY CREDITS,
ANCILLARY, AND TRANSMISSION COMPONENTS BUT EXCLUDING CAPACITY. HEDGES INCLUDE POSITIONS WITH MTM ACCOUNTING TREATMENT AND OPTIONS. 23 Oct-Dec 2017 2018 2019 Volume TWh 8 35 35 Base Load % Hedged 100% 100% 50-55% (Nuclear and Base Load Coal) Price $/MWh $45 $41 $39 Volume TWh 3 18 25 Intermediate, Combined Cycle, % Hedged 50-55% 10-15% 0% Peaking Price $/MWh $45 $41 $ - Volume TWh 10-12 52-54 58-60 Total % Hedged 85-90% 70-75% 30-35% Price $/MWh $45 $41 $39 |
 PSEG Power
– Q3 Highlights
Q3 output down 6% reflecting mild weather and lower energy prices
Nuclear fleet achieved average capacity factor of 96.1% in Q3, producing
8.2 TWh of energy CCGT fleet capacity factor was 51.0% versus 73.6% in Q3
2016, reflecting lower demand; CCGT availability remained strong at ~97%
and produced 3.7 TWh of energy Coal capacity factor up 4% in PA on higher
market demand, coal fleet produced 1.2 TWh of energy Operations
Regulatory and Market Environment Financial Department of Energy support of fuel secure, base load generation directs the Federal Energy Regulatory
Commission to address price formation issues in a timely and constructive manner
Court actions in New York and Illinois affirm state initiatives in
support of baseload nuclear generation 2017
expected generation output on track for 49-50 TWh; BGS load projected at 11 TWh Construction on schedule and on budget at Keys and Sewaren 7 for targeted 2018 in-service;
Bridgeport Harbor 5 progressing on schedule and on budget for targeted 2019 operations
Power’s total debt as a percentage of capitalization at September 30
was 31% Power’s
2017 non-GAAP Operating Earnings guidance range remains unchanged at $435 - $510 million; non-GAAP Adjusted EBITDA guidance for 2017 remains unchanged at $1,080 to $1,210 million
24 |
 PSEG |
 PSEG
Financial Highlights Reiterating
2017 non-GAAP Operating Earnings guidance of $2.80 - $3.00 per share PSE&G earnings forecast to grow 8.5% to comprise 66% of PSEG’s 2017
non-GAAP Operating Earnings
PSEG’s 5-Year capital spending forecast of $15 billion over 2017
– 2021
to be invested in PSE&G (82%) and Power (18%)
PSE&G successfully executing regulatory/policy initiatives: Additional
capital spend outlined since the March Investor Conference (GSMP2,
upcoming filings for Energy Strong and Energy Efficiency) provides
greater support for achieving the high end of its five-year, 7
- 9% annual growth in rate base over the 2017-2021 period
PSEG Power’s $2 billion investment in new generation, located in
PJM and New England, will improve fleet efficiency and geographic
diversity Increased 2017 indicative common dividend by 4.9% to $1.72 per
share Financial position remains strong:
Cash from Power and increasing cash flow from operations at PSE&G
supports dividend growth and funds capital spending program without the
need to issue equity Debt as a percentage of capitalization was 49% at
September 30 26 |
 PSEG 2017
Guidance - By Subsidiary -
Unchanged $ millions (except EPS) 2017E 2016 PSE&G (Net Income) $945 - $985 $889 PSEG Power $435 - $510 $514 PSEG Enterprise/Other $35 - $35 $72 Operating Earnings (non-GAAP)* $1,415 - $1,530 $1,475 Operating EPS (non-GAAP)* $2.80 - $3.00E $2.90 Segment Operating Earnings Guidance and Prior Results (non-GAAP, except as noted)* $ millions 2017E 2016 PSEG Power $1,080 - $1,210 $1,201 PSEG Power Adjusted EBITDA (non-GAAP)* * See Slide A for Items excluded from Net Income to reconcile to Operating Earnings (non-GAAP) and Slide B for Items excluded from Net
Income/(Loss) to reconcile to Operating Earnings (non-GAAP) and
Adjusted EBITDA (non-GAAP). E = Estimate. 27
|
 PSEG
Liquidity as of September 30, 2017 28 |
 Reconciliation of Non-GAAP Operating Earnings
Please see Slide 2 for an explanation of PSEG’s use of Operating Earnings as a
non-GAAP financial measure and how it differs from Net
Income. A |
 Reconciliation of Non-GAAP Operating Earnings and Non-GAAP
Adjusted EBITDA Please see Slide 2 for an explanation of PSEG’s use of Operating Earnings and Adjusted EBITDA as non-GAAP financial measures and how
they differ from Net Income/(Loss). B |