Attached files
| file | filename |
|---|---|
| 8-K - FORM 8-K - POPULAR, INC. | d456669d8k.htm |
Exhibit 99.1

Investor Presentation Third Quarter 2017
Cautionary Note Regarding Forward-Looking Statements
This presentation contains “forward-looking statements” within the meaning of the U.S. Private Securities Litigation Reform Act of 1995, including without limitation those about Popular, Inc.’s (the “Corporation,” “Popular,” “us,” “our”) business, financial condition, results of operations, plans, objectives, and future performance. These statements are not guarantees of future performance, are based on management’s current expectations and, by their nature, involve risks, uncertainties, estimates and assumptions. Potential factors, some of which are beyond the Corporation’s control, could cause actual results to differ materially from those expressed in, or implied by, such forward-looking statements. Risks and uncertainties include without limitation the effect of competitive and economic factors, and our reaction to those factors, the adequacy of the allowance for loan losses, delinquency trends, market risk and the impact of interest rate changes, capital market conditions, capital adequacy and liquidity, the effect of legal proceedings and new accounting standards on the Corporation’s financial condition and results of operations, and the impact of Hurricanes Irma and Maria on us. All statements contained herein that are not clearly historical in nature, are forward-looking, and the words “anticipate,” “believe,” “continues,” “expect,” “estimate,” “intend,” “project” and similar expressions, and future or conditional verbs such as “will,” “would,” “should,” “could,” “might,” “can,” “may” or similar expressions, are generally intended to identify forward-looking statements. More information on the risks and important factors that could affect the Corporation’s future results and financial condition is included in our Annual Report on Form 10-K for the year ended December 31, 2016, the Quarterly Reports on Form 10-Q for the quarters ended March 31, 2017 and June 30, 2017, and in our Quarterly Report on Form 10-Q for the quarter ended September 30, 2017 to be filed with the SEC. Those filings are available on the Corporation’s website (www.popular.com) and on the Securities and Exchange Commission website (www.sec.gov). The Corporation assumes no obligation to update or revise any forward-looking statements or information which speak as of their respective dates.
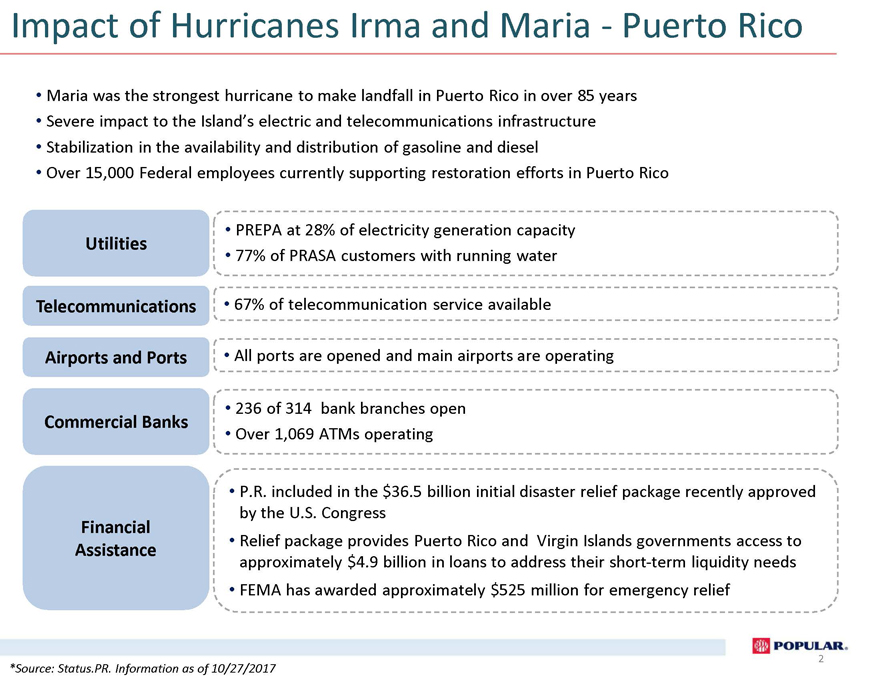
Impact of Hurricanes Irma and Maria—Puerto Rico • Maria was the strongest hurricane to make landfall in Puerto Rico in over 85 years • Severe impact to the Island’s electric and telecommunications infrastructure • Stabilization in the availability and distribution of gasoline and diesel • Over 15,000 Federal employees currently supporting restoration efforts in Puerto Rico Utilities Telecommunications Airports and Ports Commercial Banks Financial Assistance • PREPA at 28% of electricity generation capacity • 77% of PRASA customers with running water • 67% of telecommunication service available • All ports are opened and main airports are operating • 236 of 314 bank branches open • Over 1,069 ATMs operating • P.R. included in the $36.5 billion initial disaster relief package recently approved by the U.S. Congress • Relief package provides Puerto Rico and Virgin Islands governments access to approximately $4.9 billion in loans to address their short-term liquidity needs • FEMA has awarded approximately $525 million for emergency relief *Source: Status.PR. Information as of 10/27/2017 2
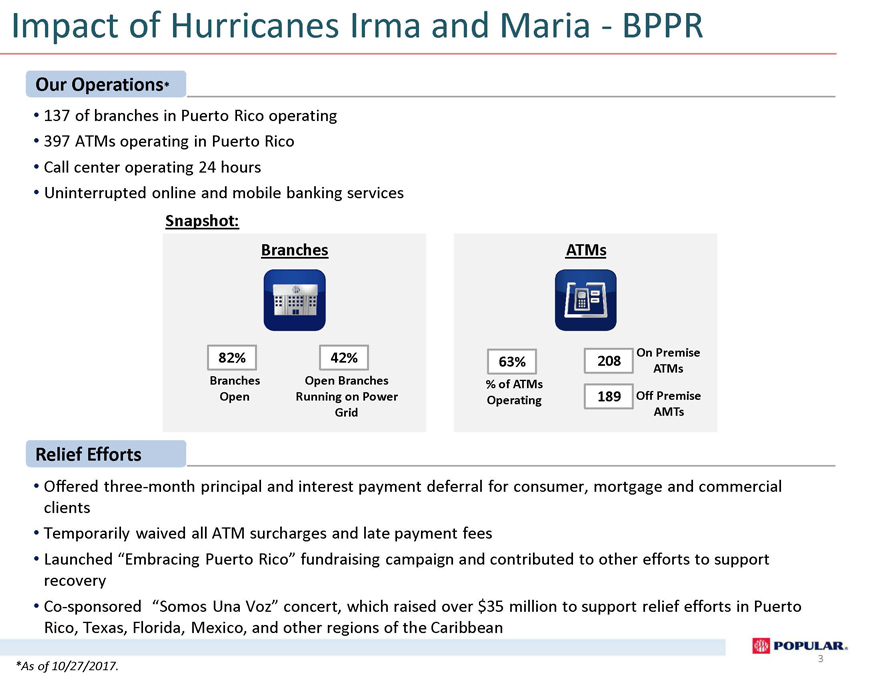
Impact of Hurricanes Irma and Maria—BPPR Our Operations* • 137 of branches in Puerto Rico operating • 397 ATMs operating in Puerto Rico • Call center operating 24 hours • Uninterrupted online and mobile banking services Snapshot: Branches ATMs 82% 42% On Premise 63% 208 ATMs Branches Open Branches % of ATMs Open Running on Power Operating 189 Off Premise Grid AMTs Relief Efforts • Offered three-month principal and interest payment deferral for consumer, mortgage and commercial clients • Temporarily waived all ATM surcharges and late payment fees • Launched “Embracing Puerto Rico” fundraising campaign and contributed to other efforts to support recovery • Co-sponsored “Somos Una Voz” concert, which raised over $35 million to support relief efforts in Puerto Rico, Texas, Florida, Mexico, and other regions of the Caribbean 4 *As of 10/27/2017. 3
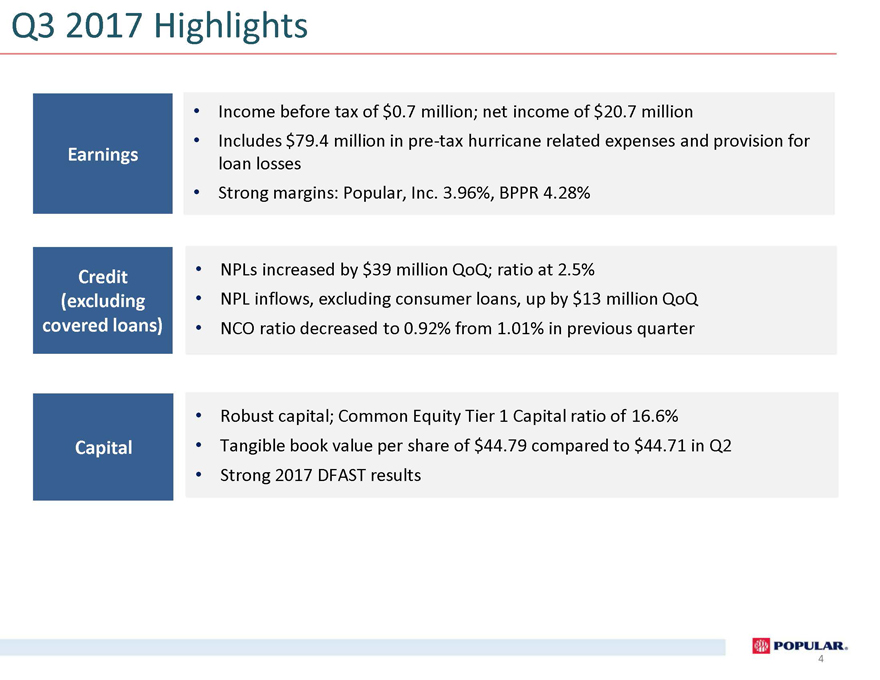
Q3 2017 Highlights Earnings Credit (excluding covered loans) Capital • Income before tax of $0.7 million; net income of $20.7 million • Includes $79.4 million in pre-tax hurricane related expenses and provision for loan losses • Strong margins: Popular, Inc. 3.96%, BPPR 4.28% • NPLs increased by $39 million QoQ; ratio at 2.5% • NPL inflows, excluding consumer loans, up by $13 million QoQ • NCO ratio decreased to 0.92% from 1.01% in previous quarter • Robust capital; Common Equity Tier 1 Capital ratio of 16.6% • Tangible book value per share of $44.79 compared to $44.71 in Q2 • Strong 2017 DFAST results 2
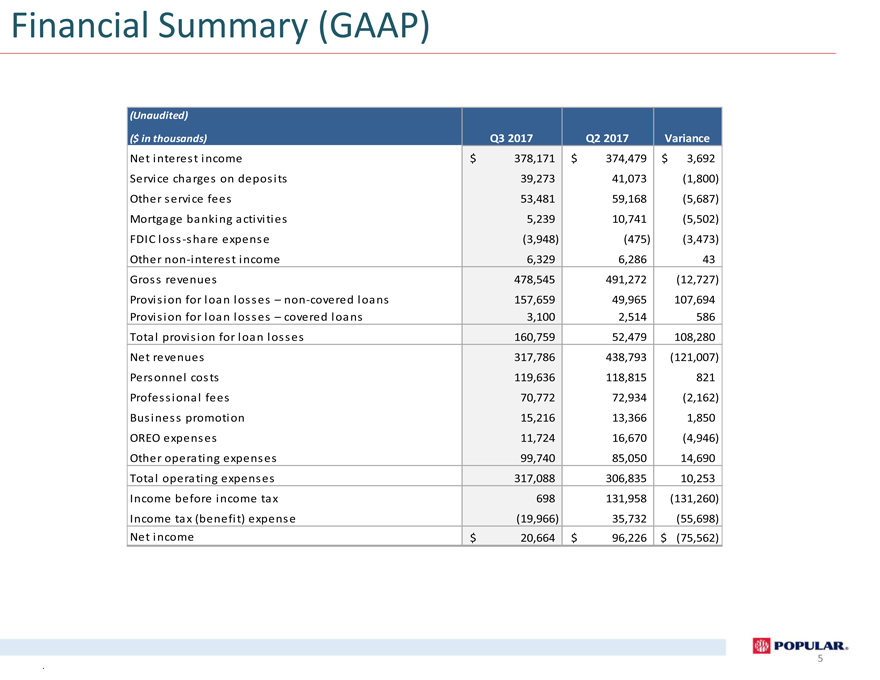
Financial Summary (GAAP) (Unaudited) ($ in thousands)Q3 2017Q2 2017Variance Net interest income$378,171$374,479$3,692 Service charges on deposits39,27341,073(1,800) Other service fees53,48159,168(5,687) Mortgage banking activities5,23910,741(5,502) FDIC loss -share expense(3,948)(475)(3,473) Other non -interest income6,3296,28643 Gross revenues478,545491,272(12,727) Provision for loan losses– non -covered loans157,65949,965107,694 Provision for loan losses– covered loans3,1002,514586 Total provision for loan losses160,75952,479108,280 Net revenues317,786438,793(121,007) Personnel costs119,636118,815821 Professional fees70,77272,934(2,162) Business promotion15,21613,3661,850 OREO expenses11,72416,670(4,946) Other operating expenses99,74085,05014,690 Total operating expenses317,088306,83510,253 Income before income tax698131,958(131,260) Income tax (benefit) expense(19,966)35,732(55,698) Net income$20,664$96,226$(75,562) 5
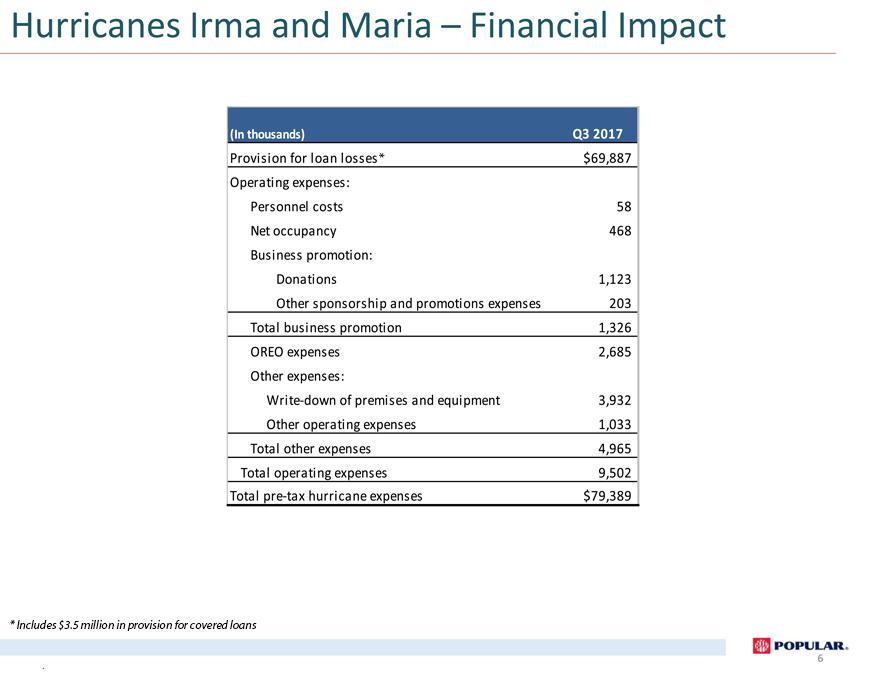
Hurricanes Irma and Maria – Financial Impact (In thousands) Q3 2017 Provision for loan losses $69,887 Operating expenses: Personnel costs58 Net occupancy468 Business promotion: Donations1,123 Other sponsorship and promotions expenses203 Total business promotion1,326 OREO expenses2,685 Other expenses: Write-down of premises and equipment3,932 Other operating expenses1,033 Total other expenses4,965 Total operating expenses9,502 Total pre-tax hurricane expenses$79,389 6 * Includes $3.5 million in provision for covered loans
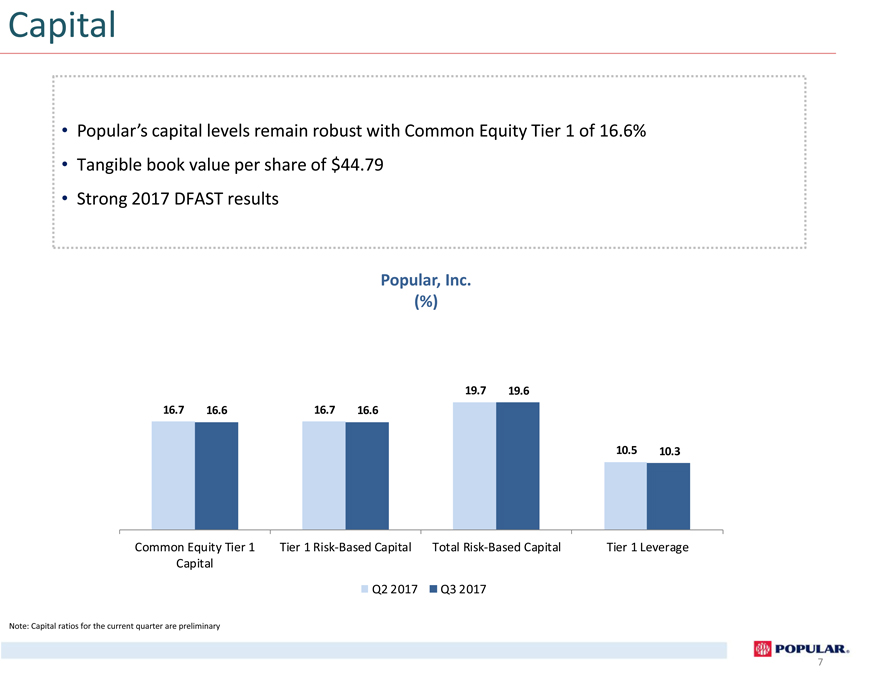
Capital • Popular’s capital levels remain robust with Common Equity Tier 1 of 16.6% • Tangible book value per share of $44.79 • Strong 2017 DFAST results Popular, Inc. (%) 19.7 19.6 16.7 16.6 16.7 16.6 10.5 10.3 Common Equity Tier 1 Tier 1 Risk-Based Capital Total Risk-Based Capital Tier 1 Leverage Capital Q2 2017 Q3 2017 Note: Capital ratios for the current quarter are preliminary 7
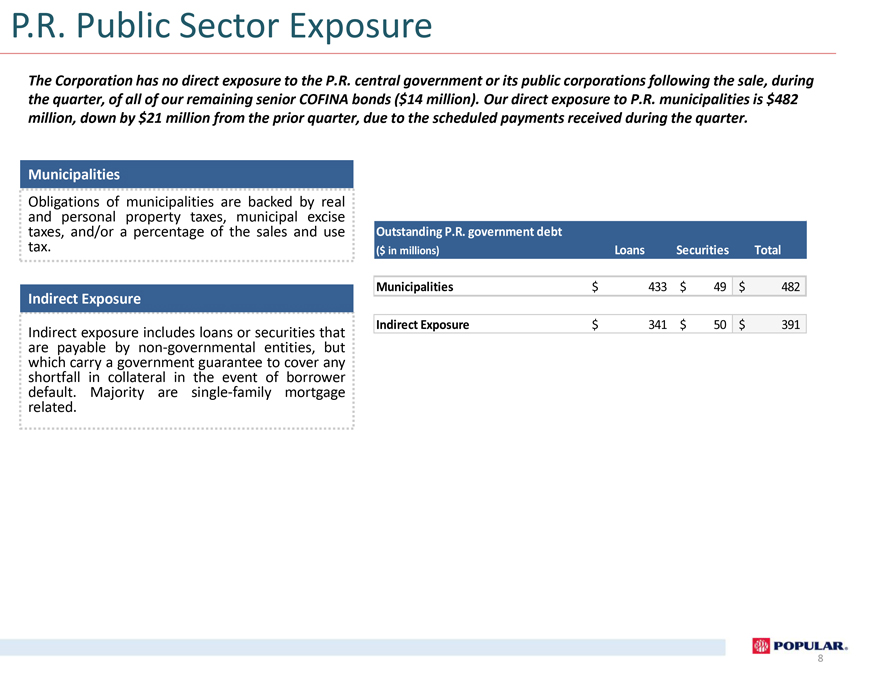
P.R. Public Sector Exposure The Corporation has no direct exposure to the P.R. central government or its public corporations following the sale, during the quarter, of all of our remaining senior COFINA bonds ($14 million). Our direct exposure to P.R. municipalities is $482 million, down by $21 million from the prior quarter, due to the scheduled payments received during the quarter. Municipalities Obligations of municipalities are backed by real and personal property taxes, municipal excise taxes, and/or a percentage of the sales and use tax. Indirect Exposure Indirect exposure includes loans or securities that are payable by non-governmental entities, but which carry a government guarantee to cover any shortfall in collateral in the event of borrower default. Majority are single-family mortgage related. Outstanding P.R. government debt ($ in millions)LoansSecuritiesTotal Municipalities$433$49$482 Indirect Exposure$341$50$391 8
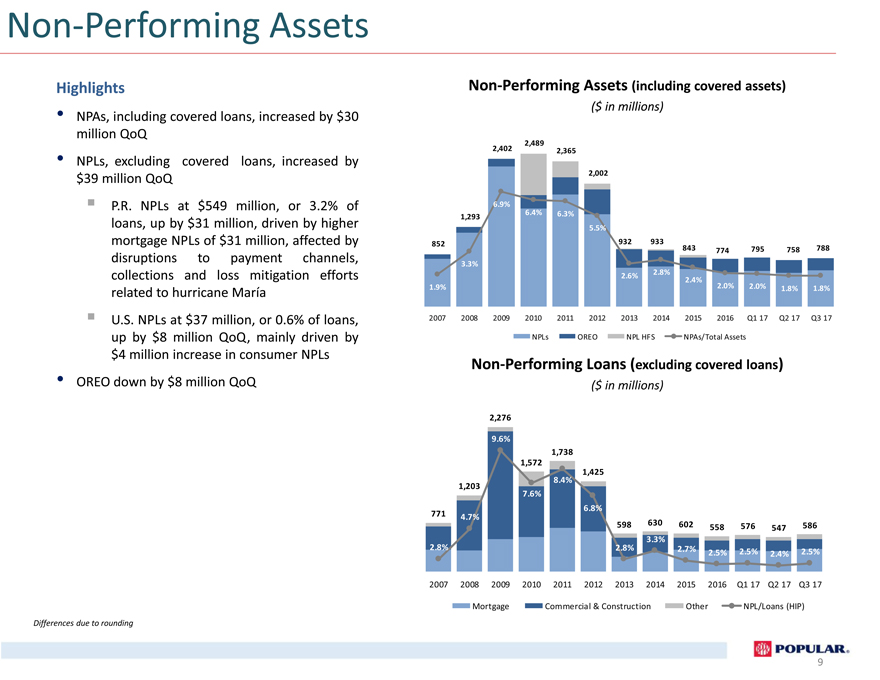
Non-Performing Assets Highlights • NPAs, including covered loans, increased by $30 million QoQ • NPLs, excluding covered loans, increased by $39 million QoQ P.R. NPLs at $549 million, or 3.2% of loans, up by $31 million, driven by higher mortgage NPLs of $31 million, affected by disruptions to payment channels, collections and loss mitigation efforts related to hurricane María U.S. NPLs at $37 million, or 0.6% of loans, up by $8 million QoQ, mainly driven by $4 million increase in consumer NPLs • OREO down by $8 million QoQ Differences due to rounding Non-Performing Assets (including covered assets) ($ in millions) 2,489 2,402 2,365 2,002 6.9% 6.4% 6.3% 1,293 5.5% 852 932 933 843 788 774 795 758 3.3% 2.8% 2.6% 2.4% 2.0% 2.0% 1.9% 1.8% 1.8% 2007 2008 2009 2010 2011 2012 2013 2014 2015 2016 Q1 17 Q2 17 Q3 17 NPLs OREO NPL HFS NPAs/Total Assets Non-Performing Loans (excluding covered loans) ($ in millions) 2,500 12.0% 2,276 9.6% 1,738 10.0% 1,572 1,425 1,500 8.4% 8.0% 1,203 7.6% 6.8% 6.0% 771 4.7% 598 630 602 586 558 576 547 500 3.3% 4.0% 2.8% 2.8% 2.7% 2.5% 2.5% 2.4% 2.5% 2.0% 2007 2008 2009 2010 2011 2012 2013 2014 2015 2016 Q1 17 Q2 17 Q3 17 (500) Mortgage Commercial & Construction Other NPL/Loans (HIP) 0.0% 9
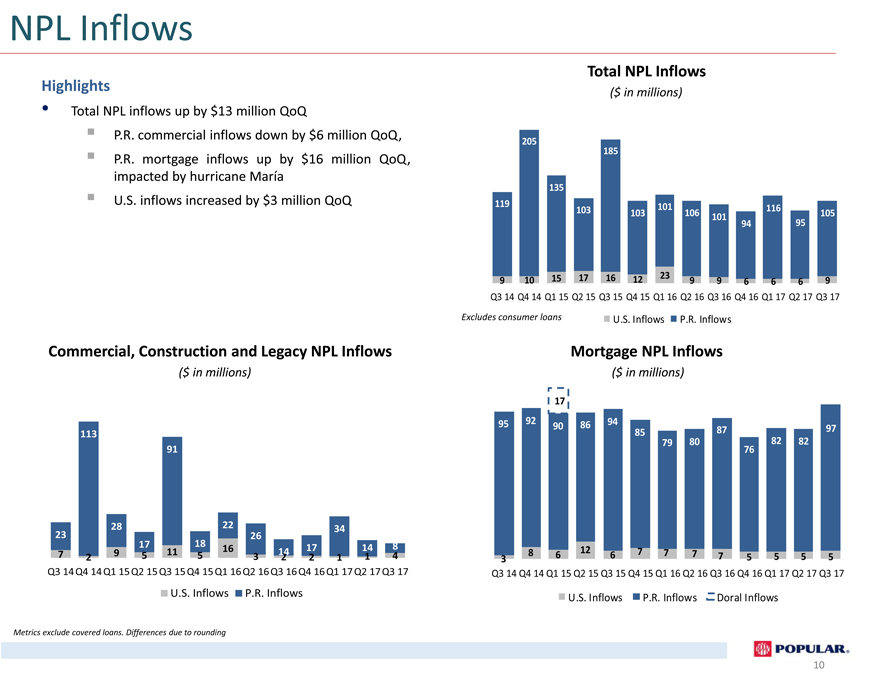
NPL Inflows Highlights • Total NPL inflows up by $13 million QoQ P.R. commercial inflows down by $6 million QoQ, P.R. mortgage inflows up by $16 million QoQ, impacted by hurricane María U.S. inflows increased by $3 million QoQ Commercial, Construction and Legacy NPL Inflows ($ in millions) 113 91 28 22 34 23 26 17 18 8 16 17 14 7 9 5 11 5 14 2 3 2 2 1 1 4 Q3 14Q4 14Q1 15Q2 15Q3 15Q4 15Q1 16Q2 16Q3 16Q4 16Q1 17Q2 17Q3 17 U.S. Inflows P.R. Inflows Metrics exclude covered loans. Differences due to rounding Total NPL Inflows ($ in millions) 205 185 135 119 101 103 116 103 106 105 101 94 95 15 17 16 23 9 10 12 9 9 6 6 6 9 Q3 14 Q4 14 Q1 15 Q2 15 Q3 15 Q4 15 Q1 16 Q2 16 Q3 16 Q4 16 Q1 17 Q2 17 Q3 17 Excludes consumer loans U.S. Inflows P.R. Inflows Mortgage NPL Inflows ($ in millions) 17 95 92 94 90 86 97 85 87 79 80 82 82 76 8 12 7 7 7 3 6 6 7 5 5 5 5 Q3 14 Q4 14 Q1 15 Q2 15 Q3 15 Q4 15 Q1 16 Q2 16 Q3 16 Q4 16 Q1 17 Q2 17 Q3 17 U.S. Inflows P.R. Inflows Doral Inflows 10
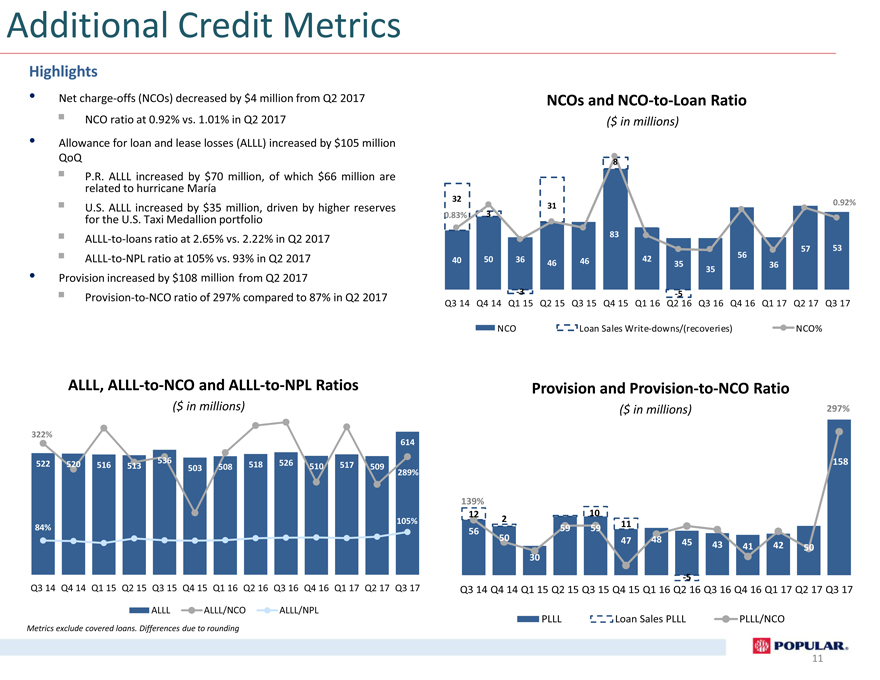
Additional Credit Metrics Highlights • Net charge-offs (NCOs) decreased by $4 million from Q2 2017 NCO ratio at 0.92% vs. 1.01% in Q2 2017 • Allowance for loan and lease losses (ALLL) increased by $105 million QoQ P.R. ALLL increased by $70 million, of which $66 million are related to hurricane María U.S. ALLL increased by $35 million, driven by higher reserves for the U.S. Taxi Medallion portfolio ALLL-to-loans ratio at 2.65% vs. 2.22% in Q2 2017 ALLL-to-NPL ratio at 105% vs. 93% in Q2 2017 • Provision increased by $108 million from Q2 2017 Provision-to-NCO ratio of 297% compared to 87% in Q2 2017 ALLL, ALLL-to-NCO and ALLL-to-NPL Ratios ($ in millions) 322% $ 614 522 536 526 520 516 513 508 518 510 517 509 503 289% $ 105% 84% $ Q3 14 Q4 14 Q1 15 Q2 15 Q3 15 Q4 15 Q1 16 Q2 16 Q3 16 Q4 16 Q1 17 Q2 17 Q3 17 ALLL ALLL/NCO ALLL/NPL Metrics exclude covered loans. Differences due to rounding -$ NCOs and NCO-to-Loan Ratio ($ in millions) 8 32 31 0.92% 0 0.83% 3 0 83 56 57 53 40 50 36 46 42 46 35 36 35 -3 -5 Q3 14 Q4 14 Q1 15 Q2 15 Q3 15 Q4 15 Q1 16 Q2 16 Q3 16 Q4 16 Q1 17 Q2 17 Q3 17 NCO Loan Sales Write-downs/(recoveries) NCO% Q3 14 Q4 14 Q1Provision 15 Q2 15 Q3 15 and Q4 15 Provision Q1 16 Q2 16 -to Q3—NCO 16 Q4 16 Ratio Q1 17 Q2 17 Q3 17 ($ in millions) 297% 0 158 139% 12 10 2 11 56 59 59 50 47 48 45 43 42 41 50 30 0 -5 Q3 14 Q4 14 Q1 15 Q2 15 Q3 15 Q4 15 Q1 16 Q2 16 Q3 16 Q4 16 Q1 17 Q2 17 Q3 17 PLLL Loan Sales PLLL PLLL/NCO 11
EMBRACING PUERTO RICO Join us in helping rebuild Puerto Rico by making a charitable donation. Popular is leading the Embracing Puerto Rico initiative through its corporate foundations, Fundación Banco Popular and Popular Community Bank Foundation. Popular will drive donations from customers, partners and friends that want to contribute to recovery efforts in Puerto Rico. 100% of all the funds raised will be directed to rebuilding the most vulnerable communities in the Island. For 37 years, Fundación Banco Popular has been the philanthropic arm of Popular supporting communities across Puerto Rico. www.embracingpuertorico.com/ 12
Investor Presentation Third Quarter 2017 Appendix
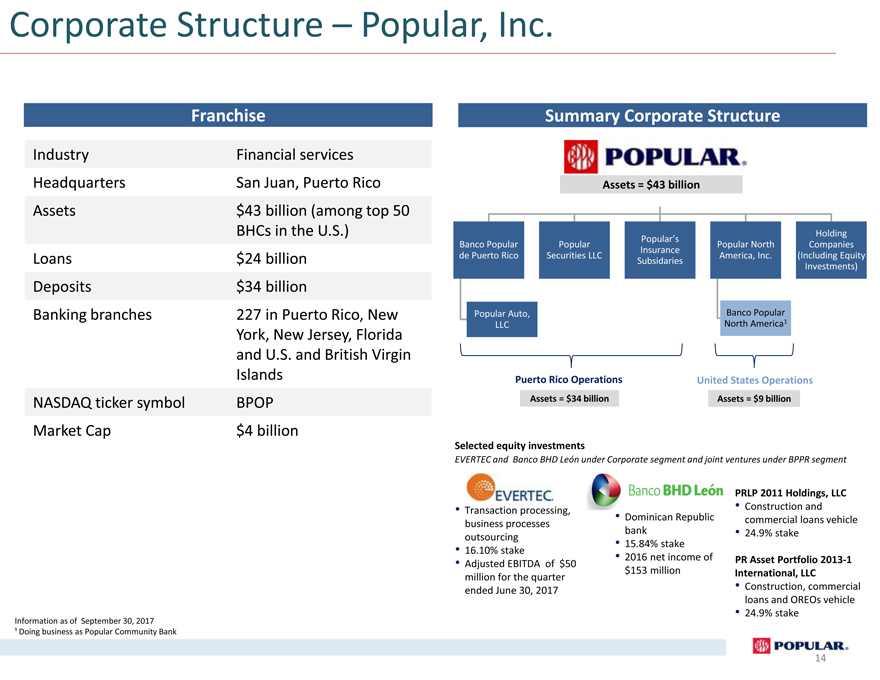
Corporate Who We Are Structure – Popular, – Inc. Popular, Inc. Franchise Industry Financial services Headquarters San Juan, Puerto Rico Assets $43 billion (among top 50 BHCs in the U.S.) Loans $24 billion Deposits $34 billion Banking branches 227 in Puerto Rico, New York, New Jersey, Florida and U.S. and British Virgin Islands NASDAQ ticker symbol BPOP Market Cap $4 billion Information as of September 30, 2017 ¹ Doing business as Popular Community Bank Summary Corporate Structure Assets = $43 billion Holding Popular’s Banco Popular Popular Popular North Companies Insurance de Puerto Rico Securities LLC America, Inc. (Including Equity Subsidaries Investments) Popular Auto, Banco Popular LLC North America1 Puerto Rico Operations United States Operations Assets = $34 billion Assets = $9 billion Selected equity investments EVERTEC and Banco BHD León under Corporate segment and joint ventures under BPPR segment PRLP 2011 Holdings, LLC • Transaction processing, • Construction and • Dominican Republic commercial loans vehicle business processes bank • 24.9% stake outsourcing • 15.84% stake • 16.10% stake • 2016 net income of PR Asset Portfolio 2013-1 • Adjusted EBITDA of $50 $153 million International, LLC million for the quarter ended June 30, 2017 • Construction, commercial loans and OREOs vehicle • 24.9% stake 14
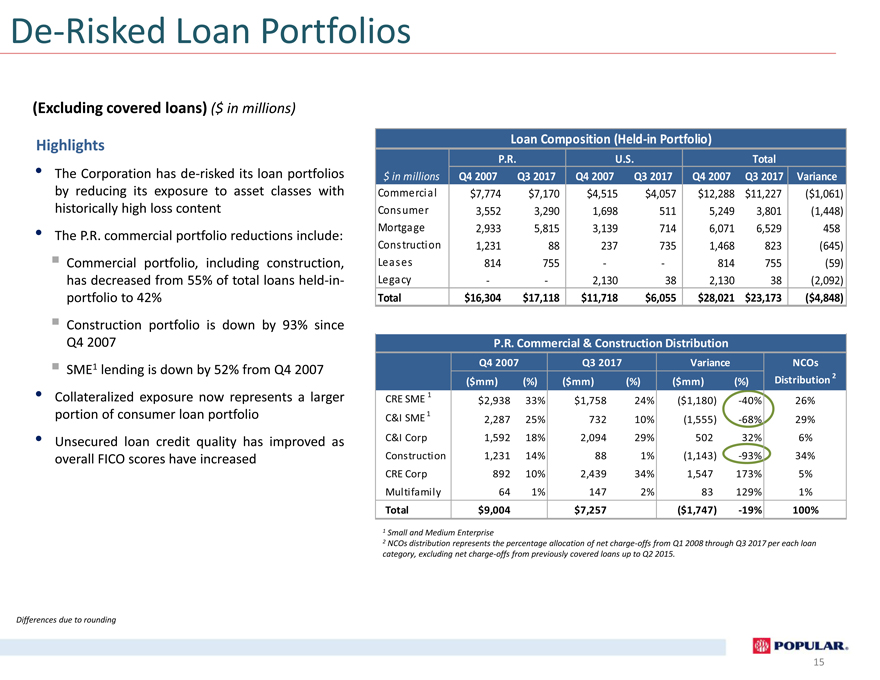
De-Risked Loan Portfolios (Excluding covered loans) ($ in millions) Highlights • The Corporation has de-risked its loan portfolios by reducing its exposure to asset classes with historically high loss content • The P.R. commercial portfolio reductions include: Commercial portfolio, including construction, has decreased from 55% of total loans held-in-portfolio to 42% Construction portfolio is down by 93% since Q4 2007 SME1 lending is down by 52% from Q4 2007 • Collateralized exposure now represents a larger portion of consumer loan portfolio • Unsecured loan credit quality has improved as overall FICO scores have increased Differences due to rounding Loan Composition (Held-in Portfolio) P.R.U.S.Total $ in millionsQ4 2007Q3 2017Q4 2007Q3 2017Q4 2007Q3 2017Variance Commercial$7,774$7,170$4,515$4,057$12,288$11,227($1,061) Consumer3,5523,2901,6985115,2493,801(1,448) Mortgage2,9335,8153,1397146,0716,529458 Construction1,231882377351,468823(645) Leases814755--814755(59) Legacy--2,130382,13038(2,092) Total$16,304$17,118$11,718$6,055$28,021$23,173($4,848) P.R. Commercial & Construction Distribution Q4 2007Q3 2017VarianceNCOs ($mm)(%)($mm)(%)($mm)(%)Distribution 2 CRE SME 1$2,93833%$1,75824%($1,180)-40%26% C&I SME 12,28725%73210%(1,555)-68%29% C&I Corp1,59218%2,09429%50232%6% Construction1,23114%881%(1,143)-93%34% CRE Corp89210%2,43934%1,547173%5% Multifamily641%1472%83129%1% Total$9,004$7,257($1,747)-19%100% 1 Small and Medium Enterprise 2 NCOs distribution represents the percentage allocation of net charge-offs from Q1 2008 through Q3 2017 per each loan category, excluding net charge-offs from previously covered loans up to Q2 2015. Differences due to rounding 15
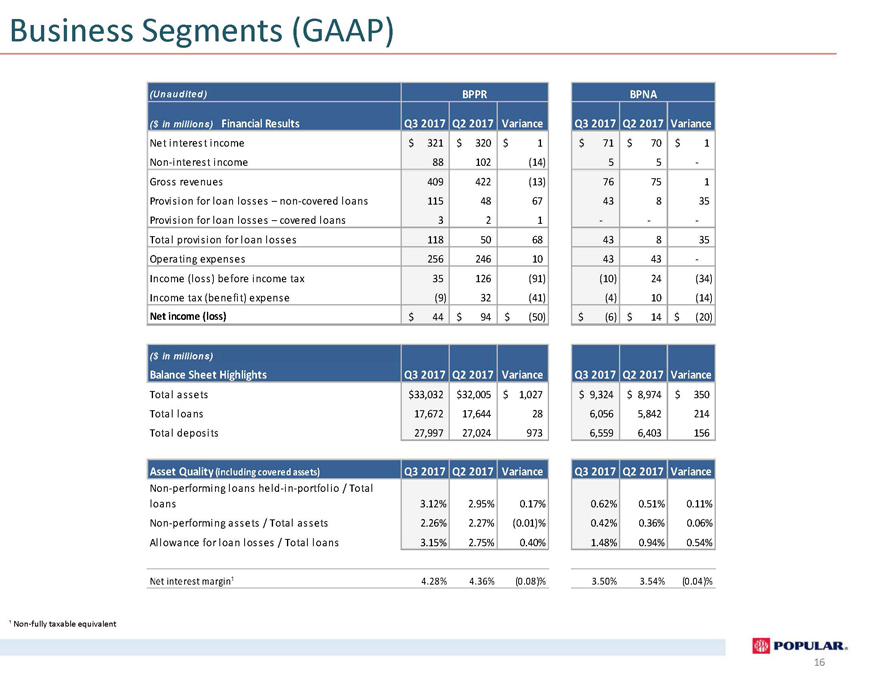
Business Segments (GAAP) (Una udite d) BPPRBPNA ($ in millions) Financial ResultsQ3 2017Q2 2017VarianceQ3 2017Q2 2017Variance Net interest income$321$320$1$72$70$2 Non-interest income88102(14)55- Gross revenues409422(13)77752 Provision for loan losses – non-covered loans116486842834 Provision for loan losses – covered loans321--- Total provision for loan losses119506942834 Operating expenses255246944431 Income (loss) before income tax35126(91)(9)24(33) Income tax (benefit) expense(9)32(41)(4)10(14) Net income (loss)$44$94$(50)$(5)$14$(19) ($ in millions) Balance Sheet HighlightsQ3 2017Q2 2017VarianceQ3 2017Q2 2017Variance Total assets$33,032$32,005$1,027$ 9,324$ 8,974$350 Total loans17,67217,644286,0565,842214 Total deposits27,99727,0249736,5596,403156 Asset Quality (including covered assets)Q3 2017Q2 2017VarianceQ3 2017Q2 2017Variance Non-performing loans held-in-portfolio / Total loans3.12%2.95%0.17%0.62%0.51%0.11% Non-performing assets / Total assets2.26%2.27%(0.01)%0.42%0.36%0.06% Allowance for loan losses / Total loans3.15%2.75%0.40%1.48%0.94%0.54% Net interest margin¹4.28%4.36%(0.08)%3.50%3.54%(0.04)% ¹ Non-fully taxable equivalent 16
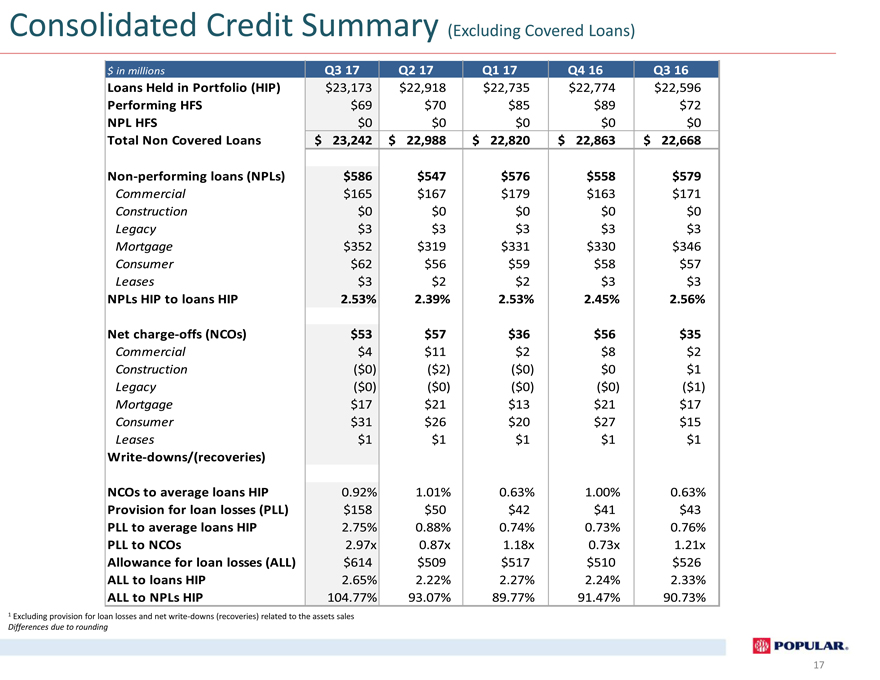
Consolidated Credit Summary (Excluding Covered Loans) $ in millions Q3 17Q2 17Q1 17Q4 16Q3 16 Loans Held in Portfolio (HIP)$23,173$22,918$22,735$22,774$22,596 Performing HFS$69$70$85$89$72 NPL HFS$0$0$0$0$0 Total Non Covered Loans$23,242$22,988$22,820$22,863$22,668 Non-performing loans (NPLs)$586$547$576$558$579 Commercial$165$167$179$163$171 Construction$0$0$0$0$0 Legacy$3$3$3$3$3 Mortgage$352$319$331$330$346 Consumer$62$56$59$58$57 Leases$3$2$2$3$3 NPLs HIP to loans HIP2.53%2.39%2.53%2.45%2.56% Net charge-offs (NCOs)$53$57$36$56$35 Commercial$4$11$2$8$2 Construction($0)($2)($0)$0$1 Legacy($0)($0)($0)($0)($1) Mortgage$17$21$13$21$17 Consumer$31$26$20$27$15 Leases$1$1$1$1$1 Write-downs/(recoveries) NCOs to average loans HIP0.92%1.01%0.63%1.00%0.63% Provision for loan losses (PLL)$158$50$42$41$43 PLL to average loans HIP2.75%0.88%0.74%0.73%0.76% PLL to NCOs2.97x0.87x1.18x0.73x1.21x Allowance for loan losses (ALL)$614$509$517$510$526 ALL to loans HIP2.65%2.22%2.27%2.24%2.33% ALL to NPLs HIP104.77%93.07%89.77%91.47%90.73% 1 Excluding provision for loan losses and net write-downs (recoveries) related to the assets sales Differences due to rounding 17
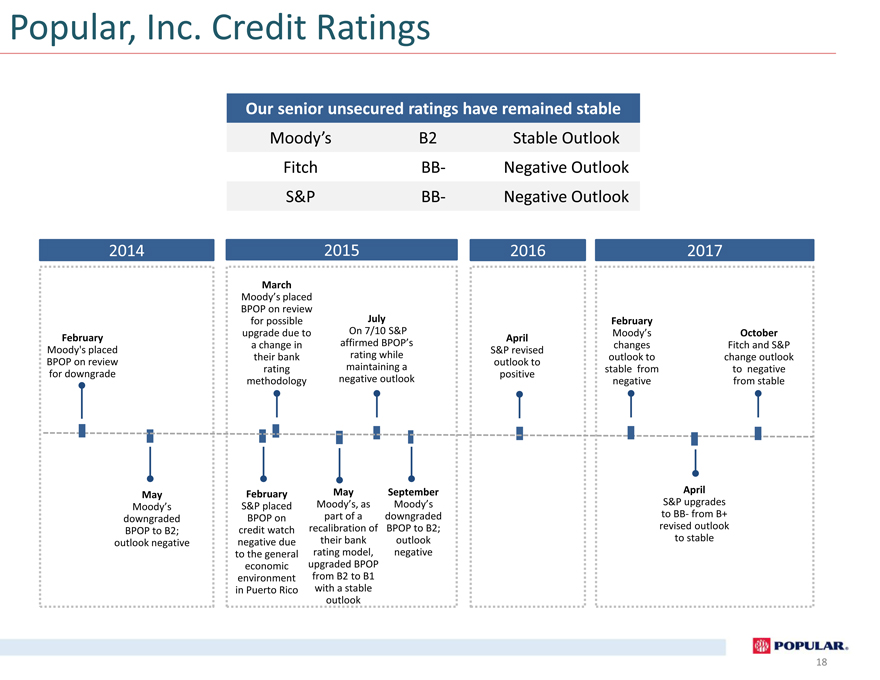
Popular, Inc. Credit Ratings Our senior unsecured ratings have remained stable Moody’s B2 Stable Outlook Fitch BB- Negative Outlook S&P BB- Negative Outlook 2014 February Moody’s placed BPOP on review for downgrade May Moody’s downgraded BPOP to B2; outlook negative 2015 March Moody’s placed BPOP on review for possible July upgrade due to On 7/10 S&P a change in affirmed BPOP’s their bank rating while rating maintaining a methodology negative outlook February May September S&P placed Moody’s, as Moody’s BPOP on part of a downgraded credit watch recalibration of BPOP to B2; negative due their bank outlook to the general rating model, negative economic upgraded BPOP environment from B2 to B1 in Puerto Rico with a stable outlook 2016 April S&P revised outlook to positive 2017 February Moody’s October changes Fitch and S&P outlook to change outlook stable from to negative negative from stable April S&P upgrades to BB- from B+ revised outlook to stable 18

Investor Presentation Third Quarter 2017