Attached files
| file | filename |
|---|---|
| EX-99.1 - EX-99.1 - GenOn Energy, Inc. | a17-24952_1ex99d1.htm |
| EX-10.1 - EX-10.1 - GenOn Energy, Inc. | a17-24952_1ex10d1.htm |
| 8-K - 8-K - GenOn Energy, Inc. | a17-24952_18k.htm |
Confidential DRAFT – subject to ongoing review & revision GenMA financial forecast October, 2017
Confidential DRAFT – subject to ongoing review & revision Financial forecast methodology Consistent with disclosure statement forecast methodology, apart from cost savings sensitivities Operating forecast originally presented in Q2 2017 2018 through 2020 based on input from various groups within the Company’s operations and financial planning & analysis functions, as well as third-party pricing assumptions (adjusted where appropriate in order to reflect market and operating specific factors associated with the generation fleet). Plant budgeting process considers a multitude of factors, with adjustments to plant configuration, age, equipment, number of units, service hour forecast and generation forecasts. While working through the budgeting process, plant leadership takes into consideration items including (but not limited to): – Headcount needed to operate the facility – VOM for consumables (water & chemicals), number of start times and running environmental back-end control systems – Base O&M support forecasted generation – Outage timing (based on prior maintenance cycle and forecasted service hours) – Environmental and regulatory changes 1
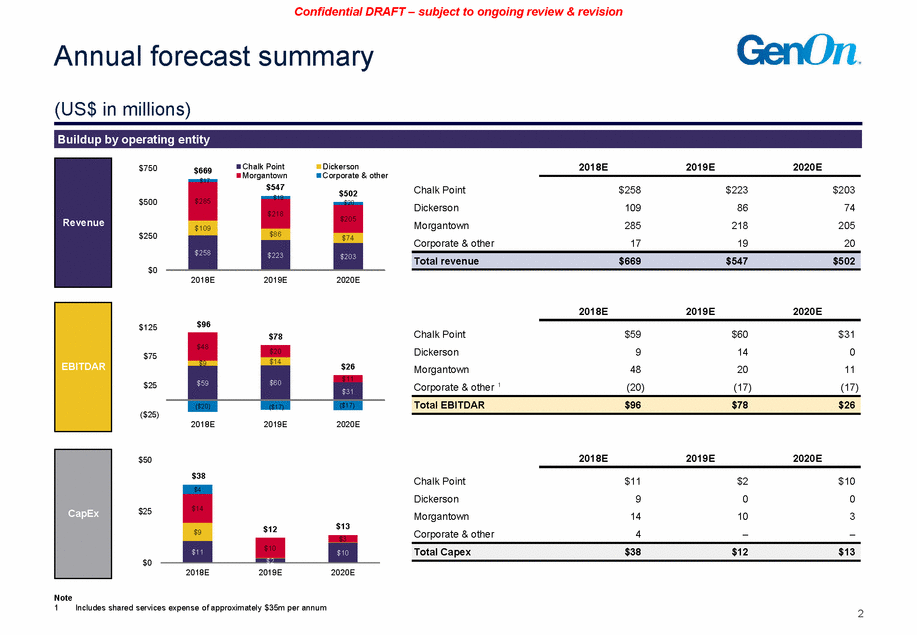
Confidential DRAFT – subject to ongoing review & revision Annual forecast summary (US$ in millions) Chalk Point Morgantown Dickerson Corporate & other 2018E 2019E 2020E $750 $669 $17 Chalk Point Dickerson Morgantown Corporate & other $258 109 285 17 $223 86 218 19 $203 74 205 20 $500 $20 $250 $0 2018E 2019E 2020E 2018E 2019E 2020E $96 $125 Chalk Point Dickerson Morgantown Corporate & other 1 $59 9 48 (20) $60 14 20 (17) $31 0 11 (17) $75 $25 ($25) 2018E 2019E 2020E 2018E 2019E 2020E $50 $38 Chalk Point Dickerson Morgantown Corporate & other $11 9 14 4 $2 0 10 – $10 0 3 – $25 $0 2018E 2019E 2020E Note 1 Includes shared services expense of approximately $35m per annum 2 Total Capex $38 $12 $13 $4 $12$13 $3 $14 $9 $11 $10 $10 CapEx Total EBITDAR $96 $78 $26 $48 $78 $20 $26 $11 $14 $9 $59 $60 $31 ($20) ($17) ($17) EBITDAR Total revenue $669 $547 $502 $285 $547$502 $19 $218 $205 $109 $86 $74 $258 $223 $203 Revenue Buildup by operating entity
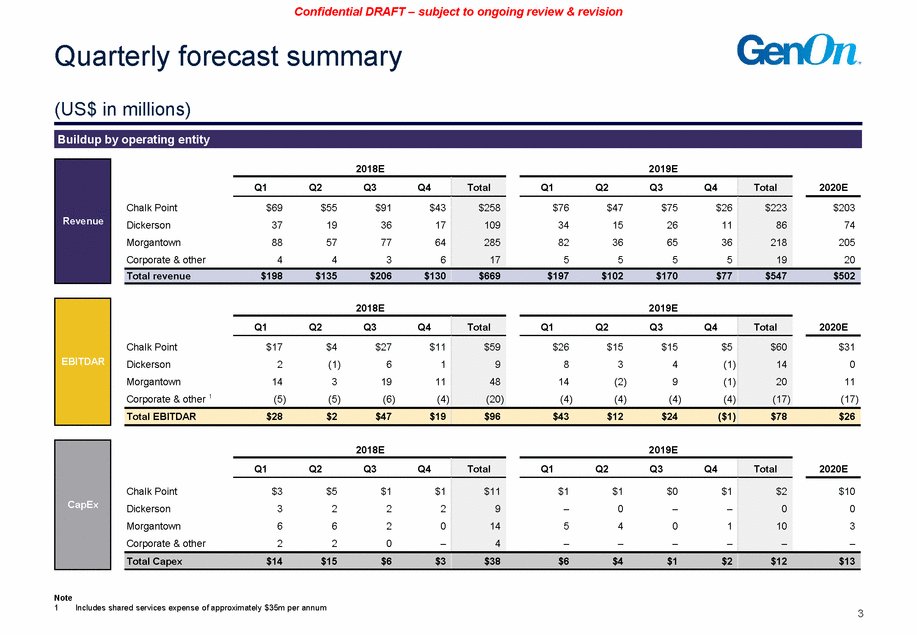
Confidential DRAFT – subject to ongoing review & revision Quarterly forecast summary (US$ in millions) 2018E 2019E 2018E 2019E 2018E 2019E Note 1 Includes shared services expense of approximately $35m per annum 3 Chalk Point Dickerson Morgantown Corporate & other Q1Q2Q3Q4 Total Q1Q2Q3Q4 Total 2020E $10 0 3 – $3$5$1$1 3222 6620 220– $11 9 14 4 $1$1$0$1 –0–– 5401 –––– $2 0 10 – Total Capex$14$15$6$3$38$6$4$1$2$12$13 CapEx Chalk Point Dickerson Morgantown Corporate & other 1 Q1Q2Q3Q4 Total Q1Q2Q3Q4 Total 2020E $31 0 11 (17) $17$4$27$11 2(1)61 1431911 (5)(5) (6)(4) $59 9 48 (20) $26$15$15$5 834(1) 14(2) 9 (1) (4)(4)(4)(4) $60 14 20 (17) Total EBITDAR$28$2$47$19$96$43$12$24($1)$78$26 EBITDAR Chalk Point Dickerson Morgantown Corporate & other Q1Q2Q3Q4 Total Q1Q2Q3Q4 Total 2020E $203 74 205 20 $69$55$91$43 37193617 88577764 4436 $258 109 285 17 $76$47$75$26 34152611 82366536 5555 $223 86 218 19 Total revenue$198$135$206$130$669$197$102$170$77$547$502 Revenue Buildup by operating entity
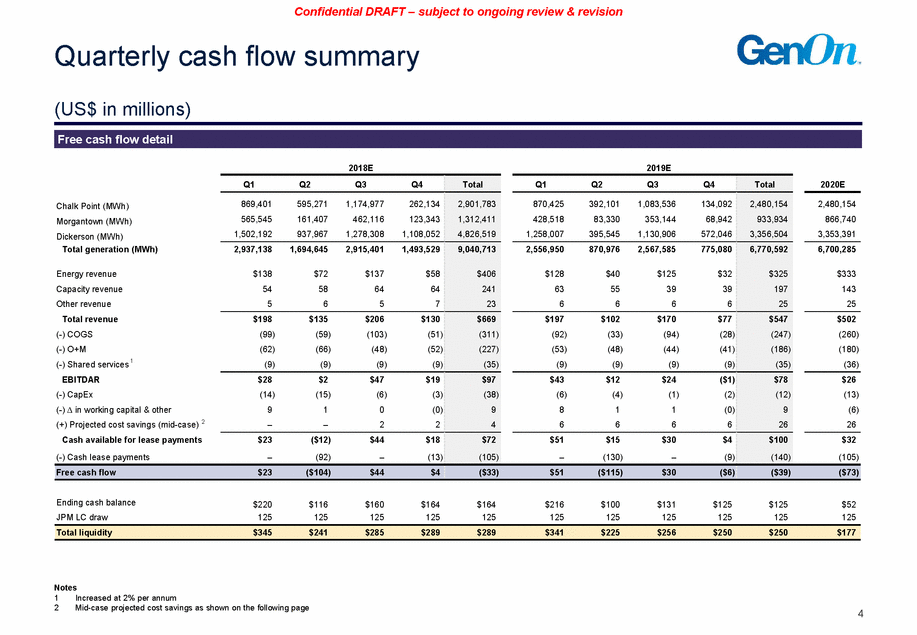
Confidential DRAFT – subject to ongoing review & revision Quarterly cash flow summary (US$ in millions) 2018E 2019E Ending cash balance JPM LC draw $220 125 $116 125 $160 125 $164 125 $164 125 $216 125 $100 125 $131 125 $125 125 $125 125 $52 125 Notes 1 2 Increased at 2% per annum Mid-case projected cost savings as shown on the following page 4 Total liquidity $345 $241 $285 $289 $289 $341 $225 $256 $250 $250 $177 Chalk Point (MWh) Morgantown (MWh) Dickerson (MWh) Total generation (MWh) Energy revenue Capacity revenue Other revenue Total revenue (-) COGS (-) O+M (-) Shared services 1 EBITDAR (-) CapEx (-) in working capital & other (+) Projected cost savings (mid-case) 2 Cash available for lease payments (-) Cash lease payments Q1 Q2 Q3 Q4 Total Q1 Q2 Q3 Q4 Total 2020E 2,480,154 866,740 3,353,391 6,700,285 $333 143 25 $502 (260) (180) (36) $26 (13) (6) 26 $32 (105) 869,401 595,271 1,174,977 262,134 565,545 161,407 462,116 123,343 1,502,192 937,967 1,278,308 1,108,052 2,901,783 1,312,411 4,826,519 870,425 392,101 1,083,536 134,092 428,518 83,330 353,144 68,942 1,258,007 395,545 1,130,906 572,046 2,480,154 933,934 3,356,504 2,937,138 1,694,645 2,915,401 1,493,529 $138 $72 $137 $58 54 58 64 64 5 6 5 7 9,040,713 $406 241 23 2,556,950 870,976 2,567,585 775,080 $128 $40 $125 $32 63 55 39 39 6 6 6 6 6,770,592 $325 197 25 $198 $135 $206 $130 (99) (59) (103) (51) (62) (66) (48) (52) (9) (9) (9) (9) $669 (311) (227) (35) $197 $102 $170 $77 (92) (33) (94) (28) (53) (48) (44) (41) (9) (9) (9) (9) $547 (247) (186) (35) $28 $2 $47 $19 (14) (15) (6) (3) 9 1 0 (0) – – 2 2 $97 (38) 9 4 $43 $12 $24 ($1) (6) (4) (1) (2) 8 1 1 (0) 6 6 6 6 $78 (12) 9 26 $23 ($12) $44 $18 – (92) – (13) $72 (105) $51 $15 $30 $4 – (130) – (9) $100 (140) Free cash flow $23 ($104) $44 $4 ($33) $51 ($115) $30 ($6) ($39) ($73) Free cash flow detail
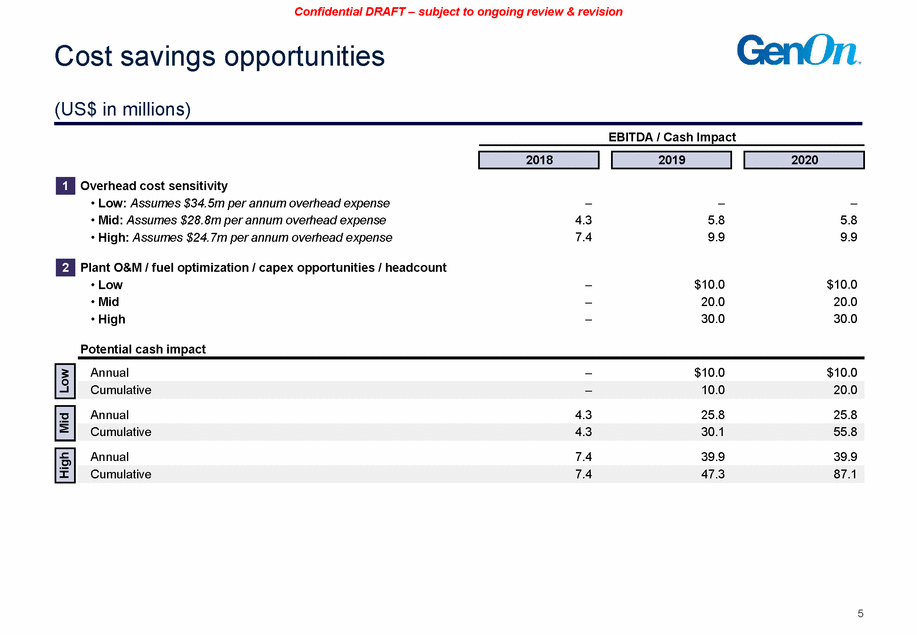
Confidential DRAFT – subject to ongoing review & revision Cost savings opportunities (US$ in millions) EBITDA / Cash Impact Overhead cost sensitivity • Low: Assumes $34.5m per annum overhead expense • Mid: Assumes $28.8m per annum overhead expense • High: Assumes $24.7m per annum overhead expense – 4.3 7.4 – 5.8 9.9 – 5.8 9.9 Plant O&M / fuel optimization / capex opportunities / headcount • Low • Mid • High – – – $10.0 20.0 30.0 $10.0 20.0 30.0 Potential cash impact 5 High Annual 7.4 39.9 39.9 Cumulative 7.4 47.3 87.1 Mid Annual 4.3 25.8 25.8 Cumulative 4.3 30.1 55.8 Low Annual – $10.0 $10.0 Cumulative – 10.0 20.0 2 1 2020 2019 2018
Confidential DRAFT – subject to ongoing review & revision Appendix A Key assumptions
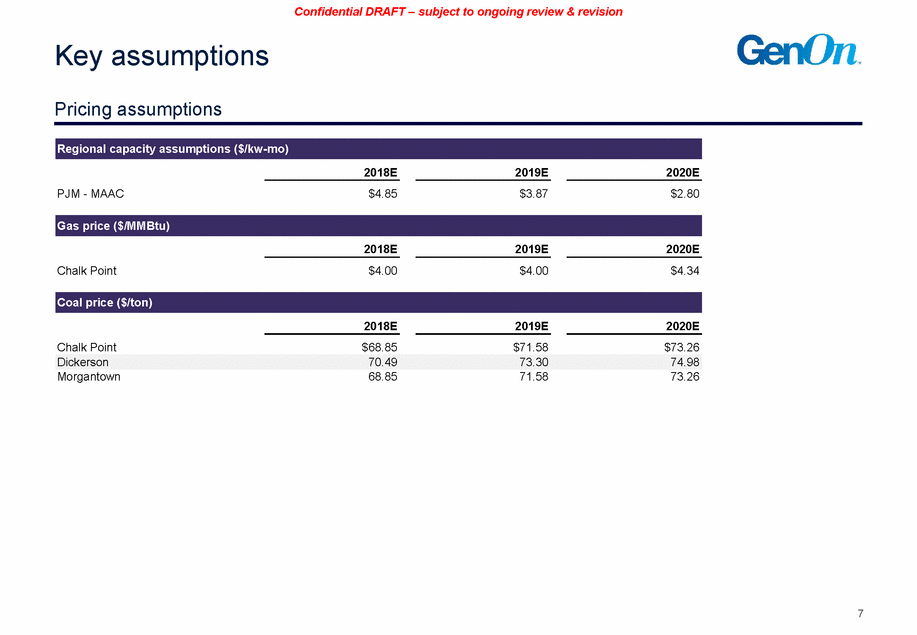
Confidential DRAFT – subject to ongoing review & revision Key assumptions Chalk Point 2018E $35.12 35.02 2019E $34.90 34.73 2020E $36.08 35.90 PDircikcerisnogn assumptions Morgantown 35.01 34.80 35.98 2018E 2019E 2020E PJM - MAAC $4.85 $3.87 $2.80 2018E 2019E 2020E Chalk Point $4.00 $4.00 $4.34 2018E 2019E 2020E Chalk Point $68.85 $71.58 $73.26 Morgantown 68.85 71.58 73.26 7 Dickerson 70.49 73.30 74.98 Coal price ($/ton) Gas price ($/MMBtu) Regional capacity assumptions ($/kw-mo)