Attached files
| file | filename |
|---|---|
| EX-99.1 - EXHIBIT 99.1 - 3D SYSTEMS CORP | tv478190_ex99-1.htm |
| 8-K - FORM 8-K - 3D SYSTEMS CORP | tv478190_8k.htm |
Exhibit 99.2

Third Quarter and Nine Months 2017 October 31, 2017

Welcome and Participants • Vyomesh Joshi – President & Chief Executive Officer • John McMullen – Executive Vice President & Chief Financial Officer • Andy Johnson – Executive Vice President & Chief Legal Officer • Stacey Witten – Vice President, Investor Relations To participate via phone, please dial: In the US : 1 - 800 - 407 - 8291 Outside the US: 1 - 201 - 689 - 8345 2

Forward Looking Statements This presentation contains certain statements that are not statements of historical or current facts are forward - looking stateme nts within the meaning of the Private Securities Litigation Reform Act of 1995. Forward - looking statements include statements concerning plans, objectives, goals, strategies, expectations , intentions, projections, developments, future events, performance or products, underlying assumptions, and other statements which are other than statements of historical facts. I n s ome cases, you can identify forward - looking statements by terms such as “believes,” “beliefs,” ''may,'' ''will,'' ''should,'' expects,'' ''intends,'' ''plans,'' ''anticipates,'' ''est ima tes,'' ''predicts,'' ''projects,'' ''potential,'' ''continue,'' and other similar terminology or the negative of these terms. From time to time, we may publish or otherwise make available forward - looking statements of thi s nature. All such forward - looking statements, whether written or oral, and whether made by us or on our behalf, are expressly qualified by the cautionary statements described on t his message including those set forth below. Forward - looking statements are based upon management’s beliefs, assumptions and current expectations concerning future events and trends, usi ng information currently available, and are necessarily subject to uncertainties, many of which are outside our control. In addition, we undertake no obligation to u pda te or revise any forward - looking statements made by us or on our behalf, whether as a result of future developments, subsequent events or circumstances, or otherwise, or to reflect the o ccu rrence or likelihood of unanticipated events, and we disclaim any such obligation. Forward - looking statements are only predictions that relate to future events or our future performance and are subject to known and unknown r isk s, uncertainties, assumptions, and other factors, many of which are beyond our control, that may cause actual results, outcomes, levels of activity, performance, deve lop ments, or achievements to be materially different from any future results, outcomes, levels of activity, performance, developments, or achievements expressed, anticipated, or implied b y t hese forward - looking statements. Although we believe that the expectations reflected in the forward - looking statements are reasonable, forward - looking statements are not, and should not be relied upon as a guarantee of future performance or results, nor will they necessarily prove to be accurate indications of the times at or by which any such performance or resul ts will be achieved. 3D System’s actual results could differ materially from those stated or implied in forward - looking statements. Past performance is not necessarily indicative of future results. We do not undertake any obligation to and do not intend to update any forward - looking statements whether as a result of future developments, subsequent events or circumstances o r otherwise. Further , we encourage you to review “Risk Factors” in Part 1 of our Annual Report on Form 10 - K and Part II of our quarterly reports on Form 10 - Q filed with the SEC as well as other information about us in our filings with the SEC. These are available at www.SEC.gov. 3

Vyomesh Joshi (VJ) President & Chief Executive Officer

Investing for the Long Term 5 • While our third quarter results did not meet our expectations, we believe the actions we took during the quarter better position the company • We completed an extensive evaluation of our portfolio and inventory • Accelerated investments in plastics, metals, materials, software and services and plan to launch numerous products across our portfolio in the coming months • Took actions to course correct where execution has been weak on a year to date basis • We believe we are on the right track and we are putting the appropriate structure in place to drive future sustainable, profitable growth

Q3 Results Overview 6 • Revenue was $152.9 million, inclusive of growth in healthcare, materials, and on demand manufacturing • GPM was 38.3%, including a $12.9 million inventory adjustment • Investing in innovation, IT infrastructure, go to market and customer satisfaction • GAAP loss of $0.34 per share and non - GAAP loss of $ 0.20 per share • Making operational and organizational improvements to position the company for long term success In the third quarter of 2017:

John McMullen Executive Vice President & Chief Financial Officer

GAAP Operating Results 8 2017 2016 Y/Y Change 2017 2016 Y/Y Change $ 152.9 $ 156.4 (2%) $ 468.8 $ 467.0 0% $ 58.5 $ 68.9 (15%) $ 219.4 $ 226.9 (3%) 38.3% 44.1% -580 bps 46.8% 48.6% -180 bps $ 66.5 $ 64.8 3% $ 196.0 $ 202.0 (3%) $ 24.4 $ 26.1 (7%) $ 71.7 $ 67.3 6% $ 90.9 $ 91.0 (0%) $ 267.7 $ 269.4 (1%) 59.4% 58.2% 57.1% 57.7% ($32.3) ($22.0) (47%) ($48.3) ($42.5) (14%) (21.1%) (14.1%) (10.3%) (9.1%) ($37.7) ($21.2) (78%) ($56.1) ($43.6) (28%) (24.6%) (13.6%) (12.0%) (9.3%) ($0.34) ($0.19) (79%) ($0.50) ($0.39) (28%) Operating Expenses Gross Profit Margin Gross Profit SG&A R&D Nine MonthsThird Quarter Loss Per Share % of Revenue Net Loss per 3D Systems % of Revenue Revenue ($ in millions, except per share) Operating Loss % of Revenue

Non - GAAP Financial Measures 9 - We use non - GAAP measures to supplement our financial statements presented on a GAAP basis because management believes non - GAAP financial measures are useful to investors in evaluating our operating performance and to facilitate a better understanding o f t he impact that strategic acquisitions, non - recurring charges and certain non - cash expenses had on our financial results . - See appendix for reconciliation of non - GAAP items 2017 2016 Y/Y Change 2017 2016 Y/Y Change Non-GAAP R&D Expense $24.4 $20.1 21% $71.7 $61.3 17% Non-GAAP SG&A Expense $51.5 $44.7 15% $147.4 $141.3 4% Non-GAAP Operating Expenses $75.9 $64.8 17% $219.1 $204.1 7% Non-GAAP Net Income (Loss) ($22.6) $15.8 (243%) ($7.0) $34.1 (121%) Non-GAAP Earnings (Loss) per Share ($0.20) $0.14 (243%) ($0.06) $0.31 (119%) ($ in millions, except per share amounts) Third Quarter Nine Months

Q3 Revenue Drivers • Healthcare solutions increased 10% to $47 million • Materials increased 4% to $39 million • Software was flat at $21 million • On demand manufacturing increased 3 % to $27 million • Printers decreased 11% to $29 million Q3 2017 compared to Q3 2016: 10

Gross Profit and Margin • GPM of 38.3% in Q3 2017, including a $12.9 million adjustment to inventory as a result of a comprehensive portfolio and inventory analysis • Cost savings in supply chain and manufacturing continue to support strategic investments and competitive pricing 11 - Q3 2016 GAAP GPM was negatively impacted by charges of $10.7 million related to project and product discontinuations, and Q3 2017 GAAP and non - GAAP GPM was negatively impacted by an inventory adjustment of $12.9 million $ in millions

Operating Expenses 12 • SG&A expenses increased primarily from investments in go to market and IT • R&D expenses included accelerated investment in plastics, primarily Figure 4, metals, materials and software • We plan to continue to invest to best position the company for long term success - See appendix for a reconciliation of non - GAAP operating expenses $ in millions

Cash and Balance Sheet • Used $0.7 million of cash in operations during Q3 • Generated $17.7 million of cash from operations year to date • Cash balance of $ 138.3 million at September 30, 2017 13

Guidance Update 14 • Withdrawing financial guidance for the time being • Focusing on the turnaround and transformation of the company and building the company for long term profitability and success • Resolving legacy issues as quickly as possible while investing in strategic initiatives and innovation to drive future growth • We have made progress in many areas, but we are tackling many issues simultaneously, and predictability has been difficult and we still have work to do • We have a thorough understanding of the comprehensive issues and have plans underway to resolve them

Vyomesh Joshi (VJ) President & Chief Executive Officer

Summary 16 • We remain excited about and focused on long term success • We believe we have taken the actions necessary to improve execution • We have focused on necessary investments and organizing for the long term • We have made significant progress in quality, reliability and customer satisfaction • We have invested in innovation and plan to introduce exciting new offerings across our portfolio

Innovation & New Products 17 • F igure 4 platform solutions from approximately $25,000 to over $1 million • Dental specific solutions for dental labs • New materials to support production • Next generation metals platform • Additional SLS production systems • Entry into low end with a highly productive, desktop, industrial printer • Additional software and service offerings Over the coming months, we plan to launch:

Q&A Session In the USA: 1 - 877 - 407 - 8291 Outside the USA: 1 - 201 - 689 - 8345 Launch Event November 7, 2017, 10:30am ET Watch live webcast: www.3dsystems.com/investor

Thank You

Appendix
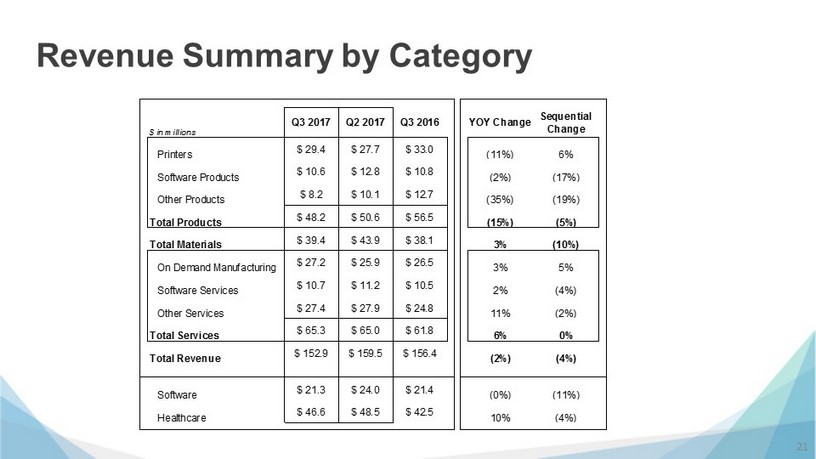
Revenue Summary by Category 21 $ in millions Q3 2017 Q2 2017 Q3 2016 YOY Change Sequential Change Printers $ 29.4 $ 27.7 $ 33.0 (11%) 6% Software Products $ 10.6 $ 12.8 $ 10.8 (2%) (17%) Other Products $ 8.2 $ 10.1 $ 12.7 (35%) (19%) Total Products $ 48.2 $ 50.6 $ 56.5 (15%) (5%) Total Materials $ 39.4 $ 43.9 $ 38.1 3% (10%) On Demand Manufacturing $ 27.2 $ 25.9 $ 26.5 3% 5% Software Services $ 10.7 $ 11.2 $ 10.5 2% (4%) Other Services $ 27.4 $ 27.9 $ 24.8 11% (2%) Total Services $ 65.3 $ 65.0 $ 61.8 6% 0% Total Revenue $ 152.9 $ 159.5 $ 156.4 (2%) (4%) Software $ 21.3 $ 24.0 $ 21.4 (0%) (11%) Healthcare $ 46.6 $ 48.5 $ 42.5 10% (4%)

Non - GAAP Reconciliation 22 Q3 and Nine Months Non - GAAP Earnings (Loss) Per Share 2017 2016 2017 2016 GAAP Net loss attributable to 3D Systems Corporation ($37.7) ($21.2) ($56.1) ($43.6) Adjustments: Amortization, stock-based compensation & other 1 $15.5 $29.1 $47.7 $65.6 Legal and acquisition-related 2 ($0.4) $1.8 $1.4 $4.5 Portfolio restructuring 3 $0.0 $6.1 $0.0 $6.1 Tax effect of adjustments 4 $0.0 $0.0 $0.0 $1.5 Non-GAAP net income attributable to 3D Systems Corporation ($22.6) $15.8 ($7.0) $34.1 Non-GAAP net income per share available to 3D Systems common stock holders - basic and diluted 5 ($0.20) $0.14 ($0.06) $0.31 5 Denominator based on diluted shares used in the GAAP EPS calculation. ($ in millions, except per share amounts) Third Quarter Nine Months 1 For the quarter ended September 30, 2017, the adjustment included $0.1 in COGS and $15.4 in SG&A. For the quarter ended September 30, 2016, the adjustment included $10.8 in COGS and $18.3 SG&A. For the nine months ended September 30, 2017, the adjustment included $0.3 in COGS and $47.4 in SG&A. For the nine months ended September 30, 2016, the adjustment included $10.9 in COGS and $54.7 in SG&A. 2 For the quarter ended September 30, 2017, the adjustment included ($0.4) in SG&A. For the quarter ended September 30, 2016 the adjustment included $1.8 in SG&A. For the nine months ended September 30, 2017, the adjustment included $1.2 in SG&A and $0.2 in interest and other income, net. For the nine months ended September 30, 2016 the adjustment included $4.5 in SG&A. 4 Tax effect for the quarter ended March 31, 2016 was calculated quarterly based on the Company's overall tax rate. Tax effect for the quarters ended after March 31, 2016 were calculated based on the Company's quarterly U.S. tax rate of 0%, which is due to valuation allowances in connection with GAAP net losses. 3 For the quarter and nine months ended September 30, 2016, the adjustment included $6.1 in R&D.
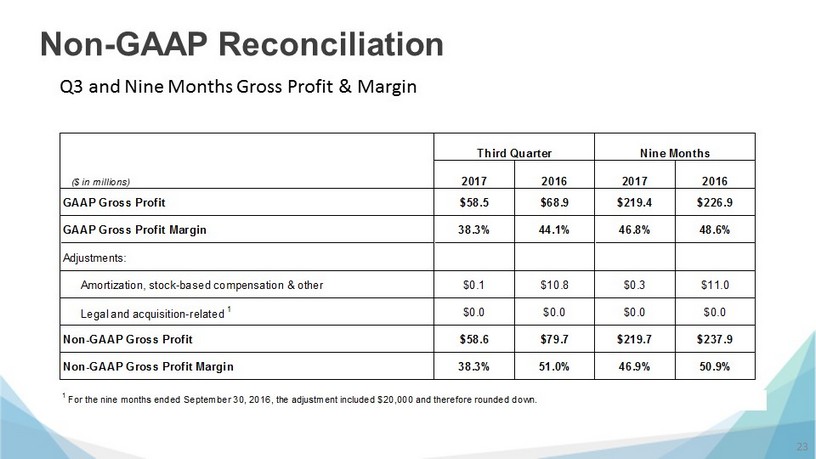
Non - GAAP Reconciliation 23 Q3 and Nine Months Gross Profit & Margin 2017 2016 2017 2016 GAAP Gross Profit $58.5 $68.9 $219.4 $226.9 GAAP Gross Profit Margin 38.3% 44.1% 46.8% 48.6% Adjustments: Amortization, stock-based compensation & other $0.1 $10.8 $0.3 $11.0 Legal and acquisition-related 1 $0.0 $0.0 $0.0 $0.0 Non-GAAP Gross Profit $58.6 $79.7 $219.7 $237.9 Non-GAAP Gross Profit Margin 38.3% 51.0% 46.9% 50.9% 1 For the nine months ended September 30, 2016, the adjustment included $20,000 and therefore rounded down. ($ in millions) Third Quarter Nine Months

Non - GAAP Reconciliation 24 Q3 and Nine Months Non - GAAP Operating Expenses 2017 2016 2017 2016 GAAP R&D Expenses $ 24.4 $ 26.1 $ 71.7 $ 67.4 GAAP SG&A Expenses $ 66.5 $ 64.8 $ 196.0 $ 202.0 GAAP Operating Expenses $90.9 $90.9 $267.7 $269.4 Adjustments to R&D Expenses: Portfolio restructuring $ 0.0 $ 6.1 $ 0.0 $ 6.1 Non-GAAP R&D Expenses $ 24.4 $ 20.0 $ 71.7 $ 61.3 Adjustments to SG&A Expenses: Amortization, stock-based compensation & other $ 15.8 $ 18.3 $ 47.4 $ 56.5 Legal and acquisition-related ($ 0.8) $ 1.7 $ 1.2 $ 2.7 Portfolio restructuring $ 0.0 $ 0.0 $ 0.0 $ 0.0 Total Adjustments to SG&A Expenses $ 15.0 $ 20.0 $ 48.6 $ 59.2 Non-GAAP SG&A Expenses $ 51.5 $ 44.8 $ 147.4 $ 142.8 Non-GAAP Operating Expenses $75.9 $64.8 $219.1 $204.1 ($ in millions, except per share amounts) Third Quarter Nine Months

Non - GAAP Reconciliation 25 Q2 and Six Months Non - GAAP Earnings (Loss) Per Share 2017 2016 2017 2016 GAAP Net loss attributable to 3D Systems Corporation ($8.4) ($4.6) ($18.4) ($22.4) Adjustments: Amortization, stock-based compensation & other 1 $ 16.3 $ 16.1 $ 32.3 $ 36.6 Legal and acquisition-related 2 $ 0.7 $ 1.8 $ 1.7 $ 2.7 Tax effect of adjustments 3 - - - $ 1.5 Non-GAAP net income attributable to 3D Systems Corporation $8.6 $13.2 $15.6 $18.4 Non-GAAP net income per share available to 3D Systems common stock holders - basic and diluted 4 $ 0.08 $ 0.12 $ 0.14 $ 0.17 4 Denominator based on diluted shares used in the GAAP EPS calculation. ($ in millions, except per share amounts) Second Quarter Six Months 1 For the quarter ended June 30, 2017, the adjustment included $0.1 in COGS and $16.2 in SG&A. For the quarter ended June 30, 2016, the adjustment included $0.1 in COGS and $16.0 SG&A. For the six months ended June 30, 2017, the adjustment included $0.2 in COGS and $32.1 in SG&A. For the six months ended June 30, 2016, the adjustment included $0.2 in COGS and $36.4 in SG&A. 2 For the quarter ended June 30, 2017, the adjustment included $0.5 in SG&A and $0.2 in interest and other income, net. For the quarter ended June 30, 2016 the adjustment included $1.8 in SG&A. For the six months ended June 30, 2017, the adjustment included $1.5 in SG&A and $0.2 in interest and other income, net. For the six months ended June 30, 2016 the adjustment included $2.7 in SG&A. 3 Tax effect for the quarter ended March 31, 2016 was calculated quarterly based on the Company's overall tax rate. Tax effect for the quarters ended after March 31, 2016 were calculated based on the Company's quarterly U.S. tax rate of 0%, which is due to valuation allowances in connection with GAAP net losses.

Non - GAAP Reconciliation 26 Q2 and Six Months Non - GAAP Operating Expenses 2017 2016 2017 2016 GAAP R&D Expenses $ 24.4 $ 20.9 $ 47.3 $ 41.2 GAAP SG&A Expenses $ 63.1 $ 63.2 $ 129.5 $ 137.2 GAAP Operating Expenses $87.5 $84.1 $176.8 $178.4 Adjustments 1 : Amortization, stock-based compensation & other $ 16.2 $ 16.0 $ 32.1 $ 36.4 Legal and acquisition-related $ 0.5 $ 1.8 $ 1.5 $ 2.7 Non-GAAP Operating Expenses $70.8 $66.3 $143.2 $139.3 ($ in millions, except per share amounts) Second Quarter Six Months 1 For the quarter and six months ended June 30, 2017, the adjustments only impacted SG&A expenses.

Non - GAAP Reconciliation 27 Q1 2017 Non - GAAP Earnings (Loss) Per Share 2017 2016 GAAP Net loss attributable to 3D Systems Corporation ($10.0) ($17.8) Adjustments: Amortization, stock-based compensation & other 1 $ 16.0 $ 20.5 Legal and acquisition-related 2 $ 1.1 $ 1.0 Tax effect of adjustments 3 - $ 1.5 Non-GAAP net income attributable to 3D Systems Corporation $7.1 $5.2 Non-GAAP net income per share available to 3D Systems common stock holders - basic and diluted 4 $ 0.06 $ 0.05 4 Denominator based on diluted shares used in the GAAP EPS calculation. ($ in millions, except per share amounts) First Quarter 1 For the quarter ended March 31, 2017, the adjustment included $0.1 in COGS and $15.9 in SG&A. For the quarter ended March 31, 2016, the adjustment included $0.1 in COGS and $20.4 SG&A. 2 For the quarter ended March 31, 2017, the adjustment included $1.1 in SG&A. For the quarter ended March 31, 2016 the adjustment included $0.9 in SG&A. 3 Tax effect for the quarter ended March 31, 2016 was calculated quarterly based on the Company's overall tax rate. Tax effect for the quarters ended after March 31, 2016 were calculated based on the Company's quarterly U.S. tax rate of 0%, which is due to valuation allowances in connection with GAAP net losses.

Non - GAAP Reconciliation 28 Q1 2017 Non - GAAP Operating Expenses 2017 2016 GAAP R&D Expenses $ 22.9 $ 20.3 GAAP SG&A Expenses $ 66.4 $ 74.0 GAAP Operating Expenses $89.3 $94.3 Adjustments 1 : Amortization, stock-based compensation & other $ 15.9 $ 20.4 Legal and acquisition-related $ 1.1 $ 1.0 Non-GAAP Operating Expenses $72.3 $72.9 ($ in millions, except per share amounts) First Quarter 1 For the quarter ended March 31, 2017, the adjustments only impacted SG&A expenses.

Non - GAAP Reconciliation 29 2016 Non - GAAP Earnings (Loss) Per Share Q1 Q2 Q3 Q4 GAAP Net loss attributable to 3D Systems Corporation ($17.8) ($4.6) ($21.2) $5.2 Adjustments: Amortization, stock-based compensation & other 1 $ 20.5 $ 16.1 $ 29.1 $ 12.7 Legal and acquisition-related 2 $ 1.0 $ 1.8 $ 1.8 - Portfolio restructuring 3 - - $ 6.1 - Tax effect of adjustments 4 $ 1.5 - - ($1.2) Non-GAAP net income attributable to 3D Systems Corporation $5.2 $13.3 $15.8 $16.7 Non-GAAP net income per share available to 3D Systems common stock holders - basic and diluted 5 $0.05 $0.12 $0.14 $0.15 5 Denominator based on diluted shares used in the GAAP EPS calculation. ($ in millions, except per share amounts) 2016 1 Of which $0.1, $0.1, $10.1 and $0.1 are included in COGS and $20.4, $16.0, $18.3 and $12.6 are included in SG&A in first through fourth quarters, respectively. 2 Of which $1.0, $1.8, $1.8 and $0.0 are included in SG&A in first through fourth quarters, respectively. 3 Of which all is included in R&D. 4 Tax effect for the quarter ended March 31, 2016 was calculated quarterly based on the Company's overall tax rate. Tax effect for the quarters ended after March 31, 2016 were calculated based on the Company's quarterly U.S. tax rate of 0%, which is due to valuation allowances in connection with GAAP net losses. The amount in the fourth quarter includes $1.2 million related to an adjustment for a prior period.

Non - GAAP Reconciliation 30 2016 Non - GAAP Operating Expenses Q1 Q2 Q3 Q4 GAAP R&D Expenses $ 20.3 $ 20.9 $ 26.1 $ 21.1 GAAP SG&A Expenses $ 74.0 $ 63.2 $ 64.8 $ 57.8 GAAP Operating Expenses $94.3 $84.1 $90.9 $78.9 Adjustments: Amortization, stock-based compensation & other 1 $ 20.4 $ 16.0 $ 18.3 $ 12.6 Legal and acquisition-related 1 $ 1.0 $ 1.8 $ 1.8 - Portfolio restructuring 2 - - $ 6.1 - Non-GAAP Operating Expenses $72.9 $66.3 $64.7 $66.3 ($ in millions, except per share amounts) 2016 1 Of which all amounts are included in SG&A. 2 Of which all amounts are included in R&D.

Thank You