Attached files
| file | filename |
|---|---|
| 8-K - 8-K - Summit Hotel Properties, Inc. | tv477996_8k.htm |
Exhibit 99.1
 |
12600 Hill Country Blvd., Suite R-100, Austin, TX 78738 |
| Telephone: 512-538-2300 Fax: 512-538-2333 | |
| www.shpreit.com | |
NEWS RELEASE
SUMMIT HOTEL PROPERTIES REPORTS THIRD QUARTER 2017 RESULTS
Net Income of $18.2 million;
Adjusted FFO climbs 13.6 percent to $36.7 million, $0.35 per share;
Pro Forma RevPAR increases 1.2 percent
Austin, Texas, October 30, 2017 --- Summit Hotel Properties, Inc. (NYSE: INN) (the “Company”), today announced results for the third quarter of 2017.
“In the third quarter, both our top and bottom line results came in at or above the high-end of our expectations going in to the quarter despite what was generally a challenging operating environment. Pro forma RevPAR growth of 1.2 percent in the quarter further validates our diverse and well-positioned portfolio as 60 percent of our markets exceeded the STR Upscale average and our portfolio once again gained market share against our respective competitive sets,” said Dan Hansen, the Company’s Chairman, President and Chief Executive Officer. “We continued to enhance the flexibility of our balance sheet during the quarter with the closing of a $225 million unsecured term loan. As a result, we finished the quarter with over $400 million of liquidity to pursue value creation opportunities,” commented Mr. Hansen.
Third Quarter 2017 Summary
| · | Net Income: Net income attributable to common stockholders decreased to $18.2 million, or $0.17 per diluted share, compared with $22.1 million, or $0.25 per diluted share, in the same period of 2016. When excluding the $7.7 million and $10.5 million pretax gain on disposal of assets during the three months ended September 30, 2017 and 2016, respectively, net income attributable to common stockholders decreased by $1.1 million as compared to the same period in 2016. |
| · | Pro Forma RevPAR: Pro forma revenue per available room (“RevPAR”) increased 1.2 percent to $119.13 from the same period in 2016. Pro forma occupancy increased 2.4 percent to 80.5 percent, which was partially offset by a 1.1 percent decrease in average daily rate (“ADR”) to $148.05. |
| · | Same-Store RevPAR: Same-store RevPAR grew to $115.04, an increase of 0.6 percent from the same period in 2016. Same-store occupancy increased by 2.0 percent to 80.6 percent, which was partially offset by a 1.4 percent decrease in ADR to $142.80 compared to the same period in 2016. |
| · | Pro Forma Hotel EBITDA: Pro forma hotel EBITDA was $50.5 million, a decrease of 3.4 percent over the same period in 2016. Pro forma hotel EBITDA margin contracted by 160 basis points to 37.0 percent from 38.6 percent in the same period of 2016. Excluding the effect of property tax increases, pro forma hotel EBITDA margin contracted by 41 basis points to 38.2 percent. |
| · | Adjusted EBITDA: Adjusted EBITDA increased 13.6 percent to $47.8 million from $42.1 million in the same period of 2016. |
 | 1 | Page |
| · | Adjusted FFO: Adjusted Funds from Operations (“AFFO”) increased 13.6 percent to $36.7 million, or $0.35 per diluted share, from $32.3 million in the same period of 2016. |
| · | Acquisitions: The Company acquired the 255-guestroom AC Hotel by Marriott Atlanta Downtown for an aggregate purchase price of $57.5 million, or $225,500 per key. |
| · | Dispositions: The Company sold three hotels containing a total of 273 guestrooms for an aggregate sales price of $27.8 million, or an average of $101,600 per key. The hotels had a combined RevPAR of $85.03 for the twelve months ended June 30, 2017 which is a 26.3% discount to the pro forma portfolio’s RevPAR for the same period. |
The Company’s results for the three and nine months ended September 30, 2017 and 2016 are as follows:
| For the Three Months Ended September 30, | For the Nine Months Ended September 30, | |||||||||||||||
| 2017 | 2016 | 2017 | 2016 | |||||||||||||
| (Unaudited) | ||||||||||||||||
| ($ in thousands, except per unit and RevPAR data) | ||||||||||||||||
| Net income attributable to common stockholders | $ | 18,190 | $ | 22,090 | $ | 76,845 | $ | 84,146 | ||||||||
| Net income per diluted share and unit | $ | 0.17 | $ | 0.25 | $ | 0.78 | $ | 0.96 | ||||||||
| Total revenues | $ | 136,587 | $ | 118,336 | $ | 383,632 | $ | 363,613 | ||||||||
| EBITDA (1) | $ | 53,556 | $ | 50,453 | $ | 173,796 | $ | 173,277 | ||||||||
| Adjusted EBITDA (1) | $ | 47,831 | $ | 42,105 | $ | 135,669 | $ | 130,382 | ||||||||
| FFO (1) | $ | 34,004 | $ | 30,093 | $ | 95,369 | $ | 88,638 | ||||||||
| Adjusted FFO (1) | $ | 36,653 | $ | 32,266 | $ | 102,612 | $ | 97,045 | ||||||||
| FFO per diluted share and unit (1) (2) | $ | 0.33 | $ | 0.34 | $ | 0.96 | $ | 1.02 | ||||||||
| Adjusted FFO per diluted share and unit (1) (2) | $ | 0.35 | $ | 0.37 | $ | 1.04 | $ | 1.11 | ||||||||
| Pro Forma (3) | ||||||||||||||||
| RevPAR | $ | 119.13 | $ | 117.69 | $ | 119.18 | $ | 119.32 | ||||||||
| RevPAR growth | 1.2 | % | -0.1 | % | ||||||||||||
| Hotel EBITDA | $ | 50,458 | $ | 52,250 | $ | 152,282 | $ | 160,450 | ||||||||
| Hotel EBITDA margin | 37.0 | % | 38.6 | % | 37.6 | % | 39.3 | % | ||||||||
| Hotel EBITDA margin growth | -160 bps | -174 bps | ||||||||||||||
| (1) | See tables later in this press release for a discussion and reconciliation of net income to non-GAAP financial measures, including earnings before interest, taxes, depreciation and amortization (“EBITDA”), adjusted EBITDA, funds from operations (“FFO”), FFO per diluted share and unit, adjusted FFO (“AFFO”), and AFFO per diluted share and unit, as well as a reconciliation of operating income to hotel EBITDA. See “Non-GAAP Financial Measures” at the end of this release. Non-GAAP financial measures are unaudited. |
| (2) | Amounts are based on 104,149,000 weighted average diluted common shares and units and 87,401,000 weighted average diluted common shares and units for the three months ended September 30, 2017, and 2016, respectively, and 99,062,000 weighted average diluted common shares and units and 87,319,000 weighted average diluted common shares and units for the nine months ended September 30, 2017, and 2016, respectively. The Company includes the outstanding common units of limited partnership interests (“OP Units”) in Summit Hotel OP, LP, the Company’s operating partnership, held by limited partners other than the Company in the determination of weighted average diluted common shares and units because the OP Units are redeemable for cash or, at the Company’s option, shares of the Company’s common stock on a one-for-one basis. |
| (3) | Unless stated otherwise in this release, all pro forma information includes operating and financial results for 79 hotels owned as of September 30, 2017, as if each hotel had been owned by the Company since January 1, 2016. As a result, all pro forma information includes operating and financial results for hotels acquired since January 1, 2016, which includes periods prior to the Company’s ownership. Pro forma and non-GAAP financial measures are unaudited. |
| | 2 | Page |
Year-To-Date 2017 Summary
| · | Net Income: Net income attributable to common stockholders decreased to $76.8 million, or $0.78 per diluted share, compared with $84.1 million, or $0.96 per diluted share, in the same period of 2016. When excluding the $43.5 million and $50.0 million pretax gain on disposal of assets during the nine months ended September 30, 2017 and 2016, respectively, net income attributable to common stockholders decreased by $0.8 million as compared to the same period in 2016. |
| · | Pro Forma RevPAR: Pro forma revenue per available room (“RevPAR”) decreased 0.1 percent from the same period in 2016 to $119.18. Pro forma average daily rate (“ADR”) decreased 0.4 percent from the same period in 2016 to $150.70. Pro forma occupancy increased 0.3 percent to 79.1 percent. |
| · | Same-Store RevPAR: Same-store RevPAR declined to $115.87, a decrease of 0.8 percent from the same period in 2016. Same-store ADR decreased 1.0 percent from the same period in 2016 to $145.20. Same-store occupancy increased by 0.2 percent to 79.8 percent from the same period in 2016. |
| · | Pro Forma Hotel EBITDA: Pro forma hotel EBITDA was $152.3 million, a decrease of 5.1 percent from the same period in 2016. Pro forma hotel EBITDA margin contracted by 174 basis points to 37.6 percent from the same period of 2016. |
| · | Adjusted EBITDA: Adjusted EBITDA increased 4.1 percent to $135.7 million from $130.4 million in the same period of 2016. |
| · | Adjusted FFO: Adjusted Funds from Operations (“AFFO”) increased to $102.6 million, or $1.04 per diluted share, an increase in AFFO of 5.7 percent from the same period in 2016. |
| · | Acquisitions: The Company acquired ten hotels containing 1,790 guestrooms for an aggregate purchase price of $422.0 million, or an average of $235,700 per key. |
| · | Dispositions: The Company sold twelve hotels containing 1,164 guestrooms for an aggregate sales price of $120.2 million, or an average of $103,200 per key. |
[Remainder of Page Intentionally Blank]
| | 3 | Page |
Acquisitions
On July 13, 2017, the Company completed the acquisition of the 255-guestroom AC Hotel by Marriott Atlanta Downtown (the “Hotel”) for a total purchase price of $57.5 million, or $225,500 per key, and entered into a management agreement with Interstate Hotels & Resorts. Opened as an AC Hotel by Marriott in May 2017, the Hotel recently underwent a complete renovation and repositioning of approximately $20 million, or $78,400 per key. The AC Hotel by Marriott is one of Marriott’s newest distinctive brands offering a stylish, yet very efficient and purposeful feel.
The Hotel’s prime location in the heart of Downtown Atlanta will benefit from various business and leisure demand generators. Atlanta is home to 27 of the Fortune 1000 companies and benefits from Hartsfield-Jackson Atlanta International Airport, the busiest airport in the world servicing more than 100 million passengers per year. Major corporations and organizations such as the American Cancer Society, Ernst & Young, Georgia Power, Georgia-Pacific, Coca-Cola and Turner Broadcasting System are all located within one mile of the Hotel. Significant leisure demand generators such as the Georgia Aquarium, World of Coca-Cola, College Football Hall of Fame, CNN Studios, and SkyView Atlanta are also within walking distance. The recently opened 75,000-seat Mercedes-Benz Stadium, the new home of the NFL’s Atlanta Falcons and MLS’ Atlanta United, is located only steps from the hotel.

Dispositions
On July 21, 2017, the Company completed the sale of a 273-guestroom, three-hotel portfolio located in suburban Fort Worth, Texas for a total sales price of $27.8 million, or approximately $102,000 per key. The portfolio included the 105-guestroom Hampton Inn & Suites Fort Worth West I-30, the 98-guestroom Hilton Garden Inn Fort Worth/Fossil Creek, and the 70-guestroom Fairfield Inn & Suites Fort Worth West I-30. The sale resulted in a net gain of $8.1 million and represented a capitalization rate of 7.9 percent on the hotels’ net operating income, including planned capital improvements, for the trailing twelve months ended June 30, 2017.
Capital Investment
The Company invested $11.3 million and $25.3 million in capital improvements during the three and nine months ended September 30, 2017, respectively. The scope of work ranged from common space improvements to complete guestroom renovations, including furniture, soft goods and guest bathrooms. Through the remainder of 2017, the Company expects to invest another $15.0 million to $20.0 million in capital improvements.
| | 4 | Page |
Capital Markets & Balance Sheet
During the third quarter and subsequent to quarter end, the Company executed on the following capital markets transactions:
| · | On September 26, 2017, the Company entered into a new $225 million unsecured term loan. The loan includes an accordion feature that, subject to certain conditions, allows the Company to request an increase in lender commitments up to an aggregate of $400 million. The unsecured term loan matures on November 25, 2022, carries an interest rate based on a pricing grid ranging from 145 basis points to 220 basis points plus LIBOR depending upon the Company’s leverage ratio, includes a delayed draw feature, and is prepayable without penalty at any time. At closing, the Company received an initial loan advance of $125 million and may draw the remaining $100 million at any time prior to September 20, 2018. Net proceeds from the initial loan advance were utilized to pay down outstanding advances under the Company’s unsecured revolving credit facility. |
| · | On October 2, 2017, the Company entered into two separate $100 million interest rate swap agreements with an effective date of January 29, 2018, to partially fix the interest rate on a portion of its variable interest rate unsecured indebtedness. The swaps convert LIBOR from a floating rate to an average fixed rate of 1.98% through January 31, 2023. |
At September 30, 2017, the Company had the following:
| · | Total outstanding debt of $777.5 million with a weighted average interest rate of 3.78 percent. |
| · | Undrawn capacity on its unsecured credit facilities and other debt instruments totaling $382.6 million. |
| · | Total net debt, which the Company defines as total outstanding debt less cash and cash equivalents, to trailing twelve month pro forma adjusted EBITDA of 3.9x. |
At October 20, 2017, the Company had the following:
| · | Total outstanding debt of $781.8 million with a weighted average interest rate of 3.78 percent. |
| · | Undrawn capacity on its unsecured credit facilities and other debt instruments totaling $377.6 million. |
Dividends
On October 30, 2017, the Company declared a quarterly cash dividend of $0.17 per share on its common stock and per common unit of limited partnership interest in Summit Hotel OP, LP. The annualized dividend of $0.68 per common share and per common unit represents an annual yield of 4.3 percent based on the October 27, 2017 closing stock price.
In addition, the Company declared a quarterly cash dividend of:
| · | $0.4921875 per share on its 7.875% Series B Cumulative Redeemable Preferred Stock. |
| · | $0.4453125 per share on its 7.125% Series C Cumulative Redeemable Preferred Stock. |
| · | $0.403125 per share on its 6.45% Series D Cumulative Redeemable Preferred Stock. |
The dividends are payable on November 30, 2017 to holders of record as of November 16, 2017.
| | 5 | Page |
2017 Outlook
The Company is providing its outlook for the fourth quarter and full year 2017 based on its 79 hotels owned as of October 30, 2017. There are no future acquisitions, dispositions, or capital markets activities assumed in the Company’s outlook for the fourth quarter and full year 2017.
| FOURTH QUARTER 2017 | ||||||||
| ($ in thousands, except RevPAR and per unit data) | ||||||||
| Low | High | |||||||
| Pro forma RevPAR (79) 1 | $ | 107.75 | $ | 109.75 | ||||
| Pro forma RevPAR growth (79) 1 | 2.00 | % | 4.00 | % | ||||
| RevPAR (same-store 65) 2 | $ | 103.50 | $ | 105.50 | ||||
| RevPAR growth (same-store 65) 2 | 0.00 | % | 2.00 | % | ||||
| Adjusted FFO | $ | 27,200 | $ | 30,200 | ||||
| Adjusted FFO per diluted unit 3 | $ | 0.26 | $ | 0.29 | ||||
| FULL YEAR 2017 | ||||||||
| ($ in thousands, except RevPAR and per unit data) | ||||||||
| Low | High | |||||||
| Pro forma RevPAR (79) 1 | $ | 116.25 | $ | 116.75 | ||||
| Pro forma RevPAR growth (79) 1 | 0.25 | % | 0.75 | % | ||||
| RevPAR (same-store 65) 2 | $ | 112.50 | $ | 113.00 | ||||
| RevPAR growth (same-store 65) 2 | (0.75 | %) | (0.25 | %) | ||||
| Adjusted FFO | $ | 129,800 | $ | 132,800 | ||||
| Adjusted FFO per diluted unit 3 | $ | 1.29 | $ | 1.32 | ||||
| Capital improvements | $ | 40,000 | $ | 45,000 | ||||
| (1) | As of October 30, 2017, the Company owned 79 hotels. The pro forma outlook information includes operating estimates for 79 hotels as if each hotel had been owned since January 1, 2016. |
| (2) | As of October 30, 2017, the Company owned 65 same-store hotels. The same-store outlook information includes operating estimates for 65 hotels owned by the Company as of January 1, 2016. |
| (3) | Assumes weighted average diluted common shares and units outstanding of 104,200,000 for the fourth quarter 2017 and 100,300,000 for the full year 2017. |
| | 6 | Page |
Third Quarter 2017 Earnings Conference Call
The Company will conduct its quarterly conference call on Tuesday, October 31, 2017, at 9:00 a.m. (ET). To participate in the conference call, please dial 877-930-8101. The conference identification code for the call is 95308312. Additionally, a live webcast of the quarterly conference call will be available through the Company’s website, www.shpreit.com. A replay of the quarterly conference call webcast will be available until 11:59 PM ET Tuesday, November 7, 2017, by dialing 855-859-2056, conference identification code 95308312. A replay will also be available in the Investor Relations section of the Company’s website until February 28, 2018.
About Summit Hotel Properties
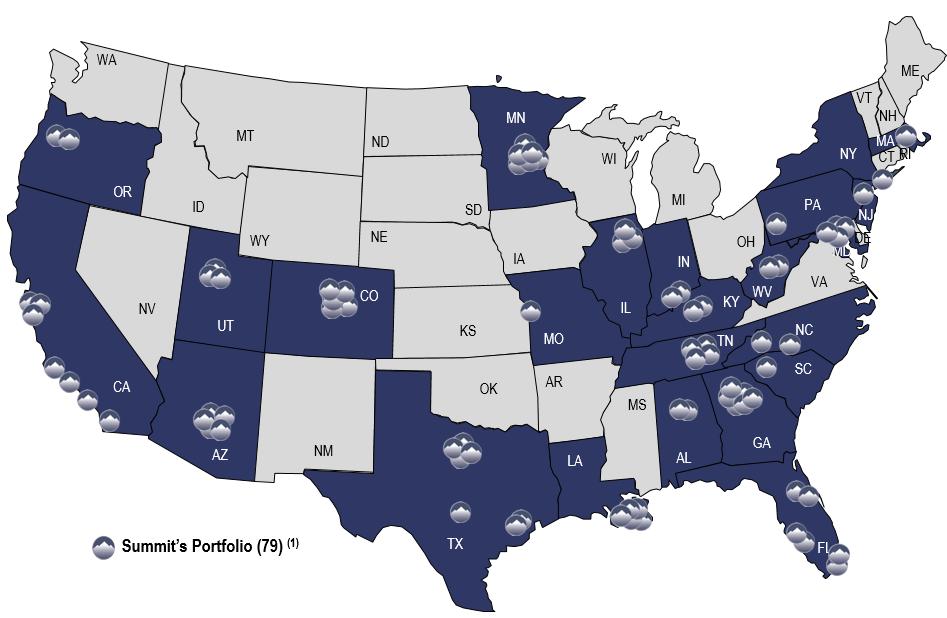
Summit Hotel Properties, Inc. is a publicly-traded real estate investment trust focused on owning premium-branded hotels with efficient operating models primarily in the upscale segment of the lodging industry. As of October 30, 2017, the Company’s portfolio consisted of 79 hotels with a total of 11,590 guestrooms located in 24 states.
For additional information, please visit the Company’s website, www.shpreit.com, and follow the Company on Twitter at @SummitHotel_INN.
Contact:
Adam Wudel
SVP – Finance & Capital Markets
Summit Hotel Properties, Inc.
(512) 538-2325
(1) Includes all acquisitions and dispositions completed as of October 30, 2017.
| | 7 | Page |
Forward-Looking Statements
This press release contains statements that are “forward-looking statements” within the meaning of Section 27A of the Securities Act of 1933, as amended, and Section 21E of the Securities Exchange Act of 1934, as amended, pursuant to the safe harbor provisions of the Private Securities Litigation Reform Act of 1995. Forward-looking statements are generally identifiable by use of forward-looking terminology such as “may,” “will,” “should,” “potential,” “intend,” “expect,” “seek,” “anticipate,” “estimate,” “approximately,” “believe,” “could,” “project,” “predict,” “forecast,” “continue,” “plan,” “likely,” “would” or other similar words or expressions. Forward-looking statements are based on certain assumptions and can include future expectations, future plans and strategies, financial and operating projections or other forward-looking information. Examples of forward-looking statements include the following: the Company’s ability to realize embedded growth from the deployment of renovation capital; projections of the Company’s revenues and expenses, capital expenditures or other financial items; descriptions of the Company’s plans or objectives for future operations, acquisitions, dispositions, financings, redemptions or services; forecasts of the Company’s future financial performance and potential increases in average daily rate, occupancy, RevPAR, room supply and demand, FFO and AFFO; the Company’s outlook with respect to pro forma RevPAR, pro forma RevPAR growth, RevPAR, RevPAR growth, AFFO, AFFO per diluted share and unit and renovation capital deployed; and descriptions of assumptions underlying or relating to any of the foregoing expectations regarding the timing of their occurrence. These forward-looking statements are subject to various risks and uncertainties, not all of which are known to the Company and many of which are beyond the Company’s control, which could cause actual results to differ materially from such statements. These risks and uncertainties include, but are not limited to, the state of the U.S. economy, supply and demand in the hotel industry, and other factors as are described in greater detail in the Company’s filings with the Securities and Exchange Commission (“SEC”). Unless legally required, the Company disclaims any obligation to update any forward-looking statements, whether as a result of new information, future events, or otherwise.
For information about the Company’s business and financial results, please refer to the “Management’s Discussion and Analysis of Financial Condition and Results of Operations” and “Risk Factors” sections of the Company’s Annual Report on Form 10-K for the year ended December 31, 2016, filed with the SEC, and its quarterly and other periodic filings with the SEC. The Company undertakes no duty to update the statements in this release to conform the statements to actual results or changes in the Company’s expectations.
| | 8 | Page |
SUMMIT HOTEL PROPERTIES, INC.
Condensed Consolidated Balance Sheets
(Amounts in thousands)
| September 30, 2017 | December 31, 2016 | |||||||
| (Unaudited) | ||||||||
| ASSETS | ||||||||
| Investment in hotel properties, net | $ | 1,902,949 | $ | 1,545,122 | ||||
| Investment in hotel properties under development | 18,754 | - | ||||||
| Land held for development | 2,942 | 5,742 | ||||||
| Assets held for sale | 1,193 | 62,695 | ||||||
| Investment in real estate loans, net | - | 17,585 | ||||||
| Cash and cash equivalents | 52,451 | 34,694 | ||||||
| Restricted cash | 28,933 | 24,881 | ||||||
| Trade receivables, net | 20,899 | 11,807 | ||||||
| Prepaid expenses and other | 5,294 | 6,474 | ||||||
| Deferred charges, net | 4,669 | 3,727 | ||||||
| Other assets | 5,794 | 5,778 | ||||||
| Total assets | $ | 2,043,878 | $ | 1,718,505 | ||||
| LIABILITIES AND EQUITY | ||||||||
| Liabilities: | ||||||||
| Debt, net of debt issuance costs | $ | 772,275 | $ | 652,414 | ||||
| Accounts payable | 7,257 | 4,623 | ||||||
| Accrued expenses and other | 56,306 | 46,880 | ||||||
| Derivative financial instruments | 438 | 1,118 | ||||||
| Total liabilities | 836,276 | 705,035 | ||||||
| Total stockholders' equity | 1,204,516 | 1,010,042 | ||||||
| Non-controlling interests in operating partnership | 3,086 | 3,428 | ||||||
| Total equity | 1,207,602 | 1,013,470 | ||||||
| Total liabilities and equity | $ | 2,043,878 | $ | 1,718,505 | ||||
| | 9 | Page |
SUMMIT HOTEL PROPERTIES, INC.
Condensed Consolidated Statements of Operations
(Amounts in thousands, except per share amounts)
| For the Three Months Ended September 30, | For the Nine Months Ended September 30, | |||||||||||||||
| 2017 | 2016 | 2017 | 2016 | |||||||||||||
| Revenues: | (unaudited) | |||||||||||||||
| Room | $ | 127,246 | $ | 110,777 | $ | 358,110 | $ | 340,657 | ||||||||
| Other hotel operations revenue | 9,341 | 7,559 | 25,522 | 22,956 | ||||||||||||
| Total revenues | 136,587 | 118,336 | 383,632 | 363,613 | ||||||||||||
| Expenses: | ||||||||||||||||
| Hotel operating expenses: | ||||||||||||||||
| Room | 33,404 | 28,705 | 91,221 | 82,959 | ||||||||||||
| Other direct | 16,846 | 15,513 | 49,255 | 48,596 | ||||||||||||
| Other indirect | 35,820 | 29,312 | 100,297 | 92,870 | ||||||||||||
| Total hotel operating expenses | 86,070 | 73,530 | 240,773 | 224,425 | ||||||||||||
| Depreciation and amortization | 23,594 | 17,887 | 62,052 | 53,715 | ||||||||||||
| Corporate general and administrative | 4,550 | 4,388 | 14,998 | 14,358 | ||||||||||||
| Hotel property acquisition costs | - | 527 | 354 | 2,809 | ||||||||||||
| Loss on impairment of assets | - | 577 | - | 577 | ||||||||||||
| Total expenses | 114,214 | 96,909 | 318,177 | 295,884 | ||||||||||||
| Operating income | 22,373 | 21,427 | 65,455 | 67,729 | ||||||||||||
| Other income (expense): | ||||||||||||||||
| Interest expense | (7,768 | ) | (6,626 | ) | (21,486 | ) | (21,232 | ) | ||||||||
| Gain on disposal of assets, net | 7,725 | 10,491 | 43,531 | 49,997 | ||||||||||||
| Other income (expense), net | (116 | ) | 661 | 2,847 | 1,854 | |||||||||||
| Total other income (expense) | (159 | ) | 4,526 | 24,892 | 30,619 | |||||||||||
| Income from continuing operations before income taxes | 22,214 | 25,953 | 90,347 | 98,348 | ||||||||||||
| Income tax benefit (expense) | 231 | 1,245 | (613 | ) | (461 | ) | ||||||||||
| Net income | 22,445 | 27,198 | 89,734 | 97,887 | ||||||||||||
| Less - Income attributable to Operating Partnership | (55 | ) | (115 | ) | (289 | ) | (454 | ) | ||||||||
| Net income attributable to Summit Hotel Properties, Inc. | 22,390 | 27,083 | 89,445 | 97,433 | ||||||||||||
| Preferred dividends | (4,200 | ) | (4,993 | ) | (12,600 | ) | (13,287 | ) | ||||||||
| Net income attributable to common stockholders | $ | 18,190 | $ | 22,090 | $ | 76,845 | $ | 84,146 | ||||||||
| Earnings per share: | ||||||||||||||||
| Basic | $ | 0.18 | $ | 0.25 | $ | 0.78 | $ | 0.97 | ||||||||
| Diluted | $ | 0.17 | $ | 0.25 | $ | 0.78 | $ | 0.96 | ||||||||
| Weighted average common shares outstanding: | ||||||||||||||||
| Basic | 103,253 | 86,492 | 98,105 | 86,428 | ||||||||||||
| Diluted | 103,632 | 87,401 | 98,471 | 87,319 | ||||||||||||
| | 10 | Page |
SUMMIT HOTEL PROPERTIES, INC.
Reconciliation of Net Income to Non-GAAP Measures – Funds From Operations
(Unaudited)
(In thousands except per share and unit amounts)
| For the Three Months Ended September 30, | For the Nine Months Ended September 30, | |||||||||||||||
| 2017 | 2016 | 2017 | 2016 | |||||||||||||
| Net income | $ | 22,445 | $ | 27,198 | $ | 89,734 | $ | 97,887 | ||||||||
| Preferred dividends | (4,200 | ) | (4,993 | ) | (12,600 | ) | (13,287 | ) | ||||||||
| Net income applicable to common shares and units | 18,245 | 22,205 | 77,134 | 84,600 | ||||||||||||
| Net income per common share and unit | $ | 0.18 | $ | 0.25 | $ | 0.78 | $ | 0.97 | ||||||||
| Real estate-related depreciation (1) | 23,484 | 17,802 | 61,766 | 53,458 | ||||||||||||
| Loss on impairment of assets | - | 577 | - | 577 | ||||||||||||
| Gain on disposal of assets | (7,725 | ) | (10,491 | ) | (43,531 | ) | (49,997 | ) | ||||||||
| FFO applicable to common shares and units | 34,004 | 30,093 | 95,369 | 88,638 | ||||||||||||
| FFO per common share and unit | $ | 0.33 | $ | 0.34 | $ | 0.96 | $ | 1.02 | ||||||||
| Amortization of deferred financing costs | 539 | 522 | 1,553 | 1,625 | ||||||||||||
| Amortization of franchise fees (1) | 110 | 85 | 286 | 257 | ||||||||||||
| Equity-based compensation | 1,489 | 1,020 | 4,483 | 3,202 | ||||||||||||
| Hotel property acquisition costs | - | 527 | 354 | 2,809 | ||||||||||||
| Debt transaction costs | 23 | 38 | 180 | 514 | ||||||||||||
| Gain on derivative instruments | - | (19 | ) | - | - | |||||||||||
| Loss from net casualties | 488 | - | 387 | - | ||||||||||||
| Adjusted Funds From Operations | $ | 36,653 | $ | 32,266 | $ | 102,612 | $ | 97,045 | ||||||||
| AFFO per common share and unit | $ | 0.35 | $ | 0.37 | $ | 1.04 | $ | 1.11 | ||||||||
| Weighted average diluted common units (2) | 104,149 | 87,401 | 99,062 | 87,319 | ||||||||||||
| (1) | The total of these line items represents depreciation and amortization as reported on the Company’s Condensed Consolidated Statements of Operations for the periods presented. |
| (2) | The Company includes the outstanding OP units issued by Summit Hotel OP, LP, the Company’s operating partnership, held by limited partners other than the Company because the OP units are redeemable for cash or, at the Company’s option, shares of the Company’s common stock on a one-for-one basis. |
| | 11 | Page |
SUMMIT HOTEL PROPERTIES, INC.
Reconciliation of Net Income to Non-GAAP Measures – EBITDA
(Unaudited)
(Amounts in thousands)
| For the Three Months Ended September 30, | For the Nine Months Ended September 30, | |||||||||||||||
| 2017 | 2016 | 2017 | 2016 | |||||||||||||
| Net income | $ | 22,445 | $ | 27,198 | $ | 89,734 | $ | 97,887 | ||||||||
| Depreciation and amortization | 23,594 | 17,887 | 62,052 | 53,715 | ||||||||||||
| Interest expense | 7,768 | 6,626 | 21,486 | 21,232 | ||||||||||||
| Interest income | (20 | ) | (13 | ) | (89 | ) | (18 | ) | ||||||||
| Income tax (benefit) expense | (231 | ) | (1,245 | ) | 613 | 461 | ||||||||||
| EBITDA | $ | 53,556 | $ | 50,453 | $ | 173,796 | $ | 173,277 | ||||||||
| Equity-based compensation | 1,489 | 1,020 | 4,483 | 3,202 | ||||||||||||
| Hotel property acquisition costs | - | 527 | 354 | 2,809 | ||||||||||||
| Loss on impairment of assets | - | 577 | - | 577 | ||||||||||||
| Debt transaction costs | 23 | 38 | 180 | 514 | ||||||||||||
| Gain on disposal of assets | (7,725 | ) | (10,491 | ) | (43,531 | ) | (49,997 | ) | ||||||||
| Gain on derivative instruments | - | (19 | ) | - | - | |||||||||||
| Loss from net casualties | 488 | - | 387 | - | ||||||||||||
| Adjusted EBITDA | $ | 47,831 | $ | 42,105 | $ | 135,669 | $ | 130,382 | ||||||||
| | 12 | Page |
SUMMIT HOTEL PROPERTIES, INC.
Pro Forma Hotel Operating Data
(Unaudited)
(Dollars in thousands)
| For the Three Months Ended September 30, | For the Nine Months Ended September 30, | |||||||||||||||
| Pro Forma Operating Data (1) (2) | 2017 | 2016 | 2017 | 2016 | ||||||||||||
| Pro forma room revenue | $ | 127,025 | $ | 125,450 | $ | 377,099 | $ | 377,977 | ||||||||
| Pro forma other hotel operations revenue | 9,344 | 9,923 | 28,190 | 30,127 | ||||||||||||
| Pro forma total revenues | 136,369 | 135,373 | 405,289 | 408,104 | ||||||||||||
| Pro forma total hotel operating expenses | 85,911 | 83,123 | 253,007 | 247,654 | ||||||||||||
| Pro forma hotel EBITDA | $ | 50,458 | $ | 52,250 | $ | 152,282 | $ | 160,450 | ||||||||
| Pro forma hotel EBITDA Margin | 37.0 | % | 38.6 | % | 37.6 | % | 39.3 | % | ||||||||
Reconciliations of Non-GAAP financial measures to comparable GAAP financial measures
| Revenue: | ||||||||||||||||
| Total revenues | $ | 136,587 | $ | 118,336 | $ | 383,632 | $ | 363,613 | ||||||||
| Total revenues from acquisitions (1) | 200 | 25,877 | 35,061 | 80,717 | ||||||||||||
| Total revenues from dispositions (2) | (418 | ) | (8,840 | ) | (13,404 | ) | (36,226 | ) | ||||||||
| Pro forma total revenues | 136,369 | 135,373 | 405,289 | 408,104 | ||||||||||||
| Hotel Operating Expenses: | ||||||||||||||||
| Total hotel operating expenses | 86,070 | 73,530 | 240,773 | 224,425 | ||||||||||||
| Total hotel operating expenses from acquisitions (1) | 206 | 15,845 | 21,938 | 48,691 | ||||||||||||
| Total hotel operating expenses from dispositions (2) | (365 | ) | (6,252 | ) | (9,704 | ) | (25,462 | ) | ||||||||
| Pro forma total hotel operating expenses | 85,911 | 83,123 | 253,007 | 247,654 | ||||||||||||
| Hotel EBITDA: | ||||||||||||||||
| Operating income | $ | 22,373 | $ | 21,427 | $ | 65,455 | $ | 67,729 | ||||||||
| Loss on impairment of assets | - | 577 | - | 577 | ||||||||||||
| Hotel property acquisition costs | - | 527 | 354 | 2,809 | ||||||||||||
| Corporate general and administrative expenses | 4,550 | 4,388 | 14,998 | 14,358 | ||||||||||||
| Depreciation and amortization | 23,594 | 17,887 | 62,052 | 53,715 | ||||||||||||
| Hotel EBITDA | 50,517 | 44,806 | 142,859 | 139,188 | ||||||||||||
| Hotel EBITDA from acquisitions (1) | (6 | ) | 10,032 | 13,123 | 32,026 | |||||||||||
| Hotel EBITDA from dispositions (2) | (53 | ) | (2,588 | ) | (3,700 | ) | (10,764 | ) | ||||||||
| Pro forma hotel EBITDA | $ | 50,458 | $ | 52,250 | $ | 152,282 | $ | 160,450 | ||||||||
| (1) | Pro forma information includes operating results for 79 hotels owned as of September 30, 2017 as if all such hotels had been owned by the Company since January 1, 2016. For hotels acquired by the Company after January 1, 2016 (the “Acquired Hotels”), the Company has included in the pro forma information the financial results of each of the Acquired Hotels for the period from January 1, 2016 to the date the Acquired Hotels were purchased by the Company (the “Pre-acquisition Period”). The financial results for the Pre-acquisition Period were provided by the third-party owner of such Acquired Hotel prior to purchase by the Company and have not been audited or reviewed by our auditors or adjusted by us. The pro forma information is included to enable comparison of results for the current reporting period to results for the comparable period of the prior year and are not indicative of future results. |
| (2) | For hotels sold by the Company between January 1, 2016 and September 30, 2017 (the “Disposed Hotels”), the pro forma information excludes the financial results of each of the Disposed Hotels for the period of ownership by the Company from January 1, 2016 through the date that the Disposed Hotels were sold by the Company. |
| | 13 | Page |
SUMMIT HOTEL PROPERTIES, INC.
Pro Forma Hotel Operating Data
(Unaudited)
(Dollars in thousands, except operating metrics)
| 2016 | 2017 | Trailing Twelve Months Ended | ||||||||||||||||||
| Pro Forma Operating Data (1) (2) | Q4 | Q1 | Q2 | Q3 | ||||||||||||||||
| Pro forma room revenue | $ | 112,523 | $ | 120,174 | $ | 129,900 | $ | 127,025 | $ | 489,622 | ||||||||||
| Pro forma other hotel operations revenue | 8,596 | 9,045 | 9,802 | 9,344 | 36,787 | |||||||||||||||
| Pro forma total revenues | 121,119 | 129,219 | 139,702 | 136,369 | 526,409 | |||||||||||||||
| Pro forma total hotel operating expenses | 77,110 | 81,470 | 85,627 | 85,911 | 330,118 | |||||||||||||||
| Pro forma hotel EBITDA | $ | 44,009 | $ | 47,749 | $ | 54,075 | $ | 50,458 | $ | 196,291 | ||||||||||
| Pro forma hotel EBITDA Margin | 36.3 | % | 37.0 | % | 38.7 | % | 37.0 | % | 37.3 | % | ||||||||||
| Pro Forma Statistics (1) (2) | ||||||||||||||||||||
| Rooms occupied | 774,433 | 787,870 | 856,406 | 857,975 | 3,276,684 | |||||||||||||||
| Rooms available | 1,065,636 | 1,043,100 | 1,054,687 | 1,066,280 | 4,229,703 | |||||||||||||||
| Occupancy | 72.7 | % | 75.5 | % | 81.2 | % | 80.5 | % | 77.5 | % | ||||||||||
| ADR | $ | 145.30 | $ | 152.53 | $ | 151.68 | $ | 148.05 | $ | 149.43 | ||||||||||
| RevPAR | $ | 105.59 | $ | 115.21 | $ | 123.16 | $ | 119.13 | $ | 115.76 | ||||||||||
| Actual Statistics | ||||||||||||||||||||
| Rooms occupied | 737,390 | 761,358 | 813,577 | 860,672 | 3,172,997 | |||||||||||||||
| Rooms Available | 1,002,482 | 990,913 | 986,998 | 1,069,100 | 4,049,493 | |||||||||||||||
| Occupancy | 73.6 | % | 76.8 | % | 82.4 | % | 80.5 | % | 78.4 | % | ||||||||||
| ADR | $ | 139.16 | $ | 144.94 | $ | 148.13 | $ | 147.84 | $ | 145.20 | ||||||||||
| RevPAR | $ | 102.36 | $ | 111.36 | $ | 122.10 | $ | 119.02 | $ | 113.77 | ||||||||||
| Reconciliations of non-GAAP financial measures to comparable GAAP financial measures | ||||||||||||||||||||
| Revenue: | ||||||||||||||||||||
| Total revenues | $ | 110,322 | $ | 117,989 | $ | 129,056 | $ | 136,587 | $ | 493,954 | ||||||||||
| Total revenues from acquisitions (1) | 18,927 | 19,965 | 14,895 | 200 | 53,987 | |||||||||||||||
| Total revenues from dispositions (2) | (8,130 | ) | (8,735 | ) | (4,249 | ) | (418 | ) | (21,532 | ) | ||||||||||
| Pro forma total revenues | $ | 121,119 | $ | 129,219 | $ | 139,702 | $ | 136,369 | $ | 526,409 | ||||||||||
| Hotel Operating Expenses: | ||||||||||||||||||||
| Total hotel operating expenses | 71,256 | 75,204 | 79,499 | 86,070 | 312,029 | |||||||||||||||
| Total hotel operating expenses from acquisitions (1) | 11,691 | 12,472 | 9,260 | 206 | 33,629 | |||||||||||||||
| Total hotel operating expenses from dispositions (2) | (5,837 | ) | (6,206 | ) | (3,132 | ) | (365 | ) | (15,540 | ) | ||||||||||
| Total pro forma hotel operating expenses | 77,110 | 81,470 | 85,627 | 85,911 | 330,118 | |||||||||||||||
| Hotel EBITDA: | ||||||||||||||||||||
| Operating income | $ | 14,758 | $ | 18,567 | $ | 24,515 | $ | 22,373 | $ | 80,213 | ||||||||||
| Hotel property acquisition costs | 683 | 354 | - | - | 1,037 | |||||||||||||||
| Corporate general and administrative expenses | 4,934 | 5,138 | 5,310 | 4,550 | 19,932 | |||||||||||||||
| Depreciation and amortization | 18,691 | 18,726 | 19,732 | 23,594 | 80,743 | |||||||||||||||
| Hotel EBITDA | 39,066 | 42,785 | 49,557 | 50,517 | 181,925 | |||||||||||||||
| Hotel EBITDA from acquisitions (1) | 7,236 | 7,493 | 5,635 | (6 | ) | 20,358 | ||||||||||||||
| Hotel EBITDA from dispositions (2) | (2,293 | ) | (2,529 | ) | (1,117 | ) | (53 | ) | (5,992 | ) | ||||||||||
| Pro forma hotel EBITDA | $ | 44,009 | $ | 47,749 | $ | 54,075 | $ | 50,458 | $ | 196,291 | ||||||||||
| (1) | Pro forma information includes operating results for 79 hotels owned as of September 30, 2017 as if all such hotels had been owned by the Company since October 1, 2016. For hotels acquired by the Company after October 1, 2016 (the “Acquired Hotels”), the Company has included in the pro forma information the financial results of each of the Acquired Hotels for the period from October 1, 2016 to the date the Acquired Hotels were purchased by the Company (the “Pre-acquisition Period”). The financial results for the Pre-acquisition Period were provided by the third-party owner of such Acquired Hotel prior to purchase by the Company and have not been audited or reviewed by our auditors or adjusted by us. The pro forma information is included to enable comparison of results for the current reporting period to results for the comparable period of the prior year and are not indicative of future results. |
| (2) | For hotels sold by the Company between October 1, 2016 and September 30, 2017 (the “Disposed Hotels”), the pro forma information excludes the financial results of each of the Disposed Hotels for the period of ownership by the Company from October 1, 2016 through the date that the Disposed Hotels were sold by the Company. |
| | 14 | Page |
SUMMIT HOTEL PROPERTIES, INC.
Pro Forma and Same-Store Data
(Unaudited)
| For the Three Months Ended September 30, | For the Nine Months Ended September 30, | |||||||||||||||
| 2017 | 2016 | 2017 | 2016 | |||||||||||||
| Pro Forma 1 (79 hotels) | ||||||||||||||||
| Rooms occupied | 857,975 | 837,628 | 2,502,251 | 2,497,953 | ||||||||||||
| Rooms available | 1,066,280 | 1,065,946 | 3,164,067 | 3,167,865 | ||||||||||||
| Occupancy | 80.5 | % | 78.6 | % | 79.1 | % | 78.9 | % | ||||||||
| ADR | $ | 148.05 | $ | 149.77 | $ | 150.70 | $ | 151.31 | ||||||||
| RevPAR | $ | 119.13 | $ | 117.69 | $ | 119.18 | $ | 119.32 | ||||||||
| Occupancy change | 2.4 | % | 0.3 | % | ||||||||||||
| ADR change | -1.1 | % | -0.4 | % | ||||||||||||
| RevPAR change | 1.2 | % | -0.1 | % | ||||||||||||
| For the Three Months Ended September 30, | For the Nine Months Ended September 30, | |||||||||||||||
| 2017 | 2016 | 2017 | 2016 | |||||||||||||
| Same-Store 2 (65 hotels) | ||||||||||||||||
| Rooms occupied | 670,849 | 657,474 | 1,971,825 | 1,973,084 | ||||||||||||
| Rooms available | 832,692 | 832,048 | 2,470,920 | 2,478,056 | ||||||||||||
| Occupancy | 80.6 | % | 79.0 | % | 79.8 | % | 79.6 | % | ||||||||
| ADR | $ | 142.80 | $ | 144.77 | $ | 145.20 | $ | 146.66 | ||||||||
| RevPAR | $ | 115.04 | $ | 114.39 | $ | 115.87 | $ | 116.78 | ||||||||
| Occupancy change | 2.0 | % | 0.2 | % | ||||||||||||
| ADR change | -1.4 | % | -1.0 | % | ||||||||||||
| RevPAR change | 0.6 | % | -0.8 | % | ||||||||||||
| (1) | Pro forma information includes operating results for 79 hotels owned as of September 30, 2017, as if each hotel had been owned by the Company since January 1, 2016. As a result, these pro forma operating and financial measures include operating results for certain hotels for periods prior to the Company’s ownership. |
| (2) | Same-store information includes operating results for 65 hotels owned by the Company as of January 1, 2016, and at all times during the three and nine months ended September 30, 2017, and 2016. |
| | 15 | Page |
SUMMIT HOTEL PROPERTIES, INC.
Reconciliation of Net Income to Non-GAAP Measures – Funds From Operations for Financial Outlook
(Unaudited)
(Amounts in thousands except per share and unit)
| For the Three Months Ending December 31, 2017 | For the Year Ending December 31, 2017 | S | ||||||||||||||
| Low | High | Low | High | |||||||||||||
| Net income | $ | 6,300 | $ | 9,300 | $ | 95,900 | $ | 98,900 | ||||||||
| Preferred dividends | (4,200 | ) | (4,200 | ) | (16,800 | ) | (16,800 | ) | ||||||||
| Net income applicable to common shares and units | 2,100 | 5,100 | 79,100 | 82,100 | ||||||||||||
| Net income per common share and unit | $ | 0.02 | $ | 0.05 | $ | 0.79 | $ | 0.82 | ||||||||
| Real estate-related depreciation | 22,900 | 22,900 | 84,700 | 84,700 | ||||||||||||
| Gain on disposal of assets | - | - | (43,500 | ) | (43,500 | ) | ||||||||||
| FFO applicable to common shares and units | 25,000 | 28,000 | 120,300 | 123,300 | ||||||||||||
| FFO per common share and unit | $ | 0.24 | $ | 0.27 | $ | 1.20 | $ | 1.23 | ||||||||
| Amortization of deferred financing costs | 600 | 600 | 2,100 | 2,100 | ||||||||||||
| Amortization of franchise fees | 100 | 100 | 400 | 400 | ||||||||||||
| Equity-based compensation | 1,500 | 1,500 | 6,000 | 6,000 | ||||||||||||
| Hotel property acquisition costs | - | - | 400 | 400 | ||||||||||||
| Debt transaction costs | - | - | 200 | 200 | ||||||||||||
| Loss from net casualty recoveries | - | - | 400 | 400 | ||||||||||||
| Adjusted Funds From Operations | $ | 27,200 | $ | 30,200 | $ | 129,800 | $ | 132,800 | ||||||||
| AFFO per common share and unit | $ | 0.26 | $ | 0.29 | $ | 1.29 | $ | 1.32 | ||||||||
| Weighted average diluted common units (1) | 104,200 | 104,200 | 100,300 | 100,300 | ||||||||||||
| (1) | The Company includes the outstanding OP units issued by Summit Hotel OP, LP, the Company’s operating partnership, held by limited partners other than the Company because the OP units are redeemable for cash or, at the Company’s option, shares of the Company’s common stock on a one-for-one basis. |
| | 16 | Page |
Non-GAAP Financial Measures
Funds From Operations (“FFO”) and Adjusted FFO (“AFFO”)
As defined by the National Association of Real Estate Investment Trusts (“NAREIT”), FFO represents net income or loss (computed in accordance with GAAP), excluding preferred dividends, gains (or losses) from sales of real property, impairment losses on real estate assets, items classified by GAAP as extraordinary, the cumulative effect of changes in accounting principles, plus depreciation and amortization related to real estate assets, and adjustments for unconsolidated partnerships and joint ventures. Unless otherwise indicated, we present FFO applicable to our common shares and common units. We present FFO because we consider it an important supplemental measure of our operational performance and believe it is frequently used by securities analysts, investors, and other interested parties in the evaluation of REITs, many of which present FFO when reporting their results. FFO is intended to exclude GAAP historical cost depreciation and amortization, which assumes that the value of real estate assets diminishes ratably over time. Historically, however, real estate values have risen or fallen with market conditions. Because FFO excludes depreciation and amortization related to real estate assets, gains and losses from real property dispositions and impairment losses on real estate assets, it provides a performance measure that, when compared year over year, reflects the effect to operations from trends in occupancy, guestroom rates, operating costs, development activities and interest costs, providing perspective not immediately apparent from net income. Our computation of FFO differs slightly from the computation of NAREIT-defined FFO related to the reporting of corporate depreciation and amortization expense. Our computation may also differ from the methodology for calculating FFO used by other equity REITs and, accordingly, may not be comparable to such other REITs. FFO should not be considered as an alternative to net income (loss) (computed in accordance with GAAP) as an indicator of our liquidity, nor is it indicative of funds available to fund our cash needs, including our ability to pay dividends or make distributions. References to FFO are based on our computation of FFO and not the computation of NAREIT-defined FFO unless otherwise noted.
We further adjust FFO for certain additional items that are not included in the definition of FFO, such as hotel transaction and pursuit costs, equity-based compensation, loan transaction costs, prepayment penalties and certain other expenses, which we refer to as AFFO. We believe that AFFO provides investors with another financial measure that may facilitate comparisons of operating performance between periods and between REITs.
We caution investors that amounts presented in accordance with our definitions of FFO and AFFO may not be comparable to similar measures disclosed by other companies, since not all companies calculate these non-GAAP measures in the same manner. FFO and AFFO should be considered along with, but not as an alternative to, net income (loss) as a measure of our operating performance. FFO and AFFO may include funds that may not be available for our discretionary use due to functional requirements to conserve funds for capital expenditures, property acquisitions, debt service obligations and other commitments and uncertainties. Although we believe that FFO and AFFO can enhance the understanding of our financial condition and results of operations, these non-GAAP financial measures are not necessarily better indicators of any trend as compared to a comparable GAAP measure such as net income (loss). Above we have included a quantitative reconciliation of FFO and AFFO to the most directly comparable GAAP financial performance measure, which is net income (loss). Dollar amounts in such reconciliation are in thousands.
| | 17 | Page |
EBITDA, Adjusted EBITDA, and Hotel EBITDA
EBITDA represents net income or loss, excluding (i) interest, (ii) income tax expense and (iii) depreciation and amortization. We believe EBITDA is useful to investors in evaluating our operating performance because it provides investors with an indication of our ability to incur and service debt, to satisfy general operating expenses, to make capital expenditures, and to fund other cash needs or reinvest cash into our business. We also believe it helps investors meaningfully evaluate and compare the results of our operations from period to period by removing the effect of our asset base (primarily depreciation and amortization) from our operating results. Our management also uses EBITDA as one measure in determining the value of acquisitions and dispositions. We further adjust EBITDA by adding back hotel transaction and pursuit costs, equity-based compensation, impairment losses, and certain other nonrecurring expenses. We believe that adjusted EBITDA provides investors with another financial measure that may facilitate comparisons of operating performance between periods and between REITs.
With respect to hotel EBITDA, we believe that excluding the effect of corporate-level expenses and non-cash items provides a more complete understanding of the operating results over which individual hotels and operators have direct control. We believe the property-level results provide investors with supplemental information on the ongoing operational performance of our hotels and effectiveness of the third-party management companies operating our business on a property-level basis.
We caution investors that amounts presented in accordance with our definitions of EBITDA, adjusted EBITDA, and hotel EBITDA may not be comparable to similar measures disclosed by other companies, since not all companies calculate these non-GAAP measures in the same manner. EBITDA, adjusted EBITDA, and hotel EBITDA should not be considered as an alternative measure of our net income (loss) or operating performance. EBITDA, adjusted EBITDA, and hotel EBITDA may include funds that may not be available for our discretionary use due to functional requirements to conserve funds for capital expenditures and property acquisitions and other commitments and uncertainties. Although we believe that EBITDA, adjusted EBITDA, and hotel EBITDA can enhance your understanding of our financial condition and results of operations, these non-GAAP financial measures are not necessarily a better indicator of any trend as compared to a comparable GAAP measure such as net income (loss). Above, we include a quantitative reconciliation of EBITDA, adjusted EBITDA and hotel EBITDA to the most directly comparable GAAP financial performance measure, which is net income (loss) and operating income (loss).
| | 18 | Page |