Attached files
| file | filename |
|---|---|
| 8-K - ALBANY INTERNATIONAL CORP. 8-K - ALBANY INTERNATIONAL CORP /DE/ | a51707334.htm |
| EX-99.1 - EXHIBIT 99.1 - ALBANY INTERNATIONAL CORP /DE/ | a51707334ex99_1.htm |
Exhibit 99.2

Q3 Financial PerformanceOctober 30, 2017
‘Non-GAAP’ Items and Forward-Looking StatementsThis presentation contains the following non-GAAP measures:Percentage changes in net sales, excluding currency rate effects (for each segment, and the Company as a whole);Adjusted EBITDA (for each segment, and the Company as a whole; absolute and as a percentage of sales);Net debt; andNet income per share attributable to the Company, excluding adjustments. We think such items provide useful information to investors regarding the Company’s core operational performance. See the Company’s earnings release (which accompanies this presentation) for additional information including reconciliations to GAAP measures. This presentation also may contain statements, estimates, or projections that constitute “forward-looking statements” as defined under U.S. federal securities laws. Forward-looking statements are subject to certain risks and uncertainties that could cause actual results to differ materially from the Company’s historical experience and our present expectations or projections. We disclaim any obligation to update any information in this presentation to reflect any changes or developments after the date on the cover page. Certain additional disclosures regarding our use of these ‘non-GAAP’ items and forward-looking statements are set forth in our third-quarter earnings press release dated October 30, 2017, and in our SEC filings, including our most recent quarterly reports and our annual reports for the years ended December 31, 2014, 2015, and 2016. Our use of such items in this presentation is subject to those additional disclosures, which we urge you to read. 2
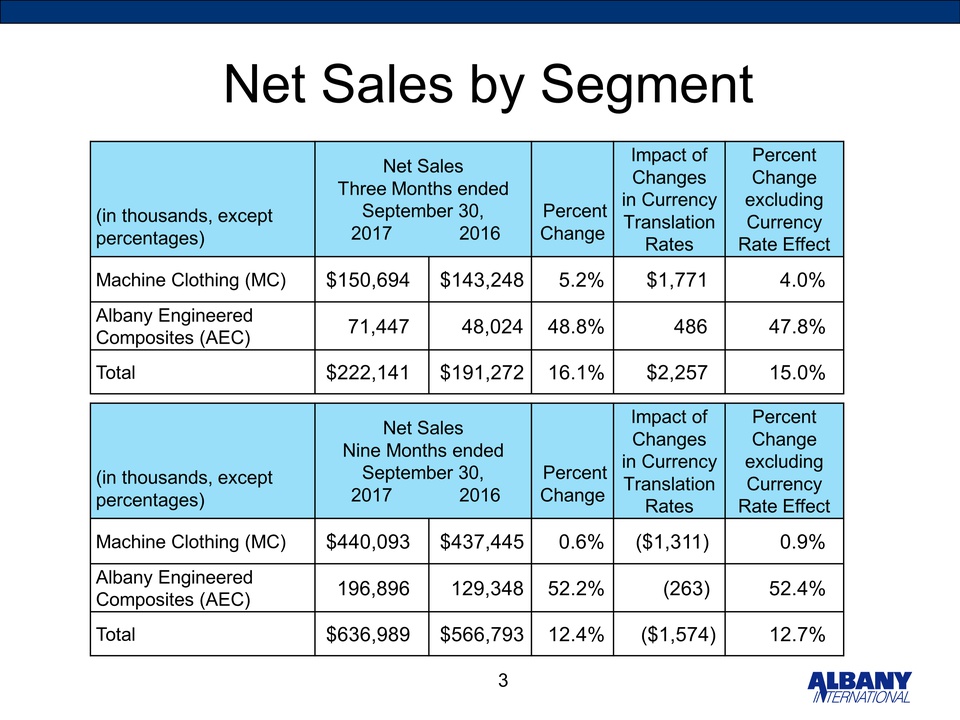
Net Sales by Segment 3 (in thousands, except percentages) Net SalesThree Months endedSeptember 30, 2017 2016 PercentChange Impact of Changesin CurrencyTranslation Rates Percent Changeexcluding Currency Rate Effect Machine Clothing (MC) $150,694 $143,248 5.2% $1,771 4.0% Albany Engineered Composites (AEC) 71,447 48,024 48.8% 486 47.8% Total $222,141 $191,272 16.1% $2,257 15.0% (in thousands, except percentages) Net SalesNine Months endedSeptember 30, 2017 2016 PercentChange Impact of Changesin CurrencyTranslation Rates Percent Changeexcluding Currency Rate Effect Machine Clothing (MC) $440,093 $437,445 0.6% ($1,311) 0.9% Albany Engineered Composites (AEC) 196,896 129,348 52.2% (263) 52.4% Total $636,989 $566,793 12.4% ($1,574) 12.7%
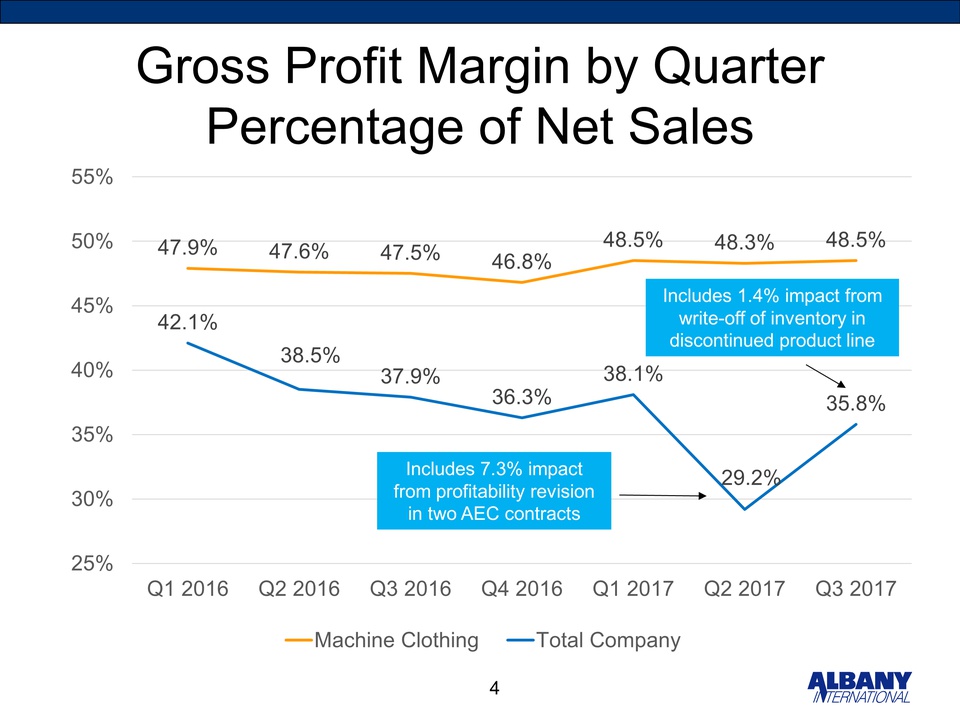
Gross Profit Margin by QuarterPercentage of Net Sales 4 Includes 7.3% impact from profitability revision in two AEC contracts
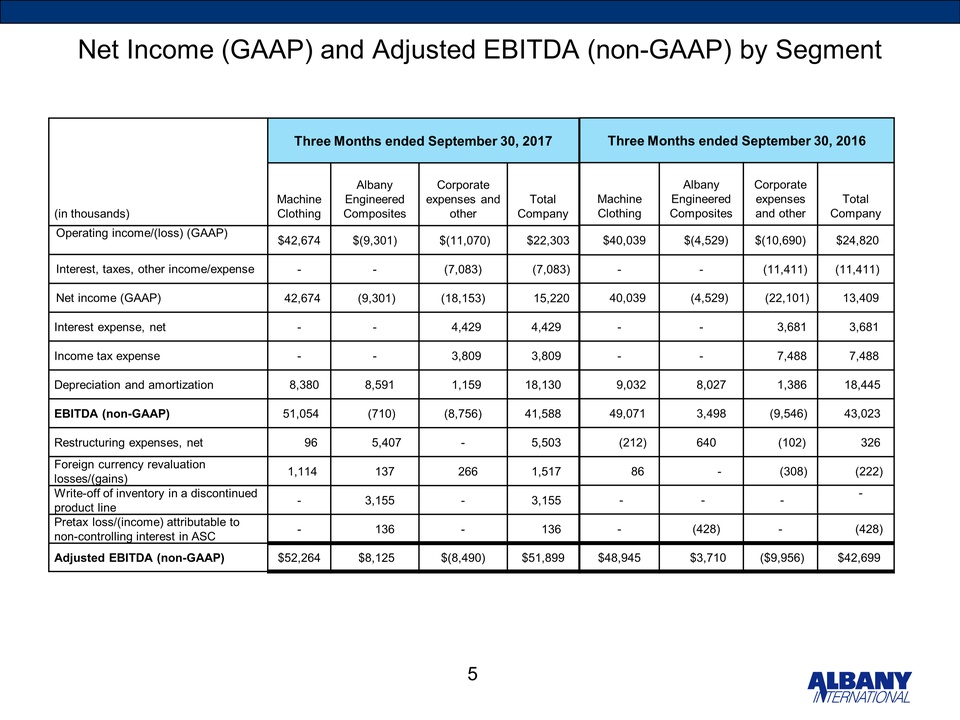
Net Income (GAAP) and Adjusted EBITDA (non-GAAP) by Segment 5 Three Months ended September 30, 2017 (in thousands) Machine Clothing Albany Engineered Composites Corporate expenses and other Total Company Operating income/(loss) (GAAP) $42,674 $(9,301) $(11,070) $22,303 Interest, taxes, other income/expense - - (7,083) (7,083) Net income (GAAP) 42,674 (9,301) (18,153) 15,220 Interest expense, net - - 4,429 4,429 Income tax expense - - 3,809 3,809 Depreciation and amortization 8,380 8,591 1,159 18,130 EBITDA (non-GAAP) 51,054 (710) (8,756) 41,588 Restructuring expenses, net 96 5,407 - 5,503 Foreign currency revaluation losses/(gains) 1,114 137 266 1,517 Write-off of inventory in a discontinued product line - 3,155 - 3,155 Pretax loss/(income) attributable to non-controlling interest in ASC - 136 - 136 Adjusted EBITDA (non-GAAP) $52,264 $8,125 $(8,490) $51,899 Three Months ended September 30, 2016 Machine Clothing Albany Engineered Composites Corporate expenses and other Total Company $40,039 $(4,529) $(10,690) $24,820 - - (11,411) (11,411) 40,039 (4,529) (22,101) 13,409 - - 3,681 3,681 - - 7,488 7,488 9,032 8,027 1,386 18,445 49,071 3,498 (9,546) 43,023 (212) 640 (102) 326 86 - (308) (222) - - - - - (428) - (428) $48,945 $3,710 ($9,956) $42,699
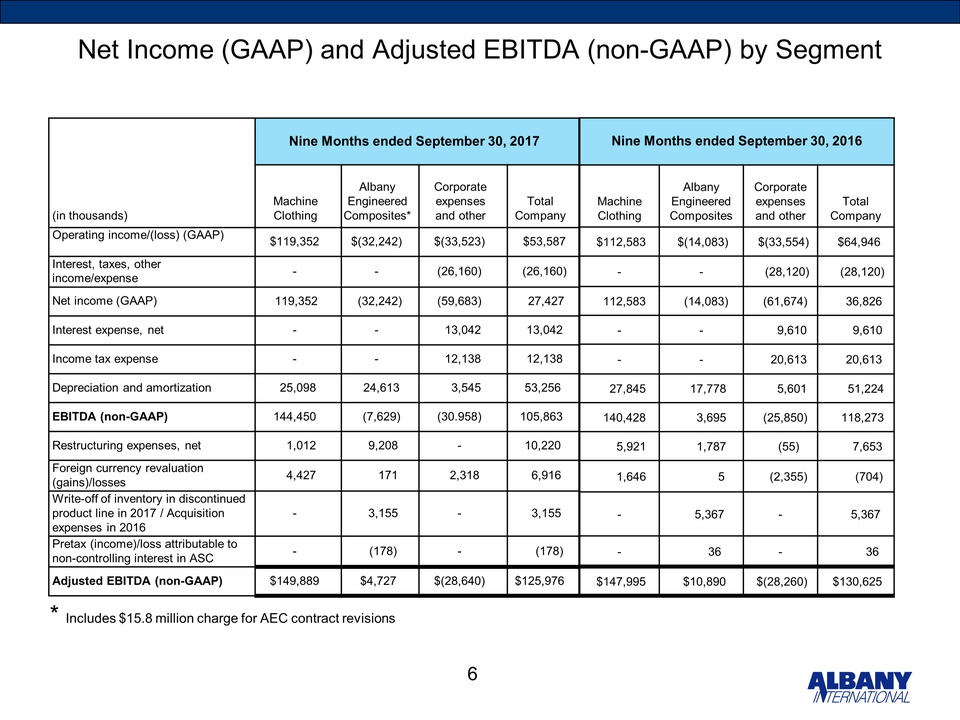
Net Income (GAAP) and Adjusted EBITDA (non-GAAP) by Segment 6 Nine Months ended September 30, 2017 (in thousands) Machine Clothing Albany Engineered Composites* Corporate expenses and other Total Company Operating income/(loss) (GAAP) $119,352 $(32,242) $(33,523) $53,587 Interest, taxes, other income/expense - - (26,160) (26,160) Net income (GAAP) 119,352 (32,242) (59,683) 27,427 Interest expense, net - - 13,042 13,042 Income tax expense - - 12,138 12,138 Depreciation and amortization 25,098 24,613 3,545 53,256 EBITDA (non-GAAP) 144,450 (7,629) (30.958) 105,863 Restructuring expenses, net 1,012 9,208 - 10,220 Foreign currency revaluation (gains)/losses 4,427 171 2,318 6,916 Write-off of inventory in discontinued product line in 2017 / Acquisition expenses in 2016 - 3,155 - 3,155 Pretax (income)/loss attributable to non-controlling interest in ASC - (178) - (178) Adjusted EBITDA (non-GAAP) $149,889 $4,727 $(28,640) $125,976 Nine Months ended September 30, 2016 Machine Clothing Albany Engineered Composites Corporate expenses and other Total Company $112,583 $(14,083) $(33,554) $64,946 - - (28,120) (28,120) 112,583 (14,083) (61,674) 36,826 - - 9,610 9,610 - - 20,613 20,613 27,845 17,778 5,601 51,224 140,428 3,695 (25,850) 118,273 5,921 1,787 (55) 7,653 1,646 5 (2,355) (704) - 5,367 - 5,367 - 36 - 36 $147,995 $10,890 $(28,260) $130,625 * Includes $15.8 million charge for AEC contract revisions
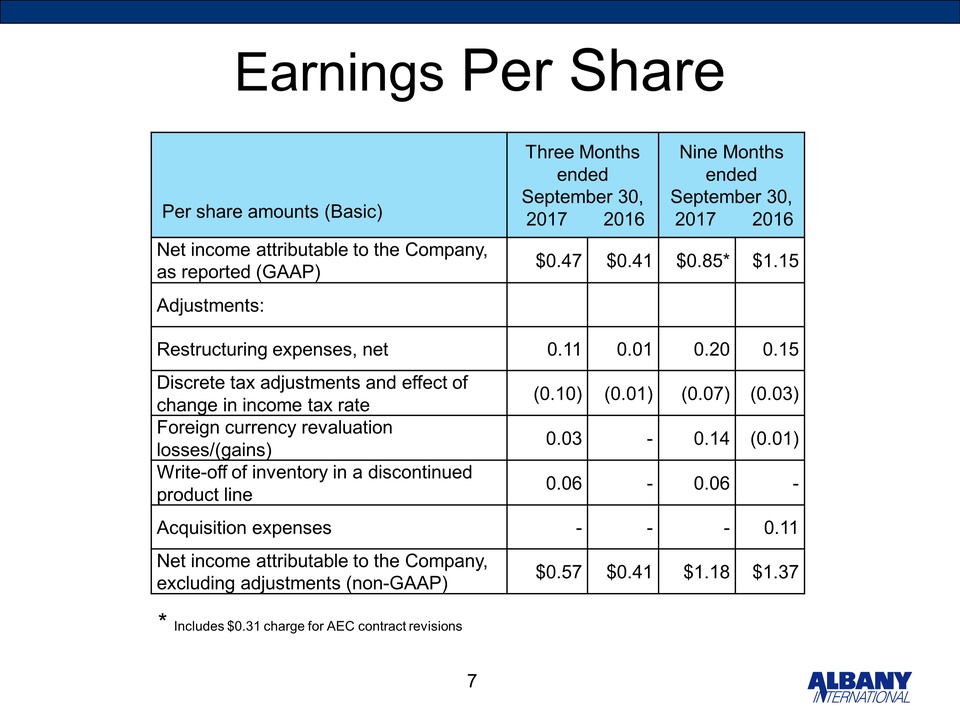
7 Earnings Per Share Per share amounts (Basic) Three Months endedSeptember 30, 2017 2016 Nine Months endedSeptember 30, 2017 2016 Net income attributable to the Company, as reported (GAAP) $0.47 $0.41 $0.85* $1.15 Adjustments: Restructuring expenses, net 0.11 0.01 0.20 0.15 Discrete tax adjustments and effect of change in income tax rate (0.10) (0.01) (0.07) (0.03) Foreign currency revaluation losses/(gains) 0.03 - 0.14 (0.01) Write-off of inventory in a discontinued product line 0.06 - 0.06 - Acquisition expenses - - - 0.11 Net income attributable to the Company, excluding adjustments (non-GAAP) $0.57 $0.41 $1.18 $1.37 * Includes $0.31 charge for AEC contract revisions
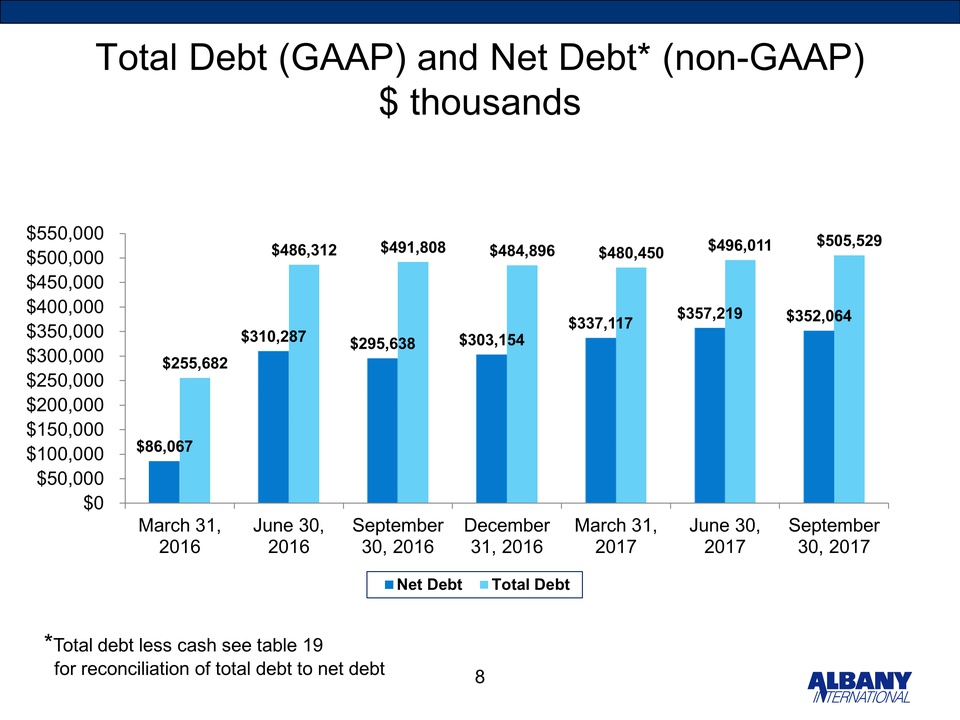
Total Debt (GAAP) and Net Debt* (non-GAAP)$ thousands 8 *Total debt less cash see table 19 for reconciliation of total debt to net debt