Attached files
| file | filename |
|---|---|
| 8-K - 8-K - PEAPACK GLADSTONE FINANCIAL CORP | form8k-18934_pgfc.htm |
Exhibit 99.1

Investor Presentation “Expanding Our Reach” Strategic Update 09/30/2017 P EAPACK - G LADSTONE B ANK

The foregoing contains forward - looking statements within the meaning of the Private Securities Litigation Reform Act of 1995. Such statements are not historical facts but rather may include expressions about Management’s view of future financial condition and results of operations, Management’s confidence and strategies and Management’s expectations about new and existing programs and products , investments, relationships, opportunities and market conditions. These statements may be identified by such forward - looking term inology as “expect”, “look”, “believe”, “anticipate”, “may”, or similar statements or variations of such terms. Actual results may diffe r m aterially from such forward - looking statements. Factors that may cause actual results to differ materially from those contemplated by such forw ard - looking statements include, but are not limited to those risk factors identified in the Company’s Form 10 - K for the year ended December 31, 2016, in addition to: a) an inability to successfully grow our business and implement our strategic plan, including an inability to ge ner ate revenues to offset the increased personnel and other costs related to the strategic plan; b) the impact of anticipated higher operating e xpe nses in 2017 and beyond; c) an inability to manage our growth; d) an inability to successfully integrate our expanded employee base; e) an un expected decline in the economy, in particular in our New Jersey and New York market areas; f) declines in our net interest margin cau sed by the low interest rate environment and highly competitive market; g) declines in value in our investment portfolio; h) higher than exp ect ed increases in our allowance for loan losses; i ) higher than expected increases in loan losses or in the level of nonperforming loans; j) unexpected changes in interest rates; k) an unexpected decline in real estate values within our market areas; l) legislative and regulatory actions (i ncluding the impact of the Dodd - Frank Wall Street Reform and Consumer Protection Act, Basel III and related regulations) subject us to additional re gulatory oversight which may result in increased compliance costs; m) successful cyberattacks against our IT infrastructure and that o f o ur IT providers; n) higher than expected FDIC insurance premiums; o) adverse weather conditions; p) inability to successfully generate new bus ine ss in new geographic markets; q) inability to execute upon new business initiatives; r) lack of liquidity to fund our various cash obli gat ions; s) reduction in our lower - cost funding sources; t) our inability to adapt to technological changes; u) claims and litigation pertaining to fi duciary responsibility, environmental laws and other matters; and v) other unexpected material adverse changes in our operations or e arn ings. The Company assumes no responsibility to update such forward - looking statements in the future. Although we believe that the expe ctations reflected in the forward - looking statements are reasonable, the Company cannot guarantee future results, levels of activity, per formance, or achievements. Statement Regarding Forward - Looking Information 2

• Full service banking with every conversation aimed at helping clients create , grow , protect & eventually transition their wealth. • Deep understanding of our clients needs , goals, and aspirations. » It’s about the client; not about us. » Risk management tolerance, time horizon, and other traditional variables are all considered. • Our Strategy is attracting higher value clients. • A Senior Private Banker leads a TEAM to develop and deliver customized solutions. • As One Team , everyone in the Bank helps deliver an exceptional client experience . • Employees are empowered to solve any client service issue. • Our Strategy is an ongoing journey that continually focuses on: » Ensuring our Core Principles are part of our employee culture. » Listening to our clients and consistently delivering the PGB Experience. » Listening to our staff and delivering a best - in - class employee experience. » Continued innovation and differentiation through technology. The Peapack - Gladstone Private Banking Model 3
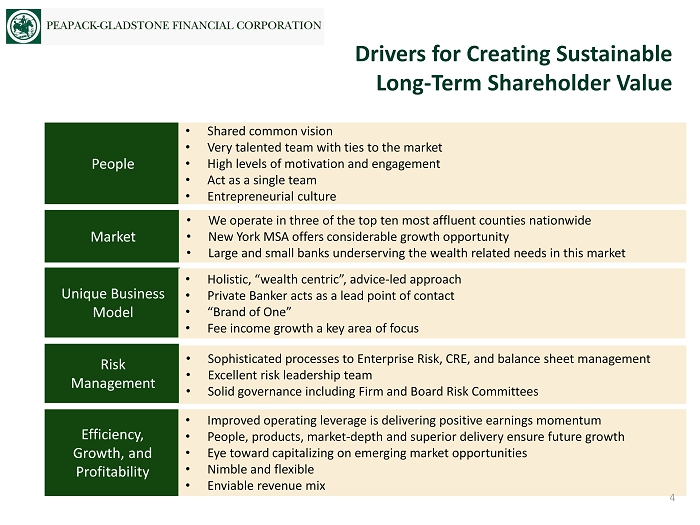
People Market Efficiency, Growth, and Profitability • Shared common vision • Very talented team with ties to the market • High levels of motivation and engagement • Act as a single team • Entrepreneurial culture • We operate in three of the top ten most affluent counties nationwide • New York MSA offers considerable growth opportunity • Large and small banks underserving the wealth related needs in this market • Improved operating leverage is delivering positive earnings momentum • People, products, market - depth and superior delivery ensure future growth • Eye toward capitalizing on emerging market opportunities • Nimble and flexible • Enviable revenue mix Unique Business Model • Holistic, “wealth centric”, advice - led approach • Private Banker acts as a lead point of contact • “Brand of One” • Fee income growth a key area of focus • Sophisticated processes to Enterprise Risk, CRE, and balance sheet management • Excellent risk leadership team • Solid governance including Firm and Board Risk Committees Risk Management Drivers for Creating Sustainable Long - Term Shareholder Value People Market Efficiency, Growth, and Profitability • Shared common vision • Very talented team with ties to the market • High levels of motivation and engagement • Act as a single team • Entrepreneurial culture • We operate in three of the top ten most affluent counties nationwide • New York MSA offers considerable growth opportunity • Large and small banks underserving the wealth related needs in this market Unique Business Model • Holistic, “wealth centric”, advice - led approach • Private Banker acts as a lead point of contact • “Brand of One” • Fee income growth a key area of focus • Sophisticated processes to Enterprise Risk, CRE, and balance sheet management • Excellent risk leadership team • Solid governance including Firm and Board Risk Committees Risk Management People Market • Shared common vision • Very talented team with ties to the market • High levels of motivation and engagement • Act as a single team • Entrepreneurial culture • We operate in three of the top ten most affluent counties nationwide • New York MSA offers considerable growth opportunity • Large and small banks underserving the wealth related needs in this market Unique Business Model • Holistic, “wealth centric”, advice - led approach • Private Banker acts as a lead point of contact • “Brand of One” • Fee income growth a key area of focus Risk Management 4

• Murphy Capital Management acquisition completed 08/01/2017 ($900MM+ AUM as of 09/30/2017). • Announced intended purchase of Quadrant Capital Management – expected 11/01/2017 closing ($400MM+ AUMs). • Well positioned for additional strategic wealth management acquisitions. • $4.8 billion in AUA as of 09/30/17. • YTD 2017 Managed AUM inflows of $377 million vs $230 million for the same 2016 period. • As of 09/30/2017, YTD recurring fees +10% over same period 2016 (18% including recent MCM acquisition). • Growing internal referrals from Commercial and Retail segments. • Continued strong referrals from legal/CPA professionals. • Robust pipeline for Q4 2017and Q1 2018. • Current internal project to assess front - middle - back office of all wealth management units to drive future efficiencies and consistency. Central to Our Strategy: Wealth Management 5

Population Household Income Median HHI Total Projected $100K - $199K > $200K Projected Branches Population Change Change % of % of HHI Change in Market 20172010-20172017-2022 Number Total Number Total 20172017-2022 NJ Market (County) Total PGC (Actual) (%) (%) (Actual)Market (Actual)Market ($) (%)Rank¹ Markets with PGC Branches Hunterdon, NJ 49 4 124,962 (2.64%) (0.39%) 15,833 34% 9,933 21% $112,337 6.86% 1 Morris, NJ 221 6 500,642 1.70% 1.40% 59,833 32% 37,127 20% $105,146 7.10% 3 Somerset, NJ 129 9 335,954 3.87% 2.50% 38,855 32% 25,902 21% $106,919 8.58% 2 Union, NJ 187 1 560,982 4.56% 2.94% 47,404 24% 24,285 12% $72,505 8.38% 12 PGC Branch Markets 586 20 1,522,540 2.83% 2.06% 161,925 30% 97,247 18% Weighted Avg.: PGC Branch Markets 2.82% 2.01% $105,681 8.07% Markets with PGC Private Banking Office Only Bergen, NJ 457 - 947,782 4.71% 3.03% 102,822 29% 53,625 15% $88,821 5.49% 5 Mercer, NJ 143 - 372,157 1.54% 1.27% 34,920 26% 17,689 13% $76,922 5.63% 10 Aggregate: State of NJ 3,014 20 8,999,188 2.36% 1.82% 868,908 26% 387,608 12% $75,854 8.08% Aggregate: National 20 325,139,271 5.31% 3.77% $57,462 7.27% 1. Rank reflects ranking amongst all New Jersey counties Note: Data is pro forma for pending acquisitions; weighted average is calculated as the sum of (percent of state/national fra nch ise * demographic item) within each market; banks, thrifts, and savings banks included (retail branches only) Sources: SNL Financial, Nielsen; as of January 25, 2017 New Jersey Market Overview 6

Wealth Management Assets Under Admin Wealth Management Fee Income Wealth Management Performance $8.00 $10.00 $12.00 $14.00 $16.00 $18.00 $20.00 2013 2014 2015 2016 9/30/16 9/30/17 (Dollars in Millions) $2.0 $2.3 $2.5 $2.8 $3.0 $3.3 $3.5 $3.8 $4.0 $4.3 $4.5 $4.8 $5.0 2012 2013 2014 2015 2016 9/30/17 (Dollars in Billions) $13.84 $15.24 $17.04 $2.3 $2.7 $3.0 $3.7 $3.3 $18.24 7 $15.69 $4.8 $13.63 YOY Growth +15% YTD YTD

1. Includes SBA Income, SWAP Income, Deposit & Loan Fees, Mortgage Banking, and BOLI Wealth Management Provides an Enviable Revenue Mix 77.5% 14.7% 7.8% For Nine - Mos Ended September 30, 2017 Total Non - Interest Income: 22.5% of Total Revenue Net Interest Income before Provision Wealth Fee Income Fees & Other Income 1 Total Non - Interest Income Target 30% - 40% 8

Note: Gross loans include loans held for sale Loan Growth $0.000 $0.500 $1.000 $1.500 $2.000 $2.500 $3.000 $3.500 $4.000 2012 2013 2014 2015 2016 9/30/17 $2.997 $2.251 $1.576 $1.153 $3.314 (Dollars in Billions) 9 $3.669

Loan Mix Transformational Change Multifamily Commercial & Industrial CRE Resident ial , Consumer & Other 39.3% 17.0% 23.1% 20.6% 14.0% 10.0% 22.4% 53.6% 12/31/2012 9/30/2017 Target: 25% - 35% Target: 30% - 35% Target: 15% - 20% Target: 15% - 25% 10
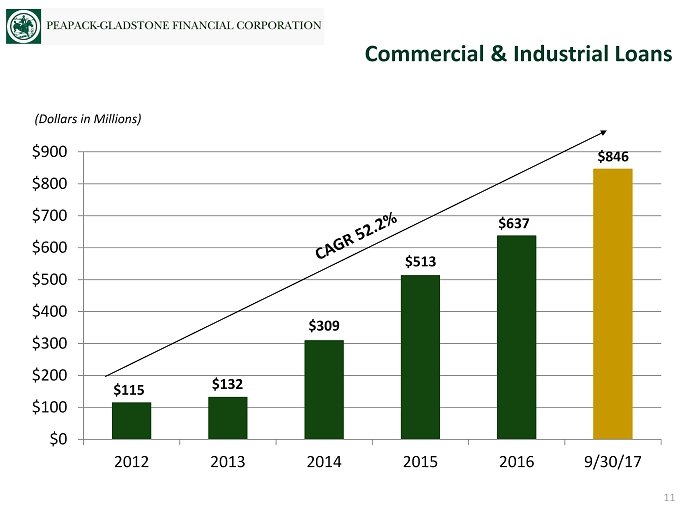
Commercial & Industrial Loans $0 $100 $200 $300 $400 $500 $600 $700 $800 $900 2012 2013 2014 2015 2016 9/30/17 (Dollars in Millions) $115 $132 $309 $513 $637 11 $846

Multifamily Loans as a Percentage of Risk Based Capital are Declining $100 $300 $500 $700 $900 $1,100 $1,300 $1,500 $1,700 2012 2013 2014 2015 2016 9/30/17 (Dollars in Millions) $162 $542 $1,080 $1,499 $1,460 Note: Multifamily Loans include loans held for sale 504% RBC 12 $1,442 372% RBC 329% RBC

Proven track record of providing solid risk - adjusted returns and liquidity on an as needed basis. Geographically diversified portfolio – as of September 30, 2017: • New York – 52%; Top Markets – Bronx and Manhattan • New Jersey – 36%; Top Markets – Essex, Hudson, Passaic • Pennsylvania – 12%; Top Markets – Suburban Philadelphia and Bucks County As of September 30, 2017 • Current balance: $1.44 billion • Active loan participations and loan sales to generate liquidity, margin, and fee income; to date, $567 million sold or participated to approximately 9 institutions • Number of multifamily loans in portfolio: 513 • Average loan size: $2.8 million • Weighted average LTV: approximately 62% • Average debt yield of 10.90% • Weighted average DSCR (after underwriting stress): approximately 1.45x • No nonaccruals; no 30 day delinquencies • Generally all “workforce housing” – average rent just over $1,000 • New data warehouse captures 63 data points per loan • 69% of the $1.44 billion portfolio is rent regulated Our Multifamily Portfolio 13

Total CRE with Multifamily vs CRE with Multifamily (Less Rent Regulated) as a % of Risk Based Capital 250% 300% 350% 400% 450% 500% 550% 600% 650% 700% 750% 2015 2016 Q3 2017 14 314% 564% CRE + MFL CRE + MFL (excluding rent regulated) 529% 304% 695% 393%

1. Nonperforming loans defined as nonaccrual loans plus loans 90+ days past due 2. Texas Ratio defined as nonaccrual loans plus other real estate owned and loans 90+ day past due as a percentage of the sum of tangible common equity and loan loss reserves Texas Ratio² NPLs¹ / Loans NCOs / Average Loans ALLL / Gross Loans Credit Risk Management - Metrics & Performance 0.00% 0.20% 0.40% 0.60% 0.80% 1.00% 1.20% 2012 2013 2014 2015 2016 9/30/17 0.00% 2.00% 4.00% 6.00% 8.00% 10.00% 12.00% 2012 2013 2014 2015 2016 9/30/17 0.75% 1.00% 1.25% 1.50% 2012 2013 2014 2015 2016 9/30/17 0.00% 0.20% 0.40% 0.60% 0.80% 1.00% 2012 2013 2014 2015 2016 9/30/17 0.42% 0.30% 0.23% 0.34% 1.04% 11.34% 4.62% 3.13% 2.45% 3.34% 1.12% 0.98% 0.87% 0.89% 0.97% 0.04% 0.80% 0.06% 0.03% 0.04% 15 0.42% 3.87% 0.98% 0.01%

Deposit Growth $0.000 $0.500 $1.000 $1.500 $2.000 $2.500 $3.000 $3.500 $4.000 2012 2013 2014 2015 2016 9/30/17 $2.935 $2.299 $1.647 $1.516 $3.412 (Dollars in Billions) 16 $3.663

Operating Efficiency: Deposits Per Branch $50 $70 $90 $110 $130 $150 $170 $190 12/31/12 12/31/13 12/31/14 12/31/15 12/31/16 9/30/17 (Dollars in Millions) $66 $171 $72 17 $100 $140 $183

Operating Efficiency: Loans Per Employee $3,000 $4,000 $5,000 $6,000 $7,000 $8,000 $9,000 $10,000 12/31/12 12/31/13 12/31/14 12/31/15 12/31/16 9/30/17 (Dollars in Thousands) 4,835 7,357 9,484 9,804 18 9,656 3,948
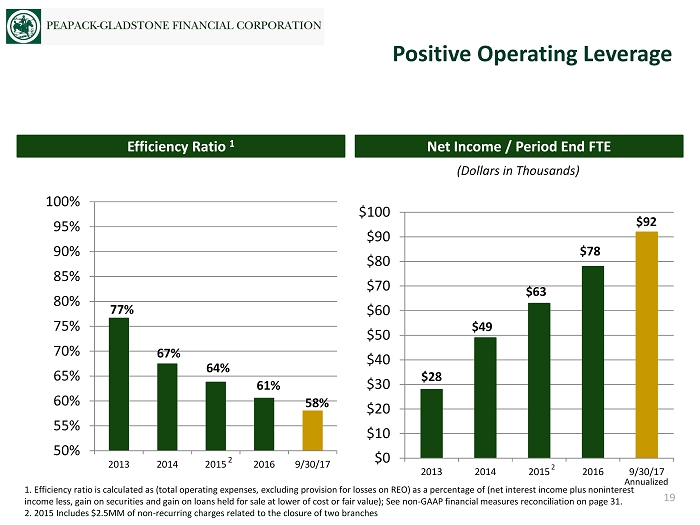
1. Efficiency ratio is calculated as (total operating expenses, excluding provision for losses on REO) as a percentage of (ne t i nterest income plus noninterest income less, gain on securities and gain on loans held for sale at lower of cost or fair value); See non - GAAP financial measures reconciliation on page 31. 2. 2015 Includes $2.5MM of non - recurring charges related to the closure of two branches Net Income / Period End FTE Efficiency Ratio 1 (Dollars in Thousands) Positive Operating Leverage 50% 55% 60% 65% 70% 75% 80% 85% 90% 95% 100% 2013 2014 2015 2016 9/30/17 61% $0 $10 $20 $30 $40 $50 $60 $70 $80 $90 $100 2013 2014 2015 2016 9/30/17 $28 $49 $63 $78 2 64% 67% 77% 2 19 58% $92 Annualized

1. 2015 reflects reported net income and EPS as per 10 - K; includes $2.50 million of pre - tax non - recurring charges related to the closure of two branches Earnings Momentum $5.00 $10.00 $15.00 $20.00 $25.00 $30.00 $35.00 2013 2014 2015 2016 9/30/16 9/30/17 1 Net Income Diluted Earnings Per Share $0.40 $0.60 $0.80 $1.00 $1.20 $1.40 $1.60 $1.80 2013 2014 2015 2016 9/30/16 9/30/17 $9.26 $14.89 $19.97 $26.48 $1.01 $1.22 $1.29 $1.60 1 (Dollars in Millions) 20 $26.13 $1.47 $19.17 $1.17 YOY Growth +36% YOY Growth +26% YTD YTD YTD YTD
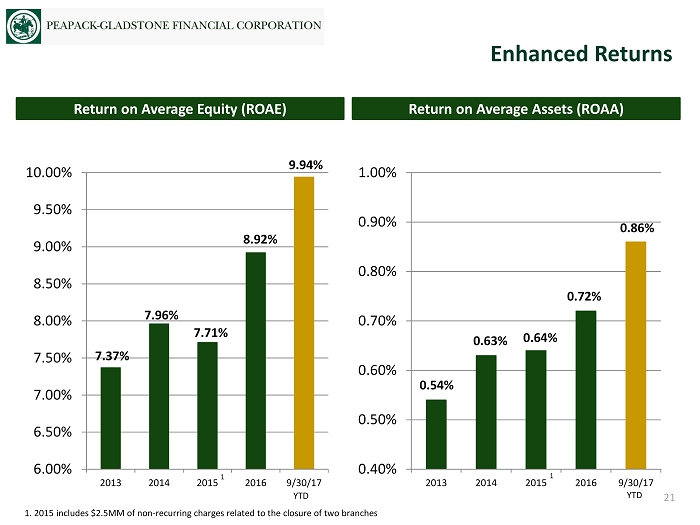
Enhanced Returns 6.00% 6.50% 7.00% 7.50% 8.00% 8.50% 9.00% 9.50% 10.00% 2013 2014 2015 2016 9/30/17 Return on Average Equity (ROAE) Return on Average Assets (ROAA) 0.40% 0.50% 0.60% 0.70% 0.80% 0.90% 1.00% 2013 2014 2015 2016 9/30/17 7.37% 7.96% 7.71% 8.92% 0.54% 0.63% 0.64% 0.72% 1. 2015 includes $2.5MM of non - recurring charges related to the closure of two branches 1 1 21 9.94% 0.86% YTD YTD

Our Strategy is Delivering Value Note: Market data as of September 30, 2017 Source: SNL Financial One Year Comparative Stock Price Performance 22 (10%) 0% 10% 20% 30% 40% 50% 60% 09/30/16 10/31/16 11/30/16 12/31/16 01/31/17 02/28/17 03/31/17 04/30/17 05/31/17 06/30/17 07/31/17 08/31/17 09/30/17 PGC +50.6% NASDAQ Bank +30.5% KBW Nasdaq Bank +40.1%

• Unique and proven business model. • Quality, depth, and experience of Senior Leadership Team. • Enviable market demographics for driving our wealth based strategy. • Diversified revenue mix; high level of non - interest income. • Proven track record of double digit EPS growth. • Growing advice - led commercial business. Upside Potential 23

• EPS Growth – Low double digit EPS growth. • Return on Equity – 10% target run rate early to mid 2018. • Efficiency Ratio – Targeting low to mid 50’s by early to mid 2018. • Loan Growth – 10% to 15% annual loan growth. (Focused on fully utilizing our enhanced in - house relationship - based loan profitability model to manage the origination of loans with competitive risk - adjusted returns. Overall growth will be governed by our continued ability to generate economical core deposits.) • Loan Mix – Continued diversification into Commercial & Industrial and Wealth relationship - based residential lending. Portfolio targets: » C&I (loans and leases): 30% - 35% (23% as of 9/30/2017) » CRE: 15% - 20% (17% as of 9/30/2017) » Multifamily: 25% - 35% (39% as of 9/30/2017) » Residential/Consumer: 15% - 25% (21% as of 9/30/2017) • Non - Interest Income / Revenue Mix – Non - interest income target of 30% - 40% of revenue. Wealth Management fees from organic growth and Wealth M&A; Treasury Management fees; and other fees will drive this growth. • Funding – Continued funding from diversified sources. • Capital – Remain well - capitalized; Shelf available to raise additional capital for Wealth M&A and other strategic opportunities. Financial Targets: 2017 and Beyond 24

Appendix P EAPACK - G LADSTONE B ANK
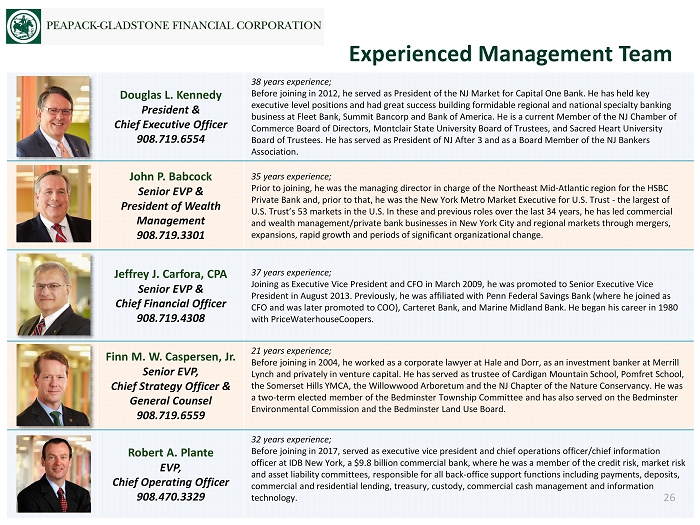
Douglas L. Kennedy President & Chief Executive Officer 908.719.6554 38 years experience; Before joining in 2012, he served as President of the NJ Market for Capital One Bank. He has held key executive level positions and had great success building formidable regional and national specialty banking business at Fleet Bank, Summit Bancorp and Bank of America. He is a current Member of the NJ Chamber of Commerce Board of Directors, Montclair State University Board of Trustees, and Sacred Heart University Board of Trustees. He has served as President of NJ After 3 and as a Board Member of the NJ Bankers Association. John P. Babcock Senior EVP & President of Wealth Management 908.719.3301 35 years experience; Prior to joining, he was the managing director in charge of the Northeast Mid - Atlantic region for the HSBC Private Bank and, prior to that, he was the New York Metro Market Executive for U.S. Trust - the largest of U.S. Trust’s 53 markets in the U.S. In these and previous roles over the last 34 years, he has led commercial and wealth management/private bank businesses in New York City and regional markets through mergers, expansions, rapid growth and periods of significant organizational change. Jeffrey J. Carfora, CPA Senior EVP & Chief Financial Officer 908.719.4308 37 years experience; Joining as Executive Vice President and CFO in March 2009, he was promoted to Senior Executive Vice President in August 2013. Previously, he was affiliated with Penn Federal Savings Bank (where he joined as CFO and was later promoted to COO), Carteret Bank, and Marine Midland Bank. He began his career in 1980 with PriceWaterhouseCoopers . Finn M. W. Caspersen, Jr. Senior EVP, Chief Strategy Officer & General Counsel 908.719.6559 21 years experience; Before j oining in 2004, he worked as a corporate lawyer at Hale and Dorr, as an investment banker at Merrill Lynch and privately in venture capital. He has served as trustee of Cardigan Mountain School, Pomfret School, the Somerset Hills YMCA, the Willowwood Arboretum and the NJ Chapter of the Nature Conservancy. He was a two - term elected member of the Bedminster Township Committee and has also served on the Bedminster Environmental Commission and the Bedminster Land Use Board. Robert A. Plante EVP, Chief Operating Officer 908.470.3329 32 years experience; Before joining in 2017, served as executive vice president and chief operations officer/chief information officer at IDB New York, a $9.8 billion commercial bank, where he was a member of the credit risk, market risk and asset liability committees, r esponsible for all back - office support functions including payments, deposits, commercial and residential lending, treasury, custody, commercial cash management and information technology. Experienced Management Team 26

Tony Spinelli Tony Spinelli was named to the Board of Directors in May of 2017. Mr. Spinelli maintains Certified Information Systems Security Professional (CISSP) accreditation and serves on the boards of Per Scholas , the US Department of Defense and Georgia Tech Institute for Information Security and Privacy. Tony has also served on the board of advisors for Cisco, Cylance, Kudelski Security, and IBM. He holds multiple patents in such areas as data loss prevention and methods of network risk reduction and internet browsing habits. Mr. Spinelli serves as Chief Operating Officer and President, Cyberdivision for Fractal Industries, Inc., a venture - backed artificial intelligence and machine learning decision - platform focused on advancing digital analytics in both cybersecurity and risk management. Previously he served as Senior Vice President and Chief Information Security Officer at Capital One Financial, responsible for developing and leading the cybersecurity and technology risk management program for the organization. Previously, Tony was the Chief Information Security Officer of Tyco International, Equifax and First Data Corporation, where he led global teams responsible for security engineering, security operations, security compliance and policy and cybersecurity threat management. Carmen M. Bowser Carmen Bowser was named to the Board of Directors in September. Ms. Bowser is a graduate of William Smith College with an MBA in Finance from Rutgers Graduate School of Management. She is a National Association of Corporate Directors Fellow and a member of Women Corporate Directors, the Urban Land Institute and WX, Inc., an organization for executive women in commercial real estate. Ms. Bowser is an Independent Board Member and Member of the Audit and Nominating and Governance Committees for Columbia Property Trust, Atlanta, GA, and is a Board Member for the 42nd Street Development Corporation, NYC. Ms. Bowser most recently served as Managing Vice President, Commercial Real Estate Division, at Capital One Bank, N.A., New York, NY, where she was responsible for a geographically dispersed 100 - person team which provided the “first line of defense” for new loan originations and asset management. Previously, Ms. Bowser was a Principal/Managing Director for Prudential Mortgage Capital Company, where she led the commercial mortgage origination teams in McLean, Virginia, Boston, Massachusetts and New York City, overseeing annual team loan production of approximately $800 million across an expansive platform of FNMA, General Account, conduit, bridge, interim and mezzanine loans. She has held similar positions at Teachers Insurance and Annuity Association, NY, Arbor National Commercial Corp, Los Angeles, CA, and The Prudential Insurance Company of America, LA, NY and Newark, NJ. 2017 Additions to the Board of Directors 27

Quarterly Income Statement Summary (Dollars in thousands, except per share data) 28 Income Statement Data: 9/30/2017 6/30/2017 3/31/2017 12/31/2016 9/30/2016 Net interest income $ 29,992 $ 26,972 $ 25,591 $ 24,580 $ 24,269 Provision for loan losses 400 2,200 1,600 1,500 2,100 Net interest income after provision 29,592 24,772 23,991 23,080 22,169 Wealth management fee income 5,790 5,086 4,818 4,610 4,436 Other Income 3,041 3,085 2,201 3,062 3,099 Total other income 8,831 8,171 7,019 7,672 7,535 Total operating expenses 21,961 20,095 19,304 18,965 18,166 Income before income taxes 16,462 12,848 11,706 11,787 11,538 Income tax expense 6,256 4,908 3,724 4,479 4,422 Net income $ 10,206 $ 7,940 $ 7,982 $ 7,308 $ 7,116 Total revenue $ 38,823 $ 35,143 $ 32,610 $ 32,252 $ 31,804 Per Common Share Data: Earnings per share (diluted) $0.56 $0.45 $0.46 $0.43 $0.43 Performance Ratios: Return on average assets annualized 0.97% 0.79% 0.82% 0.75% 0.77% Return on average common equity annualized 11.09% 9.06% 9.62% 9.27% 9.44% Net interest margin 2.95% 2.76% 2.71% 2.63% 2.74% Operating expenses/average assets annualized 2.10% 2.00% 1.97% 1.96% 1.98%
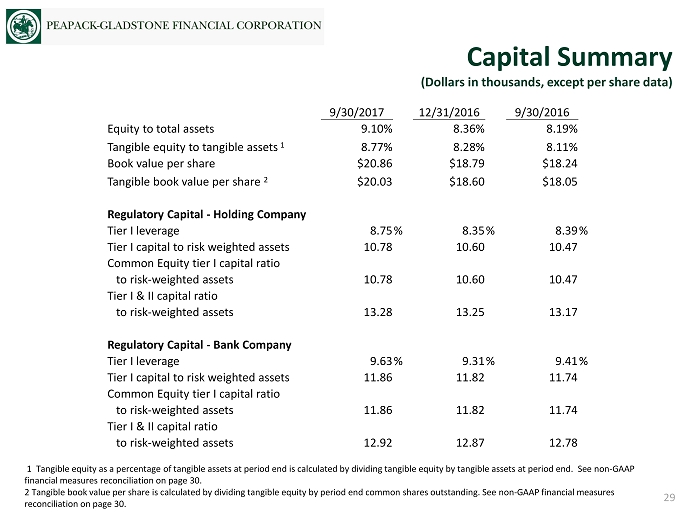
Capital Summary (Dollars in thousands, except per share data) 29 1 Tangible equity as a percentage of tangible assets at period end is calculated by dividing tangible equity by tangible ass et s at period end. See non - GAAP financial measures reconciliation on page 30. 2 Tangible book value per share is calculated by dividing tangible equity by period end common shares outstanding. See non - GAAP financial measures reconciliation on page 30. 9/30/2017 12/31/2016 9/30/2016 Equity to total assets 9.10% 8.36% 8.19% Tangible equity to tangible assets 1 8.77% 8.28% 8.11% Book value per share $20.86 $18.79 $18.24 Tangible book value per share 2 $20.03 $18.60 $18.05 Regulatory Capital - Holding Company Tier I leverage 8.75 % 8.35 % 8.39 % Tier I capital to risk weighted assets 10.78 10.60 10.47 Common Equity tier I capital ratio to risk - weighted assets 10.78 10.60 10.47 Tier I & II capital ratio to risk - weighted assets 13.28 13.25 13.17 Regulatory Capital - Bank Company Tier I leverage 9.63 % 9.31 % 9.41 % Tier I capital to risk weighted assets 11.86 11.82 11.74 Common Equity tier I capital ratio to risk - weighted assets 11.86 11.82 11.74 Tier I & II capital ratio to risk - weighted assets 12.92 12.87 12.78

Non - GAAP Financial Measures Reconciliation (Dollars in thousands, except per share data) 30 We believe that these non - GAAP financial measures provide information that is important to investors and that is useful in under standing our financial position, results and ratios. Our management internally assesses our performance based, in part, on these measures. However, these non - GAAP financ ial measures are supplemental and are not a substitute for an analysis based on GAAP measures. 9/30/2017 12/31/2016 9/30/2016 Tangible Book Value Per share Shareholders Equity 379,936 324,210 309,032 Less Intangible assets, net 15,064 3,157 3,188 Tangible equity 364,872 321,053 305,844 Period end shares outstanding 18,214,759 17,257,995 16,944,738 Tangible book value per share 20.03 18.60 18.05 Book value per share 20.86 18.79 18.24 Tangible Equity to Tangible Assets Total assets 4,176,332 3,878,633 3,774,383 Less: Intangible assets, net 15,064 3,157 3,188 Tangible assets 4,161,268 3,875,476 3,771,195 Tangible equity to tangible assets 8.77% 8.28% 8.11% Equity to assets 9.10% 8.36% 8.19%

We believe that these non - GAAP financial measures provide information that is important to investors and that is useful in under standing our financial position, results and ratios. Our management internally assesses our performance based, in part, on these measures. However, these non - GAAP financ ial measures are supplemental and are not a substitute for an analysis based on GAAP measures. Non - GAAP Financial Measures Reconciliation (Dollars in thousands, except per share data) 31 YTD YTD YTD YTD YTD 09/30/2017 12/31/2016 12/31/2015 12/31/2014 12/31/2013 Net Interest Income $ 82,555 $ 96,435 $ 84,452 $ 67,894 $ 52,776 Total Other Income 24,021 28,918 23,714 20,807 20,595 Less: Gain on Loans Sold Held for Sale at lower of cost or fair value 34 1,233 0 166 522 Less: Securities Gains, net 0 119 527 260 840 Total Recurring Revenue 106,542 124,001 107,639 88,275 72,009 Operating Expenses 61,360 75,112 68,926 59,540 55,183 Less: ORE Provision 0 0 250 0 0 Total Operating Expenses 61,360 75,112 68,676 59,540 55,183 Efficiency Ratio 57.59% 60.57% 63.80% 67.45% 76.63%