Attached files
| file | filename |
|---|---|
| EX-99.1 - EXHIBIT 99.1 - Safehold Inc. | safe-09302017xprex991.htm |
| 8-K - 8-K - Safehold Inc. | safe-09302017xpr8xk.htm |
Safety, Income & Growth Inc.
The Ground Lease Company
(NYSE: SAFE)
Q3’17 Earnings Results
October 26, 2017

1
Safety, Income & Growth Inc.
The Ground Lease Company
Forward-Looking Statements and Other Matters
This release may contain forward-looking statements. All statements other than statements of historical fact are forward-looking
statements. These forward-looking statements can be identified by the use of words such as “illustrative”, “representative”,
“expect”, “plan”, “will”, “estimate”, “project”, “intend”, “believe”, and other similar expressions that do not relate to historical
matters. These forward-looking statements reflect the Company’s current views about future events, and are subject to numerous
known and unknown risks, uncertainties, assumptions and changes in circumstances that may cause Company’s actual results to
differ significantly from those expressed in any forward-looking statement. The Company does not guarantee that the
transactions and events described will happen as described (or that they will happen at all). The following factors, among others,
could cause actual results and future events to differ materially from those set forth or contemplated in the forward-looking
statements: market demand for ground lease capital; the Company’s ability to source new ground lease investments; risks that
the rent adjustment clauses in the Company's leases will not adequately keep up with changes in market value and inflation; risks
associated with certain tenant and industry concentrations in our initial portfolio; conflicts of interest and other risks associated
with the Company's external management structure and its relationships with iStar and other significant investors; risks
associated with using debt to fund the Company’s business activities (including changes in interest rates and/or credit spreads,
and refinancing and interest rate risks); general risks affecting the real estate industry and local real estate markets (including,
without limitation, the potential inability to enter into or renew ground leases at favorable rates, including with respect to
contractual rate increases or participating rent); dependence on the creditworthiness of our tenants and their financial condition
and operating performance; competition from other developers, owners and operators of real estate (including life insurance
companies, pension funds, high net worth investors, sovereign wealth funds, mortgage REITs, private equity funds and separate
accounts); unknown liabilities acquired in connection with real estate; and risks associated with our failure to qualify for
taxation as a REIT under the Internal Revenue Code of 1986, as amended. Please refer to the section entitled “Risk Factors” in
our Prospectus, dated June 27, 2017, filed with the Securities and Exchange Commission (SEC) for further discussion of these and
other investment considerations. The Company expressly disclaims any responsibility to update or revise forward-looking
statements, whether as a result of new information, future events or otherwise, except as required by law.
Investor Relations Contact
Jason Fooks
(212) 930-9400
investors@safetyincomegrowth.com
2
Safety, Income & Growth Inc.
The Ground Lease Company
Q3’17 Highlights
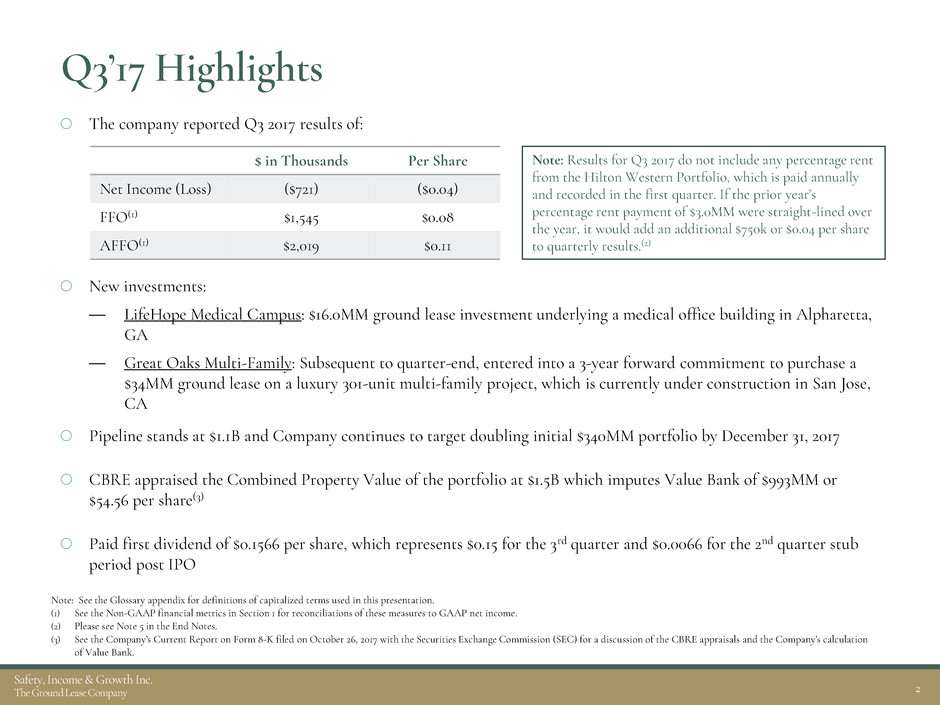
The company reported Q3 2017 results of:
New investments:
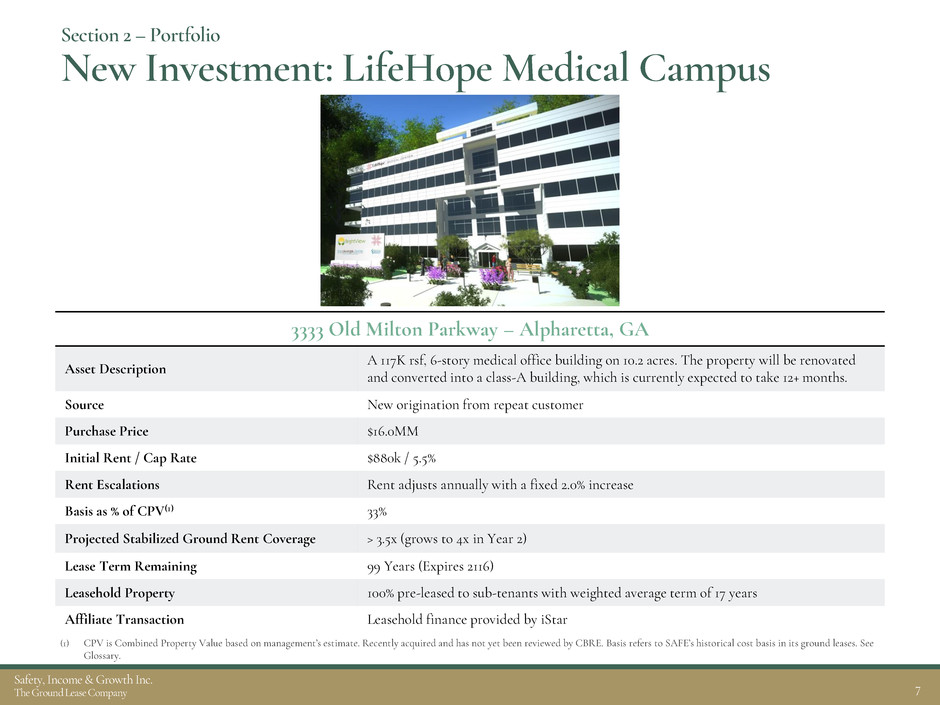
LifeHope Medical Campus: $16.0MM ground lease investment underlying a medical office building in Alpharetta,
GA
Great Oaks Multi-Family: Subsequent to quarter-end, entered into a 3-year forward commitment to purchase a
$34MM ground lease on a luxury 301-unit multi-family project, which is currently under construction in San Jose,
CA
Pipeline stands at $1.1B and Company continues to target doubling initial $340MM portfolio by December 31, 2017
CBRE appraised the Combined Property Value of the portfolio at $1.5B which imputes Value Bank of $993MM or
$54.56 per share(3)
Paid first dividend of $0.1566 per share, which represents $0.15 for the 3rd quarter and $0.0066 for the 2nd quarter stub
period post IPO
Note: See the Glossary appendix for definitions of capitalized terms used in this presentation.
(1) See the Non-GAAP financial metrics in Section 1 for reconciliations of these measures to GAAP net income.
(2) Please see Note 5 in the End Notes.
(3) See the Company’s Current Report on Form 8-K filed on October 26, 2017 with the Securities Exchange Commission (SEC) for a discussion of the CBRE appraisals and the Company’s calculation
of Value Bank.
$ in Thousands Per Share
Net Income (Loss) ($721) ($0.04)
FFO(1) $1,545 $0.08
AFFO(1) $2,019 $0.11
Note: Results for Q3 2017 do not include any percentage rent
from the Hilton Western Portfolio, which is paid annually
and recorded in the first quarter. If the prior year’s
percentage rent payment of $3.0MM were straight-lined over
the year, it would add an additional $750k or $0.04 per share
to quarterly results.(2)

3
Safety, Income & Growth Inc.
The Ground Lease Company
Section 1 – Earnings
Q3’17 Earnings Overview
SAFE, initially capitalized on April 14, 2017 with investments by iStar and two institutional investors, completed
its initial public offering on June 27, 2017.
Note: $ in thousands, except per share information.
(1) Results for 4/14/17 - 9/30/17 include an initial $0.8MM stock grant to directors in consideration for joining SAFE’s board.
Three Months Ended
9/30/17
For the Period
4/14/17 – 9/30/17
Net Income ($721) ($2,325)(1)
per share ($0.04) ($0.18)
FFO $1,545 $1,814(1)
per share $0.08 $0.14
AFFO $2,019 $2,912
per share $0.11 $0.23
Note: Results for Q3 2017 do not include any percentage rent from Hilton Western Portfolio, which is
paid annually and recorded in the first quarter. If the prior year’s percentage rent payment were
straight-lined over the year, it would add an additional $750k or $0.04 per share to quarterly results.

4
Safety, Income & Growth Inc.
The Ground Lease Company
Section 1 – Earnings
Income Statement
Note: $ in thousands
Three Months Ended
9/30/2017
For the Period
4/14/17 – 9/30/17
Revenues:
Ground lease and other lease income $6,172 $10,374
Other income 84 86
Total revenues $6,256 $10,460
Costs and expenses:
Interest expense $2,445 $4,313
Real estate expense 472 897
Depreciation and amortization 2,266 4,139
General and administrative 1,672 2,055
Stock based compensation - 766
Other expense 122 615
Total costs and expenses $6,977 $12,785
Net income (loss) ($721) ($2,325)
Note: Results for Q3 2017 do not include any percentage rent from Hilton Western Portfolio, paid annually and recorded annually
in the first quarter. If the prior percentage rent payment were straight-lined over the year, it would add an additional $750k to
quarterly results.
5
Safety, Income & Growth Inc.
The Ground Lease Company
Section 1 – Earnings
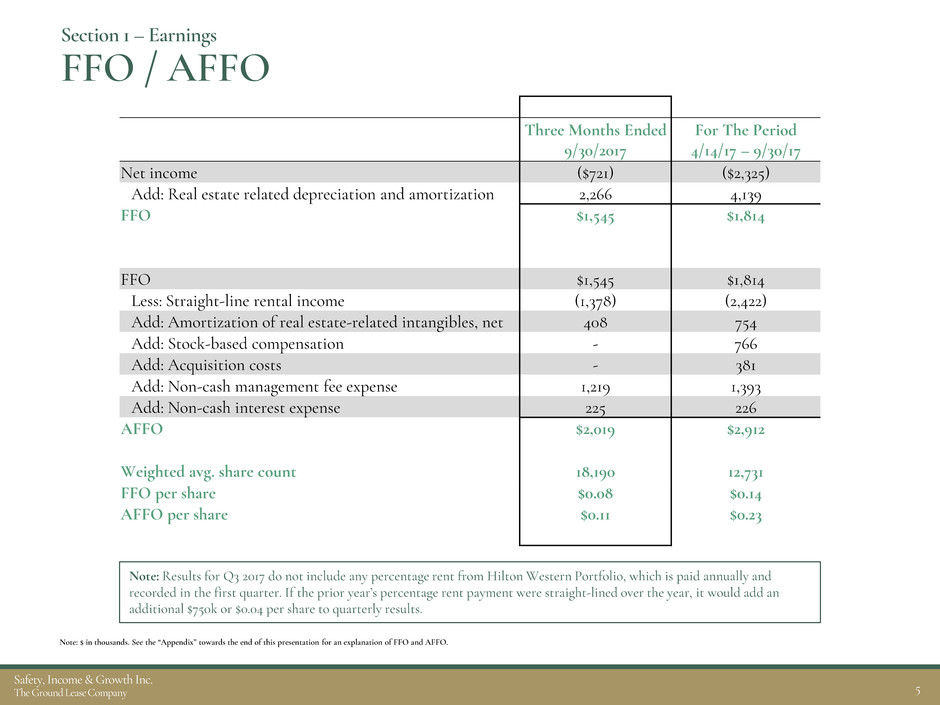
FFO / AFFO
Note: $ in thousands. See the “Appendix” towards the end of this presentation for an explanation of FFO and AFFO.
Three Months Ended
9/30/2017
For The Period
4/14/17 – 9/30/17
Net income ($721) ($2,325)
Add: Real estate related depreciation and amortization 2,266 4,139
FFO $1,545 $1,814
FFO $1,545 $1,814
Less: Straight-line rental income (1,378) (2,422)
Add: Amortization of real estate-related intangibles, net 408 754
Add: Stock-based compensation - 766
Add: Acquisition costs - 381
Add: Non-cash management fee expense 1,219 1,393
Add: Non-cash interest expense 225 226
AFFO $2,019 $2,912
Weighted avg. share count 18,190 12,731
FFO per share $0.08 $0.14
AFFO per share $0.11 $0.23
Note: Results for Q3 2017 do not include any percentage rent from Hilton Western Portfolio, which is paid annually and
recorded in the first quarter. If the prior year’s percentage rent payment were straight-lined over the year, it would add an
additional $750k or $0.04 per share to quarterly results.
6
Safety, Income & Growth Inc.
The Ground Lease Company
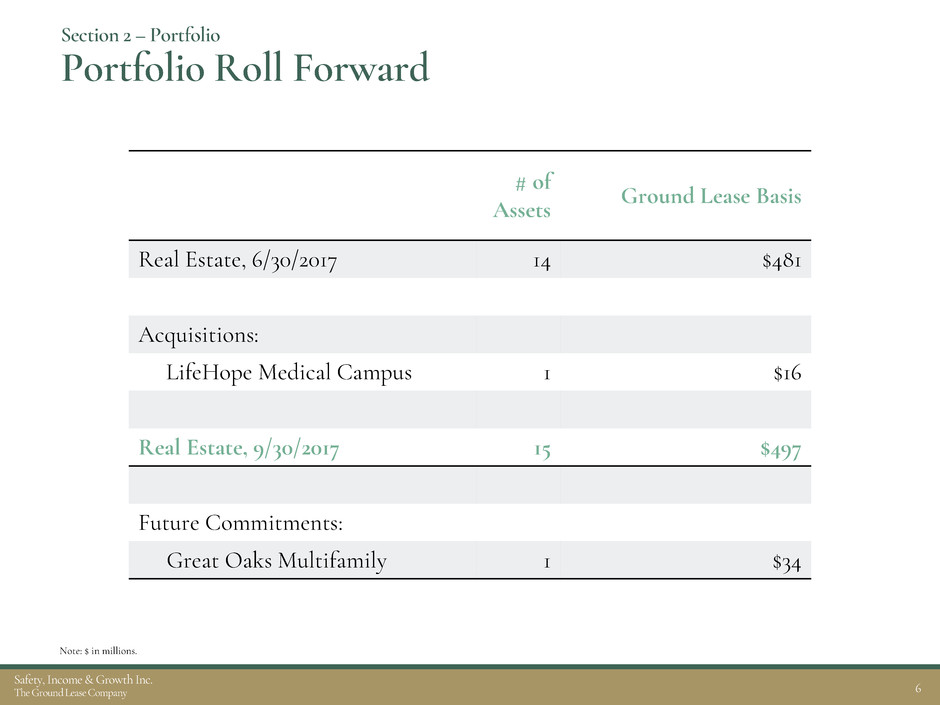
# of
Assets
Ground Lease Basis
Real Estate, 6/30/2017 14 $481
Acquisitions:
LifeHope Medical Campus 1 $16
Real Estate, 9/30/2017 15 $497
Future Commitments:
Great Oaks Multifamily 1 $34
Section 2 – Portfolio
Portfolio Roll Forward
Note: $ in millions.
7
Safety, Income & Growth Inc.
The Ground Lease Company
Section 2 – Portfolio
New Investment: LifeHope Medical Campus
3333 Old Milton Parkway – Alpharetta, GA
Asset Description
A 117K rsf, 6-story medical office building on 10.2 acres. The property will be renovated
and converted into a class-A building, which is currently expected to take 12+ months.
Source New origination from repeat customer
Purchase Price $16.0MM
Initial Rent / Cap Rate $880k / 5.5%
Rent Escalations Rent adjusts annually with a fixed 2.0% increase
Basis as % of CPV(1) 33%
Projected Stabilized Ground Rent Coverage > 3.5x (grows to 4x in Year 2)
Lease Term Remaining 99 Years (Expires 2116)
Leasehold Property 100% pre-leased to sub-tenants with weighted average term of 17 years
Affiliate Transaction Leasehold finance provided by iStar
(1) CPV is Combined Property Value based on management’s estimate. Recently acquired and has not yet been reviewed by CBRE. Basis refers to SAFE’s historical cost basis in its ground leases. See
Glossary.

8
Safety, Income & Growth Inc.
The Ground Lease Company
Section 2 – Portfolio
Forward Commitment: Great Oaks Multi-Family
Raleigh Road & Via del Oro – San Jose, CA
Asset Description A luxury multi-family project containing 301 units currently under construction in San Jose, CA
Source New origination in conjunction with iStar(1)
Forward Commitment SAFE has committed to purchase the ground lease from iStar on November 1, 2020
Purchase Price $34.0MM
Rent at SAFE Acquisition / Implied Cap Rate $1.27MM / 3.75%
Rent Escalations Rent adjusts annually with a fixed 2.0% increase
Basis as % of CPV(2) 26%
Stabilized Ground Rent Coverage(3) > 5.0x
Lease Term Remaining at SAFE acquisition 96 Years (Expires 2116)
Affiliate Transaction iStar was the former owner of the land and is the construction lender
(1) Transaction approved by the independent members of the Board of Directors of both SAFE and iStar.
(2) CPV is Combined Property Value based on management’s estimate. Basis refers to SAFE’s historical cost basis in its ground leases. See Glossary.
(3) Estimated ground rent coverage at stabilization, assuming construction is completed within our expected timeframe. Estimates are based on available market information including leasing activity at
comparable properties in the market.

9
Safety, Income & Growth Inc.
The Ground Lease Company
Section 2 – Portfolio
Geographic Diversification by MSA
Note: Percentages based on total Ground Lease Basis of $497 million.
Seattle
14.6%
11.3%
18.3%
Detroit
Salt Lake City
6.5%
San Diego
4.4%
San Francisco
4.1%
Durango
2.8%
Dallas
5.6%
Atlanta
1.9%
Washington
1.6%
Milwaukee
28.6%
Los Angeles
0.4%
Minneapolis
10
Safety, Income & Growth Inc.
The Ground Lease Company
>60 yrs
50%
<20 yrs
49%
20-60 yrs
1%
50-60%
29%
40-50%
14%
30-40%
24%
<30%
33%
4.0-5.0x
6%
3.0-4.0x
39%
5.0x+
55%
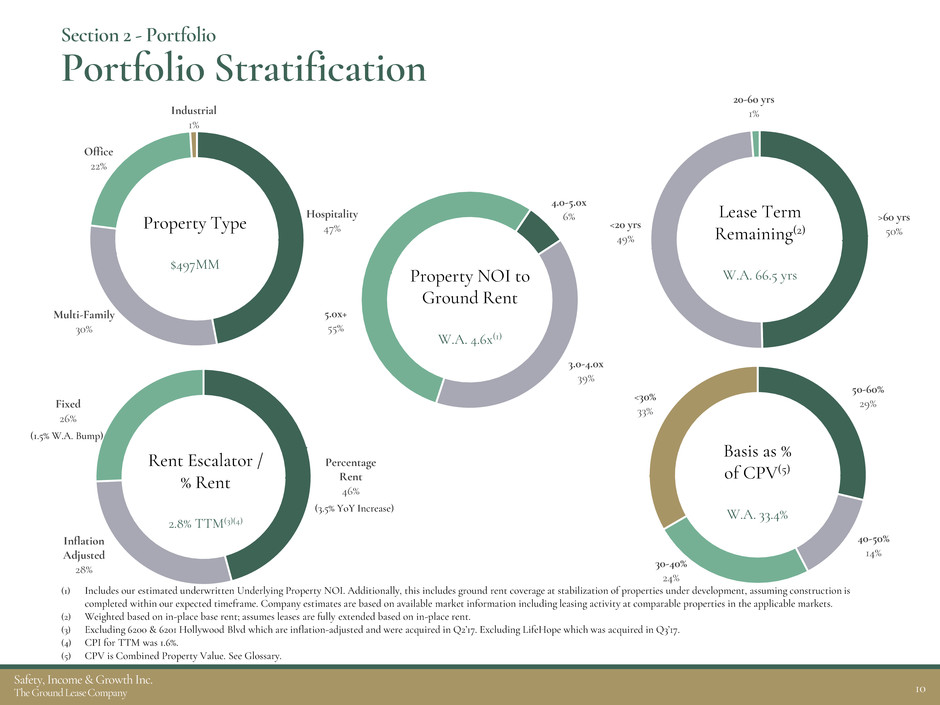
Hospitality
47%
Multi-Family
30%
Office
22%
Industrial
1%
Percentage
Rent
46%
Inflation
Adjusted
28%
Fixed
26%
Section 2 - Portfolio
Portfolio Stratification
(1) Includes our estimated underwritten Underlying Property NOI. Additionally, this includes ground rent coverage at stabilization of properties under development, assuming construction is
completed within our expected timeframe. Company estimates are based on available market information including leasing activity at comparable properties in the applicable markets.
(2) Weighted based on in-place base rent; assumes leases are fully extended based on in-place rent.
(3) Excluding 6200 & 6201 Hollywood Blvd which are inflation-adjusted and were acquired in Q2’17. Excluding LifeHope which was acquired in Q3’17.
(4) CPI for TTM was 1.6%.
(5) CPV is Combined Property Value. See Glossary.
Property Type
$497MM
Property NOI to
Ground Rent
W.A. 4.6x(1)
Rent Escalator /
% Rent
2.8% TTM(3)(4)
Basis as %
of CPV(5)
W.A. 33.4%
Lease Term
Remaining(2)
W.A. 66.5 yrs
(1.5% W.A. Bump)
(3.5% YoY Increase)

11
Safety, Income & Growth Inc.
The Ground Lease Company
Create / Originate
80%
Acquire
20%
Section 2 – Portfolio
Pipeline
Note: There can be no assurance that SAFE will acquire or originate any of the investments currently being pursued on favorable terms or at all. Percentages are based on estimated
ground lease value.
$1.1B Pipeline
Location
(MSA)
$812MM
Under Review
$278MM
Active
Negotiation
Property
Type
Sourcing
Strategy
Chicago
22%
Washington D.C.
18%
New York
16%
Philadelphia
8%
Los Angeles
6%
Multiple
Locations
4%
San
Francisco
4%
San Jose
3% San Antonio
3%
Dallas
3%
Other
13%
Office
60%
Multi-Family
28%
Mixed Use
8%
Hospitality
4%

12
Safety, Income & Growth Inc.
The Ground Lease Company
Section 2 – Portfolio
Value Bank of $993MM or $54.56 per Share
At expiration or earlier termination of its Ground Leases, SAFE’s
reversion rights create additional potential value to stockholders by
allowing SAFE to take title to the buildings / improvements on its land(1)
Value Bank is calculated as today’s estimated Combined Property Value
(CPV) less SAFE’s Ground Lease Basis
(1) Our ability to recognize value through reversion rights may be limited by the rights of our tenants under some of our ground leases, including tenant
rights to purchase the properties or level properties under certain circumstances. See our Current Report on Form 8-K filed with the SEC on October 26,
2017 and “Risk Factors” in our Prospectus, dated June 27, 2017, filed with the SEC, for a further discussion of such tenants rights.
(2) SAFE may utilize management’s estimate of CPV for ground lease investments recently acquired that CBRE has not yet appraised. See our 8-K filed
October 26, 2017 with the SEC for additional detail on CBRE’s valuation and our calculation of Value Bank.
$993MM
Estimated
Value Bank
(CPV – Ground Lease Basis)
$497MM
Ground Lease
Basis
(Purchase Cost)
$1.5B
Total
CPV
At 9/30/17
Combined Property Value
Ground Lease Basis
Value Bank
$1,490MM
$497MM
$993MM
CBRE conducted
independent
appraisals of the
CPV of each
asset(2)
13
Safety, Income & Growth Inc.
The Ground Lease Company
Note: $ in millions.
(1) See Note 5 in End Notes.
(2) Adjusted EBITDA represents annualized AFFO for the quarter ending September 30, 2017 plus percentage rent payments over the TTM for Hilton Western Portfolio and before annualized interest
expense for the quarter ended September 30, 2017. There can be no assurance that the Company will receive percent rent payments in future periods.
(3) Underlying Property NOI information provided by our One Ally tenant is confidential. We have calculated an NOI estimate based on available market information. We present these metrics both
including and excluding our internally-generated NOI estimate for One Ally.
Section 3 –Capital Structure
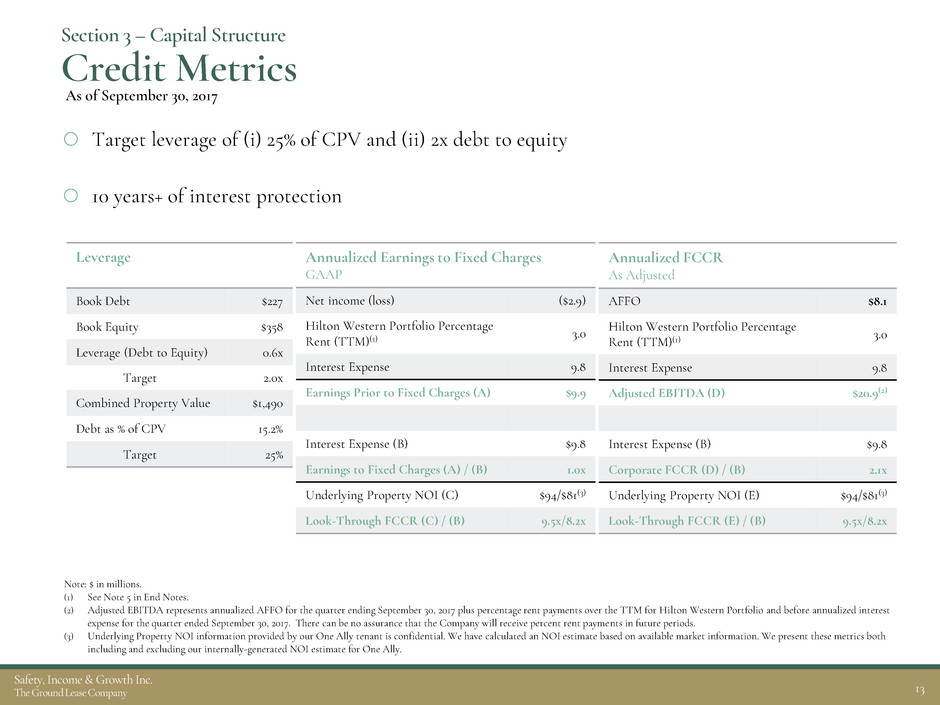
Credit Metrics
Leverage
Book Debt $227
Book Equity $358
Leverage (Debt to Equity) 0.6x
Target 2.0x
Combined Property Value $1,490
Debt as % of CPV 15.2%
Target 25%
Annualized FCCR
As Adjusted
AFFO $8.1
Hilton Western Portfolio Percentage
Rent (TTM)(1)
3.0
Interest Expense 9.8
Adjusted EBITDA (D) $20.9(2)
Interest Expense (B) $9.8
Corporate FCCR (D) / (B) 2.1x
Underlying Property NOI (E) $94/$81(3)
Look-Through FCCR (E) / (B) 9.5x/8.2x
Target leverage of (i) 25% of CPV and (ii) 2x debt to equity
10 years+ of interest protection
As of September 30, 2017
Annualized Earnings to Fixed Charges
GAAP
Net income (loss) ($2.9)
Hilton Western Portfolio Percentage
Rent (TTM)(1)
3.0
Interest Expense 9.8
Earnings Prior to Fixed Charges (A) $9.9
Interest Expense (B) $9.8
Earnings to Fixed Charges (A) / (B) 1.0x
Underlying Property NOI (C) $94/$81(3)
Look-Through FCCR (C) / (B) 9.5x/8.2x

14
Safety, Income & Growth Inc.
The Ground Lease Company
2017 2018 2019 2020 2021 2022 2023 2024 2025 2026 2027
Section 3 –Capital Structure
Debt Overview
Note: $ in millions.
(1) Initial maturity is June 2020 with two 1-year extensions.
(2) April 2027 represents Anticipated Repayment Date. Final maturity is April 2028.
(3) 3.795% coupon effectively locked in and reduced to 3.77% with swap rate lock.
(4) Based on LIBOR of 1.23% at September 30, 2017.
$300(1)
$227(2)
Debt Maturity Profile
Revolver
Capacity
W.A. Maturity is 10 years
Debt Profile
2022
Jun.(1) $300 L+135
2027
Apr.(2) $227 3.77%(3)
Total $527 3.10%(4)
Hedge Profile
Amount Effective Date Maturity Date Base Rate
$45 floating to fixed swap 8/1/2017 10/1/2017 1.709%
$95 floating to fixed swap 10/1/2017 10/1/2020 1.709%
$95 floating to fixed swap 10/1/2020 10/1/2030 2.628%
$10 floating to fixed swap 10/1/2017 10/1/2020 1.545%
$10 floating to fixed swap 10/1/2020 10/1/2030 2.435%
As of September 30, 2017

15
Safety, Income & Growth Inc.
The Ground Lease Company
Section 3 –Capital Structure
Balance Sheet
Note: $ in thousands. “Real estate-related intangibles, net” represents real estate-related intangible assets of $140MM and $132MM for the periods ended September 30 and June 30, 2017, respectively,
less real estate-related intangible liabilities of $58MM for the periods ended September 30 and June 30, 2017, respectively.
As of As of
September 30, 2017 June 30, 2017
Assets
Real estate
Real estate, gross $413,145 $406,844
Accumulated depreciation (2,752) (1,251)
Real estate, net 410,393 405,593
Real estate-related intangibles, net 81,955 73,428
Ground lease assets, net 492,348 479,021
Cash and cash equivalents 91,327 107,579
Other assets 8,735 5,273
Total assets $592,410 $591,873
Liabilities and Equity
Liabilities:
Debt obligations, net $227,396 $227,406
Accounts payable and other liabilities 6,783 5,945
Total liabilities $234,179 $233,351
Equity:
Common stock $182 $182
Additional paid-in capital 363,465 360,070
Retained earnings (deficit) (5,173) (1,604)
AOCI (243) (126)
Total equity $358,231 $358,522
Total liabilities and equity $592,410 $591,873

16
Safety, Income & Growth Inc.
The Ground Lease Company
Appendix

17
Safety, Income & Growth Inc.
The Ground Lease Company
Appendix
Glossary
Ground Lease Basis Ground Lease Basis is the historical purchase price paid by SAFE to acquire or originate a ground lease.
Combined Property Value
(CPV)
The current combined value of the land, buildings and improvements relating to a commercial property, as if there was no Ground
Lease on the land at the property. CPV is based on independent appraisals by CBRE. The Company will use management estimates for
recently acquired and originated ground leases for which appraisals from CBRE are not yet available.
Basis as % of CPV
Calculated as our Ground Lease Basis divided by CPV. We believe the metric is an indicative measure of the safety of our position in a
real estate property’s capital structure and represents our last-dollar economic exposure to the underlying property values.
Value Bank
Calculated as the difference between CPV and Ground Lease Basis. We believe Value Bank represents additional potential value to
SAFE stockholders through the reversion rights embedded in standard ground leases.
Ground Rent Coverage
The ratio of the Underlying Property’s NOI to the annualized base rental payment due to us. We believe the metric is indicative of our
seniority in a property’s cash flow waterfall. Underlying Property NOI is based on information reported to us by our tenants without
an independent investigation or verification by us. We are prohibited from publically disclosing the Underlying Property NOI at One
Ally Center pursuant to a confidentiality agreement with the tenant. We have estimated the ground rent coverage for One Ally
Center based upon available market information.
Funds from Operations
(FFO)
FFO is computed in accordance with the National Association of Real Estate Investment Trusts (NAREIT) which defines FFO as net
income (determined in accordance with GAAP), excluding gains or losses from sales of depreciable operating property, plus real
estate-related depreciation and amortization.
Adjusted Funds from
Operations (AFFO)
Calculated by adding (or subtracting) to FFO the following items: straight-line rental income, the amortization of real estate-related
intangibles, stock-based compensation, acquisition costs, non-cash management fees, and expense reimbursements, the amortization of
deferred financing costs and other expenses related to debt obligations.
FCCR, as adjusted Fixed Charge Coverage Ratio computed as annualized adjusted EBITDA divided by annualized fixed interest charges.
Adjusted EBITDA
Calculated as the sum of annualized AFFO prior to interest expense and the TTM percent rent payments from Hilton Western
Portfolio.
Underlying Property NOI
With respect to a property, the net operating income of the commercial real estate being operated at the property without giving
effect to any rent paid or payable under our ground lease. Net operating income is calculated as property-level revenues less property-
level operating expenses as reported to us by the tenant. We rely on net operating income as reported to us by our tenants without any
independent investigation by us. We are prohibited from publically disclosing the Underlying Property NOI at One Ally Center
pursuant to a confidentiality agreement with the tenant; therefore, in this presentation we have provided information using an
assumed Underlying Property NOI at One Ally Center, we have also presented the same information excluding all assumed
Underlying Property NOI at One Ally Center.
Leverage The ratio of book debt to book equity.
18
Safety, Income & Growth Inc.
The Ground Lease Company
Appendix
Explanation of FFO and AFFO
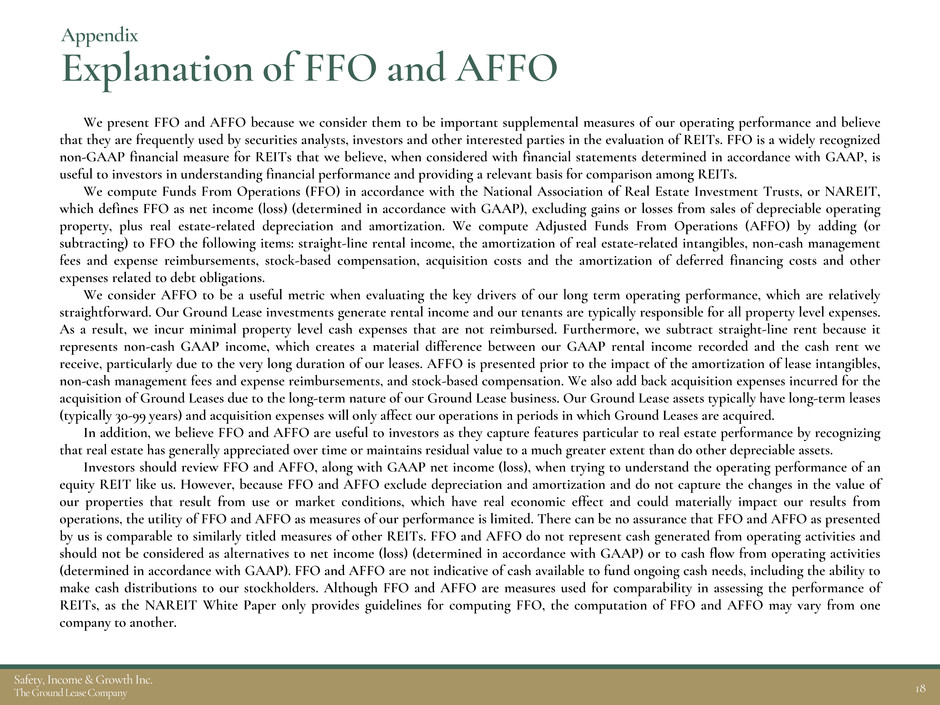
We present FFO and AFFO because we consider them to be important supplemental measures of our operating performance and believe
that they are frequently used by securities analysts, investors and other interested parties in the evaluation of REITs. FFO is a widely recognized
non-GAAP financial measure for REITs that we believe, when considered with financial statements determined in accordance with GAAP, is
useful to investors in understanding financial performance and providing a relevant basis for comparison among REITs.
We compute Funds From Operations (FFO) in accordance with the National Association of Real Estate Investment Trusts, or NAREIT,
which defines FFO as net income (loss) (determined in accordance with GAAP), excluding gains or losses from sales of depreciable operating
property, plus real estate-related depreciation and amortization. We compute Adjusted Funds From Operations (AFFO) by adding (or
subtracting) to FFO the following items: straight-line rental income, the amortization of real estate-related intangibles, non-cash management
fees and expense reimbursements, stock-based compensation, acquisition costs and the amortization of deferred financing costs and other
expenses related to debt obligations.
We consider AFFO to be a useful metric when evaluating the key drivers of our long term operating performance, which are relatively
straightforward. Our Ground Lease investments generate rental income and our tenants are typically responsible for all property level expenses.
As a result, we incur minimal property level cash expenses that are not reimbursed. Furthermore, we subtract straight-line rent because it
represents non-cash GAAP income, which creates a material difference between our GAAP rental income recorded and the cash rent we
receive, particularly due to the very long duration of our leases. AFFO is presented prior to the impact of the amortization of lease intangibles,
non-cash management fees and expense reimbursements, and stock-based compensation. We also add back acquisition expenses incurred for the
acquisition of Ground Leases due to the long-term nature of our Ground Lease business. Our Ground Lease assets typically have long-term leases
(typically 30-99 years) and acquisition expenses will only affect our operations in periods in which Ground Leases are acquired.
In addition, we believe FFO and AFFO are useful to investors as they capture features particular to real estate performance by recognizing
that real estate has generally appreciated over time or maintains residual value to a much greater extent than do other depreciable assets.
Investors should review FFO and AFFO, along with GAAP net income (loss), when trying to understand the operating performance of an
equity REIT like us. However, because FFO and AFFO exclude depreciation and amortization and do not capture the changes in the value of
our properties that result from use or market conditions, which have real economic effect and could materially impact our results from
operations, the utility of FFO and AFFO as measures of our performance is limited. There can be no assurance that FFO and AFFO as presented
by us is comparable to similarly titled measures of other REITs. FFO and AFFO do not represent cash generated from operating activities and
should not be considered as alternatives to net income (loss) (determined in accordance with GAAP) or to cash flow from operating activities
(determined in accordance with GAAP). FFO and AFFO are not indicative of cash available to fund ongoing cash needs, including the ability to
make cash distributions to our stockholders. Although FFO and AFFO are measures used for comparability in assessing the performance of
REITs, as the NAREIT White Paper only provides guidelines for computing FFO, the computation of FFO and AFFO may vary from one
company to another.

19
Safety, Income & Growth Inc.
The Ground Lease Company
Appendix
Asset Summary
Note: Ranked by Total GAAP Income. See “End Notes” slide for footnotes.
Property
Location
(MSA) Property Type
Lease Expiration
/ As Extended
Contractual Rent
Escalations
In Place
Base Rent
(Annualized)(1)
TTM
% Rent(2)
Total Income
Cash / GAAP(3)
Underlying
Property NOI to
Ground Rent
Coverage(4)
Doubletree Seattle Airport(5)(6) Seattle, WA Hospitality 2025 /2035 % Rent $4.5 $1.0 $5.5 / $5.5 3.3x
One Ally Center Detroit, MI Office 2114 / 2174 1.5% / p.a.(7) 2.6 N/A 2.6 / 5.3 >5.0x(8)
Hilton Salt Lake(5) Salt Lake City, UT Hospitality 2025 / 2035 % Rent 2.7 0.6 3.3 / 3.3 3.7x
6200 Hollywood (South) Los Angeles, CA Multi-Family 2104 / 2104 % of CPI / 4yrs(9) 2.6 N/A 2.6 / 2.6 >5.4x(10)
LifeHope Medical Campus Atlanta, GA Office 2116 / 2176 2.0% / p.a. 0.9 N/A 0.9 / 2.6 3.6x(11)
6201 Hollywood (North) Los Angeles, CA Multi-Family 2104 / 2104 % of CPI / 4yrs(12) 2.4 N/A 2.4 / 2.5 >6.0x(13)
Doubletree Mission Valley(5) San Diego, CA Hospitality 2025 / 2035 % Rent 1.1 0.7 1.8 / 1.8 6.0x
Doubletree Durango(5) Durango, CO Hospitality 2025 /2035 % Rent 0.9 0.3 1.2 / 1.2 3.3x
Doubletree Sonoma(5) San Francisco, CA Hospitality 2025 / 2035 % Rent 0.7 0.4 1.1 / 1.1 4.9x
Northside Forsyth Hospital Medical Center Atlanta, GA Office 2115 / 2175 1.5% / p.a.(14) 0.5 N/A 0.5 / 1.1 3.0x
Dallas Market Center: Sheraton Suites Dallas, TX Hospitality 2114 / 2114 2.0% / p.a.(15) 0.4 N/A 0.4 / 1.0 5.9x(16)
The Buckler Apartments Milwaukee, WI Multi-Family 2112 / 2112 15% / 10yrs 0.3 N/A 0.3 / 1.0 9.2x
NASA/JPSS Headquarters Washington, D.C. Office 2075 / 2105 3.0% / 5yrs 0.4 N/A 0.4 / 0.4 4.9x
Lock Up Self Storage Facility Minneapolis, MN Industrial 2037 / 2037 3.5% / 2yrs 0.1 N/A 0.1 / 0.1 6.5x(16)
Dallas Market Center: Marriott Courtyard Dallas, TX Hospitality 2026 / 2066 % Rent 0.1 0.2 0.3 / 0.0 18.5x(16)
Total / Weighted Avg. 49 / 67 yrs $20.2 $3.2 $23.4 / $29.5 4.59x (17)/4.64x(18)

20
Safety, Income & Growth Inc.
The Ground Lease Company
Appendix
End Notes
(1) Annualized cash base rental income in place as of September 30, 2017.
(2) Total percentage cash rental income during the 12 months ended September 30, 2017.
(3) Total GAAP Income reflects total cash rent adjusted for non-cash income and expenses, primarily consisting of straight-line
rent, to conform with GAAP.
(4) Ground Rent Coverage is the ratio of the underlying property cash NOI (excluding ground rent) to the annualized in-place base
ground rent.
(5) Property is part of the Hilton Western Portfolio and is subject to a single master lease. In November 2016, the master lease
governing the Hilton Western Portfolio which consists of five properties was amended to change the look back period for which
annual percentage rent is computed from the trailing twelve months ended September 30th to the trailing twelve months ended
December 31st. In March 2017, the Company recorded $0.5 million of income representing a one-time stub payment of percentage
rent for the 3 months ended December 31st, 2016, to account for the change in the look back period. The aggregate $3.0 million
percentage rent shown for the hotels comprising the Hilton Western excludes the one time $0.5 million stub period payment.
(6) A majority of the land underlying this property is owned by a third party and is ground leased to us through 2044 for $0.4 million
per year (subject to adjustment for changes in the CPI); however, our tenant pays this cost directly to the third party.
(7) During each 10th lease year, annual fixed rent is adjusted to the greater of (i) 1.5% over the prior year’s rent, or (ii) the product of
the rent applicable in the initial year of the 10 year period multiplied by a CPI factor, subject to a cap on the increase of 20% of
the rent applicable in that initial year.
(8) Represents the Company’s estimate of Ground Rent Coverage, is based on the Company’s estimate stabilized net operating
income, without giving effect to any rent abatements. Underlying Property NOI information provided by our Ground Lease
tenant is confidential. Company estimate is based on available market information.
(9) Base rent is subject to increase every 4 years based on a percentage of growth in the CPI for the greater Los Angeles area,
California in that time span. Rent increase capped at 12.0% from one rent period to the next. Next potential base increase is May
2018. Notwithstanding the foregoing, in 2058 and 2078, the annual base rent will be reset based on a calculation derived from the
then fair market value of the land, but not less than the annual base rent that was in effect before the reset.
(10) The property is currently under construction. We currently expect construction to be completed in 2018. Represents our
underwritten expected net operating income at the property upon stabilization and our estimated Ground Rent Coverage.

21
Safety, Income & Growth Inc.
The Ground Lease Company
Appendix
End Notes – (cont’d)
(11) The property is currently under renovation. We expect renovations to be completed in April 2018. Represents underwritten
expected NOI at the property upon stabilization and our estimated Ground Rent Coverage.
(12) Base rent is subject to increase every 4 years based on a percentage of growth in the CPI for the greater Los Angeles area,
California in that time span. Rent increase capped at 12.0% from one rent period to the next. The next potential base increase is
February 2019. Notwithstanding the foregoing, in 2059 and 2079, the annual base rent will be reset based on a calculation derived
from the then fair market value of the land, but not less than the annual base rent that was in effect before the reset.
(13) Construction was completed in 2016 and the property is currently in the lease up phase. A full year of property results is not yet
available. Represents our underwritten expected net operating income at the property upon stabilization and our estimated
Ground Rent Coverage. Company estimates are based on leasing activity at the property and available market information,
including leasing activity at comparable properties in the market.
(14) During each 10th lease year, annual fixed rent is adjusted to the greater of (i) 1.5% over the prior year’s rent, or (ii) the product of
the rent applicable in the initial year of the 10 year period multiplied by a CPI factor, subject to a cap on the increase of 20% of
the prior year’s rent.
(15) For the 51st through 99th years of the lease, the base rent is the greater of (i) the annual rent calculated based on 2.0% annual rent
escalation throughout the term of the lease, and (ii) the fair market rental value of the property.
(16) Underlying property cash NOI is based on June 30, 2017
(17) The weighted average of the Ground Rent Coverage is calculated by dividing the Underlying Property NOI by the annualized
in-place base rent of $20.2MM. Underlying Property NOI is based on September 30, 2017 unless otherwise noted. Excludes
estimates for One Ally Center.
(18) The weighted average of the Ground Rent Coverage is calculated by dividing the Underlying Property NOI by the annualized
in-place base rent of $20.1 million. Underlying Property NOI is based on September 30, 2017 unless otherwise noted. Includes
estimates for One Ally Center.
