Attached files
| file | filename |
|---|---|
| EX-99.1 - EXHIBIT 99.1 - ENTEGRIS INC | entg2017q3ex991.htm |
| 8-K - 8-K - ENTEGRIS INC | entg2017q3.htm |

OCTOBER 26, 2017
Earnings Summary
Third Quarter 2017

2
SAFE HARBOR
This document contains forward-looking statements within the meaning of the Private Securities Litigation Reform Act of 1995. The words
“believe,” “expect,” “anticipate,” “intends,” “estimate,” “forecast,” “project,” “should,” “may,” “will,” “would” or the negative thereof and
similar expressions are intended to identify such forward-looking statements. These forward-looking statements include statements related to
future period guidance; future sales, net income, net income per diluted share, non-GAAP EPS, non-GAAP net income, expenses and other
financial metrics; our performance relative to our markets; market and technology trends; the development of new products and the success
of their introductions; Company's capital allocation strategy, which may be modified at any time for any reason, including share repurchases,
dividends, debt repayments and potential acquisitions; our ability to execute on our strategies; and other matters. These statements involve
risks and uncertainties, and actual results may differ. These risks and uncertainties include, but are not limited to, weakening of global and/or
regional economic conditions, generally or specifically in the semiconductor industry, which could decrease the demand for our products and
solutions; our ability to meet rapid demand shifts; our ability to continue technological innovation and introduce new products to meet our
customers' rapidly changing requirements; our concentrated customer base; our ability to identify, effect and integrate acquisitions, joint
ventures or other transactions; our ability to protect and enforce intellectual property rights; operational, political and legal risks of our
international operations; our dependence on sole source and limited source suppliers; the increasing complexity of certain manufacturing
processes; raw material shortages and price increases; changes in government regulations of the countries in which we operate; fluctuation of
currency exchange rates; fluctuations in the market price of Entegris’ stock; the level of, and obligations associated with, our indebtedness;
and other risk factors and additional information described in our filings with the Securities and Exchange Commission, including under the
heading “Risks Factors" in Item 1A of our Annual Report on Form 10-K for the fiscal year ended December 31, 2016, filed on February 17, 2017,
and in our other periodic filings. The Company assumes no obligation to update any forward-looking statements or information, which speak
as of their respective dates.
This presentation contains references to “Adjusted EBITDA,” “Adjusted EBITDA Margin,” “Adjusted Operating Income,” “Adjusted Operating
Income Margin” and “Non-GAAP Earnings per Share” that are not presented in accordance GAAP. The non-GAAP financial measures should not
be considered in isolation or as a substitute for GAAP financial measures but should instead be read in conjunction with the GAAP financial
measures. Further information with respect to and reconciliations of such measures to the most directly comparable GAAP financial measure
can be found attached to this presentation.

3
3Q17 AND YEAR-TO-DATE HIGHLIGHTS
◦ 3Q17 sales grew 16% from a year ago and 5% sequentially, reflecting strong performance of both our new products
and legacy offerings;
◦ Specialty Chemicals and Engineered Materials sales grew 19% from a year ago to a record level
◦ Microcontamination Control sales grew 23% from a year ago, achieving 6th consecutive record quarter
◦ Advanced Materials Handling sales grew 8%
◦ Achieved quarterly GAAP EPS of $0.28, and non-GAAP EPS of $0.40, which grew 87% and 67%, respectively, from the
prior year;
◦ Generated record quarterly adjusted EBITDA of $96 million, or 28% of revenue;
◦ Grew sales year-to-date 14% to $992 million;
◦ Increased year-to-date GAAP EPS of $0.79 by 58% and non-GAAP EPS of $1.02 by 48% from same period in 2016;
◦ Took steps to further realign our AMH business and expand its future profitability; and
◦ Expanded our capital allocation strategy to include a quarterly dividend, while continuing to pay down our term loan
and make modest share repurchases

$ in millions, except per share data 3Q17 3Q17 Guidance 2Q17 3Q16
3Q17 over
3Q16
3Q17 over
2Q17
Net Revenue $345.6 $325 to $340 $329.0 $296.7 16.5% 5.0%
Gross Margin 45.0% 45.7% 41.5%
Operating Expenses $94.8 $90 to $92 $91.2 $88.3 7.4% 3.9%
Operating Income $60.7 $59.1 $34.7 74.9% 2.7%
Operating Margin 17.6% 18.0% 11.7%
Tax Rate 18.4% 21.6% 15.2%
Net Income $40.9 $36 to $43 $40.0 $21.9 86.8% 2.3%
EPS $0.28 $0.25 to $0.30 $0.28 $0.15 86.7% 0%
4
SUMMARY – CONSOLIDATED STATEMENT OF OPERATIONS (GAAP)
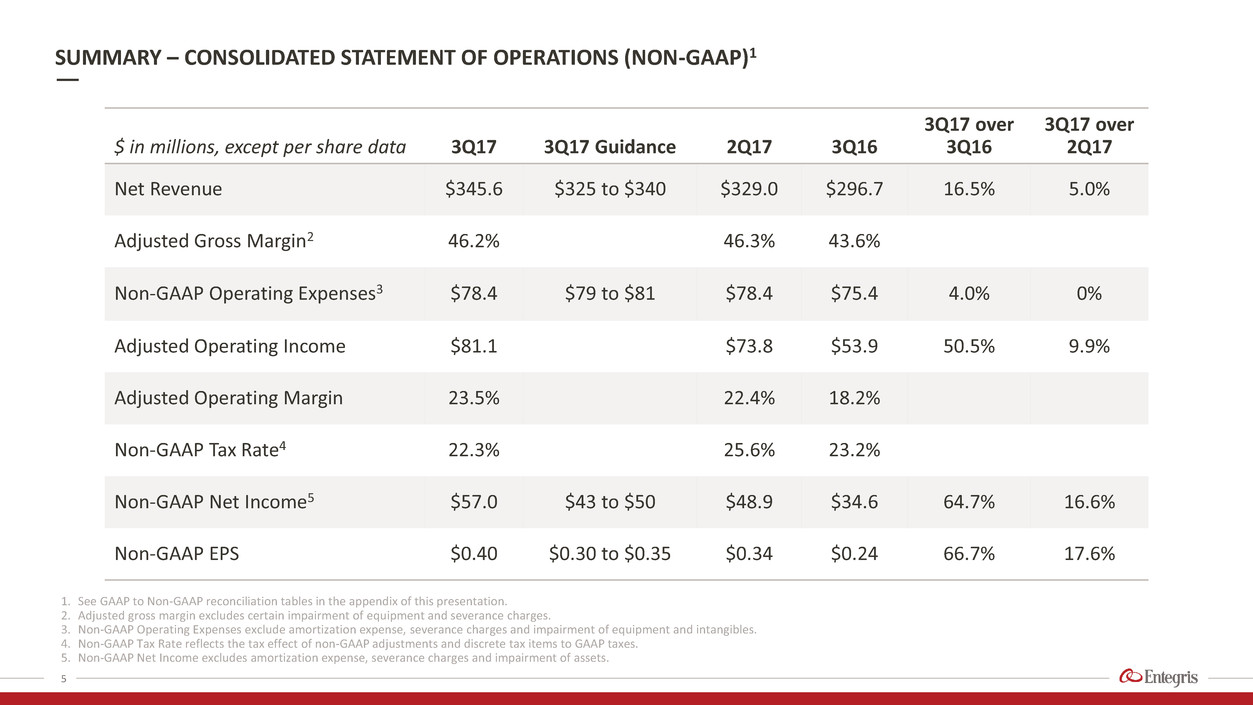
$ in millions, except per share data 3Q17 3Q17 Guidance 2Q17 3Q16
3Q17 over
3Q16
3Q17 over
2Q17
Net Revenue $345.6 $325 to $340 $329.0 $296.7 16.5% 5.0%
Adjusted Gross Margin2 46.2% 46.3% 43.6%
Non-GAAP Operating Expenses3 $78.4 $79 to $81 $78.4 $75.4 4.0% 0%
Adjusted Operating Income $81.1 $73.8 $53.9 50.5% 9.9%
Adjusted Operating Margin 23.5% 22.4% 18.2%
Non-GAAP Tax Rate4 22.3% 25.6% 23.2%
Non-GAAP Net Income5 $57.0 $43 to $50 $48.9 $34.6 64.7% 16.6%
Non-GAAP EPS $0.40 $0.30 to $0.35 $0.34 $0.24 66.7% 17.6%
5
1. See GAAP to Non-GAAP reconciliation tables in the appendix of this presentation.
2. Adjusted gross margin excludes certain impairment of equipment and severance charges.
3. Non-GAAP Operating Expenses exclude amortization expense, severance charges and impairment of equipment and intangibles.
4. Non-GAAP Tax Rate reflects the tax effect of non-GAAP adjustments and discrete tax items to GAAP taxes.
5. Non-GAAP Net Income excludes amortization expense, severance charges and impairment of assets.
SUMMARY – CONSOLIDATED STATEMENT OF OPERATIONS (NON-GAAP)1
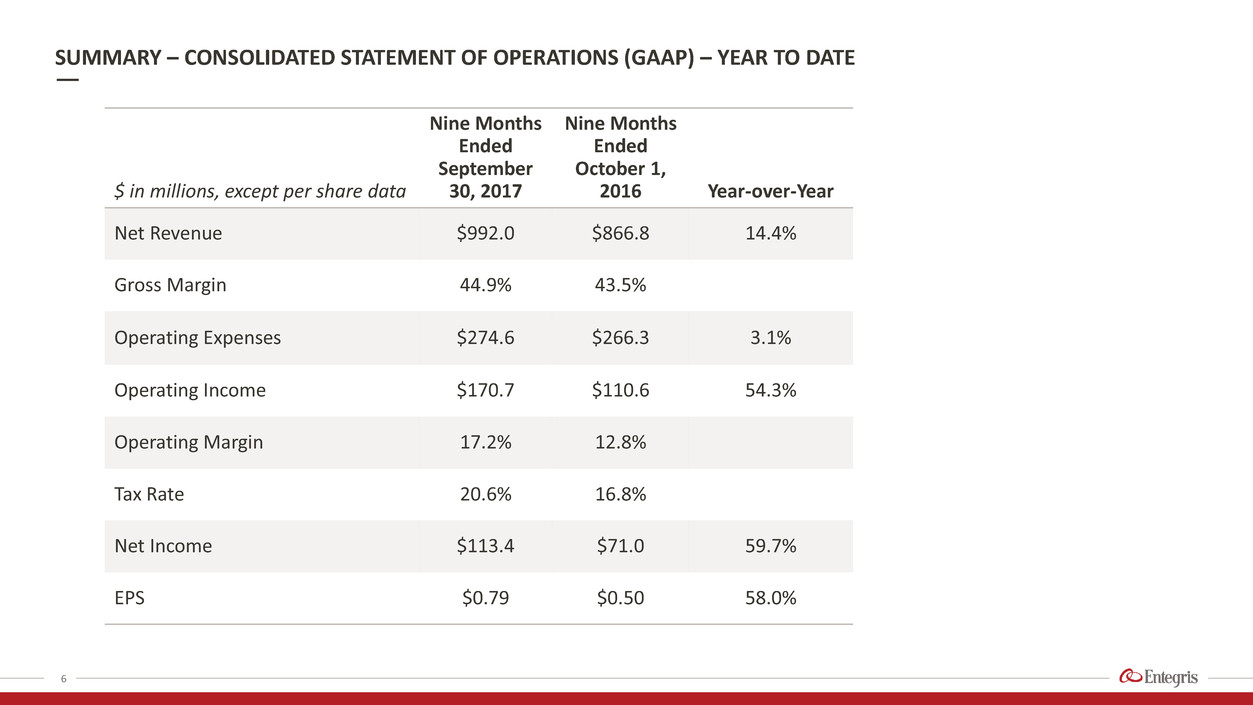
$ in millions, except per share data
Nine Months
Ended
September
30, 2017
Nine Months
Ended
October 1,
2016 Year-over-Year
Net Revenue $992.0 $866.8 14.4%
Gross Margin 44.9% 43.5%
Operating Expenses $274.6 $266.3 3.1%
Operating Income $170.7 $110.6 54.3%
Operating Margin 17.2% 12.8%
Tax Rate 20.6% 16.8%
Net Income $113.4 $71.0 59.7%
EPS $0.79 $0.50 58.0%
6
SUMMARY – CONSOLIDATED STATEMENT OF OPERATIONS (GAAP) – YEAR TO DATE

$ in millions, except per share data
Nine Months
Ended
September
30, 2017
Nine Months
Ended
October 1,
2016 Year-over-Year
Net Revenue $992.0 $866.8 14.4%
Gross Margin 45.5% 44.2%
Operating Expenses $234.6 $231.0 1.6%
Operating Income $216.8 $152.2 42.4%
Operating Margin 21.9% 17.6%
Tax Rate 23.5% 22.3%
Net Income $146.6 $98.6 48.7%
EPS $1.02 $0.69 47.8%
7
SUMMARY – CONSOLIDATED STATEMENT OF OPERATIONS (NON-GAAP) – YEAR TO DATE

8
1. Represents diluted earnings per share. See Reconciliation of GAAP Net Income to Non-GAAP Earnings per Share in the appendix of this presentation.
EARNINGS PER SHARE1
$0.15
$0.28
$0.24
$0.40
$0.00
$0.05
$0.10
$0.15
$0.20
$0.25
$0.30
$0.35
$0.40
$0.45
3Q16 3Q17
EPS: 3Q17 vs. 3Q16
GAAP Non-GAAP
$0.63
$0.97
$0.90
$1.26
$0.00
$0.20
$0.40
$0.60
$0.80
$1.00
$1.20
$1.40
3Q16 3Q17
EPS: Trailing 4 Quarters
GAAP Non-GAAP

RESULTS BY SEGMENT1
9
1. Adjusted segment operating margin excludes amortization of intangibles and unallocated expenses.
2. Segment profit for SCEM for 3Q16 and 3Q17 includes a charge for severance of $699K and $14K, respectively.
3. Segment profit for MC for 3Q16 and Q317 includes a charge for severance of $737K and $196K, respectively. Segment profit for MC for 2Q17 includes charges for impairment of equipment and
severance of $884K and $559K, respectively.
4. Segment profit for AMH for 3Q16 includes charges for impairment of equipment and severance totaling $6,795K. Segment profit for AMH for 2Q17 includes charges for impairment of equipment of
$2,286K. Segment profit for AMH for 3Q17 includes charges for impairment of equipment and severance totaling $5,221K
0%
10%
20%
30%
40%
$0
$20
$40
$60
$80
$100
$120
3Q16 4Q16 1Q17 2Q17 3Q17
Specialty Chemicals and
Engineered Materials
Segment2
Sales Adj. Op. margin
0%
10%
20%
30%
40%
$0
$20
$40
$60
$80
$100
$120
3Q16 4Q16 1Q17 2Q17 3Q17
Microcontamination
Control Segment3
Sales Adj. Op. margin
0%
10%
20%
30%
40%
$0
$20
$40
$60
$80
$100
$120
3Q16 4Q16 1Q17 2Q17 3Q17
Advanced Materials
Handling Segment4
Sales Adj. Op. margin
$ in millions

REVENUE BY GEOGRAPHY: STRONG GROWTH IN ASIA AND EUROPE
10
N. America
Asia
Japan
Europe
YTD17 Revenue by Geography
YTD Revenue = $992.0 million
11%
19%
2%
13%
N. America
Asia
Japan
Europe
0% 5% 10% 15% 20% 25%
YTD17 vs. YTD16 Growth Rate
$89.0M
$571.0M
$212.1M
$119.9M

$ in millions 3Q17 2Q17 3Q16
$ Amount % Total $ Amount % Total $ Amount % Total
Cash & Cash Equivalents $435.2 24.8% $405.6 23.5% $411.8 24.0%
Accounts Receivable, net $183.4 10.4% $171.1 9.9% $167.6 9.8%
Inventories $193.3 11.0% $194.2 11.2% $186.0 10.9%
Net PP&E $346.7 19.7% $341.1 19.7% $315.5 18.4%
Total Assets $1,757.7 $1,727.4 $1,713.6
Current Liabilities1 $269.9 15.4% $251.0 14.5% $237.7 13.9%
Long-term debt, excluding
current maturities
$411.5 23.4% $435.9 25.2% $508.8 29.7%
Total Liabilities $739.4 42.1% $745.1 43.1% $816.4 47.6%
Total Shareholders’ Equity $1,018.4 57.9% $982.3 56.9% $897.2 52.4%
AR - DSOs 48.4 47.5 51.5
Inventory Turns 3.9 3.7 3.8
11
1. Current Liabilities in 3Q17, 2Q17 and 3Q16 includes $100 million of current maturities of long term debt, respectively.
SUMMARY – BALANCE SHEET ITEMS

12
1. See Reconciliation of GAAP Income to Adjusted Operating Income and Adjusted EBITDA in the appendix of this presentation.
ADJUSTED EBITDA MARGIN1
$245
$33021.6%
25.4%
0
50
100
150
200
250
300
350
TTM -3Q16 TTM-3Q17
Adjusted EBITDA TTM
Adj. EBITDA in $M Adj. EBITDA as % of Sales
$68 $70
$76
$88
$96
22.8% 22.7%
23.9%
26.8%
27.7%
0
40
80
3Q16 4Q16 1Q17 2Q17 3Q17
Adjusted EBITDA and EBITDA Margin
Adj. EBITDA in $M Adj. EBITDA as % of Sales

$ in millions 3Q17 2Q17 3Q16
Beginning Cash Balance $405.6 $391.2 $373.7
Cash from operating activities $89.0 $85.2 $71.9
Capital expenditures ($25.4) ($20.3) ($13.1)
Acquisition of business - ($20.0) -
Payments on long-term debt ($25.0) ($25.0) ($25.0)
Repurchase and retirement of common stock ($10.0) ($4.0) -
Other investing activities $0.9 - $0.1
Other financing activities $0.5 $0.2 ($0.2)
Effect of exchange rates ($0.4) ($1.7) $4.3
Ending Cash Balance $435.2 $405.6 $411.8
Free Cash Flow1 $63.6 $64.9 $58.8
Adjusted EBITDA $95.9 $88.2 $67.7
CASH FLOWS
13
1. Free cash flow equals cash from operations less capital expenditures.
OUTLOOK
14
1. Non-GAAP operating expenses exclude amortization. In 4Q17, amortization is estimated to be approximately $11 million, or $0.05 per share.
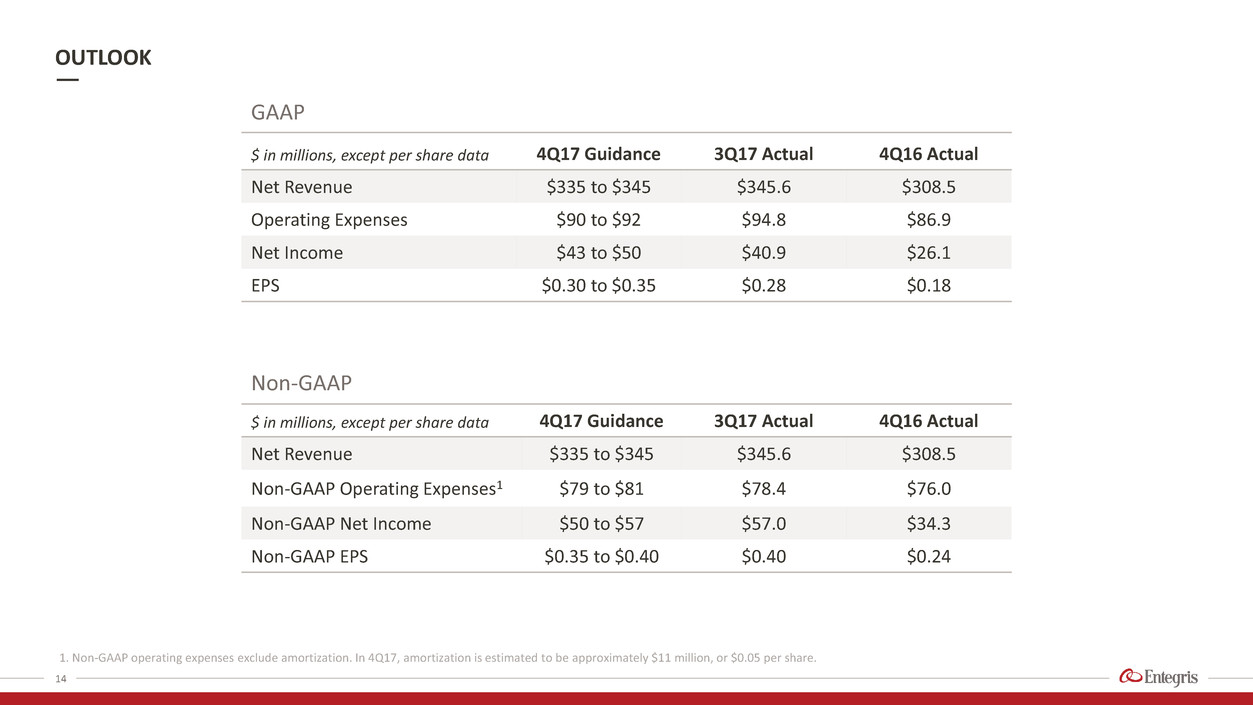
$ in millions, except per share data 4Q17 Guidance 3Q17 Actual 4Q16 Actual
Net Revenue $335 to $345 $345.6 $308.5
Operating Expenses $90 to $92 $94.8 $86.9
Net Income $43 to $50 $40.9 $26.1
EPS $0.30 to $0.35 $0.28 $0.18
$ in millions, except per share data 4Q17 Guidance 3Q17 Actual 4Q16 Actual
Net Revenue $335 to $345 $345.6 $308.5
Non-GAAP Operating Expenses1 $79 to $81 $78.4 $76.0
Non-GAAP Net Income $50 to $57 $57.0 $34.3
Non-GAAP EPS $0.35 to $0.40 $0.40 $0.24
Non-GAAP
GAAP

Entegris®, the Entegris Rings Design™ and Pure Advantage™ are trademarks of Entegris, Inc. ©2016 Entegris, Inc. All rights reserved.
15

NON-GAAP RECONCILIATION TABLE
RECONCILIATION OF GAAP GROSS PROFIT TO ADJUSTED GROSS PROFIT
16
Three months ended Nine months ended
September 30,
2017
October 1,
2016 July 1, 2017
September 30,
2017
October 1,
2016
Net Sales $345,591 $296,692 $329,002 $991,970 $866,768
Gross profit-GAAP $155,407 $122,980 $150,303 $445,306 $376,891
Adjustments to gross profit:
Severance related to organizational realignment 740 431 - 740 431
Impairment of equipment 3,364 5,826 1,966 5,330 5,826
Adjusted gross profit $159,511 129,237 $152,269 451,376 $383,148
Gross margin - as a % of net sales 45.0% 41.5% 45.7% 44.9% 43.5%
Adjusted gross margin - as a % of net sales 46.2% 43.6% 46.3% 45.5% 44.2%
$ in thousands

NON-GAAP RECONCILIATION TABLE
RECONCILIATION OF GAAP SEGMENT PROFIT TO ADJUSTED OPERATING INCOME
17
Three months ended Nine months ended
Segment profit-GAAP September 30, 2017 October 1, 2016 July 1, 2017 September 30, 2017 October 1, 2016
Specialty Chemicals and Engineered Materials $34,647 $18,811 $34,174 $96,961 $70,141
Microcontamination Control 43,984 31,617 36,484 116,049 78,323
Advanced Materials Handling 16,882 15,378 19,573 54,731 56,808
Total segment profit 95,513 65,806 90,231 267,741 205,272
Amortization of intangible assets 11,051 10,974 11,007 33,003 33,325
Unallocated expenses 23,807 20,160 20,134 64,073 61,316
Total operating income $60,655 $34,672 $59,090 $170,665 $110,631
$ in thousands
Three months ended Nine months ended
Adjusted segment profit September 30, 2017 October 1, 2016 July 1, 2017 September 30, 2017 October 1, 2016
Specialty Chemicals and Engineered Materials1 $34,661 $19,510 $34,174 $96,975 $70,840
Microcontamination Control2 44,180 32,354 37,927 117,688 79,060
Advanced Materials Handling3 22,103 22,173 21,859 62,238 63,603
Total segment profit 100,944 74,037 93,960 276,901 213,503
Amortization of intangible assets4 - - - - -
Unallocated expenses5 19,867 20,160 20,134 60,133 61,316
Total adjusted operating income $81,077 $53,877 $73,826 $216,768 $152,187
1. Adjusted segment profit for SCEM for the three months and nine months ended October 1, 2016 excludes charges for severance related to organizational realignment of $699K. Adjusted segment profit for SCEM for the three months and nine months
ended September 30, 2017 excludes charges for severance related to organizational realignment of $14K.
2. Adjusted segment profit for MC excludes charges for impairment of equipment and severance related to organizational realignment of $196K, $737K, and $1,443K for the three months ended September 30, 2017, October 1, 2016, and July 1, 2017,
respectively. Adjusted segment profit for MC excludes impairment of equipment and charges for severance related to organizational realignment of $1,639K and $737K for the nine months ended September 30, 2017 and October 1, 2016, respectively.
3. Adjusted segment profit for AMH excludes charges for impairment of equipment and severance related to organizational realignment of $5,221K, $6,795K and $2,286K for the three months ended September 30, 2017, October 1, 2016, and July 1, 2017,
respectively. Adjusted segment profit for AMH excludes charges for impairment of equipment and severance related to organizational realignment of $7,507 and $6,795 for the nine months ended September 30, 2017 and October 1, 2016, respectively.
4. Adjusted amortization of intangible assets excludes amortization expense of $11,051K, $10,974K, and $11,007K for the three months ended September 30, 2017, October 1, 2016, and July 1, 2017, respectively, and $33,003K and $33,325K for the nine
months ended September 30, 2017 and October 1, 2016, respectively.
5. Adjusted unallocated expenses excludes charges for impairment of intangibles and severance related to organizational realignment of $3,940K for the three months and nine months ended September 30, 2017.

NON-GAAP RECONCILIATION TABLE
RECONCILIATION OF GAAP TO ADJUSTED OPERATING INCOME AND ADJUSTED EBITDA
18
Three months ended Nine months ended
September 30,
2017
October 1,
2016 July 1, 2017
September
30, 2017
October 1,
2016
Net sales $345,591 $296,692 $329,002 $991,970 $866,768
Net income $40,902 $21,947 $39,991 $113,407 $71,049
Adjustments to net income:
Income tax expense 9,248 3,945 11,042 29,401 14,331
Interest expense, net 7,599 9,345 8,103 24,095 27,545
Other expense (income), net 2,906 (565) (46) 3,762 (2,294)
GAAP - Operating income 60,655 34,672 59,090 170,665 110,631
Severance 2,141 2,405 559 2,700 2,405
Impairment of equipment and intangibles1 7,230 5,826 3,170 10,400 5,826
Amortization of intangible assets 11,051 10,974 11,007 33,003 33,325
Adjusted operating income 81,077 53,877 73,826 216,768 152,187
Depreciation 14,785 13,795 14,411 43,173 41,320
Adjusted EBITDA $95,862 $67,672 $88,237 $259,941 $193,507
Adjusted operating margin 23.5% 18.2% 22.4% 21.9% 17.6%
Adjusted EBITDA - as a % of net sales 27.7% 22.8% 26.8% 26.2% 22.3%
$ in thousands
1. Includes product line impairment charges of $3,364K, $5,826K and $1,966K classified as cost of sales for the three months ended September 30, 2017, October 1, 2016 and July 1, 2017, respectively. Includes
product line impairment charges of $5,330K and $5,826K classified as cost of sales for the nine months ended September 30, 2017 and October 1, 2016, respectively.
Includes Jetalon intangible impairment charge of $3,866K classified as selling general and administrative expense for both the three and nine months ended September 30, 2017.
Includes product line impairment charge of $320K classified as selling general and administrative expense for both the three months ended July 1, 2017 and the nine months ended September 30, 2017.
Includes product line impairment charge of $884K classified as engineering, research and development expense for both the three months ended July 1, 2017 and the nine months ended September 30, 2017.
NON-GAAP RECONCILIATION TABLE
RECONCILIATION OF GAAP TO NON-GAAP EARNINGS PER SHARE
19
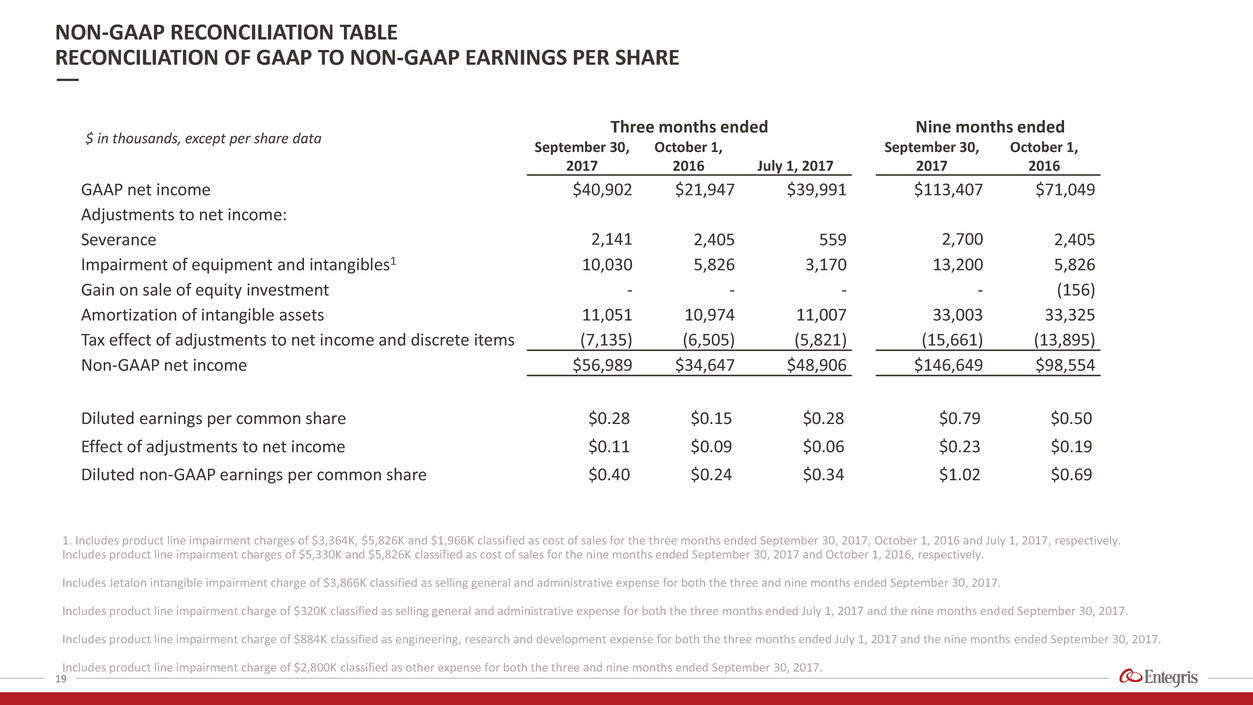
Three months ended Nine months ended
September 30,
2017
October 1,
2016 July 1, 2017
September 30,
2017
October 1,
2016
GAAP net income $40,902 $21,947 $39,991 $113,407 $71,049
Adjustments to net income:
Severance 2,141 2,405 559 2,700 2,405
Impairment of equipment and intangibles1 10,030 5,826 3,170 13,200 5,826
Gain on sale of equity investment - - - - (156)
Amortization of intangible assets 11,051 10,974 11,007 33,003 33,325
Tax effect of adjustments to net income and discrete items (7,135) (6,505) (5,821) (15,661) (13,895)
Non-GAAP net income $56,989 $34,647 $48,906 $146,649 $98,554
Diluted earnings per common share $0.28 $0.15 $0.28 $0.79 $0.50
Effect of adjustments to net income $0.11 $0.09 $0.06 $0.23 $0.19
Diluted non-GAAP earnings per common share $0.40 $0.24 $0.34 $1.02 $0.69
$ in thousands, except per share data
1. Includes product line impairment charges of $3,364K, $5,826K and $1,966K classified as cost of sales for the three months ended September 30, 2017, October 1, 2016 and July 1, 2017, respectively.
Includes product line impairment charges of $5,330K and $5,826K classified as cost of sales for the nine months ended September 30, 2017 and October 1, 2016, respectively.
Includes Jetalon intangible impairment charge of $3,866K classified as selling general and administrative expense for both the three and nine months ended September 30, 2017.
Includes product line impairment charge of $320K classified as selling general and administrative expense for both the three months ended July 1, 2017 and the nine months ended September 30, 2017.
Includes product line impairment charge of $884K classified as engineering, research and development expense for both the three months ended July 1, 2017 and the nine months ended September 30, 2017.
Includes product line impairment charge of $2,800K classified as other expense for both the three and nine months ended September 30, 2017.
20
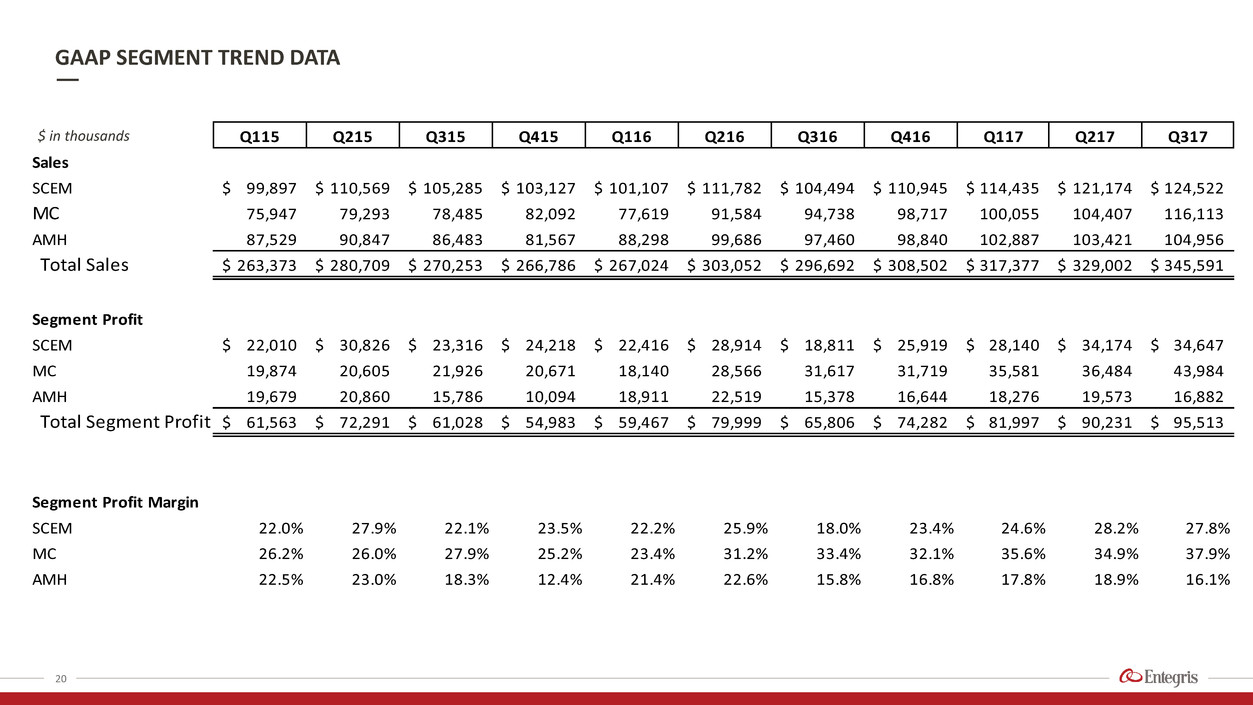
GAAP SEGMENT TREND DATA
Q115 Q215 Q315 Q415 Q116 Q216 Q316 Q416 Q117 Q217 Q317
Sales
SCEM 99,897$ 110,569$ 105,285$ 103,127$ 101,107$ 111,782$ 104,494$ 110,945$ 114,435$ 121,174$ 124,522$
MC 75,947 79,293 78,485 82,092 77,619 91,584 94,738 98,717 100,055 104,407 116,113
AMH 87,529 90,847 86,483 81,567 88,298 99,686 97,460 98,840 102,887 103,421 104,956
Total Sales 263,373$ 280,709$ 270,253$ 266,786$ 267,024$ 303,052$ 296,692$ 308,502$ 317,377$ 329,002$ 345,591$
Segment Profit
SCEM 22,010$ 30,826$ 23,316$ 24,218$ 22,416$ 28,914$ 18,811$ 25,919$ 28,140$ 34,174$ 34,647$
MC 19,874 20,605 21,926 20,671 18,140 28,566 31,617 31,719 35,581 36,484 43,984
AMH 19,679 20,860 15,786 10,094 18,911 22,519 15,378 16,644 18,276 19,573 16,882
Total Segment Profit 61,563$ 72,291$ 61,028$ 54,983$ 59,467$ 79,999$ 65,806$ 74,282$ 81,997$ 90,231$ 95,513$
Segment Profit Margin
SCEM 22.0% 27.9% 22.1% 23.5% 22.2% 25.9% 18.0% 23.4% 24.6% 28.2% 27.8%
MC 26.2% 26.0% 27.9% 25.2% 23.4% 31.2% 33.4% 32.1% 35.6% 34.9% 37.9%
AMH 22.5% 23.0% 18.3% 12.4% 21.4% 22.6% 15.8% 16.8% 17.8% 18.9% 16.1%
$ in thousands

NON-GAAP SEGMENT TREND DATA
21
1. Adjusted segment profit for SCEM for Q316 excludes charges for severance of $699K. Adjusted segment profit for SCEM for Q317 excludes charges for severance of $14K.
2. Adjusted segment profit for MC for Q316 excludes charges for severance of $737K. Adjusted segment profit for MC for 2Q17 excludes charges for impairment of equipment and severance of $884K
and $559K, respectively. Adjusted segment profit for MC for Q317 excludes charges for severance of $196K.
3. Adjusted segment profit for AMH for Q316 excludes charges for impairment of equipment and severance related to organizational realignment of $5,826K and $969K, respectively. Adjusted
segment profit for AMH for 2Q17 excludes charges for impairment of equipment of $2,286K. Adjusted segment profit for AMH for Q317 excludes charges for impairment of equipment and severance
related to organizational realignment of $3,364K and $1,857K, respectively.
Q115 Q215 Q315 Q415 Q116 Q216 Q316 Q416 Q117 Q217 Q317
Sales
SCEM 99,897$ 110,569$ 105,285$ 103,127$ 101,107$ 111,782$ 104,494$ 110,945$ 114,435$ 121,174$ 124,522$
MC 75,947 79,293 78,485 82,092 77,619 91,584 94,738 98,717 100,055 104,407 116,113
AMH 87,529 90,847 86,483 81,567 88,298 99,686 97,460 98,840 102,887 103,421 104,956
Total Sales 263,373$ 280,709$ 270,253$ 266,786$ 267,024$ 303,052$ 296,692$ 308,502$ 317,377$ 329,002$ 345,591$
Adjusted Segment Profit
SCEM1 22,010$ 30,826$ 23,316$ 24,218$ 22,416$ 28,914$ 19,510$ 25,919$ 28,140$ 34,174$ 34,661$
MC2 19,874 20,605 21,926 20,671 18,140 28,566 32,354 31,719 35,581 37,927 44,180
AMH3 19,679 20,860 15,786 10,094 18,911 22,519 22,173 16,644 18,276 21,859 22,103
Total Adj. Segment Profit 61,563$ 72,291$ 61,028$ 54,983$ 59,467$ 79,999$ 74,037$ 74,282$ 81,997$ 93,960$ 100,944$
Adjusted Segment Profit Margin
SCEM 22.0% 27.9% 22.1% 23.5% 22.2% 25.9% 18.7% 23.4% 24.6% 28.2% 27.8%
MC 26.2% 26.0% 27.9% 25.2% 23.4% 31.2% 34.2% 32.1% 35.6% 36.3% 38.0%
AMH 22.5% 23.0% 18.3% 12.4% 21.4% 22.6% 22.8% 16.8% 17.8% 21.1% 21.1%
$ in thousands
