Attached files
| file | filename |
|---|---|
| EX-99.1 - EXHIBIT 99.1 - VALLEY NATIONAL BANCORP | exhibit991earningsrelease1.htm |
| 8-K - 8-K - VALLEY NATIONAL BANCORP | vly8-k20171025earningsrele.htm |

© 2017 Valley National Bank®. Member FDIC. Equal Opportunity Lender. All Rights Reserved.
Third Quarter 2017
Earnings Conference Call
October 25, 2017
EXHIBIT 99.2

Forward Looking Statements
The foregoing contains forward-looking statements within the meaning of the Private Securities Litigation Reform Act of 1995. Such statements are not historical
facts and include expressions about management’s confidence and strategies and management’s expectations about new and existing programs and products,
acquisitions, relationships, opportunities, taxation, technology, market conditions and economic expectations. These statements may be identified by such forward-
looking terminology as “should,” “expect,” “believe,” “view,” “opportunity,” “allow,” “continues,” “reflects,” “typically,” “usually,” “anticipate,” or similar statements
or variations of such terms. Such forward-looking statements involve certain risks and uncertainties. Actual results may differ materially from such forward-looking
statements. Factors that may cause actual results to differ materially from those contemplated by such forward-looking statements include, but are not limited to:
weakness or a decline in the economy, mainly in New Jersey, New York and Florida, as well as an unexpected decline in commercial real estate values within our
market areas; less than expected cost reductions and revenue enhancement from Valley's cost reduction plans including its earnings enhancement program called
"LIFT"; damage verdicts or settlements or restrictions related to existing or potential litigations arising from claims of breach of fiduciary responsibility, negligence,
fraud, contractual claims, environmental laws, patent or trade mark infringement, employment related claims, and other matters; the loss of or decrease in lower-
cost funding sources within our deposit base may adversely impact our net interest income and net income; cyber attacks, computer viruses or other malware that
may breach the security of our websites or other systems to obtain unauthorized access to confidential information, destroy data, disable or degrade service, or
sabotage our systems; results of examinations by the OCC, the FRB, the CFPB and other regulatory authorities, including the possibility that any such regulatory
authority may, among other things, require us to increase our allowance for credit losses, write-down assets, require us to reimburse customers, change the way we
do business, or limit or eliminate certain other banking activities; changes in accounting policies or accounting standards, including the new authoritative accounting
guidance (known as the current expected credit loss (CECL) model) which may increase the required level of our allowance for credit losses after adoption on January
1, 2020; higher or lower than expected income tax expense or tax rates, including increases or decreases resulting from changes in tax laws, regulations and case law;
our inability or determination not to pay dividends at current levels, or at all, because of inadequate future earnings, regulatory restrictions or limitations, changes in
our capital requirements or a decision to increase capital by retaining more earnings; higher than expected loan losses within one or more segments of our loan
portfolio; unanticipated loan delinquencies, loss of collateral, decreased service revenues, and other potential negative effects on our business caused by severe
weather or other external events; unexpected significant declines in the loan portfolio due to the lack of economic expansion, increased competition, large
prepayments, changes in regulatory lending guidance or other factors; the failure of other financial institutions with whom we have trading, clearing, counterparty
and other financial relationships; failure to close the merger with USAB for any reason, including the failure to obtain shareholder approval for the merger within the
proposed timeframe or the stock price of Valley during the 30 day pricing period prior to the closing of the merger gives either Valley or USAB the right to terminate
the merger agreement; the risk that the businesses of Valley and USAB may not be combined successfully, or such combination may take longer or be more difficult,
time-consuming or costly to accomplish than expected; the diversion of management's time on issues relating to the merger; the inability to realize expected cost
savings and synergies from the merger of USAB with Valley in the amounts or in the timeframe anticipated; and the inability to retain USAB’s customers and
employees. A detailed discussion of factors that could affect our results is included in our SEC filings, including the “Risk Factors” section of our Annual Report on
Form 10-K for the year ended December 31, 2016 and Quarterly Report on Form 10-Q for the period ended June 30, 2017. We undertake no duty to update any
forward-looking statement to conform the statement to actual results or changes in our expectations. Although we believe that the expectations reflected in the
forward-looking statements are reasonable, we cannot guarantee future results, levels of activity, performance or achievements.
2

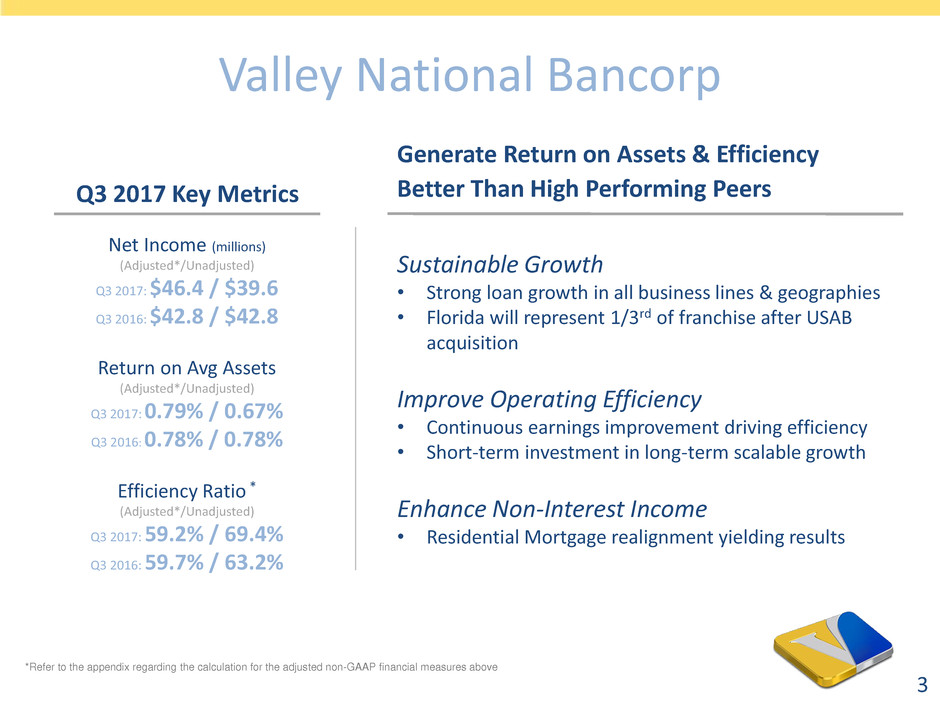
Net Income (millions)
(Adjusted*/Unadjusted)
Q3 2017: $46.4 / $39.6
Q3 2016: $42.8 / $42.8
Return on Avg Assets
(Adjusted*/Unadjusted)
Q3 2017: 0.79% / 0.67%
Q3 2016: 0.78% / 0.78%
Efficiency Ratio *
(Adjusted*/Unadjusted)
Q3 2017: 59.2% / 69.4%
Q3 2016: 59.7% / 63.2%
Valley National Bancorp
Generate Return on Assets & Efficiency
Better Than High Performing Peers Q3 2017 Key Metrics
*Refer to the appendix regarding the calculation for the adjusted non-GAAP financial measures above
3
Sustainable Growth
• Strong loan growth in all business lines & geographies
• Florida will represent 1/3rd of franchise after USAB
acquisition
Improve Operating Efficiency
• Continuous earnings improvement driving efficiency
• Short-term investment in long-term scalable growth
Enhance Non-Interest Income
• Residential Mortgage realignment yielding results

4
Net Interest Income
Net Interest Margin
Earning Asset Yield Funding Beta (β)
• Margin Compression of 12bps linked quarter
– 8bps attributable to declines in swap fees
and interest recoveries QoQ
• Management has controlled funding cost
through 3 rate hikes
• Adjusting for swap fees, earning asset yields
continue to improve
3.85% 3.89%
3.83%
3.91% 3.93%
3.89%
3.99%
3.84%
3.98%
3.95%
3.75%
3.80%
3.85%
3.90%
3.95%
4.00%
4.05%
Q3 2016 Q4 2016 Q1 2017 Q2 2017 Q3 2017
EA Yield w/o Swap Income EA Yield w/ Swap Income
0.76% 0.73% 0.72%
0.81%
0.89%
0.50%
0.75%
1.00%
1.25% 1.25%
0.40%
0.60%
0.80%
1.00%
1.20%
1.40%
Q3 2016 Q4 2016 Q1 2017 Q2 2017 Q3 2017
Cost of Funds Federal Funds Target (Upper Limit)
YTD 2017 Highlights
Nine Months Ended
September 30,
($ millions) 2017 2016 Δ
Interest Income 622 566 56
Interest Expense 126 112 14
Net Interest Income 496 454 42
Cumulative
β: 17%

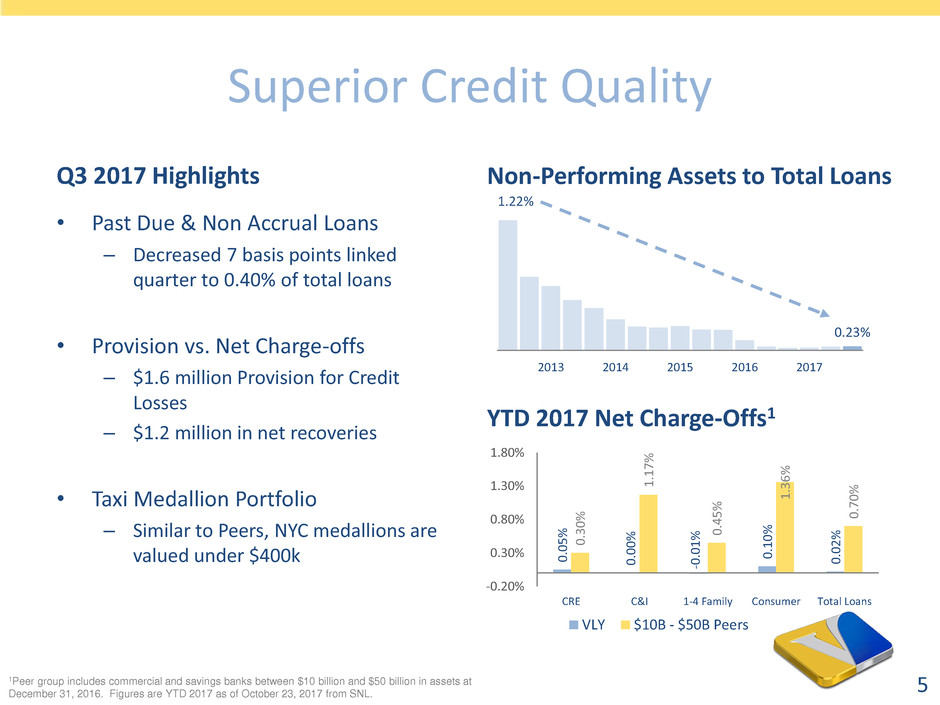
Superior Credit Quality
Q3 2017 Highlights
• Past Due & Non Accrual Loans
– Decreased 7 basis points linked
quarter to 0.40% of total loans
• Provision vs. Net Charge-offs
– $1.6 million Provision for Credit
Losses
– $1.2 million in net recoveries
• Taxi Medallion Portfolio
– Similar to Peers, NYC medallions are
valued under $400k
YTD 2017 Net Charge-Offs1
0
.0
5
%
0
.0
0
%
-0
.0
1
%
0
.1
0
%
0
.0
2
%
0
.3
0
%
1
.1
7
%
0
.4
5
%
1
.3
6
%
0
.7
0
%
-0.20%
0.30%
0.80%
1.30%
1.80%
CRE C&I 1-4 Family Consumer Total Loans
VLY $10B - $50B Peers
1.22%
0.23%
2013 2014 2015 2016 2017
Non-Performing Assets to Total Loans
1Peer group includes commercial and savings banks between $10 billion and $50 billion in assets at
December 31, 2016. Figures are YTD 2017 as of October 23, 2017 from SNL.
5

6
Gain on Sale of Loans
• Sustainable gain on sale of loans
• Purchase mortgages represent 66%
of originations
1Loan growth is the change from June 30, 2017 to September 30, 2017, annualized, excluding loans held for sale.
Highlights
Loan Growth
Quarter over Quarter Loan Growth1
4,823
12,307
4,128
4,791
5,520
0
2,000
4,000
6,000
8,000
10,000
12,000
14,000
Q3 2016 Q4 2016 Q1 2017 Q2 2017 Q3 2017
32%
11%
10%
6%
11%
0%
5%
10%
15%
20%
25%
30%
35%
Residential
Mortgage
Commercial &
Industrial
Consumer Commercial
Real Estate
Total Loans
• Growth across all lines of business
• Minimal impact expected from
Hurricane Irma

7
USAB: Key Milestones
Q3
2017
Q4
2017
Q1
2018
•Preferred Stock Issuance
•OCC & FRB Approval
•Shareholder Meeting
•Close of Acquisition
•Integration & Conversion

8
Investment in Scalable Growth
Non-Interest Expense
117.8 118.8
1.4
2.7
1.2
9.9
110.0
115.0
120.0
125.0
130.0
135.0
Q2 2017 Q3 2017
Base Expenses Residential Mortgage
USAB Merger LIFT
$119mm
$133mm
LIFT: Cumulative Impact
(millions)
Anticipated
Annualized
Q4 2017
LIFT Total
Annualized
Target
Compensation 7.8 14.1
Other Expenses 1.0 4.5
Revenue Enhancements 0.2 2.9
Total 9.0* 21.5
Residential Mortgage Investment
(millions) Gain on Sale Originations
Q3 2017 5.5 307
*4.9MM ahead of schedule

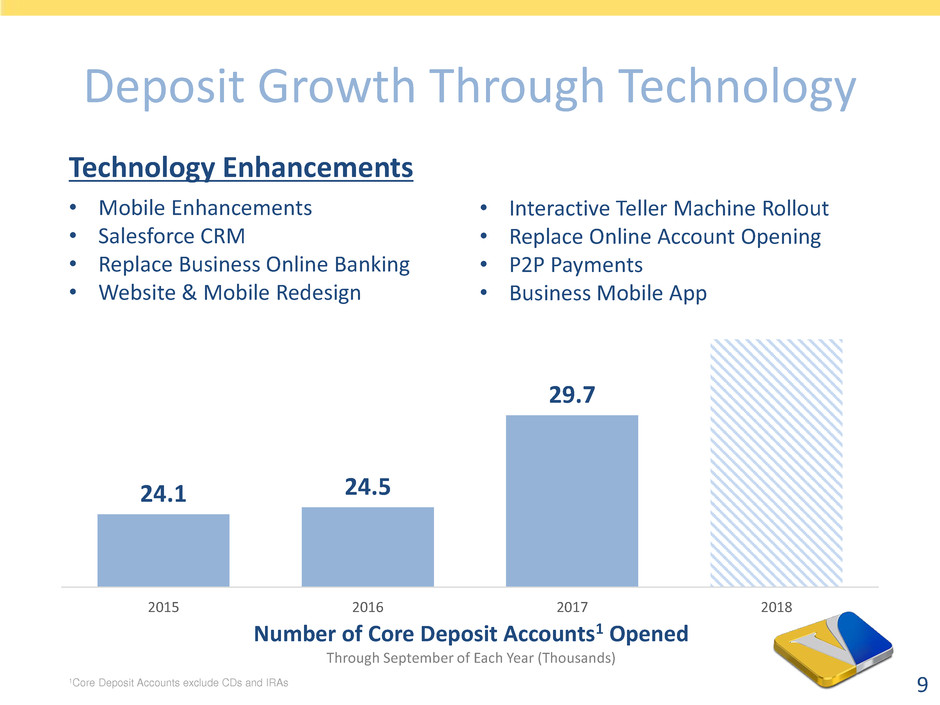
Deposit Growth Through Technology
24.1 24.5
29.7
2015 2016 2017 2018
Number of Core Deposit Accounts1 Opened
Through September of Each Year (Thousands)
Technology Enhancements
• Mobile Enhancements
• Salesforce CRM
• Replace Business Online Banking
• Website & Mobile Redesign
• Interactive Teller Machine Rollout
• Replace Online Account Opening
• P2P Payments
• Business Mobile App
1Core Deposit Accounts exclude CDs and IRAs 9

Non-GAAP Disclosure Reconciliations
Appendix
10

Non-GAAP Disclosure Reconciliations
11
Net Income
($ in thousands)
Q3 2017 Q3 2016
Net Income, as Reported $ 39,649 $ 42,842
Add: LIFT Program Expenses (net of tax) 5,753 -
Add: Merger related expenses (net of tax) 1,043 -
Net Income, as adjusted 46,445 42,842
Annualized Return on Average Assets
($ in thousands)
Q3 2017 Q3 2016
Net Income, as adjusted $ 46,445 $ 42,842
Average Assets 23,604,252 22,081,470
Annualized Return on Average Assets, as adjusted 0.79% 0.78%
Efficiency Ratio*
($ in thousands)
Q3 2017 Q3 2016
Non-interest expense $ 132,565 $ 113,268
Less: LIFT Program Expenses (pre-tax) 9,875 -
Less: Merger related expenses (pre-tax) 1,241 -
Less: Amortization of tax credit investments (pre-tax) 8,389 6,450
Non-interest expense, as adjusted 113,060 106,818
Net interest income 164,854 154,146
Non-interest income 26,088 24,853
Gross operating income 190,942 178,999
Efficiency Ratio, as adjusted 59.2% 59.7%
Efficiency Ratio, unadjusted 69.4% 63.3%
*The efficiency ratio measures Valley’s total non-interest expense as a percentage of net interest income plus non-interest income.

For More Information
Log onto our web site: www.valleynationalbank.com
E-mail requests to: tzarkadas@valleynationalbank.com
Call Shareholder Relations at: (973) 305-3380
Write to: Valley National Bank
1455 Valley Road
Wayne, New Jersey 07470
Attn: Tina Zarkadas, Shareholder Relations Specialist
Log onto our website above or www.sec.gov to obtain free copies of documents
filed by Valley with the SEC
12
