Attached files
| file | filename |
|---|---|
| EX-99.1 - EX-99.1 - JUNIPER NETWORKS INC | d482009dex991.htm |
| 8-K - 8-K - JUNIPER NETWORKS INC | d482009d8k.htm |
Exhibit 99.2

Juniper Networks, Inc.
1133 Innovation Way
Sunnyvale, CA 94089
October 24, 2017
CFO Commentary on Third Quarter 2017 Preliminary Financial Results
Related Information
The following commentary is provided by management and should be referenced in conjunction with Juniper Networks’ third quarter 2017 preliminary financial results press release available on its Investor Relations website at http://investor.juniper.net. These remarks represent management’s current views of the Company’s financial and operational performance and outlook and are provided to give investors and analysts further insight into the Company’s performance in advance of the earnings call webcast.
Q3 2017 Preliminary Financial Results
GAAP
| (in millions, except per share amounts and percentages) |
Q3’17 | Q2’17 | Q3’16 | Q/Q Change | Y/Y Change | |||||||||||||||
| Revenue |
$ | 1,257.8 | $ | 1,308.9 | $ | 1,285.3 | (4 | )% | (2 | )% | ||||||||||
| Product |
869.7 | 917.2 | 928.2 | (5 | )% | (6 | )% | |||||||||||||
| Service |
388.1 | 391.7 | 357.1 | (1 | )% | 9 | % | |||||||||||||
| Gross margin % |
61.4 | % | 61.3 | % | 62.2 | % | 0.1 | pts | (0.8 | )pts | ||||||||||
| Research and development |
236.4 | 240.2 | 251.8 | (2 | )% | (6 | )% | |||||||||||||
| Sales and marketing |
232.5 | 239.9 | 242.9 | (3 | )% | (4 | )% | |||||||||||||
| General and administrative |
57.4 | 55.6 | 54.0 | 3 | % | 6 | % | |||||||||||||
| Restructuring charges |
2.0 | 8.0 | 0.8 | (75 | )% | 150 | % | |||||||||||||
|
|
|
|
|
|
|
|||||||||||||||
| Total operating expenses |
$ | 528.3 | $ | 543.7 | $ | 549.5 | (3 | )% | (4 | )% | ||||||||||
|
|
|
|
|
|
|
|||||||||||||||
| Operating margin % |
19.4 | % | 19.7 | % | 19.5 | % | (0.3 | )pts | (0.1 | )pts | ||||||||||
|
|
|
|
|
|
|
|||||||||||||||
| Net income |
$ | 174.4 | $ | 179.8 | $ | 172.4 | (3 | )% | 1 | % | ||||||||||
|
|
|
|
|
|
|
|||||||||||||||
| Diluted EPS |
$ | 0.46 | $ | 0.47 | $ | 0.45 | (2 | )% | 2 | % | ||||||||||
|
|
|
|
|
|
|
|||||||||||||||
Non-GAAP
| (in millions, except per share amounts and percentages) |
Q4’17 Guidance |
Q3’17 | Q2’17 | Q3’16 | Q/Q Change | Y/Y Change | ||||||||||||||||
| Revenue(1) |
$1,230 +/– $30 | $ | 1,257.8 | $ | 1,308.9 | $ | 1,285.3 | (4 | )% | (2 | )% | |||||||||||
| Product(1) |
869.7 | 917.2 | 928.2 | (5 | )% | (6 | )% | |||||||||||||||
| Service(1) |
388.1 | 391.7 | 357.1 | (1 | )% | 9 | % | |||||||||||||||
| Gross margin % |
62.0% +/– 0.5% | 62.0 | % | 62.0 | % | 62.9 | % | — | pts | (0.9 | )pts | |||||||||||
| Research and development |
217.9 | 225.6 | 224.5 | (3 | )% | (3 | )% | |||||||||||||||
| Sales and marketing |
217.7 | 222.2 | 224.5 | (2 | )% | (3 | )% | |||||||||||||||
| General and administrative |
48.4 | 48.0 | 44.8 | 1 | % | 8 | % | |||||||||||||||
|
|
|
|
|
|
|
|||||||||||||||||
| Total operating expenses |
$485 +/– $5 | $ | 484.0 | $ | 495.8 | $ | 493.8 | (2 | )% | (2 | )% | |||||||||||
|
|
|
|
|
|
|
|||||||||||||||||
| Operating margin % |
~22.6% at the midpoint | 23.5 | % | 24.2 | % | 24.4 | % | (0.7 | )pts | (0.9 | )pts | |||||||||||
|
|
|
|
|
|
|
|||||||||||||||||
| Net income |
$ | 211.1 | $ | 220.5 | $ | 222.0 | (4 | )% | (5 | )% | ||||||||||||
|
|
|
|
|
|
|
|||||||||||||||||
| Diluted EPS |
$0.52 +/– $0.03 | $ | 0.55 | $ | 0.57 | $ | 0.58 | (4 | )% | (5 | )% | |||||||||||
|
|
|
|
|
|
|
|||||||||||||||||
| (1) | Revenue numbers are GAAP. |
This CFO Commentary contains non-GAAP financial measures, and the reconciliation between GAAP and non-GAAP financial measures can be found at the end of this document. We are unable to provide a reconciliation of forward-looking non-GAAP guidance measures to corresponding GAAP measures without unreasonable effort due to the overall high variability and low visibility of most of the items that are excluded from our non-GAAP guidance measures. More information on these exclusions can be found under “Q4 2017 Outlook” below.
Q3 2017 Overview
The financial results for the September quarter were disappointing, with revenue and non-GAAP EPS falling below our expectations. From a revenue perspective, the lower than expected result was primarily due to the timing of certain large switching deployments within the Cloud vertical, related to architectural shifts.
Total revenue for the third quarter was $1,258 million down 4% sequentially and 2% year-over-year.
Routing grew sequentially but declined year-over-year due to the timing of Telecom / Cable deployments. Switching declined both year-over-year and sequentially, primarily due to the timing of certain large customer deployments. Security grew sequentially for the second consecutive quarter. Service revenue continued to be solid, growing 9% year-over-year.
In reviewing our top 10 customers for the quarter, five were Cloud, four were Telecom / Cable, and one was Strategic Enterprise. Of these customers, one was located outside of the U.S.
Product deferred revenue was $324 million, up $26 million or 9% both year-over-year and sequentially.
Non-GAAP operating expenses declined 2% year-over-year and sequentially, reflecting our continued disciplined focus on managing expenses through increased efficiencies and focus on operational excellence. Operating expenses were 38.5% of revenue in the third quarter.
Cash flows from operations was $202 million for the quarter bringing our year-to-date total to slightly over a billion dollars. During the quarter, we repurchased $140 million of shares and paid $38 million in dividends.
Revenue
Product & Service
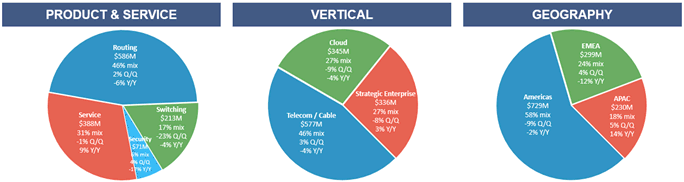
| • | Routing product revenue: $586 million, down 6% year-over-year and up 2% sequentially. The year-over-year decrease was primarily due to Telecom / Cable. The sequential increase was driven by Telecom / Cable and Cloud, partially offset by Strategic Enterprise. Our PTX family saw a record revenue quarter, with strong year-over-year and sequential growth, while MX declined year-over-year and sequentially. |
| • | Switching product revenue: $213 million, down 4% year-over-year and 23% sequentially. Year-over-year, Cloud and Telecom / Cable decreased, partially offset by Strategic Enterprise. Sequentially the decrease was primarily driven by the timing of certain large deployments within our Cloud vertical. Our QFX family of products continued to grow year-over-year but declined sequentially due to the timing of deployments. Our EX product family declined year-over-year and sequentially. |
| • | Security product revenue: $71 million, down 17% year-over-year and up 4% sequentially. Year-over-year, the decrease was primarily due to Cloud. The sequential increase was driven by Telecom / Cable, partially offset by a decline in Strategic Enterprise. |
| • | Service revenue: $388 million, up 9% year-over-year and down 1% sequentially. Year-over-year, the increase was driven by strong demand for professional services and strong renewal and attach rates of support contracts. Sequentially, the decrease was primarily due to the timing of professional services projects. |
Vertical
| • | Cloud: $345 million, down 4% year-over-year and down 9% sequentially. Year-over-year, the decrease was due to Security and Switching, partially offset by Services. The sequential decrease was primarily due to Switching, primarily driven by timing of certain large deployments, and partially offset by an increase in Routing. |
| • | Telecom / Cable: $577 million, down 4% year-over-year and up 3% sequentially. Year-over-year, the decrease was primarily due to Routing, partially offset by an increase in Services. Sequentially, the increase was primarily driven by Routing, partially offset by a decrease in Switching. |
| • | Strategic Enterprise: $336 million, up 3% year-over-year and down 8% sequentially. Year-over-year, the increase was primarily driven by higher Switching. The sequential decrease was primarily driven by Routing and Switching. |
Geography
| • | Americas: $729 million, down 2% year-over-year and down 9% sequentially. Year-over-year, the decrease was due to Telecom / Cable partially offset by Cloud. Sequentially, the decrease was primarily due to Cloud and Telecom / Cable. |
| • | EMEA: $299 million, down 12% year-over-year and up 4% sequentially. Year-over-year, the decline was primarily due to Telecom / Cable and Cloud. Sequentially, the increase was driven by Telecom/ Cable, partially offset by a decrease in Strategic Enterprise. The year-over-year decline was primarily in Germany and Netherlands. The sequential increase was primarily due to Germany and Ireland. |
| • | APAC: $230 million, up 14% year-over-year and up 5% sequentially. Year-over-year, the increase was driven primarily by Telecom / Cable, partially offset by Cloud. The sequential increase was driven by Telecom / Cable, partially offset by Strategic Enterprise. The year-over-year increase was primarily driven by Australia. The sequential increase was primarily driven by Japan. |
Gross Margin
| • | GAAP gross margin: 61.4%, compared to 62.2% from the prior year and 61.3% from last quarter. |
| • | Non-GAAP gross margin: 62.0%, compared to 62.9% from the prior year and 62.0% from last quarter. |
Non-GAAP gross margin was within our guided range for the quarter. We remain focused on delivering innovation and continued improvements to our cost structure.
| • | GAAP product gross margin: 61.4%, down 0.9 points from the prior year and up 0.7 points from last quarter. |
| • | Non-GAAP product gross margin: 61.8%, down 1.1 points from the prior year and up 0.6 points from last quarter. |
Year-over-year, the decrease in product gross margin, on a GAAP and non-GAAP basis, was primarily due to customer mix, higher costs of certain memory components and lower revenue, partially offset by improvements in our cost structure.
The sequential increase, on a GAAP and non-GAAP basis, was primarily driven by product mix, partially offset by lower revenue.
| • | GAAP service gross margin: 61.5%, down 0.4 points from the prior year and down 1.0 points from last quarter. |
| • | Non-GAAP service gross margin: 62.5%, down 0.3 points from the prior year and down 1.5 points from last quarter. |
Year-over-year and sequentially, the decrease in service gross margin, on a GAAP and non-GAAP basis, was primarily due to spare parts in support of expansion of our installed base and higher delivery costs related to growth in emerging markets.
Operating Expenses
| • | GAAP operating expenses: $528 million, a decrease of $21 million, or 4% year-over-year, and a decrease of $15 million, or 3% sequentially. |
The year-over-year decrease in operating expenses was primarily due to lower share-based compensation, lower headcount related costs and lower variable compensation. The sequential decrease was primarily due to lower restructuring charges and lower headcount related costs.
GAAP operating expenses were 42.0% of revenue, down 0.8 points year-over-year and up 0.5 points quarter-over-quarter.
| • | Non-GAAP operating expenses: $484 million, a decrease of $10 million, or 2% year-over-year, and a decrease of $12 million or 2% sequentially. |
The year-over-year decrease in operating expenses was primarily due to lower headcount related costs and lower variable compensation.
The sequential decrease in operating expenses was primarily due to lower headcount related costs and continued cost discipline.
Non-GAAP operating expenses were 38.5% of revenue, up 0.1 points year-over-year and up 0.6 points quarter-over-quarter, primarily due to lower revenue.
Operating Margin
| • | GAAP operating margin: 19.4%, a decrease of 0.1 points year-over-year and 0.3 points sequentially. |
| • | Non-GAAP operating margin: 23.5%, a decrease of 0.9 points year-over-year and 0.7 points sequentially. |
Tax Rate
| • | GAAP tax rate: 27.0%, an increase of 0.3 points compared to 26.7% last quarter. |
The sequential increase in the effective tax rate, on a GAAP basis, was primarily due to a lower benefit from discrete items.
| • | Non-GAAP tax rate: 26.5%, a decrease of 0.8 points compared to 27.3% last quarter. |
The sequential decrease in the effective tax rate, on a Non-GAAP basis, was primarily due to a change in the geographic mix of earnings.
Diluted Earnings Per Share
| • | GAAP diluted earnings per share: $0.46, an increase of $0.01 year-over-year and a decrease of $0.01 sequentially. |
The year-over-year increase was due to lower operating expenses, partially offset by lower revenue and lower gross margin. The sequential decrease was primarily due to lower revenue, partially offset by lower operating and other expenses.
| • | Non-GAAP diluted earnings per share: $0.55, a decrease of $0.03 year-over-year and a decrease of $0.02 sequentially. |
The year-over-year decrease was primarily due to lower revenue and lower gross margin partially offset by lower operating expenses. The sequential decrease was primarily due to lower revenue, partially offset by lower operating and other expenses.
Balance Sheet, Cash Flow, Capital Return, and Other Financial Metrics
| (in millions, except days sales outstanding (“DSO”), and headcount) |
Q3’17 | Q2’17 | Q1’17 | Q4’16 | Q3’16 | |||||||||||||||
| Cash(1, 2) |
$ | 4,199.3 | $ | 4,214.6 | $ | 4,043.7 | $ | 3,657.3 | $ | 3,480.1 | ||||||||||
| Debt |
2,135.7 | 2,135.0 | 2,134.4 | 2,133.7 | 2,133.1 | |||||||||||||||
| Net cash and investments(3) |
2,063.6 | 2,079.6 | 1,909.3 | 1,523.6 | 1,347.0 | |||||||||||||||
| Operating cash flow(4) |
201.9 | 298.7 | 545.3 | 336.4 | 244.8 | |||||||||||||||
| Capital expenditures |
33.3 | 32.2 | 32.1 | 51.8 | 46.0 | |||||||||||||||
| Depreciation and amortization |
56.3 | 54.8 | 54.2 | 53.9 | 52.2 | |||||||||||||||
| Share repurchases |
140.0 | 125.0 | 125.0 | — | 112.4 | |||||||||||||||
| Dividends |
$ | 37.7 | $ | 37.8 | $ | 38.0 | $ | 38.1 | $ | 38.0 | ||||||||||
| Diluted shares |
382.7 | 385.6 | 388.0 | 385.6 | 384.5 | |||||||||||||||
| DSO |
52 | 52 | 49 | 68 | 53 | |||||||||||||||
| Headcount(5) |
9,694 | 9,661 | 9,694 | 9,832 | 9,863 | |||||||||||||||
| (1) | Includes cash, cash equivalents, and investments. |
| (2) | 16% held onshore as of the end of Q3’17. |
| (3) | Net cash and investments includes, cash, cash equivalents, and investments, net of debt. |
| (4) | In Q1’17, we adopted the new accounting pronouncement on Improvements to Employee Share-Based Payment Accounting, requiring excess tax benefits to be presented as an operating activity in our consolidated statements of cash flows. We applied this provision on a retrospective basis, resulting in the reclassification of certain excess tax benefits from share-based compensation to operating activities from financing activities. |
| (5) | Q2’17 and Q1’17 excludes headcount impacted by restructuring activities. |
Cash Flow
| • | Cash flow from operations: $202 million, down $43 million year-over-year and $97 million sequentially. |
The year-over-year decrease was primarily due to timing differences in working capital related to customer collections and taxes. The sequential decrease was primarily due to timing differences in working capital related to variable compensation and taxes.
Days Sales Outstanding
| • | DSO: 52 days, flat from the prior quarter. |
Capital Return
| • | In the quarter, we repurchased $140 million of shares and paid a dividend of $0.10 per share for a total of $38 million. |
| • | Diluted shares decreased by approximately 2 million shares year-over-year and approximately 3 million shares sequentially. |
Demand metrics
| • | Total deferred revenue was $1,463 million, up $159 million year-over-year and down $38 million quarter-over-quarter. |
| • | Product deferred revenue was $324 million, an increase of $26 million both year-over-year and quarter-over-quarter. |
Headcount
| • | Ending headcount was 9,694 a decrease of 169 employees year-over-year and an increase of 33 employees sequentially. The year-over-year decrease was primarily related to the restructuring of headcount partially offset by an increase in Services employees and employees acquired through acquisitions. |
Outlook
These metrics are provided on a non-GAAP basis, except for revenue and share count. Earnings per share is on a fully diluted basis. The outlook assumes that the exchange rate of the U.S. dollar to other currencies will remain relatively stable at current levels.
As we have discussed in the past, elements of our addressable markets are dynamic and particularly within the Cloud vertical, change can occur rapidly.
Our Q4 revenue outlook reflects continued large deployment timing delays as we expect our large customers to continue their architectural transition. This architectural transition is related to the evolution of these customers’ networks to be more modern, cost efficient, and scalable. Despite this outlook, we remain confident in our competitive position and strong relationships with these strategic customers.
We expect gross margins for the quarter, to remain at current levels.
We expect to continue managing our operating expenses prudently and to increase operational efficiencies.
We initiated a realignment of our workforce in Q4’17, as we continue to prioritize our investments in the most critical areas of our business.
We are committed to returning approximately 50% of our free cash flow and expect to be opportunistic with our share repurchases.
Despite the disappointing full year outlook, we are confident in our strategy and remain committed to our long-term financial principles of driving revenue growth, earnings expansion, and an optimized capital structure.
Our guidance for the quarter ending December 31, 2017, is as follows:
| • | Revenues will be approximately $1,230 million, plus or minus $30 million. |
| • | Non-GAAP gross margin will be approximately 62.0%, plus or minus 0.5%. |
| • | Non-GAAP operating expenses will be approximately $485 million, plus or minus $5 million. |
| • | Non-GAAP operating margin will be approximately 22.6% at the midpoint of revenue guidance. |
| • | Non-GAAP tax rate will be approximately 26.5%. |
| • | Non-GAAP net income per share will be approximately $0.52, plus or minus $0.03. This assumes a share count of approximately 380 million. |
Forward-Looking Statements
Statements in this CFO Commentary and related conference call concerning Juniper Networks’ business, economic and market outlook, including pricing pressure and product mix; factors that impact our gross margin; our long-term financial model and strategy; the architectural transition of our large customers and resulting impact on the timing of deployments; our product portfolio and success of particular products and product families; our success in obtaining revenue growth; the timing of deployments by our customers; our future financial and operating results, including our financial guidance; our areas of focus and our ability to deliver on growth, operational expense discipline, and shareholder returns; improvements to our cost structure and expense reductions and management, including timing and ability to execute on our restructuring; strength of certain of our customer segments; our capital structure; our capital return program, and our overall future prospects are forward looking statements within the meaning of the Private Securities Litigation Reform Act that involve a number of uncertainties and risks. Actual results or events could differ materially from those anticipated in those forward-looking statements as a result of several factors, including: general economic and political conditions globally or regionally; business and economic conditions in the networking industry; changes in overall technology spending by our customers and spending by communication service providers and major customers, including Cloud providers; the network capacity requirements of our customers and, in particular, cloud and telecommunication service providers; contractual terms that may result in the deferral of revenue; increases in and the effect of competition; the timing of orders and their fulfillment; manufacturing and supply chain constraints, changes or disruptions; availability of key product components; ability to establish and maintain relationships with distributors, resellers and other partners; variations in the expected mix of products sold; changes in customer mix; changes in geography mix; customer and industry analyst perceptions of Juniper Networks and its technology, products and future prospects; delays in scheduled product availability; market acceptance of Juniper Networks products and services; rapid technological and market change; adoption of regulations or standards affecting Juniper Networks products, services or the networking industry; the ability to successfully acquire, integrate and manage businesses and technologies; product defects, returns or vulnerabilities; the ability to recruit and retain key personnel; significant effects of tax legislation and judicial or administrative interpretation of tax regulations; currency fluctuations; litigation settlements and resolutions; the potential impact of activities related to the execution of capital return, restructurings and product rationalization; and other factors listed in Juniper Networks’ most recent report on Form 10-K or 10-Q filed with the Securities and Exchange Commission (”SEC”). All statements made in this CFO Commentary and related conference call are made only as of the date set forth at the beginning of this document. Juniper Networks undertakes no obligation to update the information made in this document or the related conference call in the event facts or circumstances subsequently change after the date of this document.
Use of Non-GAAP Financial Measures
This CFO Commentary contains references to the following non-GAAP financial measures: gross margin; product gross margin; service gross margin; product gross margin as a percentage of product revenue; service gross margin as a percentage of service revenue; gross margin as a percentage of revenue; research and development expense; sales and marketing expense; general and administrative expense; operating expense; operating expense as a percentage of revenue; operating income; operating margin; provision for income tax; income tax rate; net income; and diluted earnings per share. For important commentary on why Juniper Networks considers non-GAAP information a useful view of the company’s financial results, please see the press release furnished with our Form 8-K filed today with the SEC. With respect to future financial guidance provided on a non-GAAP basis, we have excluded estimates for amortization of intangible assets, share-based compensation expenses, acquisition-related charges, restructuring charges, impairment charges, litigation settlement and resolution charges, gain or loss on
equity investments, retroactive impact of certain tax settlements, non-recurring income tax adjustments, valuation allowance on deferred tax assets, and the income tax effect of non-GAAP exclusions, and do not include the impact of any future acquisitions, divestitures, or joint ventures that may occur in the quarter. These measures are not presented in accordance with, nor are they a substitute for U.S. generally accepted accounting principles or GAAP. In addition, these measures may be different from non-GAAP measures used by other companies, limiting their usefulness for comparison purposes. The non-GAAP financial measures used in this CFO Commentary should not be considered in isolation from measures of financial performance prepared in accordance with GAAP. Investors are cautioned that there are material limitations associated with the use of non-GAAP financial measures as an analytical tool. In particular, many of the adjustments to our GAAP financial measures reflect the exclusion of items that are recurring and will be reflected in our financial results for the foreseeable future.
A reconciliation of non-GAAP guidance measures to corresponding GAAP measures is not available on a forward-looking basis due to the high variability and low visibility with respect to the charges which are excluded from these non-GAAP measures. For example, share-based compensation expense is impacted by the Company’s future hiring needs, and restructuring actions, the type and volume of equity awards necessary for such future hiring, and the price at which the Company’s stock will trade in those future periods. Amortization of intangible assets is significantly impacted by the timing and size of any future acquisitions. The items that are being excluded are difficult to predict and a reconciliation could result in disclosure that would be imprecise or potentially misleading. Material changes to any one of these items could have a significant effect on our guidance and future GAAP results. Certain exclusions, such as amortization of intangible assets and share-based compensation expenses, are generally incurred each quarter, but the amounts have historically and may continue to vary significantly from quarter to quarter.
Juniper Networks, Inc.
Preliminary Supplemental Data
(in millions, except percentages)
(unaudited)
Deferred Revenue
| As of | ||||||||
| September 30, 2017 |
December 31, 2016 |
|||||||
| Deferred product revenue: |
||||||||
| Undelivered product commitments and other product deferrals |
$ | 309.3 | $ | 302.4 | ||||
| Distributor inventory and other sell-through items |
61.9 | 74.2 | ||||||
|
|
|
|
|
|||||
| Deferred gross product revenue |
371.2 | 376.6 | ||||||
| Deferred cost of product revenue |
(47.5 | ) | (53.7 | ) | ||||
|
|
|
|
|
|||||
| Deferred product revenue, net |
323.7 | 322.9 | ||||||
| Deferred service revenue |
1,139.2 | 1,158.2 | ||||||
|
|
|
|
|
|||||
| Total |
$ | 1,462.9 | $ | 1,481.1 | ||||
|
|
|
|
|
|||||
| Reported as: |
||||||||
| Current |
$ | 977.4 | $ | 1,032.0 | ||||
| Long-term |
485.5 | 449.1 | ||||||
|
|
|
|
|
|||||
| Total |
$ | 1,462.9 | $ | 1,481.1 | ||||
|
|
|
|
|
|||||
Vertical Reporting: Quarterly Revenue Trend
| FY 2015 | FY 2016 | Q3’16 | Q4’16 | Q1’17 | Q2’17 | Q3’17 | Q/Q Change | Y/Y Change | ||||||||||||||||||||||||||||||||||||
| Cloud |
$ | 1,021.2 | $ | 1,322.3 | $ | 359.4 | $ | 410.8 | $ | 331.6 | $ | 379.6 | $ | 344.9 | $ | (34.7 | ) | (9)% | $ | (14.5 | ) | (4)% | ||||||||||||||||||||||
| Telecom / Cable |
2,417.1 | 2,324.7 | 599.4 | 636.2 | 568.5 | 562.4 | 576.9 | 14.5 | 3% | (22.5) | (4)% | |||||||||||||||||||||||||||||||||
| Strategic Enterprise |
1,419.5 | 1,343.1 | 326.5 | 338.6 | 320.9 | 366.9 | 336.0 | (30.9) | (8)% | 9.5 | 3% | |||||||||||||||||||||||||||||||||
|
|
|
|
|
|
|
|
|
|
|
|
|
|
|
|
|
|
|
|
|
|
|
|||||||||||||||||||||||
| Total revenue |
$ | 4,857.8 | $ | 4,990.1 | $ | 1,285.3 | $ | 1,385.6 | $ | 1,221.0 | $ | 1,308.9 | $ | 1,257.8 | $ | (51.1) | (4)% | $ | (27.5) | (2)% | ||||||||||||||||||||||||
|
|
|
|
|
|
|
|
|
|
|
|
|
|
|
|
|
|
|
|
|
|
|
|||||||||||||||||||||||
Juniper Networks, Inc.
Preliminary Reconciliations between GAAP and non-GAAP Financial Measures
(in millions, except percentages and per share amounts)
(unaudited)
| Three Months Ended | ||||||||||||
| September 30, 2017 | June 30, 2017 | September 30, 2016 | ||||||||||
| GAAP gross margin – Product |
$ | 533.7 | $ | 557.0 | $ | 578.6 | ||||||
| GAAP product gross margin % of product revenue |
61.4 | % | 60.7 | % | 62.3 | % | ||||||
| Share-based compensation expense |
1.5 | 1.4 | 1.5 | |||||||||
| Amortization of purchased intangible assets |
3.1 | 3.1 | 3.5 | |||||||||
| Supplier component remediation recovery |
(1.0 | ) | — | — | ||||||||
|
|
|
|
|
|
|
|||||||
| Non-GAAP gross margin – Product |
$ | 537.3 | $ | 561.5 | $ | 583.6 | ||||||
|
|
|
|
|
|
|
|||||||
| Non-GAAP product gross margin % of product revenue |
61.8 | % | 61.2 | % | 62.9 | % | ||||||
| GAAP gross margin – Service |
$ | 238.7 | $ | 244.9 | $ | 220.9 | ||||||
| GAAP service gross margin % of service revenue |
61.5 | % | 62.5 | % | 61.9 | % | ||||||
| Share-based compensation expense |
3.9 | 5.3 | 3.5 | |||||||||
| Share-based payroll tax expense |
— | 0.3 | — | |||||||||
|
|
|
|
|
|
|
|||||||
| Non-GAAP gross margin – Service |
$ | 242.6 | $ | 250.5 | $ | 224.4 | ||||||
|
|
|
|
|
|
|
|||||||
| Non-GAAP service gross margin % of service revenue |
62.5 | % | 64.0 | % | 62.8 | % | ||||||
| GAAP gross margin |
$ | 772.4 | $ | 801.9 | $ | 799.5 | ||||||
| GAAP gross margin % of revenue |
61.4 | % | 61.3 | % | 62.2 | % | ||||||
| Share-based compensation expense |
5.4 | 6.7 | 5.0 | |||||||||
| Share-based payroll tax expense |
— | 0.3 | — | |||||||||
| Amortization of purchased intangible assets |
3.1 | 3.1 | 3.5 | |||||||||
| Supplier component remediation recovery |
(1.0 | ) | — | — | ||||||||
|
|
|
|
|
|
|
|||||||
| Non-GAAP gross margin |
$ | 779.9 | $ | 812.0 | $ | 808.0 | ||||||
|
|
|
|
|
|
|
|||||||
| Non-GAAP gross margin % of revenue |
62.0 | % | 62.0 | % | 62.9 | % | ||||||
| GAAP research and development expense |
$ | 236.4 | $ | 240.2 | $ | 251.8 | ||||||
| Share-based compensation expense |
(18.5 | ) | (14.1 | ) | (27.2 | ) | ||||||
| Share-based payroll tax expense |
— | (0.5 | ) | (0.1 | ) | |||||||
|
|
|
|
|
|
|
|||||||
| Non-GAAP research and development expense |
$ | 217.9 | $ | 225.6 | $ | 224.5 | ||||||
|
|
|
|
|
|
|
|||||||
| GAAP sales and marketing expense |
$ | 232.5 | $ | 239.9 | $ | 242.9 | ||||||
| Share-based compensation expense |
(13.7 | ) | (16.3 | ) | (17.5 | ) | ||||||
| Share-based payroll tax expense |
(0.2 | ) | (0.5 | ) | (0.1 | ) | ||||||
| Amortization of purchased intangible assets |
(0.9 | ) | (0.9 | ) | (0.8 | ) | ||||||
|
|
|
|
|
|
|
|||||||
| Non-GAAP sales and marketing expense |
$ | 217.7 | $ | 222.2 | $ | 224.5 | ||||||
|
|
|
|
|
|
|
|||||||
| GAAP general and administrative expense |
$ | 57.4 | $ | 55.6 | $ | 54.0 | ||||||
| Share-based compensation expense |
(7.4 | ) | (7.0 | ) | (5.9 | ) | ||||||
| Share-based payroll tax expense |
(0.1 | ) | (0.4 | ) | — | |||||||
| Amortization of purchased intangible assets |
(0.1 | ) | (0.2 | ) | (0.5 | ) | ||||||
| Acquisition-related charges |
(1.4 | ) | — | (2.8 | ) | |||||||
|
|
|
|
|
|
|
|||||||
| Non-GAAP general and administrative expense |
$ | 48.4 | $ | 48.0 | $ | 44.8 | ||||||
|
|
|
|
|
|
|
|||||||
Juniper Networks, Inc.
Preliminary Reconciliations between GAAP and non-GAAP Financial Measures
(in millions, except percentages and per share amounts)
(unaudited)
| Three Months Ended | ||||||||||||
| September 30, 2017 | June 30, 2017 | September 30, 2016 | ||||||||||
| GAAP operating expenses |
$ | 528.3 | $ | 543.7 | $ | 549.5 | ||||||
| GAAP operating expenses % of revenue |
42.0 | % | 41.5 | % | 42.8 | % | ||||||
| Share-based compensation expense |
(39.6 | ) | (37.4 | ) | (50.6 | ) | ||||||
| Share-based payroll tax expense |
(0.3 | ) | (1.4 | ) | (0.2 | ) | ||||||
| Amortization of purchased intangible assets |
(1.0 | ) | (1.1 | ) | (1.3 | ) | ||||||
| Restructuring charges |
(2.0 | ) | (8.0 | ) | (0.8 | ) | ||||||
| Acquisition-related charges |
(1.4 | ) | — | (2.8 | ) | |||||||
|
|
|
|
|
|
|
|||||||
| Non-GAAP operating expenses |
$ | 484.0 | $ | 495.8 | $ | 493.8 | ||||||
|
|
|
|
|
|
|
|||||||
| Non-GAAP operating expenses % of revenue |
38.5 | % | 37.9 | % | 38.4 | % | ||||||
| GAAP operating income |
$ | 244.1 | $ | 258.2 | $ | 250.0 | ||||||
| GAAP operating margin |
19.4 | % | 19.7 | % | 19.5 | % | ||||||
| Share-based compensation expense |
45.0 | 44.1 | 55.6 | |||||||||
| Share-based payroll tax expense |
0.3 | 1.7 | 0.2 | |||||||||
| Amortization of purchased intangible assets |
4.1 | 4.2 | 4.8 | |||||||||
| Restructuring charges |
2.0 | 8.0 | 0.8 | |||||||||
| Acquisition-related charges |
1.4 | — | 2.8 | |||||||||
| Supplier component remediation recovery |
(1.0 | ) | — | — | ||||||||
|
|
|
|
|
|
|
|||||||
| Non-GAAP operating income |
$ | 295.9 | $ | 316.2 | $ | 314.2 | ||||||
|
|
|
|
|
|
|
|||||||
| Non-GAAP operating margin |
23.5 | % | 24.2 | % | 24.4 | % | ||||||
| GAAP income tax provision |
$ | 64.6 | $ | 65.4 | $ | 64.2 | ||||||
| GAAP income tax rate |
27.0 | % | 26.7 | % | 27.1 | % | ||||||
| Income tax effect of non-GAAP exclusions |
11.5 | 17.3 | 14.9 | |||||||||
|
|
|
|
|
|
|
|||||||
| Non-GAAP provision for income tax |
$ | 76.1 | $ | 82.7 | $ | 79.1 | ||||||
|
|
|
|
|
|
|
|||||||
| Non-GAAP income tax rate |
26.5 | % | 27.3 | % | 26.3 | % | ||||||
| GAAP net income |
$ | 174.4 | $ | 179.8 | $ | 172.4 | ||||||
| Share-based compensation expense |
45.0 | 44.1 | 55.6 | |||||||||
| Share-based payroll tax expense |
0.3 | 1.7 | 0.2 | |||||||||
| Amortization of purchased intangible assets |
4.1 | 4.2 | 4.8 | |||||||||
| Restructuring charges |
2.0 | 8.0 | 0.8 | |||||||||
| Acquisition-related charges |
1.4 | — | 2.8 | |||||||||
| Supplier component remediation recovery |
(1.0 | ) | — | — | ||||||||
| (Gain) loss on equity investments |
(3.6 | ) | — | 0.3 | ||||||||
| Income tax effect of non-GAAP exclusions |
(11.5 | ) | (17.3 | ) | (14.9 | ) | ||||||
|
|
|
|
|
|
|
|||||||
| Non-GAAP net income |
$ | 211.1 | $ | 220.5 | $ | 222.0 | ||||||
|
|
|
|
|
|
|
|||||||
| GAAP diluted net income per share |
$ | 0.46 | $ | 0.47 | $ | 0.45 | ||||||
|
|
|
|
|
|
|
|||||||
| Non-GAAP diluted net income per share |
$ | 0.55 | $ | 0.57 | $ | 0.58 | ||||||
|
|
|
|
|
|
|
|||||||
| Shares used in computing diluted net income per share |
382.7 | 385.6 | 384.5 | |||||||||
|
|
|
|
|
|
|
|||||||