Attached files
| file | filename |
|---|---|
| 8-K - FB FINANCIAL CORP. 8-K - FB Financial Corp | a50713595.htm |
| EX-99.2 - EXHIBIT 99.2 - FB Financial Corp | a50713595ex99_2.htm |
| EX-99.1 - EXHIBIT 99.1 - FB Financial Corp | a50713595ex99_1.htm |
Exhibit 99.3

Third Quarter 2017 Earnings Presentation October 24, 2017

This presentation contains “forward-looking statements” made pursuant to the safe harbor provisions of the Private Securities Litigation Reform Act of 1995. All statements other than statements of historical fact are forward-looking statements. You can identify these forward-looking statements through the Company’s use of words such as “believes,” “anticipates,” “expects,” “may,” “will,” “assumes,” “should,” “predicts,” “could,” “would,” “intends,” “targets,” “estimates,” “projects,” “plans,” “potential” and other similar words and expressions of the future or otherwise regarding the outlook for the Company’s future business and financial performance and/or the performance of the banking and mortgage industry and economy in general and the Company’s acquisition of the Clayton Banks and the benefits, cost, and financial impact thereof. Investors are cautioned that any such forward-looking statements are not guarantees of future performance and involve known and unknown risks and uncertainties which may cause the actual results, performance or achievements of the Company to be materially different from the future results, performance or achievements expressed or implied by such forward-looking statements. Forward-looking statements are based on the information known to, and current beliefs and expectations of, the Company’s management and are subject to significant risks and uncertainties. Actual results may differ materially from those contemplated by such forward-looking statements. A number of factors could cause actual results to differ materially from those contemplated by the forward-looking statements in this news release including, without limitation, the risks and other factors set forth in the Company’s December 31, 2016 Form 10-K, filed with the SEC on March 31, 2017 under the captions “Cautionary note regarding forward-looking statements” and “Risk factors.” Many of these factors are beyond the Company’s ability to control or predict. The Company believes the forward-looking statements contained herein are reasonable; however, undue reliance should not be placed on any forward-looking statements, which are based on current expectations and speak only as of the date that they are made. The Company does not assume any obligation to update any forward-looking statements as a result of new information, future developments or otherwise, except as otherwise may be required by law. Forward looking statements

Use of non-GAAP financial measures This presentation contains certain financial measures that are not measures recognized under U.S. generally accepted accounting principles (GAAP) and therefore are considered non-GAAP financial measures. These non‐GAAP financial measures include, without limitation, pro forma core net income, pro forma core diluted earnings per share, core efficiency ratio (tax equivalent basis), banking segment core efficiency ratio (tax equivalent basis), mortgage segment core efficiency ratio (tax equivalent basis), pro forma core return on average assets and equity, and pro forma core total revenue. Each of these non-GAAP metrics excludes certain income and expense items that the Company’s management considers to be non‐core in nature. The Company refers to these non‐GAAP measures as core measures. This Earnings Release also presents tangible assets, tangible common equity, tangible book value per common share, tangible common equity to tangible assets, return on tangible common equity, pro forma return on average tangible common equity and pro forma core return on average tangible common equity. Each of these non-GAAP metrics excludes the impact of goodwill and other intangibles.The Company’s management uses these non-GAAP financial measures in their analysis of the Company’s performance, financial condition and the efficiency of its operations as management believes such measures facilitate period-to-period comparisons and provide meaningful indications of its operating performance as they eliminate both gains and charges that management views as non-recurring or not indicative of operating performance. Management believes that these non-GAAP financial measures provide a greater understanding of ongoing operations and enhance comparability of results with prior periods as well as demonstrating the effects of significant non-core gains and charges in the current and prior periods. The Company’s management also believes that investors find these non-GAAP financial measures useful as they assist investors in understanding our underlying operating performance and in the analysis of ongoing operating trends. In addition, because intangible assets such as goodwill and other intangibles, and the other items excluded each vary extensively from company to company, the Company believes that the presentation of this information allows investors to more easily compare the Company’s results to the results of other companies. However, the non-GAAP financial measures discussed herein should not be considered in isolation or as a substitute for the most directly comparable or other financial measures calculated in accordance with GAAP. Moreover, the manner in which we calculate the non-GAAP financial measures discussed herein may differ from that of other companies reporting measures with similar names. You should understand how such other banking organizations calculate their financial measures similar or with names similar to the non-GAAP financial measures we have discussed herein when comparing such non-GAAP financial measures. A reconciliation of these non-GAAP financial measures to the most directly comparable GAAP measures are provided on the appendix to this presentation.

Three months endedSeptember 30, 2017 Non-GAAP Core results1 Reported GAAP results Diluted earnings per share $0.60 $0.27 Net income ($ millions) $18.5 $8.4 Return on average assets 1.76% 0.80% Return on average equity 13.4% 6.1% Return on average tangible common equity 17.0% 7.7% Efficiency ratio 64.4% 85.0% 3Q 2017 Highlights Reported EPS of $0.27, including pre-tax merger charges of $15.7 millionClosed acquisition of the Clayton Banks effective July 31; system conversion expected before year-endLoans (HFI) grew to $3.11 billion, a 73.7% increase from 3Q 2016; excluding acquired loans (HFI), grew 16.7% annualized from 2Q 2017Total deposits grew to $3.72 billion, a 40.8% increase from 3Q 2016; excluding acquired deposits, grew 1.7% annualized from 2Q 2017Continued customer-focused balance sheet growth resulting in NIM (tax-equivalent) of 4.61%Banking segment core efficiency ratio1 improved to 56.2% in 3Q 2017, down from 60.4% in 2Q 2017Interest rate lock commitment (IRLC) volume was $2.00 billion for the quarter, up 10.0% from 3Q 2016 Key highlights Financial results 1 Core results are non-GAAP financial measures that adjust GAAP reported net income and other metrics for non-core income and expense items as outlined in the non-GAAP reconciliation calculations, using a combined marginal income tax rate of 39.225% excluding one-time items. See “Use of non-GAAP financial measures” and the Appendix hereto.
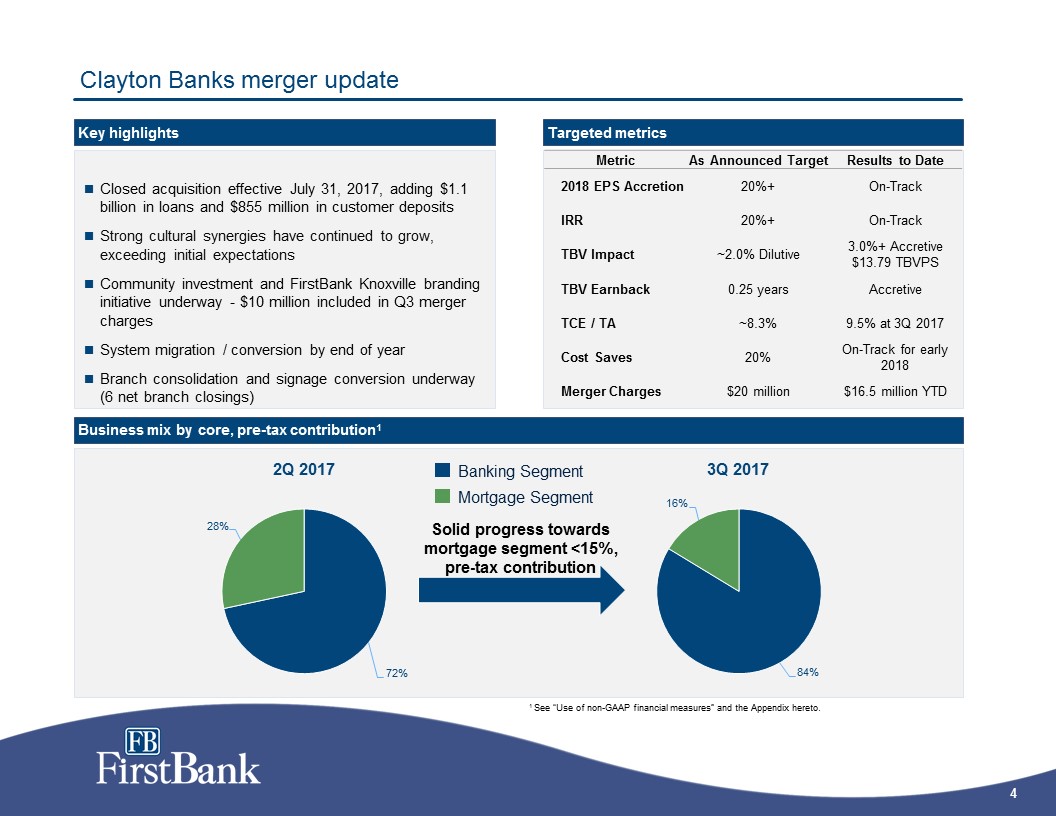
Clayton Banks merger update Closed acquisition effective July 31, 2017, adding $1.1 billion in loans and $855 million in customer depositsStrong cultural synergies have continued to grow, exceeding initial expectationsCommunity investment and FirstBank Knoxville branding initiative underway - $10 million included in Q3 merger chargesSystem migration / conversion by end of yearBranch consolidation and signage conversion underway (6 net branch closings) Key highlights Targeted metrics Metric As Announced Target Results to Date 2018 EPS Accretion 20%+ On-Track IRR 20%+ On-Track TBV Impact ~2.0% Dilutive 3.0%+ Accretive $13.79 TBVPS TBV Earnback 0.25 years Accretive TCE / TA ~8.3% 9.5% at 3Q 2017 Cost Saves 20% On-Track for early 2018 Merger Charges $20 million $16.5 million YTD Business mix by core, pre-tax contribution1 Solid progress towards mortgage segment <15%, pre-tax contribution Banking Segment Mortgage Segment 1 See “Use of non-GAAP financial measures” and the Appendix hereto.
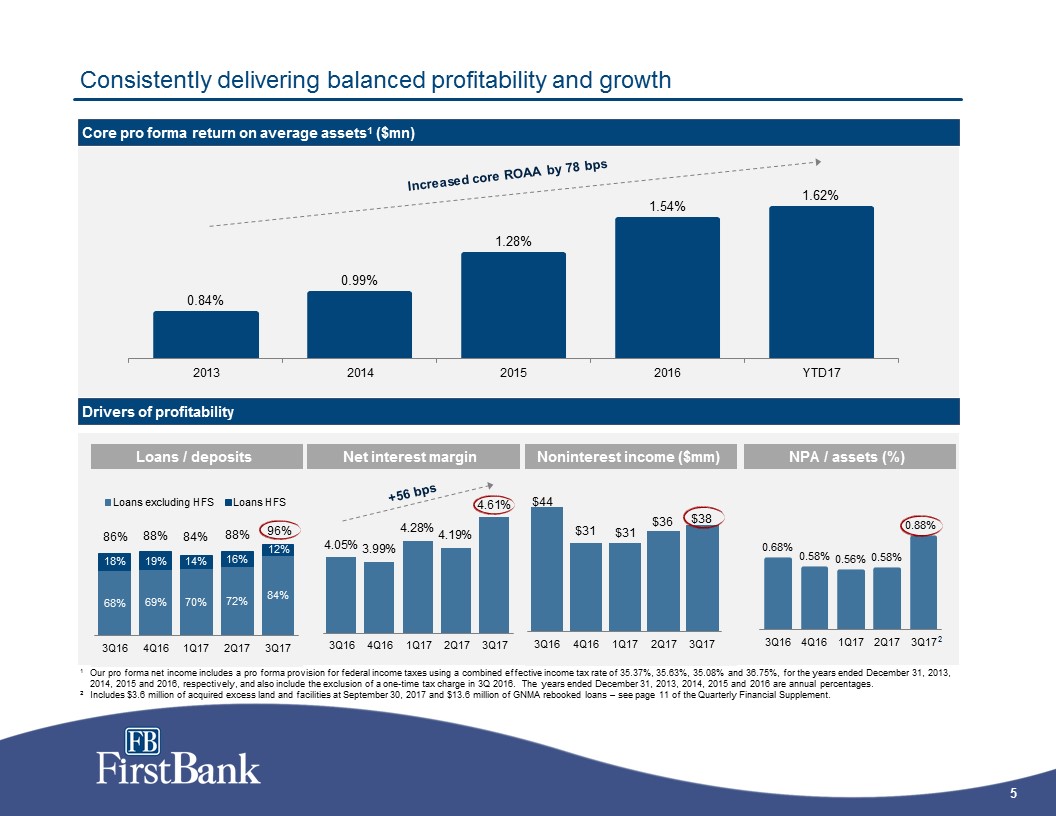
Consistently delivering balanced profitability and growth Drivers of profitability Core pro forma return on average assets1 ($mn) Net interest margin Noninterest income ($mm) Loans / deposits 1 Our pro forma net income includes a pro forma provision for federal income taxes using a combined effective income tax rate of 35.37%, 35.63%, 35.08% and 36.75%, for the years ended December 31, 2013, 2014, 2015 and 2016, respectively, and also include the exclusion of a one-time tax charge in 3Q 2016. The years ended December 31, 2013, 2014, 2015 and 2016 are annual percentages. 2 Includes $3.6 million of acquired excess land and facilities at September 30, 2017 and $13.6 million of GNMA rebooked loans – see page 11 of the Quarterly Financial Supplement. +56 bps NPA / assets (%) 2

Net interest margin remains strong Historical yield and costs 1 Includes tax-equivalent adjustment NIM (%) 4.05% 3.99% 4.28% 4.19% 4.61% NIM, ex-accretion and nonaccrual interest collections (%) 3.88% 3.90% 4.04% 4.03% 4.33% Deposit cost (%) 0.30% 0.29% 0.32% 0.34% 0.46% Loan (HFI) yield 3Q 2016 2Q 2017 3Q 2017 Contractual interest rate on loans HFI1 4.57% 4.63% 5.08% Origination and other loan fee income 0.52% 0.30% 0.38% 5.09% 4.93% 5.46% Nonaccrual interest collections 0.09% 0.07% 0.16% Accretion on purchased loans 0.19% 0.17% 0.23% Syndication fee income 0.00% 0.02% 0.05% Total loan yield (HFI) 5.37% 5.19% 5.90%

Consistent loan growth and balanced portfolio Total loan growth1 ($mn) and commercial real estate concentration Loan portfolio breakdown1 4Q 2012 3Q 2017 Total HFI loans: $3,115mn 1 Exclude HFS loans, C&I includes owner-occupied CRE2 Risk-based capital at bank level as defined in Call Report. 3Q 2017 calculation is preliminary and subject to change.3 Excludes owner-occupied CRE Commercial real estate (CRE) concentrations2 % of Risk-Based Capital 3Q 2016 3Q 2017(preliminary) C&D loans subject to 100% risk-based capital threshold3 69% 97% Total CRE loans subject to 300% risk-based capital threshold3 158% 229%

Stable, low cost core deposit franchise Total deposits ($mn) 1 Includes mortgage servicing-related escrow deposits of $64.3 million, $46.7 million, $43.7 million, $49.9 million and $56.8 million for the quarters ended September 30, 2016, December 31, 2016, March 31, 2017, June 30, 2017 and September 30, 2017, respectively. Noninterest bearing deposits ($mn)1 Growth: 27.3% y/y Deposit composition Cost of deposits Customer Deposit Growth: 37.0% y/yExcluding acquired Deposits: 4.6% y/y

$25.5 $23.9 $29.6 $7.8 $5.4 ($0.8) $3.7 $2.7 $3.5 $ -- ($1.8) ($0.9) $36.9 $30.2 $31.3 Mortgage Banking continues to execute Rebalanced mix through better channel distribution as Correspondent growth offsets refinancing decline primarily in Consumer DirectMortgage Banking income $31.3 million, up 3.6% from 2Q 2017IRLC volume of $2.00 billion during 3Q 2017 from $1.82 billion during 3Q 2016IRLC pipeline of $540.7 million at 3Q 2017Continuing to create operational leverage and refine efficiencies as business model develops, focusing on overall direct contribution 3Q 2017 Mortgage Highlights Note: Values by channel in $ are included on page 8 of the Quarterly Financial Supplement for IRLC volume, IRLC pipeline and Mortgage sales. Gain on Sale IRLC volume mix by purpose (%) IRLC volume by line of business (%) Consumer Direct Correspondent Third party originated Retail Retail footprint Refinance Purchase 3Q 2016 2Q 2017 3Q 2017 $1,819mn $2,158mn $2,001mn IRLC volume: IRLC pipeline: $851mn $547mn $541mn Fair value changes Fair value MSR change Mortgage banking income ($mn) Total Servicing Revenue

Improving operating leverage remains a key objective Consolidated 3Q 2017 core efficiency ratio of 64.4% driven by Banking Segment core efficiency ratio of 56.2%, meeting our target level of sub-60% Further realization of cost savings from Clayton Banks transaction will help efficiency ratio, expected to be fully phased-in in early 2018Bank’s investment in IT systems, including a new core system, created a scalable platform designed to drive and support growth across marketsContinuing to refine mortgage banking with operational efficiency improvements while maintaining contribution Core efficiency ratio (tax-equivalent basis)1 Improving operating efficiency 1 See “Use of non-GAAP financial measures” and the Appendix hereto.

Asset quality remains strong Classified & PCI loans ($mn) Net charge-offs / average loans Nonperforming ratios LLR / loans 1 Includes $3.6 million of acquired excess land and facilities at September 30, 2017 and $13.6 million of GNMA rebooked loans – see page 11 of the Quarterly Financial Supplement. 1

Strong capital position for future growth 1 Total regulatory capital. 3Q 2017 calculation is preliminary and subject to change.2 See “Use of non-GAAP financial measures” and the Appendix hereto. Capital position Total capital composition 3Q 2016 2Q 2017 3Q 20171 Shareholder’s equity / Assets 10.3% 15.2% 12.5% TCE / TA2 8.8% 13.9% 9.5% Common equity tier 1 / Risk-weighted assets 11.2% 17.2% 10.8% Tier 1 capital / Risk-weighted assets 12.4% 18.3% 11.6% Total capital / Risk-weighted assets 13.3% 19.1% 12.2% Tier 1 capital / Average assets 10.3% 15.5% 11.4% Simple capital structure

Appendix

GAAP reconciliation and use of non-GAAP financial measures Pro forma core net income

GAAP reconciliation and use of non-GAAP financial measures Tax-equivalent efficiency ratio (1) Efficiency ratio (GAAP) is calculated by dividing non-interest expense by total revenue

GAAP reconciliation and use of non-GAAP financial measures Segment tax-equivalent efficiency ratio
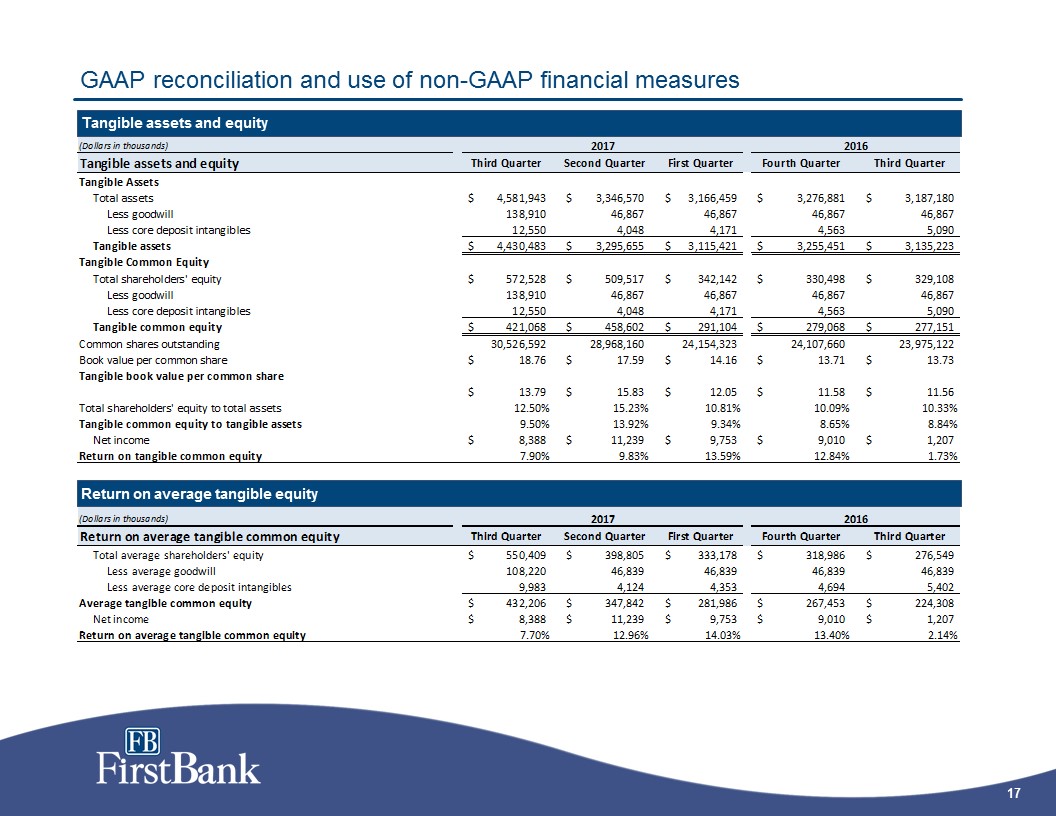
GAAP reconciliation and use of non-GAAP financial measures Tangible assets and equity Return on average tangible equity

GAAP reconciliation and use of non-GAAP financial measures Pro forma return on average tangible common equity Pro forma core return on average tangible equity Pro forma core return on average assets and equity

GAAP reconciliation and use of non-GAAP financial measures Pro forma core return on average assets and equity Pro forma core total revenue

GAAP reconciliation and use of non-GAAP financial measures Business mix by core, pre-tax contribution