Attached files
| file | filename |
|---|---|
| EX-99.1 - EX-99.1 - People's United Financial, Inc. | d479603dex991.htm |
| 8-K - 8-K - People's United Financial, Inc. | d479603d8k.htm |
 A Premium Brand Built Over 175 Years
3 Quarter 2017 Results October 19, 2017 Exhibit 99.2 rd |
 1 Forward-Looking Statement Certain statements contained in this presentation are forward-looking in nature. These include all statements about
People's United Financial, Inc. (“People’s United”) plans,
objectives, expectations and other statements that are not
historical facts, and usually use words such as "expect,"
"anticipate," "believe," "should" and similar expressions. Such statements represent management's current beliefs, based upon information available at the time the statements are
made, with regard to the matters addressed. All forward-looking statements
are subject to risks and uncertainties that could cause People's
United’s actual results or financial condition to differ materially from those expressed in or implied by such statements. Factors of particular importance to People’s United include, but are not limited to: (1) changes in general,
international, national or regional economic conditions; (2)
changes in interest rates; (3) changes in loan default and charge- off rates; (4) changes in deposit levels; (5) changes in levels of income and expense in non-interest income and expense
related activities; (6) changes in accounting and regulatory
guidance applicable to banks; (7) price levels and conditions in
the public securities markets generally; (8) competition and its effect on
pricing, spending, third-party relationships and revenues;
(9) the successful integration of acquisitions; and (10) changes in regulation resulting from or relating to financial reform legislation. People's United does not undertake any obligation to update or revise any forward-looking statements,
whether as a result of new information, future events or
otherwise. |
 2 • Net income of $90.8 million, or $0.26 per common share — Operating earnings per common share of $0.26, increased $0.02 and $0.01, respectively, from the second quarter and prior year quarter • Net interest income 1 of $285 million, an increase of $10 million or 4% • Net interest margin of 3.04%, an increase of 8 basis points • Loan balances increased $773 million, 10% annualized rate • Deposit balances increased $733 million, 9% annualized rate • Non-interest income of $89 million, a decrease of $2 million or 3% • Non-interest expense (ex. merger-related expenses) of $234 million, an increase of $2 million or less than 1% • Efficiency ratio of 57.3%, an improvement of 110 basis points • Net loan charge-offs of 0.06%, an improvement of 3 basis points 1 Net interest income on a fully taxable equivalent basis was $296 million, an increase of 4%.
(Comparisons versus second quarter 2017, unless noted otherwise)
Third Quarter 2017 Overview |
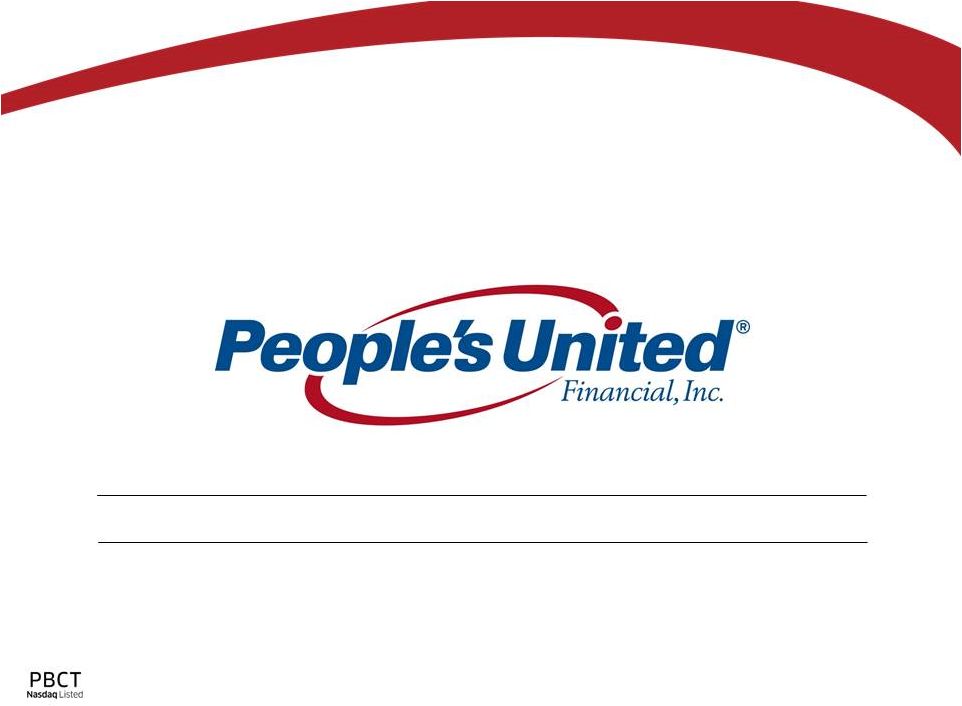
 2Q 2017 Loans Calendar Day Borrowings Deposits Investments 3Q 2017 3 Net Interest Income 1 ($ in millions) $274.9 $284.6 1 Net interest income on a fully taxable equivalent basis for 2Q 2017 and 3Q 2017 was $285.2 million and $295.8 million,
respectively. $15.2
($3.8) +$9.7 or 4% Linked-Quarter Change $1.9 ($3.2) ($0.4) |
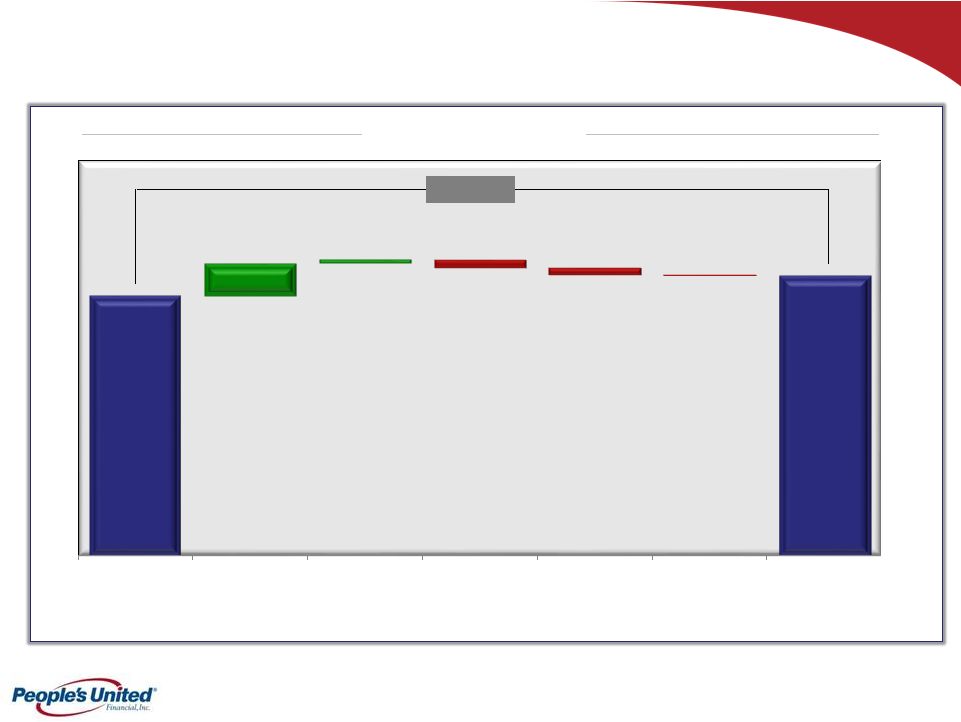
 4 Net Interest Margin 2Q 2017 Loans Calendar Day Investments Borrowings Deposits 3Q 2017 2.96% 3.04% 12 bps (4 bps) +8 bps Linked-Quarter Change 2 bps 1 bp (3 bps) |
 Loans 5 $11,164 $11,181 $8,710 $8,625 $2,918 $3,705 $6,688 $6,781 $2,131 $2,093 Jun. 30, 2017 Equipment Financing Residential Mortgage Commercial Real Estate Commercial & Industrial Home Equity & Other Consumer Sep. 30, 2017 Commercial Real Estate Commercial & Industrial Equipment Financing Residential Mortgage Home Equity & Other Consumer $32,385 ($ in millions, end of period balances) $31,611 Annualized linked quarter change: +10%, (Ex. LEAF Commercial Capital:
+1%) $787 ($38) $93 $17 ($85) Linked-Quarter Change |
 6 Deposits $14,887 $15,143 $7,566 $7,655 $4,693 $5,236 $4,669 $4,513 Jun. 30, 2017 Time Interest-Bearing Checking & Money Market Non-Interest Bearing Savings Sep. 30, 2017 Interest-Bearing Checking & Money Market Non-Interest-Bearing Time Savings ($ in millions, end of period balances) $32,547 $543 $31,815 Annualized linked quarter change: +9%
Linked-Quarter Change
$256 $89 ($156) |
 7 Non-Interest Income ($ in millions) 2Q 2017 Commercial Banking Lending Fees Brokerage Commissions Customer Interest Rate Swap Income Insurance Investment Management Fees Net Gains on Sales of Resi. Mortgage Loans Bank Service Charges Cash Management Fees Other 3Q 2017 $91.6 $89.3 ($4.5) $2.2 ($2.3) or (3%) Linked-Quarter Change ($0.6) ($0.5) $0.6 $0.4 $0.3 $0.3 ($0.5) |
 8 Non-Interest Expense ($ in millions) 2Q 2017 Merger-Related Expenses Professional & Outside Services Compensation & Benefits Regulatory Assessments Other 3Q 2017 $237.1 $257.3 ($21.8) Ex. Merger-Related Expenses: +$1.6 or <1% Linked-Quarter Change ($0.8) $1.4 $0.4 $0.6 |
 9 Efficiency Ratio 59.9% 59.3% 59.4% 58.4% 57.3% 3Q 2016 4Q 2016 1Q 2017 2Q 2017 3Q 2017 Quarterly Trend |
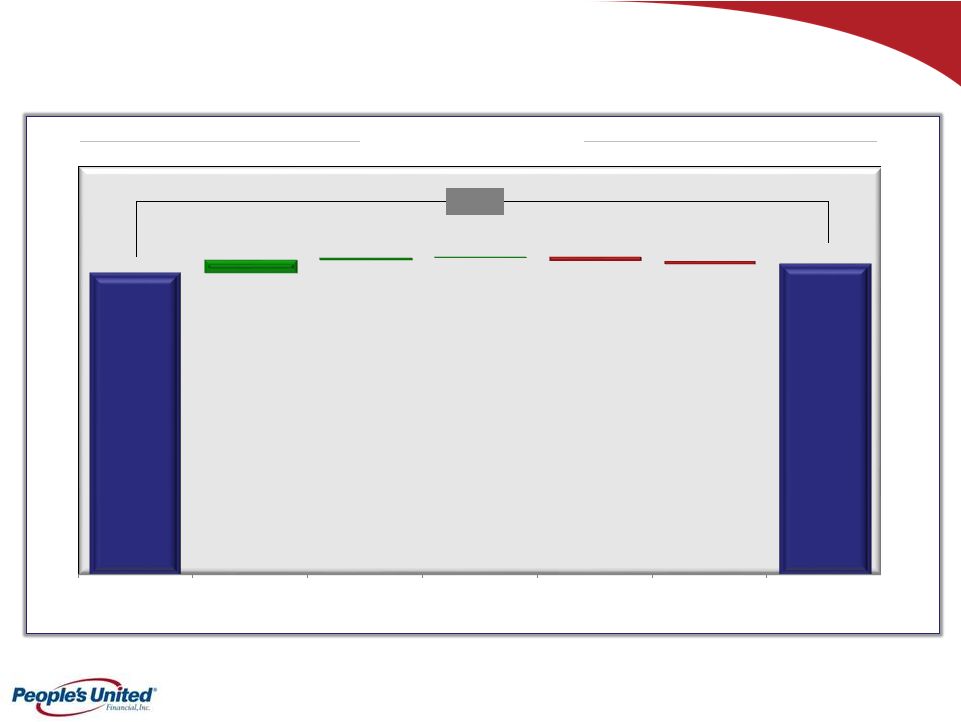
 10 Asset Quality 1 Non-performing assets (excluding acquired non-performing loans) as a percentage of originated loans plus all REO and repossessed assets; acquired non-performing loans excluded as risk of
loss has been considered by virtue of (i) our estimate of acquisition-date
fair value, (ii) the existence of an FDIC loss sharing agreement, and/or (iii) allowance for loan losses established subsequent to acquisition Notes: Source: SNL Financial Top 50 Banks represents the largest 50 banks by total assets in each respective quarter.
2 Ex. acquired loan charge-offs, PBCT’s charge-off ratio was 0.05%, 0.06%, 0.03%, 0.05% & 0.03% in 3Q 2017, 2Q 2017,
1Q 2017, 4Q 2016 & 3Q 2016, respectively Non-Performing
Assets / Loans & REO (%) Net Charge-offs / Average
Loans PBCT
Peer Group (Median)
Top 50 Banks (Median)
PBCT Peer Group (Median) Top 50 Banks (Median) 0.63 0.57 0.63 0.67 0.64 1.62 1.43 1.37 1.37 1.25 1.33 1.35 1.26 0.5 1.0 1.5 2.0 3Q 2016 4Q 2016 1Q 2017 2Q 2017 3Q 2017 0.04 0.06 0.03 0.09 0.06 0.22 0.19 0.19 0.21 0.22 0.24 0.22 0.21 0.0 0.1 0.2 0.3 3Q 2016 4Q 2016 1Q 2017 2Q 2017 3Q 2017 1 1 |
 11 Returns Return on Average Assets Return on Average Tangible Common Equity 2 nd quarter 2017 returns were significantly impacted by merger-related expenses of $24.8 million ($16.8 million
after-tax) Return on Average Assets
Return on Average Tangible Common Equity
0.77% 10.9% 0.73% 0.75% 0.70% 0.65% 0.84% 3Q 2016 4Q 2016 1Q 2017 2Q 2017 3Q 2017 10.7% 10.7% 9.6% 8.7% 11.8% 3Q 2016 4Q 2016 1Q 2017 2Q 2017 3Q 2017 Returns calculated on an operating basis |
 12 Capital Ratios Sep. 30, 2016 Dec. 31, 2016 Mar. 31, 2017 Jun. 30, 2017 Sep. 30, 2017 People’s United Financial, Inc. Tang. Com. Equity/Tang. Assets 7.2% 7.2% 7.4% 7.5% 7.1% Tier 1 Leverage Capital 7.7% 8.4% 8.5% 8.6% 8.3% Common Equity Tier 1 Capital 9.7% 9.9% 10.0% 10.1% 9.5% Tier 1 Risk-Based Capital 9.7% 10.7% 10.8% 10.9% 10.3% Total Risk-Based Capital 11.5% 12.5% 12.7% 12.6% 12.0% People’s United Bank, N.A. Tier 1 Leverage 8.6% 8.9% 8.9% 9.0% 8.6% Common Equity Tier 1 Capital 10.8% 11.3% 11.3% 11.3% 10.7% Tier 1 Risk-Based Capital 10.8% 11.3% 11.3% 11.3% 10.7% Total Risk-Based Capital 12.8% 13.3% 13.4% 13.3% 12.6% |
 13 Interest Rate Risk Profile Yield curve twist pivot point is 18 month point on yield curve. Short End defined as overnight to 18 months.
Long End defined as terms greater than 18 months.
-6.0% 3.9% 7.3% 10.3% 13.3% -6.3% 4.1% 7.6% 10.6% 13.5% Down 100 Up 100 Up 200 Up 300 Up 400 -2.8% 1.8% 3.4% -3.0% 2.2% 4.2% -2.9% 2.0% 3.7% -3.3% 2.2% 4.1% Short End -100 Short End +100 Short End +200 Long End -100 Long End +100 Long End +200 Immediate Parallel Shock Est. Change in NII Yield Curve Twist Est. Change in NII Sep. 30, 2017 Jun. 30, 2017 Net Interest Income (NII) Sensitivity 1 1 |
 Appendix |
 15 Loans $6,631 $6,891 $7,205 $7,546 $7,779 $7,827 $2,874 $4,381 $5,146 $5,578 $5,762 $7,359 $3,960 $4,313 $4,728 $4,954 $5,363 $5,668 $1,824 $1,827 $1,828 $1,854 $1,840 $1,785 $604 $838 $904 $1,155 $1,503 $1,649 $1,340 $1,327 $1,364 $1,346 $1,371 $1,359 $899 $896 $931 $964 $956 $968 $3,605 $3,917 $4,486 $5,014 $5,171 $5,770 Dec. 31, 2012 Dec. 31, 2013 Dec. 31, 2014 Dec. 31, 2015 Dec. 31, 2016 Sep. 30, 2017 Connecticut New York Massachusetts Vermont New Jersey New Hampshire Maine Other $21,737 $24,390 $26,592 $29,745 $32,385 $28,411 ($ in millions, end of period balances) State Breakdown |
 16 Deposits $11,104 $11,559 $14,768 $16,093 $17,072 $17,302 $2,525 $2,913 $3,205 $3,456 $3,527 $5,247 $3,174 $3,132 $3,067 $3,299 $3,357 $3,816 $2,670 $2,694 $2,761 $2,966 $3,083 $3,127 $1,370 $1,370 $1,395 $1,531 $1,616 $1,645 $908 $889 $942 $1,072 $1,206 $1,410 Dec. 31, 2012 Dec. 31, 2013 Dec. 31, 2014 Dec. 31, 2015 Dec. 31, 2016 Sep. 30, 2017 Connecticut New York Massachusetts Vermont New Hampshire Maine $21,751 $22,557 $26,138 $29,861 $32,547 $28,417 ($ in millions, end of period balances) State Breakdown |
 17 Asset Quality Originated Portfolio Coverage Detail as of Sep. 30, 2017 Note – ALLLs: Commercial: $199 million, Retail: $30 million, Total: $229 million.
0.94% 0.35% 0.77% Commercial Retail Total 0.59% 0.57% 0.59% Commercial Retail Total 159% 61% 132% Commercial Retail Total ALLLs / Loans NPLs / Loans ALLLs / NPLs |
 18 Peer Group Firm Ticker City State 1 Associated ASB Green Bay WI 2 Citizens CFG Providence RI 3 Comerica CMA Dallas TX 4 Cullen/Frost CFR San Antonio TX 5 East West EWBC Pasadena CA 6 First Horizon FHN Memphis TN 7 Huntington HBAN Columbus OH 8 KeyCorp KEY Cleveland OH 9 M&T MTB Buffalo NY 10 New York Community NYCB Westbury NY 11 Signature SBNY New York NY 12 Synovus SNV Columbus GA 13 Umpqua UMPQ Portland OR 14 Webster WBS Waterbury CT 15 Zions ZION Salt Lake City UT |
 For more information, investors may contact:
Andrew S. Hersom
(203) 338-4581
andrew.hersom@peoples.com |