Attached files
| file | filename |
|---|---|
| EX-99.1 - EXHIBIT 99.1 - ALLIANCE DATA SYSTEMS CORP | exhibit_99-1.htm |
| 8-K - FORM 8-K - ALLIANCE DATA SYSTEMS CORP | form_8k.htm |
Exhibit 99.2

Alliance Data NYSE: ADS Q3, 2017 ResultsOctober 19, 2017

Forward-Looking StatementsThis presentation contains forward-looking statements within the meaning of Section 27A of the Securities Act of 1933 and Section 21E of the Securities Exchange Act of 1934. Forward-looking statements give our expectations or forecasts of future events and can generally be identified by the use of words such as “believe,” “expect,” “anticipate,” “estimate,” “intend,” “project,” “plan,” “likely,” “may,” “should” or other words or phrases of similar import. Similarly, statements that describe our business strategy, outlook, objectives, plans, intentions or goals also are forward-looking statements. Examples of forward-looking statements include, but are not limited to, statements we make regarding our expected operating results, future economic conditions including currency exchange rates, future dividend declarations and the guidance we give with respect to our anticipated financial performance. We believe that our expectations are based on reasonable assumptions. Forward-looking statements, however, are subject to a number of risks and uncertainties that could cause actual results to differ materially from the projections, anticipated results or other expectations expressed in this presentation, and no assurances can be given that our expectations will prove to have been correct. These risks and uncertainties include, but are not limited to, factors set forth in the Risk Factors section in our Annual Report on Form 10-K for the most recently ended fiscal year, which may be updated in Item 1A of, or elsewhere in, our Quarterly Reports on Form 10-Q filed for periods subsequent to such Form 10-K. Our forward-looking statements speak only as of the date made, and we undertake no obligation, other than as required by applicable law, to update or revise any forward-looking statements, whether as a result of new information, subsequent events, anticipated or unanticipated circumstances or otherwise. 1

Agenda Speakers: Ed Heffernan President and CEO Charles Horn EVP and CFO Third Quarter 2017 Consolidated ResultsSegment ResultsFull Year 2017 Outlook and 2018 Guidance 1 2
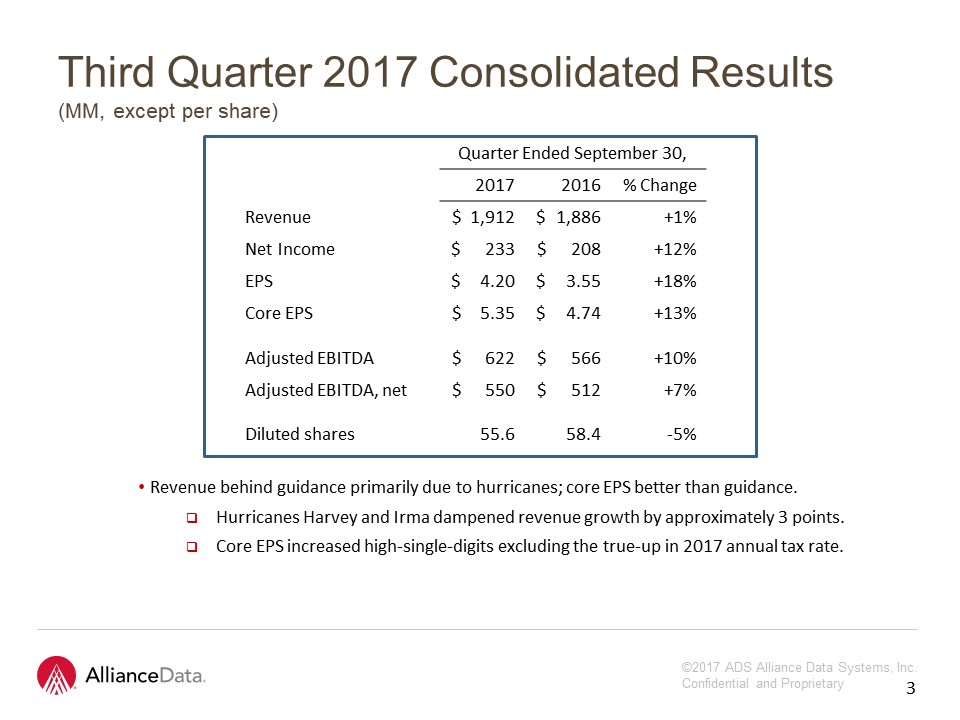
Third Quarter 2017 Consolidated Results(MM, except per share) Quarter Ended September 30, 2017 2016 % Change Revenue $ 1,912 $ 1,886 +1% Net Income $ 233 $ 208 +12% EPS $ 4.20 $ 3.55 +18% Core EPS $ 5.35 $ 4.74 +13% Adjusted EBITDA $ 622 $ 566 +10% Adjusted EBITDA, net $ 550 $ 512 +7% Diluted shares 55.6 58.4 -5% 2 3 Revenue behind guidance primarily due to hurricanes; core EPS better than guidance.Hurricanes Harvey and Irma dampened revenue growth by approximately 3 points.Core EPS increased high-single-digits excluding the true-up in 2017 annual tax rate.

LoyaltyOne® (MM) BMO, our largest AIR MILES® sponsor, signed a multi-year renewal during the third quarter.AIR MILES issued decreased 7 percent due to reduced promotional activity.Expect improvement in fourth quarter. BrandLoyalty’s results consistent with expectations.Expect double-digit top and bottom-line growth in fourth quarter. Quarter Ended September 30, 2017 2016 % Change Revenue $ 305 $ 384 -20% Adjusted EBITDA $ 61 $ 82 -26% Adjusted EBITDA % 20% 21% -1% 3 4

Epsilon® (MM) Technology Platform offering continues to improve : revenue -13 percent in Q4, 2016 → -7 percent in Q1, 2017 → -3 percent in Q2, 2017 → +1 percent in Q3, 2017.Transitory change in revenue mix pressured adjusted EBITDA margins during the quarter. Quarter Ended September 30, 2017 2016 % Change Revenue $ 559 $ 543 +3% Adjusted EBITDA $ 125 $ 135 -7% Adjusted EBITDA % 22% 25% -3% 4 5

Card Services (MM) Quarter Ended September 30, 2017 2016 % Change Revenue $ 1,055 $ 966 +9% Operating expenses 382 330 +16% Provision for loan loss 205 251 -19% Funding costs 71 54 +33% Adjusted EBITDA, net $ 397 $ 331 +20% Adjusted EBITDA, net % 38% 34% +4% 5 Hurricanes temporarily depressed credit sales and gross yields during the quarter.Net loss rates were 5.5 percent for the quarter, better than expectations.Gross principal loss rates were flat year-over-year. Delinquency rates continue to track consistent with expectations. Year-over-year gap to close in fourth quarter. 6

Card Services (MM) Allowance for loan loss reserve is 6.35 percent of $16.3 billion in reservable card receivables at September 30.Equivalent to 12 months forward coverage. Quarter Ended September 30, Key metrics: 2017 2016 Change Credit sales $ 7,352 $ 6,986 +5% Average card receivables $15,950 $13,995 +14% Total gross yield 25.4% 26.8% -1.3% Operating expenses as % of average card receivables 9.2% 9.1% +0.1% Principal loss rates 5.5% 4.7% +0.8% Delinquency rate 5.4% 5.0% +0.4% 6 7

Delinquency Wedge 8

9 Full Year 2017 Outlook Consolidated:Reiterate guidance of $7.8 billion in revenue and $18.10 in core EPS“Slingshot” remains on trackDelinquency wedge is expected to close in fourth quarterGross losses have already moved from up 75 basis points in the first half of 2017 to flat in the third quarterRecoveries remain soft, but easy comparable in 2018Momentum building Q1 Q2 Q3 Q4Core EPS growth 2% 4% Double High-single/ digits low-double digitsBig mover in fourth quarter: LoyaltyOne will add ~$0.50 per share more than in third quarter 9

10 Epsilon:Original guidance: $2.24 billion in revenue and $500 million in adjusted EBITDARepresents 4 percent top/bottom growthYear-to-date: running ahead on revenue but behind on adjusted EBITDA primarily due to product mixTechnology Platform (~25 percent of Epsilon revenue)Revenue -13 percent in Q4, 2016 → -7 percent in Q1, 2017 → -3 percent in Q2, 2017→ +1 percent in Q3 Full Year 2017 Outlook 10

Full Year 2017 Outlook Loyalty One:Canada: no change to guidance$760 million in revenue, $180 million in adjusted EBITDASolid progress on re-tooling model – margins running in the mid 20’s rangeSponsors – no attritionCollectors – returned to within 1 percent of active collector levels versus down 6 percent in latter part of 2016Issuance – core issuance is stable; promotional-related issuance is soft. Expect firming in fourth quarterBrandLoyalty: softTraditionally grows double-digitsQ1 to Q3, 2017 soft due to timing of campaigns; not a structural issueReturn to strong growth in the fourth quarter:Double-digit revenue and adjusted EBITDA growth 11

Full Year 2017 Outlook Card Services:Card receivables growth of 15 percentSigned new $2 billion vintageGross yields down in third and fourth quarters due to hurricanes and on-boarding of Signet portfolio~40 bps of operating leverage (operating expenses/average receivables) Credit normalization nearing completionDelinquencies: best predictor of future gross lossesQ1: 50 bps over last year → Q4: flat vs last yearGross loss rates:Q1 and Q2: 75 bps over last year → Q3: flat → Q4: improveNet loss rates: approximately 5.9 percent (up 30 bps on gross and 50 bps from lower recovery rates); 6.3 percent in Q1 → 6.2 percent in Q2 → 5.5 percent in Q3 →sub 6 percent in Q4Full Year Guidance: Mid-teens revenue growth; ~12 percent adjusted EBITDA, net growthStill evaluating impact of hurricanes Harvey and Irma to fourth quarter, but expect negative impact to be manageable 12

Consolidated: 2017 2018 Revenue $7.8bn $8.7bn +12% Core EPS $18.10 $21.50 +19% 10 year average Revenue +13% Adjusted EBITDA +12% Core EPS +17% 2018 Guidance 13

2018 Guidance Epsilon:Mid-single-digit revenue and adjusted EBITDA growthTechnology Platform offering returns to modest growthConversant CRM and Auto remain fastest growing offeringsLoyaltyOne:Canada: model fully retooled3 to 5 percent revenue and adjusted EBITDA growth3 percent growth in AIR MILES issuedBrandLoyalty:Strong fourth quarter of 2017 provides nice jump-off point for 2018Return to double-digit revenue and adjusted EBITDA growthWorld Cup, Disney EMEA to solidify growthCard Services:Mid-teens portfolio growth supported by new $2 billion vintageMid-teens growth in revenue and adjusted EBITDA, netNet loss rate flat to down compared to 2017 14

2018 Guidance Net loss rate flat to down compared to 2017: Four primary reasons:Private label peaks in growth and loss rates before bankcards during a typical credit cycleOur normalization: 2016 – 2017Bankcard normalization: 2017 – 2018Delinquency wedge is expected to close in fourth quarterBest predictor of future gross loss ratesGross losses up 75 bps in first-half of 2017 → flat nowSignet: > $1 billion of prime-only accountsHigher credit quality benefits gross loss ratesRecovery rates: 18 percent of gross losses in 2017 compared to 26 percent in 2016Unusually low in 2017 due to market conditionsMoving in-house will gradually increase recovery ratesHow does a stable net loss rate drive the ‘slingshot’ in 2018 earnings? Primarily due to lower reserve build Higher loss rates and reserve build was a double-digit drag on core EPS growth in 2017Net loss rates up 80 bps in 2017→ Core EPS of $18.10, up 7 percent (Guidance)Had loss rates stayed flat in 2017 → Core EPS over $21.00, up over 20 percent 15

13 16 Financial MeasuresIn addition to the results presented in accordance with generally accepted accounting principles, or GAAP, the Company may present financial measures that are non-GAAP measures, such as constant currency financial measures, adjusted EBITDA, adjusted EBITDA margin, adjusted EBITDA, net of funding costs and non-controlling interest, core earnings and core earnings per diluted share (core EPS). Constant currency excludes the impact of fluctuations in foreign exchange rates. The Company calculates constant currency by converting our current period local currency financial results using the prior period exchange rates. The Company uses adjusted EBITDA and adjusted EBITDA, net as an integral part of internal reporting to measure the performance and operational strength of reportable segments and to evaluate the performance of senior management. Adjusted EBITDA eliminates the uneven effect across all reportable segments of non-cash depreciation of tangible assets and amortization of intangible assets, including certain intangible assets that were recognized in business combinations, and the non-cash effect of stock compensation expense. Similarly, core earnings and core EPS eliminate non-cash or non-operating items, including, but not limited to, stock compensation expense, amortization of purchased intangibles, amortization of debt issuance and hedging costs, mark-to-market gains or losses on interest rate derivatives, changes to the expiry policy and regulatory settlements. The Company believes that these non-GAAP financial measures, viewed in addition to and not in lieu of the Company’s reported GAAP results, provide useful information to investors regarding the Company’s performance and overall results of operations. Reconciliations to comparable GAAP financial measures are available in the Company’s earnings release, which is posted in both the News and Investors sections on the Company’s website (www.alliancedata.com). No reconciliation is provided with respect to forward-looking annual guidance for 2017 or 2018 core EPS as the Company cannot reliably predict all necessary components or their impact to reconcile core EPS to GAAP EPS without unreasonable effort. The events necessitating a non-GAAP adjustment are inherently unpredictable and may have a material impact on the Company’s future results. The financial measures presented are consistent with the Company’s historical financial reporting practices. Core earnings and core EPS represent performance measures and are not intended to represent liquidity measures. The non-GAAP financial measures presented herein may not be comparable to similarly titled measures presented by other companies, and are not identical to corresponding measures used in other various agreements or public filings.

Q & A 17