Attached files
| file | filename |
|---|---|
| EX-23.3 - EX-23.3 - Evoqua Water Technologies Corp. | a2233562zex-23_3.htm |
| EX-23.2 - EX-23.2 - Evoqua Water Technologies Corp. | a2233562zex-23_2.htm |
| EX-23.1 - EX-23.1 - Evoqua Water Technologies Corp. | a2233562zex-23_1.htm |
| EX-1.1 - EX-1.1 - Evoqua Water Technologies Corp. | a2233562zex-1_1.htm |
As filed with the Securities and Exchange Commission on October 18, 2017
Registration No. 333-220785
UNITED STATES
SECURITIES AND EXCHANGE COMMISSION
WASHINGTON, D.C. 20549
Amendment No. 3
to
FORM S-1
REGISTRATION STATEMENT
UNDER
THE SECURITIES ACT OF 1933
Evoqua Water Technologies Corp.
(Exact name of registrant as specified in its charter)
| Delaware (State or other jurisdiction of incorporation or organization) |
3999 (Primary Standard Industrial Classification Code Number) |
46-4132761 (I.R.S. Employer Identification No.) |
210 Sixth Avenue
Pittsburgh, Pennsylvania 15222
(724) 772-0044
(Address, including zip code, and telephone number, including
area code, of registrant's principal executive offices)
Ronald C. Keating
Chief Executive Officer
210 Sixth Avenue
Pittsburgh, Pennsylvania 15222
(724) 772-0044
(Name, address, including zip code, and telephone number including area code, of agent for service)
| Copies of all communications, including communications sent to agent for service, should be sent to: | ||||
Andrew B. Barkan, Esq. Meredith L. Mackey, Esq. Fried, Frank, Harris, Shriver & Jacobson LLP One New York Plaza New York, New York 10004 (212) 859-8000 |
Vincent Grieco General Counsel Evoqua Water Technologies Corp. 210 Sixth Avenue Pittsburgh, Pennsylvania 15222 (724) 772-0044 |
Marc D. Jaffe, Esq. Ian D. Schuman, Esq. Latham & Watkins LLP 885 Third Avenue New York, New York 10022 (212) 906-1200 |
||
Approximate date of commencement of proposed sale to the public:
As soon as practicable after this Registration Statement becomes effective.
If any of the securities being registered on this Form are to be offered on a delayed or continuous basis pursuant to Rule 415 under the Securities Act of 1933, check the following box. o
If this Form is filed to register additional securities for an offering pursuant to Rule 462(b) under the Securities Act of 1933, please check the following box and list the Securities Act registration statement number of the earlier effective registration statement for the same offering. o
If this Form is a post-effective amendment filed pursuant to Rule 462(c) under the Securities Act, check the following box and list the Securities Act registration statement number of the earlier effective registration statement for the same offering. o
If this Form is a post-effective amendment filed pursuant to Rule 462(d) under the Securities Act, check the following box and list the Securities Act registration statement number of the earlier effective registration statement for the same offering. o
Indicate by check mark whether the registrant is a large accelerated filer, an accelerated filer, a non-accelerated filer, a smaller reporting company, or an emerging growth company. See the definitions of "large accelerated filer," "accelerated filer" and "smaller reporting company," and "emerging growth company" in Rule 12b-2 of the Exchange Act. (Check One):
| Large accelerated filer o | Accelerated filer o | Non-accelerated filer ý (Do not check if a smaller reporting company) |
Smaller reporting company o Emerging growth company o |
If an emerging growth company, indicate by check mark if the registrant has elected not to use the extended transition period for complying with any new or revised financial accounting standards provided pursuant to Section 13(a) of the Exchange Act. o
CALCULATION OF REGISTRATION FEE
|
||||||||
|
||||||||
| Title of Each Class of Securities to be Registered |
Amount to be Registered(1) |
Proposed Maximum Aggregate Offering Price Per Share(1)(2) |
Proposed Maximum Aggregate Offering Price(1)(2) |
Amount of Registration Fee(3) |
||||
|---|---|---|---|---|---|---|---|---|
Common Stock, par value $0.01 per share |
31,944,443 | $19.00 | $606,944,417 | $75,565 | ||||
|
||||||||
- (1)
- Includes
shares and the offering price of shares that may be purchased by the underwriters upon the exercise of their option to purchase additional shares.
- (2)
- This
amount represents the proposed maximum aggregate offering price of the securities registered hereunder. These figures are estimated solely for the purpose of
calculating the registration fee in accordance with Rule 457(a) under the Securities Act of 1933.
- (3)
- The registrant previously paid $12,450 in connection with a prior filing of this Registration Statement on October 3, 2017.
The Registrant hereby amends this Registration Statement on such date or dates as may be necessary to delay its effective date until the Registrant shall file a further amendment which specifically states that this Registration Statement shall thereafter become effective in accordance with Section 8(a) of the Securities Act of 1933 or until this Registration Statement shall become effective on such date as the Commission, acting pursuant to said Section 8(a), may determine.
The information in this preliminary prospectus is not complete and may be changed. Neither we nor the selling stockholders may sell these securities until the registration statement filed with the Securities and Exchange Commission is effective. This preliminary prospectus is not an offer to sell, and it is not soliciting an offer to buy, these securities in any jurisdiction where the offer or sale is not permitted.
Subject to completion, dated October 18, 2017
PRELIMINARY PROSPECTUS

27,777,777 Shares
Evoqua Water Technologies Corp.
Common Stock
This is an initial public offering of shares of common stock of Evoqua Water Technologies Corp. We are selling 8,333,333 shares of common stock, and the selling stockholders named herein are selling 19,444,444 shares of common stock. We will not receive any of the proceeds from the shares of common stock sold by the selling stockholders.
Prior to this offering, there has been no public market for our common stock. The initial public offering price is expected to be between $17.00 and $19.00 per share. We have applied to list our common stock on the New York Stock Exchange (the "NYSE") under the symbol "AQUA."
The underwriters have an option for a period of 30 days to purchase up to a maximum of 4,166,666 additional shares of our common stock from the selling stockholders.
After the completion of this offering, we expect to be a "controlled company" within the meaning of the corporate governance standards of the NYSE.
Investing in our common stock involves risk. See "Risk Factors" beginning on page 28 to read about factors you should consider before buying shares of our common stock.
|
||||||||
| |
Price to Public |
Underwriting Discounts and Commissions(1) |
Proceeds, Before Expenses, to Us |
Proceeds, Before Expenses, to the Selling Stockholders |
||||
|---|---|---|---|---|---|---|---|---|
Per Share |
$ | $ | $ | $ | ||||
Total |
$ | $ | $ | $ | ||||
|
||||||||
- (1)
- See "Underwriting" for additional information regarding underwriting compensation.
Delivery of the shares of common stock will be made on or about , 2017.
Neither the Securities and Exchange Commission ("SEC") nor any other regulatory body has approved or disapproved of these securities or determined if this prospectus is truthful or complete. Any representation to the contrary is a criminal offense.
| Credit Suisse | J.P. Morgan | RBC Capital Markets |
| Citigroup | Goldman Sachs & Co. LLC |
| Morgan Stanley | Baird | Raymond James | Stifel | Wells Fargo Securities |
The date of this prospectus is , 2017.

TABLE OF CONTENTS
You should rely only on the information contained in this prospectus and any free writing prospectus prepared by or on behalf of us that we have referred to you. Neither we, the selling stockholders nor the underwriters have authorized anyone to provide you with additional information or information different from that contained in this prospectus or in any free writing prospectus prepared by or on behalf of us that we have referred to you. If anyone provides you with additional, different, or inconsistent information, you should not rely on it. Offers to sell, and solicitations of offers to buy, shares of our common stock are being made only in jurisdictions where offers and sales are permitted. The information contained in this prospectus is accurate only as of the date of this prospectus, regardless of the time of delivery of this prospectus or of any sale of our common stock. Our business, financial condition, results of operations or prospects may have changed since such date.
No action is being taken in any jurisdiction outside the United States to permit a public offering of our common stock or possession or distribution of this prospectus in that jurisdiction. Persons who come into possession of this prospectus in jurisdictions outside the United States are required to inform themselves about and to observe any restriction as to this offering and the distribution of this prospectus applicable to those jurisdictions.
i
This prospectus includes estimates regarding market and industry data that we prepared based on our management's knowledge and experience in the markets in which we operate, together with information obtained from various sources, including publicly available information, industry reports and publications, surveys, our customers, distributors, suppliers, trade and business organizations and other contacts in the markets in which we operate. In addition, certain market and industry data has been derived from market research prepared for us by Amane Advisors.
In presenting this information, we have made certain assumptions that we believe to be reasonable based on such data and other similar sources and on our knowledge of, and our experience to date in, the markets for our products. Market share data is subject to change and may be limited by the availability of raw data, the voluntary nature of the data gathering process and other limitations inherent in any statistical survey of market share data. In addition, customer preferences are subject to change. Accordingly, you are cautioned not to place undue reliance on such market share data or any other such estimates. While we believe such information is reliable, neither we nor the underwriters can guarantee the accuracy or completeness of this information, and neither we nor the underwriters have independently verified any third-party information and data from our internal research has not been verified by any independent source. While we believe the estimated market and industry data included in this prospectus are generally reliable, such information, which is derived in part from management's estimates and beliefs, is inherently uncertain and imprecise.
Projections, assumptions and estimates of our future performance and the future performance of the markets in which we operate are necessarily subject to a high degree of uncertainty and risk due to a variety of factors, including those described in "Risk Factors" and "Cautionary Note Regarding Forward-Looking Statements." These and other factors could cause results to differ materially from those expressed in the estimates made by the independent parties and by us.
CERTAIN TRADEMARKS, TRADE NAMES AND SERVICE MARKS
This prospectus includes trademarks and service marks owned by us, including "EVOQUA," "BIOMAG," "CAPAC," "CHLOROPAC," "COMAG," "DAVCO," "DEFENDER," "DELTA UV," "ENVIREX," "IONPURE," "JWI," "MEMCOR," "MEMPULSE," "NEXED," "OSEC," "SEACURE," "TRANSFORMING WATER. ENRICHING LIFE.," "WALLACE & TIERNAN," "WATER ONE," "VANOX" and "VORTISAND." This prospectus also contains trademarks, trade names and service marks of other companies, which are the property of their respective owners. Solely for convenience, trademarks, trade names and service marks referred to in this prospectus may appear without the ®, ™ or SM symbols, but such references are not intended to indicate, in any way, that we will not assert, to the fullest extent under applicable law, our rights or the right of the applicable licensor to these trademarks, trade names and service marks. We do not intend our use or display of other parties' trademarks, trade names or service marks to imply, and such use or display should not be construed to imply, a relationship with, endorsement of or sponsorship of us by, these other parties.
On January 15, 2014, Evoqua Water Technologies Corp. (formerly EWT Holdings I Corp.), or the "Successor," acquired, through its wholly-owned entities, EWT Holdings II Corp. and EWT Holdings III Corp., all of the outstanding shares of Siemens Water Technologies (the "Predecessor"), a group of legal entity businesses formerly owned by Siemens Aktiengesellschaft ("Siemens"). This acquisition, which we refer to as the "AEA Acquisition," closed on January 15, 2014 and was effective January 16, 2014. The stock purchase price, net of cash received, was approximately $730.6 million. The Successor is majority-owned by certain affiliates of AEA Investors LP (collectively, "AEA" or our "Sponsor").
ii
As a result of the AEA Acquisition and resulting change in control and changes due to the impact of purchase accounting, we are required to present separately the operating results for the Predecessor and Successor. We refer to the period from October 1, 2013 through January 15, 2014 as "Predecessor Period 2014," and the consolidated financial statements for that period include the accounts of the Predecessor. We refer to the period from January 16, 2014 through September 30, 2014 as "Successor Period 2014," and the consolidated financial statements for that period include the accounts of the Successor. The Successor was incorporated on October 7, 2013. From October 7, 2013 to January 15, 2014, the Successor had no activities other than the incurrence of transaction costs related to the AEA Acquisition, which are included in the Successor Period 2014.
Consequently, Successor Period 2014, fiscal 2015 and fiscal 2016 may not be comparable to Predecessor Period 2014. Unless otherwise indicated or the context otherwise requires, all references to "the Company," "Evoqua," "Evoqua Water Technologies Corp.," "EWT Holdings I Corp.," "we," "us," "our" and similar terms mean (1) the Predecessor for periods ending on or prior to January 15, 2014 and (2) the Successor for periods beginning on or after January 16, 2014, in each case together with its consolidated subsidiaries.
Our fiscal year ends on September 30 of each year. References in this prospectus to a fiscal year mean the year in which that fiscal year ends. References in this prospectus to: "fiscal 2012" or "FY 2012" relate to the fiscal year ended September 30, 2012, "fiscal 2013" or "FY 2013" relate to the fiscal year ended September 30, 2013, "fiscal 2014" or "FY 2014" relate to the fiscal year ended September 30, 2014, "fiscal 2015" or "FY 2015" relate to the fiscal year ended September 30, 2015, "fiscal 2016" or "FY 2016" relate to the fiscal year ended September 30, 2016 and "fiscal 2017" or "FY 2017" relate to the fiscal year ended September 30, 2017.
Numerical figures included in this prospectus have been subject to rounding adjustments. Accordingly, numerical figures shown as totals in various tables may not be arithmetic aggregations of the figures that precede them. In addition, we round certain percentages presented in this prospectus to the nearest whole number. As a result, figures expressed as percentages in the text may not total 100% or, as applicable, when aggregated may not be the arithmetic aggregation of the percentages that precede them.
As used in this prospectus, unless the context otherwise requires, any reference to:
- •
- "ADI" means ADI Systems North America Inc., Geomembrane Technologies Inc. and Lange Containment Systems, Inc., collectively;
- •
- "August 2017 Refinancing" means our entry into the fourth amendment, dated as of August 8, 2017, to the First Lien Credit
Agreement (the "August 2017 Amendment") providing for the incurrence of (i) approximately $262.7 million in term loans, the net proceeds of which were used to refinance in their entirety
the NB Incremental Loans and (ii) $80.0 million of incremental term loans, the net proceeds of which were used to repay $60.0 million of revolving credit loans then outstanding
under the Revolving Credit Facility and to pay fees and expenses in connection with the transactions thereunder and for other general corporate purposes;
- •
- "BOO" means build own-operate;
- •
- "Delta UV" means Delta Ultraviolet Corporation;
- •
- "EPC" means engineering, procurement and construction;
- •
- "ePro" means Evoqua Procurement;
- •
- "ETS" means Environmental Treatment Systems Inc.;
- •
- "FDA" means the U.S. Food and Drug Administration;
iii
- •
- "First Lien Credit Agreement" means the first lien credit agreement, dated as of January 15, 2014, by and among our subsidiary, EWT
Holdings II Corp., as a parent guarantor, EWT Holdings III Corp., as the borrower, the lenders party thereto and Credit Suisse AG, as administrative agent and
collateral agent;
- •
- "First Lien Facilities" means the Term Loan Facility, together with the Revolving Credit Facility;
- •
- "Magneto" means Magneto Special Anodes B.V.;
- •
- "NB Incremental Loans" means the $185.0 million of incremental term loans incurred pursuant to the incremental amendment, dated as of
April 15, 2016, to the First Lien Credit Agreement. The net proceeds of the NB Incremental Loans were used to finance the Neptune-Benson Acquisition, the refinancing of certain then-existing
indebtedness of Neptune-Benson and the payment of fees and expenses in connection with such transactions;
- •
- "Neptune-Benson" means Neptune-Benson Holding Corp. and certain of its affiliates, which we acquired in connection with the Neptune-Benson
Acquisition;
- •
- "Neptune-Benson Acquisition" means our acquisition of Neptune-Benson on April 15, 2016. In connection with the Neptune-Benson
Acquisition, we created our Aquatics and Disinfection division, which we subsequently merged into our Products Segment;
- •
- "Noble" means Noble Water Technologies, Inc.;
- •
- "O&M" means operations and maintenance;
- •
- "October 2016 Refinancing" means our entry into a second amendment to the First Lien Credit Agreement, on October 28, 2016, to
(i) borrow the October 2016 Incremental Term Loans to fund our repayment in full of the Second Lien Facility and revolving credit loans then outstanding under the Revolving Credit
Facility and (ii) increase commitments under the Revolving Credit Facility by $20.0 million to a total of $95.0 million;
- •
- "October 2016 Incremental Term Loans" means the $150.0 million of additional incremental term loans we borrowed under the Term Loan
Facility on October 28, 2016, in connection with our entry into the October 2016 Refinancing;
- •
- "OEM" means original equipment manufacturer;
- •
- "Olson" means Olson Irrigation Systems;
- •
- "Revolving Credit Facility" means the senior secured revolving credit facility we entered into on January 15, 2014;
- •
- "Second Lien Credit Agreement" means the second lien credit agreement by and among our subsidiary, EWT Holdings II Corp., as a parent
guarantor, EWT Holdings III Corp., as the borrower, the lenders party thereto and Credit Suisse AG, as administrative agent and collateral agent, dated January 15, 2014;
- •
- "Second Lien Facility" means the senior secured second lien term loan facility we entered into on January 15, 2014;
- •
- "Second Lien Repayment" means our repayment of all amounts then-outstanding under the Second Lien Credit Agreement in connection with the
October 2016 Refinancing;
- •
- "Senior Secured Credit Facilities" means the First Lien Facilities and, until the Second Lien Repayment, the Second Lien Facility;
- •
- "Stock Option Plan" means the Evoqua Water Technologies Corp. Stock Option Plan, which was effective as of March 6, 2014;
iv
- •
- "Term Loan Facility" means the senior secured first lien term loan facility we entered into on January 15, 2014;
- •
- "Transactions" means (i) the Neptune-Benson Acquisition; (ii) our entry into the NB Incremental Term Loans to finance the
Neptune-Benson Acquisition; (iii) the October 2016 Refinancing and the August 2017 Refinancing and (iv) the sale of shares of common stock by us in this offering at the initial public
offering price of $18.00 per share (the midpoint of the price range set forth on the cover of this prospectus) and the application of the net proceeds therefrom as set forth under "Use of
Proceeds";
- •
- "TWO" means Treated Water Outsourcing, a joint venture between us and Nalco Water, an Ecolab company, to sell water management equipment and
services to industrial customers located throughout the United States; and
- •
- "VAF" means Valve and Filtration Systems, Ltd.
USE OF NON-GAAP FINANCIAL MEASURES
This prospectus contains "non-GAAP financial measures," which are financial measures that are not calculated and presented in accordance with generally accepted accounting principles in the United States, or "GAAP."
The SEC has adopted rules to regulate the use in filings with the SEC and in other public disclosures of non-GAAP financial measures. These rules govern the manner in which non-GAAP financial measures are publicly presented and require, among other things:
- •
- a presentation with equal or greater prominence of the most comparable financial measure or measures calculated and presented in accordance
with GAAP; and
- •
- a statement disclosing the purposes for which the registrant's management uses the non-GAAP financial measure.
Specifically, we make use of the non-GAAP financial measure "Adjusted EBITDA" in evaluating our past performance and future prospects. Throughout this prospectus, as noted, we make adjustments to Adjusted EBITDA, with respect to the pro forma periods presented herein, to give further effect to contributions from insignificant completed acquisitions for the applicable periods. For the definition of Adjusted EBITDA (including as further adjusted as described above) and a reconciliation to net income (loss), its most directly comparable financial measure presented in accordance with GAAP, see footnotes 2 and 3 to the table under the heading "Prospectus Summary—Summary Consolidated Financial and Operating Data."
Adjusted EBITDA is one of the primary metrics used by management to evaluate the financial performance of our business. We present Adjusted EBITDA, which is not a recognized financial measure under GAAP, because we believe it is frequently used by analysts, investors and other interested parties to evaluate companies in our industry. Further, we believe it is helpful in highlighting trends in our operating results, because it excludes, among other things, certain results of decisions that are outside the control of management, while other measures can differ significantly depending on long-term strategic decisions regarding capital structure, the tax jurisdictions in which we operate and capital investments. Management uses Adjusted EBITDA to supplement GAAP measures of performance as follows:
- •
- to assist investors and analysts in comparing our operating performance across reporting periods on a consistent basis by excluding items that we do not believe are indicative of our core operating performance;
v
- •
- in our management incentive compensation which is based in part on components of Adjusted EBITDA;
- •
- in certain calculations under our Senior Secured Credit Facilities, which use components of Adjusted EBITDA;
- •
- to evaluate the effectiveness of our business strategies;
- •
- to make budgeting decisions; and
- •
- to compare our performance against that of other peer companies using similar measures.
In addition to the above, our chief operating decision maker uses EBITDA of each reportable segment to evaluate the operating performance of such segments. For the definition of EBITDA on a segment basis and a reconciliation to our segment operating profit presented in accordance with GAAP, see our segment results discussed under "Management's Discussion and Analysis of Financial Condition and Results of Operations."
Adjusted EBITDA has limitations as an analytical tool, and you should not consider it either in isolation or as a substitute for analyzing our results as reported under GAAP. Some of these limitations include the following:
- •
- Adjusted EBITDA does not reflect every expenditure, future requirements for capital expenditures or contractual commitments;
- •
- Adjusted EBITDA does not reflect changes in our working capital needs;
- •
- Adjusted EBITDA does not reflect the significant interest expense, or the amounts necessary to service interest or principal payments on our
Senior Secured Credit Facilities;
- •
- Adjusted EBITDA does not reflect income tax expense (benefit), and because the payment of taxes is part of our operations, tax expense is a
necessary element of our costs and ability to operate;
- •
- although depreciation and amortization are eliminated in the calculation of Adjusted EBITDA, the assets being depreciated and amortized will
often have to be replaced in the future, and Adjusted EBITDA does not reflect any costs of such replacements;
- •
- Adjusted EBITDA does not reflect the noncash component of employee compensation;
- •
- Adjusted EBITDA does not reflect the impact of earnings or charges resulting from matters we consider not to be reflective, on a recurring
basis, of our ongoing operations;
- •
- other companies in our industry may calculate Adjusted EBITDA or similarly titled measures differently than we do, limiting its usefulness as a
comparative measure; and
- •
- Adjusted EBITDA (pro forma as adjusted for contributions from insignificant completed acquisitions) does not necessarily reflect the results of operations of such acquired businesses as if they had been acquired at the beginning of each such period presented.
We compensate for these limitations by relying primarily on our GAAP results and using Adjusted EBITDA only as supplemental information.
vi
This summary highlights selected information contained elsewhere in this prospectus and does not contain all of the information that you should consider in making your investment decision. Before investing in our common stock, you should carefully read this entire prospectus, including our consolidated financial statements and related notes thereto included elsewhere in this prospectus and the information in "Risk Factors," "Cautionary Note Regarding Forward-Looking Statements" and "Management's Discussion and Analysis of Financial Condition and Results of Operations."
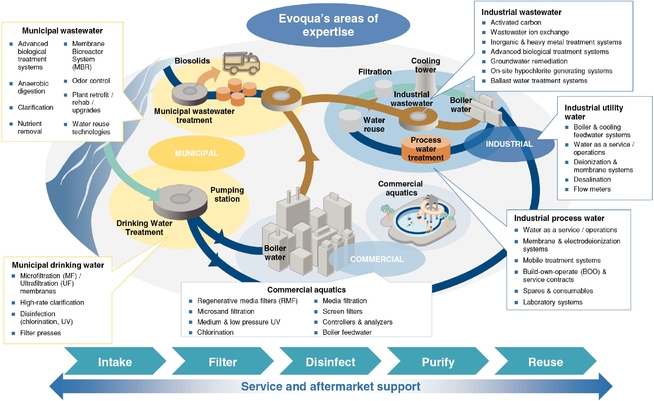
We are a leading provider of mission critical water treatment solutions, offering services, systems and technologies to support our customers' full water lifecycle needs. With over 200,000 installations worldwide, we hold leading positions in the industrial, commercial and municipal water treatment markets in North America. We offer a comprehensive portfolio of differentiated, proprietary technology solutions sold under a number of market-leading and well-established brands. We deliver and maintain these mission critical solutions through the largest service network in North America, assuring our customers continuous uptime with 86 branches which are located no further than a two-hour drive from more than 90% of our customers' sites. We believe that the customer intimacy created through our service network is a significant competitive advantage.
Our solutions are designed to provide "worry-free water" by ensuring that our customers have access to an uninterrupted quantity and level of quality of water that meets their unique product, process and recycle or reuse specifications. We enable our customers to achieve lower costs through greater uptime, throughput and efficiency in their operations and support their regulatory compliance and environmental sustainability. We have worked to protect water, the environment and our employees for over 100 years. As a result, we have earned a reputation for quality, safety and reliability and are sought out by our customers to solve the full range of their water treatment needs, and maintaining our reputation is critical to the success of our business.
Our vision "to be the world's first choice in water solutions" and our values of "integrity, customers and performance" foster a corporate culture that is focused on employee enablement, empowerment and accountability, which creates a highly entrepreneurial and dynamic work environment. Our purpose is "Transforming water. Enriching life." We draw from a long legacy of water treatment innovations and industry firsts, supported by more than 1,250 granted or pending patents, which in aggregate are important to our business and solution set. Our core technologies are primarily focused on removing impurities from water, rather than neutralizing them through the addition of chemicals, and we are able to achieve purification levels which are 1,000 times greater than typical drinking water.
We provide solutions across the entire water cycle. The water cycle begins with "influent" water, which is sourced from oceans, rivers, lakes, as well as other sources. We treat the influent water so that it can be used for a wide variety of industrial, commercial and municipal applications. In industrial applications, influent water, after it is treated, is used as process water for applications, such as microelectronic production, as an ingredient in the production of food and beverage and other goods and in utility applications including boiler feed water, cooling water and steam condensate. Commercial applications for influent water include laboratory testing and aquatic activities, while municipal applications for influent water include treatment to produce safe drinking water and wastewater that is compliant with applicable regulations. After the water is used it is considered "effluent water," and we enable its treatment through the removal of impurities so that it can be discharged safely back into the environment or reused for industrial, commercial or municipal applications. As our solutions span the entire water cycle, we believe we have the most comprehensive and innovative range of solutions in the entire water treatment industry. Our future growth is dependent upon our ability to accretively develop
1
and acquire products, services and solutions, adapt our businesses to meet the demands of our customers, comply with changes to government regulations and achieve market acceptance.
We have developed a broad set of well-established, unique relationships across a highly diverse customer base. These relationships produce a visible flow of reoccurring business, with approximately 58% of our revenue for fiscal 2016 derived from service, consumables and aftermarket parts that come from our repeat business and backlog. Additionally, approximately 24% of our revenue for fiscal 2016 consisted of capital orders already in backlog at the beginning of fiscal 2016, resulting in significant visibility into over 82% of our overall annual sales for fiscal 2016. In the industrial market we serve over 25,000 customers, including a substantial majority of the industrial companies within the Fortune 500. We partner with our industrial customers through our direct sales and service team, which is organized geographically and by specific end market. In the municipal market we serve over 7,800 U.S. wastewater sites and over 1,800 global drinking water treatment sites, providing solutions that help treat over 40% of the U.S. municipal wastewater sites as of June 30, 2017. Our deep institutional relationships with independent sales representatives across North America, who serve as the primary channel for new municipal water treatment projects, and upon whom we depend to successfully market and sell our products, services and solutions, provide us significant access to new projects up for bid and for servicing our installed base.
For the fiscal year ended September 30, 2016, we generated 86% of our revenues in North America with a strong and growing international presence and we currently employ approximately 4,000 individuals across eight countries. For the fiscal year ended September 30, 2016, we generated revenue, net income and Adjusted EBITDA of $1.1 billion, $13.0 million and $160.1 million, respectively. For the fiscal year ended September 30, 2016, we generated pro forma revenue, pro forma net income and Adjusted EBITDA (pro forma as adjusted for contributions from insignificant completed acquisitions) of $1.2 billion, $16.8 million and $182.4 million, respectively. For more information on Adjusted EBITDA, including a reconciliation to the most directly comparable GAAP financial measure, see "—Summary Consolidated Financial and Operating Data."
2
We serve our customers through three segments: Industrial, Municipal and Products. These segments all draw from the same reservoir of leading technologies, shared manufacturing infrastructure, common business processes and corporate philosophies. Our Industrial Segment provides fully-integrated systems and service solutions that selectively utilize our comprehensive portfolio of water treatment technologies to satisfy our customers' unique water needs. Our Municipal Segment provides engineered water treatment equipment and solutions based on our proprietary technology and odor and corrosion control services. Our Products Segment sells equipment, based on our broad technology portfolio, that is used as components in integrated solutions specified by water treatment designers and offered by OEMs, engineering firms, integrators and our own Industrial and Municipal Segments.
| |
Industrial | Municipal | Products | ||||
|---|---|---|---|---|---|---|---|
| Overview | • Tailored solutions in collaboration with our customers backed by life-cycle services including on-demand water, BOO, recycle / reuse and emergency response service alternatives to improve operational reliability, performance and environmental compliance |
• Delivers solutions, equipment and services to engineering firms, OEMs and municipalities to treat wastewater and purify drinking water |
• Highly differentiated and scalable range of products and technologies specified by global water treatment designers, OEMs, engineering firms and integrators |
||||
Channel |
• Direct sales with market vertical focus |
• Independent representative network supported by technical sales team
• Direct sales and aftermarket channels |
• Direct and indirect sales and aftermarket channels |
||||
Key offerings |
• Full lifecycle service and solutions for influent, effluent and process water, including on-demand water, BOO, recycle / reuse and emergency response services
• Equipment systems for industrial needs: influent water, boiler feed water, ultrahigh purity, process water, wastewater treatment and recycle / reuse
• Full-scale outsourcing of operations and maintenance |
• Wide range of wastewater solutions:
— Ultrafiltration membrane bioreactors
— Advanced biological treatment
— Clarifiers, aerators, screens and dewatering
— Ballasted clarification
— Odor and corrosion control equipment and services
• Ultrafiltration for drinking water
• Retrofit, rehabilitation and aftermarket |
• Filtration
— Regenerative media and microsand
— Self-cleaning filters and intake screens
• Disinfection
— Low and medium pressure ultraviolet ("UV")
— Electrochlorination and gas chlorination
• Anode technology
• Electrodeionization
• Analyzers and controllers |
||||
Percentage of FY 2016 revenue |
53% |
24% |
23% |
As depicted in the table below, we target attractive global end-markets that utilize water as a critical part of their operations or production processes including pharmaceuticals and health sciences, microelectronics, food and beverage, hydrocarbon and chemical processing, power, general manufacturing, municipal drinking water and wastewater, marine and aquatics end markets. While a decline in general global and economic conditions could adversely affect us, our business is highly
3
diversified across our key attractive and growing end markets presented below, and we believe that no single end market drives the overall results of our business.

|
• Meets stringent process and wastewater requirements in both research and development and manufacturing as defined by FDA standards |

|
• Provides equipment and support for utility water, boiler feed water, cooling water and steam condensate |
|||

|
• Enables next generation of wafer size/geometry with ultra-pure input water and treatment of contaminated wastewater |

|
• Manages water intake screens, boiler feedwater systems (including polishing using continuous electrodeionization) and condensate polishing |
|||

|
• Ensures process / product water complies with regulations for food and beverage production |

|
• Provides full service process water and wastewater treatment services supported by a mobile fleet guaranteeing maximum up-time |
|||

|
• Provides reliably clean drinking water to the largest cities in the world through integrated membrane systems and disinfection products |
|
• Provides solutions and services to the industry for marine growth prevention, biological fouling protection and ballast water treatment |
|||

|
• Develops efficient and reliable waste treatment systems to handle specific geographic needs
• Offers comprehensive and customizable odor and corrosion control solutions and services |
|
• Meets the rigorous treatment demands across aquatic applications for leisure facilities, fountains, water features and theme parks |
Industrial. Our Industrial Segment provides application-specific solutions and full lifecycle services for critical water applications. We focus on treating industrial process water, utility water and wastewater. Industrial process water requires specific purity standards, which are used in making goods in industries such as microelectronics, pharmaceuticals and health sciences and food and beverage, including ingredient water. Industrial utility water is used for critical industrial applications including boiler feed and cooling water. Industrial wastewater is effluent water discharged from plants or facilities which is treated before it is returned to the environment or recycled or reused within the water cycle. Our operations across the water cycle are complex and, if conducted improperly, may result in potential costs and liabilities, including as a result of environmental damage. Our comprehensive solutions are comprised of capital systems and related recurring aftermarket services, parts and consumables, along with long-term and short-term service contracts and emergency services. Our comprehensive capabilities range from discrete offerings to the provision of highly complex, fully integrated solutions. We are able to leverage our broad range of products and technologies to deliver a tailored solution that best addresses a specific customer's needs, including a growing portfolio of smart water technologies encompassed in our Water One platform. Key capital and related aftermarket service and product offerings include filtration, reverse osmosis, ion exchange and continuous deionization. As a result of
4
our speed, capabilities and experience, we are a trusted partner to 25,000 industrial customers, including a substantial majority of Fortune 500 industrial companies. As water is a critical component in many industrial production processes, unavailability of proper water purity, specification or quality can lead to significant constraints, downtime and increased operating costs.
The cost of an installation can range from a few thousand dollars to a few million dollars and often presents an ongoing service and aftermarket revenue opportunity that can reach or exceed the original project cost. The service and aftermarket sales component is supported by our broad application and process expertise and the largest integrated industrial service network in North America, based on management's estimate. Our network is comprised of certified technicians and the largest fleet of mobile reverse osmosis and deionization water treatment systems in North America based on management's estimate, and enables us to provide a complete range of services spanning from regular maintenance and emergency support to our unique Water One platform. Water One provides remote monitoring capabilities which enable us to optimize our routine service calls through predictive analytics and provide customers a more predictable, cost-efficient water solution. We offer services which include water on-demand, mobile solutions and smart water systems that leverage our extensive branch network, technical personnel and technology portfolio.
We market our Industrial offerings through our direct sales force, which is organized by market vertical and is complemented by an inside sales force, field sales engineers and a growing e-commerce platform.
Municipal. Our Municipal Segment provides engineered solutions and equipment for the treatment of wastewater, purification of drinking water and odor and corrosion control for municipalities. Our portfolio of solutions includes ultrafiltration systems, advanced biological treatment, clarifiers, aerators, odor and corrosion control services, equipment for new municipal plant builds and retrofit, rehabilitation and aftermarket parts and services for our extensive installed base. We have provided solutions across a large municipal installed base with capacities ranging from 25,000 gallons per day to over 100 million gallons per day. Our operations are focused within the U.S. market, with a presence in the United Kingdom, Australia, Canada and Singapore.
We maintain a comprehensive municipal representative network that broadly covers the United States, providing us with a differentiated ability to influence specifications and the basis of design for new treatment facilities. We also maintain relationships with engineering firms, operators and other key influencers through our direct technical sales force to drive adoption of our offerings.
Products. Our Products Segment sells differentiated technologies to a diverse set of water treatment system specifiers, integrators and end users globally. Our offerings are highlighted by our filtration and disinfection, electrodeionization and electrochlorination technologies, separation technologies and anodes offerings. Our filtration and disinfection offerings include our Defender line of products, which is a regenerative media filtration leader in the commercial aquatics market. Our IONPURE electrodeionization solutions allow customers to achieve ultrahigh purity water without the use of chemicals in the treatment process. Our electrochlorination products provide extensive water treatment solutions for the maritime, oil and gas and power markets. We also have extensive capabilities in anode technologies, cathodic protection, solid and liquid separation technologies and various aftermarket parts, consumables and accessories. All of our offerings are highly scalable and designed to meet current and future water treatment needs, with a focus on generating repeat business from our customers. We generally service the equipment we provide our customers; however, their failure to properly use, safeguard or maintain their equipment or product defects or unanticipated use of our products could result in liability to us.
Our portfolio of technologies and products are sold either as discrete offerings or as components of broader Evoqua solutions through our Industrial and Municipal Segments. Our Products Segment also sells externally to a customer base comprised of globally located OEMs, integrators, regional distributors, customers, regional engineering firms and various other end users that we reach through multiple established sales and aftermarket channels.
5
We estimate the global water and wastewater market to represent more than $600 billion in total revenue and include both capital and operating expenditures for the treatment and transportation of water by industrial, municipal, commercial and residential end users. Within the global water and wastewater market, we estimate our addressable market, comprised of equipment, consumables, aftermarket parts and operations-related and maintenance-related services for the treatment of water for industrial, commercial and municipal end users, to represent over $85 billion in total revenue. Our addressable market is further refined to include our served market, which is currently focused on the North American region, and totals approximately $10 billion in total revenue according to Amane Advisors. As compared to our larger addressable market, our served market excludes sectors that would require meaningful growth investment on our part to capture new customers or market opportunities. The following diagram illustrates the breakdown of total revenue in our total market and our addressable global market:
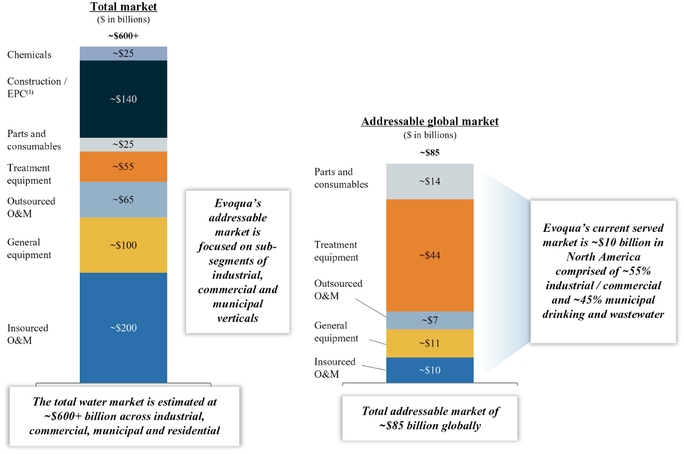
Source: Management estimates, Amane Advisors; data is as of 2016.
- (1)
- Evoqua does not provide EPC services, but does sell products and solutions to EPC firms.
While a decline in general global economic and business conditions may adversely affect demand for our products, services and solutions, we believe the global water market will continue to experience growth, supported by a variety of anticipated secular trends that will drive demand for water across a multitude of industrial, commercial and municipal applications. These secular trends include global population growth, urbanization, industrialization and overall economic growth. In addition, the supply of clean water could be adversely impacted by factors including an aging water infrastructure within North America and increased levels of water stress from seasonal rainfall, inadequate water storage options or treatment technologies. More specific to our business, water is a critical component and
6
byproduct of many processes, including in manufacturing and product development. As such, as global consumption patterns evolve and water shortages persist, demand for equipment and services will continue to increase. We estimate the global water market is expected to grow in total revenue by approximately 3% annually from 2017 to 2020, although such growth may not be concentrated in the markets that we serve or may be otherwise affected by global or regional economic conditions.
We hold the number one position, with approximately 11% market share, in the highly fragmented North American water treatment market we serve, based on fiscal 2016 revenue, according to Amane Advisors. Our approximately 11% market share is over 1.5 times that of our nearest competitor across the combined industrial, commercial and municipal market verticals, according to Amane Advisors. As a result of the complex route to market and diverse set of customers, most market participants are niche-offering focused, with a majority of the broader market served by a large number of small, regional providers. More specifically, according to Amane Advisors, the top five market participants comprised approximately 30% of the North American market share in 2016 with a significant tail of smaller, regionally focused competitors. Our leading positions in our market verticals have been cultivated by our suite of differentiated solutions and our comprehensive service network, which had over four times as many locations as our closest competitor at June 30, 2017. Despite our leading positions in the individual market verticals where we participate, our market share did not exceed 25% in any single market vertical in which we participated during fiscal 2016. We must continue to maintain and improve our competitive position, which requires focus on product performance, application expertise and compliance with environmental and regulatory requirements.
We serve three primary market verticals: (i) industrial, (ii) commercial and (iii) municipal. Industrial and commercial customers vary in size, scope and the complexity of their water treatment needs and include small manufacturing clients with a single facility, large commercial waterparks and multinational corporations with a significant global footprint. The municipal market consists of potable water and wastewater treatment solutions that are sold to municipalities and private companies operating under a concession agreement to own and operate treatment facilities on behalf of municipalities. We serve each market with a full range of solutions, services, technologies and aftermarket offerings.
Industrial and commercial markets. The served North America industrial and commercial markets represent an approximately $6 billion revenue opportunity, according to Amane Advisors. Our served North America industrial and commercial water markets consist of industrial process water, industrial utility and wastewater and commercial aquatics. Industrial process water includes the treatment of an influent water source prior to its direct use within a specific industrial application such as an ingredient in the development of a product. Industrial customers rely on specific purity standards for process water with purity needs that range from a small volume of water requiring minimal treatment to ultrapure water that support advanced manufacturing processes and are derived from highly advanced water treatment systems. Industrial utility water treatment includes solutions to remove contaminants before water is utilized to support an industrial process such as boiler feed water. Wastewater is then treated before it is either discharged to a municipal wastewater system or discharged directly to the environment or reused within the facility. Commercial aquatics include the filtration and disinfection of water within large commercial applications including pools and water parks.
The industrial market is comprised of direct end market distribution channels. The commercial market includes a variety of routes to market including direct and third-party channel relationships.
Municipal market. There were more than 19,500 municipalities in the United States as of 2012, according to the United States Census Bureau. Together, these municipalities provided drinking and wastewater services to over 282 million people in 2016, according to the United States Environmental Protection Agency (the "U.S. EPA"). According to Amane Advisors, our served municipal market in North America is estimated to be approximately $4 billion in total revenue. The criticality of water has also increased due to heightened safety standards, stricter environmental regulation and aging
7
infrastructure. The municipal market is comprised of a wide range of drinking and wastewater treatment facilities. Key market participants include engineering firms and EPC companies that drive plant design and specifications, along with local municipal sales representatives.
Number one market position in North America offering comprehensive, mission-critical lifecycle water treatment solutions. According to Amane Advisors, we are the leader in the highly fragmented approximately $10 billion North American served water treatment market across industrial, commercial and municipal process and wastewater treatment, based on our fiscal 2016 revenue. We have a global installed base that exceeds 200,000 installations and supports the full breadth of our water lifecycle solutions including application specific treatment equipment, aftermarket parts, consumables and routine or emergency service. Our approximately 11% market share in the North American water treatment market is nearly 1.5 times that of our closest competitor according to Amane Advisors, and yet we still enjoy room for growth given the highly fragmented nature of the market made up predominately of smaller, local companies. According to Amane Advisors, we operate in a highly competitive but fragmented industry, with the top five companies in our industry representing approximately 30% of the market. Our growth is supported by our global manufacturing capabilities, differentiated channels to market and deep technology reservoir.
We believe our market position is derived from our ability to provide holistic water solutions as compared to our competitors who lack both the breadth of our product and technology portfolio and our extensive North American service network. We have a vast array of products and systems with the expertise to adapt core technologies to meet specific customer needs, particularly within the industrial space. Additionally, we are able to offer our clients a full outsourced water experience with guaranteed water quality and quantity through a full suite of mobile technologies, including our national fleet of over 600 mobile treatment assets as of June 30, 2017.
Positioned to capitalize on favorable industry growth dynamics and benefit from diverse end-market exposure. While a decline in general global economic and business conditions may adversely affect demand for our products, services and solutions, water treatment is an essential, non-discretionary market that is growing in importance as access to clean water has become an international priority. A number of global, long-term secular trends underpin anticipated industry growth dynamics and have resulted in increasingly stringent effluent regulations along with a growing demand for cleaner and sustainable waste streams for reuse. These trends include the growing global population, increasing levels of urbanization and continued global economic growth. We have seen these trends manifest themselves within our various end markets creating multiple avenues of growth, but we are unable to predict the impact of potential countervailing considerations. For example, within the industrial market, water is an integral component in the production of a wide range of goods spanning from consumer electronics to automobiles. Additionally, recent events such as the crisis in Flint, Michigan have renewed focus on clean drinking water in the United States, which, combined with a historical increases in infrastructure investment, translates to growing demand for our solutions and services in the municipal market. Furthermore, our long-standing reputation among engineering firms and independent sales representatives positions us to benefit from increased municipal demand, particularly as water treatment plants are upgraded and expanded.
Given the wide use and importance of water, we enjoy low concentration within our end markets, with no single market vertical comprising over 19% of our revenue and no single customer comprising over 1% of our revenue for the fiscal year ended September 30, 2016. As a result, we believe our business is diversified and insulated from dislocations in specific market verticals. We estimate our end markets are growing at a weighted average of approximately 3% per annum. Further, we believe many of our end markets represents significant market opportunities because they are highly fragmented and not yet fully penetrated.
8
Unparalleled channels to market and service network to support our diversified, blue-chip customer base. With over four times as many branches as our next largest competitor based on management's estimates and analysis, our 86 service branches are located within a two-hour drive of more than 90% of our more than 25,000 industrial customer sites in North America. Across our global service branches, we have nearly 600 sales and support personnel and 800 field technicians. We believe our direct sales force is important to our customers. Most of our sales personnel are assigned to specific end markets and possess extensive application-specific knowledge, allowing us to provide customized and fully integrated solutions leading to a unique level of intimacy with our end users. Our continued success depends on our ability to retain or attract skilled technical, engineering, sales and other key personnel, for whom competition is intense, both in retaining our existing employees and in replacing or finding additional employees. We complement our sales approach with our Global Corporate Accounts Management team, which we use to drive greater penetration across our extensive portfolio of large blue-chip customers and engineering firms. The efforts of our sales force are further enhanced by the ongoing dialogue and interactions our field technicians have with customers, which provides us real-time feedback and serve as a source of leads on new sales opportunities. We also have a growing global product network that provides us access to commercial opportunities beyond our installed base and core geographic regions. Overall, we believe that our channels to market play a key role in our success in our core market while also allowing us to rapidly commercialize new technologies as well as scale tuck-in acquisitions. Further, our customer base consists of over 38,000 customers including a substantial majority of the industrial companies within the Fortune 500 and spans a wide array of end-markets. We face low customer concentration, with no single customer accounting for over 1% of our revenue for the fiscal year ended September 30, 2016.
Iconic brands supported by leading proprietary and differentiated technologies. We believe our brands are known across the water treatment marketplace for innovation, quality, customer service, safety and reliability. Our customers' familiarity with our brands enhances our sales capabilities and allows us to more effectively engage existing and new customers. Our reputation depends on our ability to provide our industry-leading water treatment solution offering, and we have a number of patent-protected cornerstone technologies that support our business. Leveraging these technologies allows us to offer solutions across the entire spectrum of the water treatment lifecycle. Our innovation process is supported through six global research, development and engineering ("RD&E") facilities, along with partnerships spanning leading universities research centers and other outside agencies. Our internal RD&E framework, the Evoqua Innovation Process, is fully deployed and uses a stage-gate approach to identifying, prioritizing and implementing innovation projects across the organization.
Our innovation platform has generated an extensive portfolio of intellectual property with more than 1,250 granted or pending patents. In the fiscal year ended September 30, 2016, excluding parts and service, approximately 47% of our revenue was directly or indirectly covered by our granted or pending patents. Our core and established technologies include electrodeionization and advanced oxidation, which allow for chemical free ultra-high purity water solutions; Water One, which leverages advanced sensing and analytics to provide water on demand, remote condition monitoring and predictive maintenance; and mobile treatment services, which provide expedited services in emergency situations. Our newly developed and acquired technologies include our recently acquired Defender line of regenerative media filtration, which is a leader in commercial aquatics filtration; BioMag and CoMag, which address the need for capital-light solutions to increase throughput within municipal treatment facilities; and SeaCURE, which treats ballast water in order to actively remove, kill or inactivate organisms before discharge. We must continue to develop and acquire new products, services and solutions to meet the demands of our customers and compete in our markets. Our current pipeline of technologies in development includes biological wastewater diffused aeration, on-site electrolytic chlorination and electrochemical desalination, which are designed to help lower customer costs and expand our market reach.
9
Stable, recurring flow of business with a large installed base drives superior topline visibility. We had high visibility into over 82% of our overall revenue at the beginning of fiscal 2016. Approximately 58% of our revenue for fiscal 2016 was related to service, consumables and aftermarket parts that come from our repeat business and backlog. A portion of this revenue is covered by annual and multi-year industrial contracts that had a 98% and 99% renewal rate in fiscal 2015 and 2016, respectively. We generate service and aftermarket revenue from a wide range of activities, including the regular delivery and installation of consumable ion-exchange replacement bottles across 25,000 industrial customer sites and the regular replacement of approximately 400,000 ultra-filtration membranes installed across 1,800 locations on 4-6 year cycles as of June 30, 2017. In particular, more than 80% of Industrial customers who purchased capital equipment during the two fiscal years ended September 30, 2015 and 2016 have also purchased services and/or aftermarket products over the past three years. Approximately 24% of our revenue for fiscal 2016 consisted of capital orders already contracted in backlog. The remaining approximately 18% of revenue for the fiscal year ended September 30, 2016 represented book-to-bill projects, which we typically win and convert to revenue within the same fiscal year. For our capital related sales, we selectively focus on projects that we believe have the potential to produce continuing service, aftermarket and consumables sales. We believe the visibility and predictability we experience with our revenue enhances our ability to consistently drive profitability.
Well invested manufacturing and service footprint provides operating leverage and supports our growth. We believe our manufacturing, service and sales functions are capable of supporting our long-term growth targets. Our manufacturing base is currently operating at approximately 40% of its maximum capacity levels at June 30, 2017, creating an opportunity for volume and margin expansion without significant new capital investments. This dynamic also enhances our ability to absorb new acquisitions into our existing operations, though we may not be able to successfully identify, integrate or compete for acquisition targets. We have also identified and are pursuing several operational improvement campaigns including ePro and LEAN, our supply chain excellence initiative that centralizes and standardizes purchasing across the organization. These initiatives, combined with low levels of maintenance capital expenditures and efficient working capital management, create flexibility to deploy cash flow for accretive investments.
Experienced management team with proven operational capabilities that has made Evoqua an employer of choice. We are highly dependent on our leadership team, which consists of industry veterans with a track record of executing effective strategies and achieving profitable growth. Ron Keating, our CEO, is a highly experienced executive with a strategic, commercial and operational background developed in senior roles, where he reshaped organizations and corporate portfolios for growth. Ben Stas, our CFO, has held a variety of senior financial and business roles in the capital goods sector. Our leadership developed and deployed standard operating processes under the Evoqua Growth System that repositioned the business and improved margins through operational programs and standards such as LEAN operating systems, service growth and ePro, among others. These programs, combined with our newly implemented sales methodology, Evoqua EDGE, have improved our free cash flow profile and growth prospects. Our management team has also expanded our operations to new target markets and geographies and has demonstrated successful acquisition and integration capabilities. Our success depends to a significant extent on our ability to retain or attract employees in senior management, skilled technical, engineering, sales and other key personnel.
After the AEA Acquisition, we began a transformation of our business into a global organization with an independent, professional management team. We believe our transformation has made us into a premier partner and employer in our industry, resulting in differentiated capabilities and talent within our organization. We have instilled an entrepreneurial environment where employees believe in the mission and leverage the collective intellect and expertise of service technicians and engineers. To develop a safety focused culture, we have invested heavily in our environmental, health and safety ("EH&S") program, which is committed to providing employees with a safe and healthy workplace
10
while protecting our shared environment. Following the completion of this offering, we expect to be a "controlled company" within the meaning of the corporate governance standards of the NYSE. See "Risk Factors—Risks Relating to our Common Stock and this Offering—We are a 'controlled company' within the meaning of the corporate governance standards of the NYSE and, as a result, will qualify for, and may rely on, exemptions from certain corporate governance requirements."
The key elements of our strategy include:
Grow and further penetrate our existing customer base. We believe our strong brands, leading position in highly fragmented markets, scalable and global offerings, leading installed base and unique ability to provide complete treatment solutions will enable us to capture a larger share of our existing customers' water treatment spend while expanding with existing and new customers into adjacent end-markets and underpenetrated regions, including by investing in our sales force and cross-selling to existing customers. Despite having the leading market share in the North American water treatment market, our share does not exceed 25% in any single market vertical according to Amane Advisors. Furthermore, our share of any given customer's water treatment related spend is often limited to select regions, thereby creating a significant opportunity to further penetrate existing customer accounts by offering additional solutions and serving more sites, both in current and new geographic regions. Our growth initiatives include both expanding our presence in our core North American market as well as replicating our leading position and strategies into underpenetrated global regions. For example, through innovative technologies such as IONPURE continuous electrodeionization and Defender aquatic regenerative media filtration systems, we have expanded our positions in markets such as Asia and the Middle East.
In order to maintain and enhance our customer relationships, we intend to continue to invest in our sales force. Since fiscal 2014 we have increased the proportion of customer facing employees by over 25%, developed a best-in-class training program, restructured our customer relationship management system and realigned our compensation packages. Sales of our products, services and solutions to some of our customers are also accomplished, in part, through the efforts of third-party sales representatives. Through direct sales efforts, outreach and education, we plan to continue to enhance our relationships and enable further adoption of our products, technologies and solutions by end customers and key influencers, including municipal representatives, engineering firms, designers and other system specifiers. Our performance depends, in part, on our ability to attract, incentivize and retain third-party sales representatives that will be able to market and support our products effectively, and competition for sales personnel with established customer relationships is intense.
Continued transition of our customers to a higher value-add service-based business model. Our goal is to provide "worry-free water" by combining our products and technologies with extensive service and distribution capabilities. We selectively target high value projects with opportunities for recurring business through service, parts and other aftermarket opportunities over the lifecycle of the process or capital equipment. In particular, we have developed a pipeline of smart, internet-connected monitoring technologies through the deployment of our Water One smart water platform that provides us with an increasing ability to handle our customers' complete water needs through on-demand water management, predictive maintenance and service response planning. Water One also enables us to transition our customers to more accurate pricing models based on usage, which otherwise would not have been possible without technological advancement. We estimate that approximately 1.6% of our industrial customers utilized our Water One technology in fiscal 2016. Our technology solutions provide customers with increased stability and predictability in water-related costs, while enabling us to optimize our service route network and on demand offerings through predictive analytics, which we believe will result in market share gains, improved service levels, increased barriers to entry and reduced costs. Our future growth depends, in part, on our ability to develop or acquire new products, services and
11
solutions, identify emerging technological trends in our target end markets and maintain the integrity of our information technology systems.
Drive margin expansion and cash flow improvements through continued focus on operational excellence and execution. Since fiscal 2014, we have realigned our organizational structure, achieved significant cost savings through operational efficiencies and revitalized our culture, which has energized our workforce and reduced employee turnover. This organizational realignment transformed our business into a streamlined organization focused on improved accountability, responsiveness and resulted in an overall lower cost structure. We have identified and are pursuing a number of discrete initiatives which, if successful, we expect could result in additional cost savings over the next three years. These initiatives include our ePro and supply chain improvement program to consolidate and manage global spending, our improved logistics and transportation management program, further optimizing our engineering cost structure, capturing benefits of our Water One remote system monitoring and data analytics offerings. Furthermore, as a result of significant investments we have made in our footprint and facilities, we believe have capacity to support our planned growth without commensurate increases in fixed costs.
Commercialize and drive adoption of nascent and newly acquired technologies by leveraging our sales channels and application expertise. We offer a full range of services, systems and technologies that we must continually develop to meet our customers' evolving water lifecycle needs. We develop our technologies through in-house research, development and engineering and targeted tuck-in, technology-enhancing and geography-expanding acquisitions and have a reservoir of recently launched technologies and a pipeline of new offerings designed to provide customers with innovative, value-enhancing solutions. Furthermore, we have successfully completed eight technology-enhancing and geography-expanding acquisitions since April 2016 to add new capabilities and cross-selling opportunities in areas such as electrochemical and electrochlorination cells, regenerative media filtration, anodes, UV disinfection and aerobic and anaerobic biological treatment technologies. We must continue to develop and acquire new products, services and solutions to successfully compete in our markets.
We believe a key differentiator for our technology development program is our strong record of incorporating new technologies into the comprehensive solutions we provide to our customers across our platform. We are able to rapidly scale new technologies using our leading direct and third-party sales channels and our relationships with key influencers, including municipal representatives, engineering firms, designers and other system specifiers. Through our service network, we have a direct view of our customers' water needs which allows us to focus on developing and acquiring the most relevant and sought-after solutions.
We believe our continued investment in driving penetration of our recently launched technologies, robust pipeline of new capabilities and best-in-class channels to market will allow us to continue to address our customer needs across the water lifecycle.
Continue to evaluate and pursue accretive tuck-in acquisitions to add new technologies, attractive geographic regions and end-markets. As a complement to our organic growth initiatives, we view tuck-in acquisitions as a key element of our overall growth strategy which will enable us to accelerate our growth in our current addressable market, new geographies and new end market verticals. Our existing customer relationships, channels to market and ability to rapidly commercialize technologies provide a strong platform to drive growth in the businesses we acquire. To capitalize on these opportunities we have built an experienced team dedicated to mergers and acquisitions that has successfully completed eight technology-enhancing and geography-expanding acquisitions since April 2016, including the addition of capabilities in the attractive aquatics market, which we have typically financed through borrowings under our revolving credit facility and cash on hand. Although we may not continue to identify suitable acquisition targets and implement our growth strategy, we currently have a pipeline
12
which includes more than 60 potential targets, which has been developed proactively by our team as well as informed by our customer base.
AEA is one of the most experienced global private investment firms. Founded in 1968, AEA currently manages approximately $10 billion of capital for an investor group that includes former and current chief executive officers of major multinational corporations, family groups and institutional investors from around the world. With a staff of approximately 60 investment professionals and offices in New York, Stamford, London, Munich and Shanghai, AEA focuses on investing in companies in the consumer products/retail, industrial, specialty chemicals and related services sectors.
In addition to Evoqua, representative current and former value-added industrial products portfolio companies include B.I. Incorporated, BOA Group, CPG International, Dematic, GMS, Henry Company, Houghton International, LoneStar Group, Mettler-Toledo International, NES Global Talent, Noveon International, Pregis Corporation, Pro Mach Group, Reladyne, Sparrows Group, SRS Distribution, Symrise, TricorBraun Holdings, Unifrax Corporation, VC GB Holdings and Waters Corporation.
After completion of this offering, we expect to be a "controlled company" within the meaning of the corporate governance standards of the NYSE. See "Risk Factors—Risks Relating to Our Common Stock and this Offering—We are a 'controlled company' within the meaning of the corporate governance standards of the NYSE and, as a result, will qualify for, and may rely on, exemptions from certain corporate governance requirements."
Risks Associated with Our Business
We are subject to a number of risks, including risks that may prevent us from achieving our business objectives or that may adversely affect our business, financial condition, results of operations or prospects. You should carefully consider the risks discussed in the section entitled "Risk Factors," including the following risks, before investing in our common stock:
- •
- general global economic and business conditions may adversely affect demand for our products, services and solutions;
- •
- failure to compete successfully in our markets could adversely affect our business, financial condition, results of operations or prospects;
- •
- our future growth is dependent upon our ability to continue to develop and acquire our products, services and solutions and adapt our
businesses to meet the demands of our customers, comply with changes to government regulations and achieve market acceptance with acceptable margins;
- •
- our growth strategy includes acquisitions, and we may not be able to identify suitable acquisition targets or otherwise successfully implement
our growth strategy;
- •
- we may have difficulty in operating or integrating any acquired businesses, assets or product lines profitably or in otherwise successfully
implementing our growth strategy;
- •
- delays in enactment or repeals of environmental laws and regulations may make our products, services and solutions less economically beneficial
to our customers, thereby affecting demand for our products, services and solutions;
- •
- if we become subject to claims relating to handling, storage, release or disposal of hazardous materials, we could incur significant cost and
time to comply;
- •
- product defects and unanticipated or improper use of our products could adversely affect our business, reputation and financial statements;
13
- •
- we may incur liabilities to customers as a result of warranty claims or failure to meet performance guarantees, which could reduce our
profitability;
- •
- our inability to meet our customers' safety standards or adverse publicity affecting our reputation as a result of incidents such as workplace
accidents, mechanical failures, spills, uncontrolled discharges, damage to customer or third-party property or the transmission of contaminants or diseases could have a material adverse effect on our
sales and profitability;
- •
- our products, services and solutions, or our participation in large-scale projects, could expose us to litigation, regulatory or enforcement
actions and reputational risk;
- •
- seasonality of sales and weather conditions may adversely affect, or cause volatility in, our financial results;
- •
- government customers involve unique policy-, contract- and performance-related risks, and we face many challenges to our government contracts
or our eligibility to serve government customers, any of which could materially adversely impact our business, financial condition, results of operations or prospects;
- •
- our contracts with federal, state and local governments may be terminated or adversely modified prior to completion, which could adversely
affect our business;
- •
- the cost of complying with complex governmental regulations applicable to our business, sanctions resulting from non-compliance or reduced
demand resulting from certain changes in regulations could increase our operating costs and reduce our profit;
- •
- wastewater operations entail significant risks that may impose significant costs;
- •
- we are increasingly dependent on the continuous and reliable operation of our information technology systems, and a disruption of these systems
could materially adversely affect our business;
- •
- if we experience a significant data security breach or fail to detect and appropriately respond to a significant data security breach, our
business and reputation could suffer;
- •
- our substantial indebtedness could, among other things, adversely affect our financial condition, reduce or limit our available cash flows and
ability to raise additional capital to fund our operations or strategic transactions, and have other important consequences to us, including making it more difficult for us to satisfy our debt
obligations, exposing us to the risk of increased interest rates, limiting our flexibility in planning for, and reacting to changes in, our business and industry and placing us at a disadvantage
relative to our competitors;
- •
- because AEA controls a significant percentage of our common stock, it may influence all major corporate decisions, and the interests of AEA and
its affiliates, including certain of our directors, may conflict with your interests as an owner of our common stock and those of the Company; and
- •
- we are a "controlled company" within the meaning of the corporate governance standards of the NYSE and, as a result, will qualify for, and may rely on, exemptions from certain corporate governance requirements.
Headquarters Move
On July 28, 2017, we moved our world headquarters and its approximately 200 employees from our Warrendale, Pennsylvania offices to 210 Sixth Avenue in Pittsburgh, Pennsylvania's Central Business District. We currently lease three floors at 210 Sixth Avenue, with an initial lease term of 10 years covering approximately 60,000 square feet of space. We retain certain options to expand the amount of space we occupy and to extend the term of the lease.
14
August 2017 Refinancing
On August 8, 2017, EWT Holdings II Corp., as the parent guarantor, EWT Holdings III Corp., as the borrower, and certain wholly-owned subsidiaries of EWT Holdings II Corp., entered into the August 2017 Amendment to the First Lien Credit Agreement.
Prior to the August 2017 Refinancing, the Term Loan Facility consisted of (i) the term loans made on January 15, 2014 and the October 2016 Incremental Loans (the "Existing Term Loan Tranche") and (ii) the NB Incremental Loans. Pursuant to the August 2017 Amendment, we incurred approximately $262.7 million of refinancing term loans (the "August 2017 Refinancing Loans"), the net proceeds of which were used to refinance the NB Incremental Loans in their entirety. As a result of such refinancing, the Term Loan Facility now consists of a single tranche of term loans, comprised of the term loans made on January 15, 2014, the October 2016 Incremental Loans, the August 2017 Refinancing Loans and the August 2017 Incremental Loans (as defined below).
Pursuant to the August 2017 Refinancing, we also incurred approximately $80.0 million of incremental term loans (the "August 2017 Incremental Loans"), the net proceeds of which were used to repay $60.0 million of revolving credit loans then outstanding and to pay fees and expenses in connection with the transactions thereunder and for other general corporate purposes.
As of August 8, 2017, the terms of the Term Loan Facility are now consistent with the terms of the Existing Term Loan Tranche (including with respect to pricing) and the provisions governing the NB Incremental Loans contained in Incremental Term Facility Amendment No. 1, dated as of April 15, 2016, to the First Lien Credit Agreement, are superseded in their entirety by the terms of the August 2017 Refinancing. As of June 30, 2017, we had $898.7 million of borrowings under the Term Loan Facility, after giving effect to the August 2017 Refinancing.
Preliminary Financial Results for the Three Months and Fiscal Year Ended September 30, 2017
Our preliminary estimated unaudited financial results as of and for the three months and fiscal year ended September 30, 2017 are set forth below. Our estimates of results are based solely on information available to us as of the date of this prospectus and are inherently uncertain and subject to change due to a variety of business, economic and competitive risks and uncertainties, many of which are not within our control, and we undertake no obligation to update this information. Our estimates contained in this prospectus are forward-looking statements. Actual results remain subject to the completion of management's and our audit committee's final reviews and our other financial closing procedures, as well as the completion of the audit of our annual consolidated financial statements, as described below. Our actual consolidated financial statements and related notes as of and for the fiscal year ended September 30, 2017 are not expected to be filed with the SEC until after this offering is completed. During the course of the preparation of our actual consolidated financial statements and related notes, additional items that would require material adjustments to the preliminary estimated financial information presented below may be identified. See "Management's Discussion and Analysis of Financial Condition and Results of Operations—Critical Accounting Policies and Estimates—Use of Estimates," "Risk Factors—Risks Relating to Our Business" and "Cautionary Note Regarding Forward-Looking Statements" included elsewhere in this prospectus.
The preliminary financial data included in this prospectus have been prepared by and are the responsibility of our management. Our independent accountant, Ernst & Young LLP, has not audited, reviewed, compiled or performed any procedures with respect to the preliminary financial data. Accordingly, Ernst & Young LLP does not express an opinion or any other form of assurance with respect thereto.
These estimates are not a comprehensive statement of our financial results as of and for the three months or fiscal year ended September 30, 2017, and should not be viewed as a substitute for full financial statements prepared in accordance with GAAP. In addition, these preliminary estimates as of
15
and for the three months and fiscal year ended September 30, 2017 are not necessarily indicative of the results to be achieved in any future period.
As reflected below, we expect to report increases in revenues, net income and Adjusted EBITDA for the three months ended September 30, 2017 as compared to the comparable prior period. Also, we expect to report an increase in revenue, a decrease in net income, and an increase in Adjusted EBITDA for the fiscal year ended September 30, 2017 as compared to the comparable prior period.
- •
- For the three months ended September 30, 2017, we expect to report revenues in the range of $354.0 million to
$357.0 million, as compared to $319.4 million for the three months ended September 30, 2016. The increase in revenues for the period was driven by organic revenue growth related
to capital project activity, growth in Electro-catalytic equipment sales in global marine and hydrocarbon markets and increased sales of disinfection products, as well as growth in Industrial services
provided to our U.S. power, hydrocarbon and chemical processing customer base. Additionally, the increase in revenues for the period was attributable to acquisitions completed in the current and
latter part of the prior year, including VAF and Delta UV in fiscal 2016 and ETS, Noble, ADI and Olson in fiscal 2017, which revenue increase was somewhat offset by revenues related to our Vernon
location in the three months ended September 30, 2016 that did not reoccur because of the disposition of that location as of September 30, 2016.
- •
- For the fiscal year ended September 30, 2017, we expect to report revenues in the range of $1,245.0 million to
$1,248.0 million, as compared to revenues of $1,137.2 million and pro forma revenues of $1,171.4 million for the fiscal year ended September 30, 2016. The increase in
revenues year over year was driven by an increase in organic revenue growth related to Industrial service revenue associated with new business in power, hydrocarbon and chemical processing end
markets. In addition, higher U.S.-customer production levels in the general manufacturing and pharmaceutical and healthcare end markets contributed to service growth. Organic revenue growth was also
favorably impacted by increased revenue associated with our power and microelectronics markets in the Asia region, as well as growth in disinfection product sales and increased capital project
activity. In addition to organic revenue growth, the increase in revenues year over year was attributable to the full year impact of the acquisitions of Neptune-Benson, VAF, Delta UV and Magneto.
Fiscal 2017 acquisitions of ETS, Noble, ADI and Olson also contributed to revenue growth as compared to the prior year. These increases were somewhat offset by revenues related to our Vernon location
in fiscal year 2016 that did not reoccur because of the disposition of that location as of September 30, 2016.
- •
- We expect to report net income in the range of $12.0 million to $12.8 million for the three months ended September 30,
2017 as compared to a net income of $0.2 million for the three months ended September 30, 2016. The increase in net income in this period was driven primarily by the increased volume and
profitability associated with organic revenue growth and acquisitions, as well as the incremental benefits from restructuring activities and operational efficiencies that were implemented in the prior
year (net of charges from additional restructuring actions taken in the current period).
- •
- We expect to report net income in the range of $5.5 million to $6.3 million for the fiscal year ended September 30, 2017 as compared to net income of $13.0 million and pro forma net income of $16.8 million for the fiscal year ended September 30, 2016. The decrease in net income in this period was driven primarily by the recognition of income tax benefit in the prior period of approximately $18.4 million as compared to income tax expense in the range of $7.0 million to $8.0 million in the current period. Additionally, there was an increase in interest expense in the current period in the range of $55.0 million to $55.5 million as compared to interest expense in the prior period of approximately $42.5 million ($52.3 million pro forma). These factors offset the increased revenue volume and profitability associated organic revenue
16
- •
- We expect to report Adjusted EBITDA in the range of $69.0 million to $72.0 million for the three months ended
September 30, 2017 as compared to $59.4 million for the three months ended September 30, 2016. Increased organic revenue volume and the benefits of restructuring and operational
efficiencies across the business contributed to the increase in Adjusted EBITDA for the three months ended September 30, 2017. In addition, the increase in Adjusted EBITDA was attributable to
acquisitions completed in the current and latter part of the prior year, including VAF and Delta UV in fiscal 2016 and ETS, Noble, ADI and Olson in fiscal 2017. Please see below for a reconciliation
of our net income (loss) to our Adjusted EBITDA.
- •
- We expect to report Adjusted EBITDA in the range of $205.0 million to $208.0 million for the fiscal year ended September 30, 2017 as compared to Adjusted EBITDA of $160.1 million for the fiscal year ended September 30, 2016. In addition, we expect to report Adjusted EBITDA (as adjusted for contributions from insignificant completed acquisitions) in the range of $214.3 million to $217.3 million for the fiscal year ended September 30, 2017 as compared to Adjusted EBITDA (pro forma as adjusted for contributions from insignificant completed acquisitions) of $182.5 million for the fiscal year ended September 30, 2016. Adjusted EBITDA was favorably impacted by increased organic revenue volume and the benefits of restructuring and operational efficiencies across the business. In addition, the increase in Adjusted EBITDA year over year was attributable to the acquisitions of Neptune-Benson, VAF, Delta UV and Magneto. Fiscal 2017 acquisitions of ETS, Noble, ADI and Olson also contributed to Adjusted EBITDA growth as compared to the prior year. Please see below for a reconciliation of our net income to our Adjusted EBITDA.
growth and acquisitions and operational efficiencies that were implemented in the prior year (net of charges from additional restructuring actions taken in the current period).
The following information as of and for the three months and the fiscal year ended September 30, 2017 sets forth the low and high ends of the ranges of our preliminary estimated financial data. As noted above, each of the line items presented below represents our preliminary estimated unaudited financial results which remain subject to the completion of management's and our audit committee's final reviews and our other financial closing procedures, as well as the completion of the audit of our annual consolidated financial statements. During the course of the preparation of the consolidated financial statements and related notes, additional information may cause a change in, or require material adjustments to, certain accounting estimates and other financial information, in particular, estimates and financial information related to our Restructuring and related business transformation costs and our Income tax (benefit) expense, which would impact net income and Adjusted EBITDA.
| |
Three Months Ended September 30, |
Fiscal Year Ended September 30, |
||||||||||||||||||||
|---|---|---|---|---|---|---|---|---|---|---|---|---|---|---|---|---|---|---|---|---|---|---|
| |
2017 | 2016 | 2017 | 2016 | ||||||||||||||||||
| |
Low | High | |
Low | High | |
|
|||||||||||||||
| |
(estimated) |
(historical) |
(estimated) |
(pro forma)(1) |
(historical) |
|||||||||||||||||
| |
(in thousands) |
(in thousands) |
||||||||||||||||||||
Revenue from product sales and services |
$ | 354,000 | $ | 357,000 | $ | 319,408 | $ | 1,245,000 | $ | 1,248,000 | $ | 1,171,389 | $ | 1,137,196 | ||||||||
Net income |
$ | 12,000 | $ | 12,800 | $ | 165 | $ | 5,500 | $ | 6,300 | $ | 13,121 | $ | 13,031 | ||||||||
Adjusted EBITDA(2) |
$ | 69,000 | $ | 72,000 | $ | 59,421 | $ | 205,000 | $ | 208,000 | $ | 168,528 | $ | 160,053 | ||||||||
Adjusted EBITDA (as adjusted for insignificant completed acquisitions)(2) |
$ | 214,287 | $ | 217,287 | $ | 182,449 | ||||||||||||||||
- (1)
- The unaudited summary pro forma financial information for the fiscal year ended September 30, 2016 has been derived from our unaudited pro forma consolidated financial information included in this prospectus under "Unaudited Pro Forma Financial Information" and has been prepared to give effect to the transactions described in this prospectus under "Unaudited Pro Forma Financial Information" as if they had occurred on the dates discussed
17
therein. See "Unaudited Pro Forma Financial Information" for a complete description of the adjustments and assumptions underlying the unaudited summary pro forma financial information.
- (2)
- For the definition of Adjusted EBITDA and further descriptions of the amounts below, see footnote 2 to the table under the heading "Prospectus Summary—Summary Consolidated Financial and Operating Data." The following is a reconciliation of our net income (loss) to our Adjusted EBITDA for the periods presented:
| |
Three Months Ended September 30, |
Fiscal Year Ended September 30, |
||||||||||||||||||||
|---|---|---|---|---|---|---|---|---|---|---|---|---|---|---|---|---|---|---|---|---|---|---|
| |
2017 | 2016 | 2017 | 2016 | ||||||||||||||||||
| |
Low | High | |
Low | High | |
|
|||||||||||||||
| |
(estimated) |
(historical) |
(estimated) |
(pro forma)(1) |
(historical) |
|||||||||||||||||
| |
(in thousands) |
(in thousands) |
||||||||||||||||||||
Net income |
$ | 12,000 | $ | 12,800 | $ | 165 | $ | 5,500 | $ | 6,300 | $ | 13,121 | $ | 13,031 | ||||||||
Interest expense |
15,000 | 17,000 | 13,051 | 55,000 | 55,500 | 52,250 | 42,518 | |||||||||||||||
Income tax (benefit) expense |
7,000 | 7,700 | 2,025 | 7,000 | 8,000 | (18,345 | ) | (18,394 | ) | |||||||||||||
Depreciation and amortization |
22,000 | 23,000 | 18,303 | 77,500 | 78,000 | 73,751 | 69,289 | |||||||||||||||
EBITDA |
57,000 |
59,100 |
33,544 |
145,000 |
147,800 |
120,777 |
106,444 |
|||||||||||||||
Restructuring and related business transformation costs(a) |
14,500 | 15,200 | 24,867 | 50,500 | 51,500 | $ | 43,075 | $ | 43,075 | |||||||||||||
Purchase accounting adjustment costs(b) |
— | — | 1,267 | 200 | 250 | 1,267 | 1,267 | |||||||||||||||
Stock-based compensation(c) |
500 | 650 | 553 | 2,250 | 2,450 | 1,999 | 1,999 | |||||||||||||||
Sponsor fees(d) |
900 | 1,150 | 948 | 4,050 | 4,200 | — | 3,758 | |||||||||||||||
Transaction costs(e) |
1,400 | 1,700 | 1,431 | 7,000 | 7,400 | 3,274 | 5,374 | |||||||||||||||
Other gains, losses and expenses(f) |
(5,300 | ) | (5,800 | ) | (3,189 | ) | (4,000 | ) | (5,600 | ) | (1,864 | ) | (1,864 | ) | ||||||||
Adjusted EBITDA |
$ |
69,000 |
$ |
72,000 |
$ |
59,421 |
$ |
205,000 |
$ |
208,000 |
$ |
168,528 |
$ |
160,053 |
||||||||
| | | | | | | | | | | | | | | | | | | | | | | |
| | | | | | | | | | | | | | | | | | | | | | | |
| | | | | | | | | | | | | | | | | | | | | | | |
Contributions from insignificant completed acquisitions(g) |
9,287 | 9,287 | 13,921 | |||||||||||||||||||
| | | | | | | | | | | | | | | | | | | | | | | |
Adjusted EBITDA (pro forma as adjusted for insignificant completed acquisitions) |
$ | 214,287 | $ | 217,287 | $ | 182,449 | ||||||||||||||||
| | | | | | | | | | | | | | | | | | | | | | | |
| | | | | | | | | | | | | | | | | | | | | | | |
| | | | | | | | | | | | | | | | | | | | | | | |
- (a)
- Represents:
- (i)
- costs
and expenses in connection with various restructuring initiatives since the AEA Acquisition, including severance costs, relocation costs, recruiting expenses,
write-offs of inventory and fixed assets and third-party consultant costs to assist with these initiatives (includes (A) $16.9 million in fiscal 2016 (all of which is reflected as a
component of Restructuring charges in "Note 12—Restructuring and Related Charges" to our audited consolidated financial statements), a range of $19.8 million to
$20.2 million in fiscal 2017, $16.9 million for the three months ended September 30, 2016 and a range of $0.9 million to $1.0 million in the three months ended
September 30, 2017 related to our voluntary separation plan pursuant to which approximately 220 employees accepted separation packages, and (B) $11.1 million (all of which is
reflected as a component of Restructuring charges in "Note 12—Restructuring and Related Charges" to our audited consolidated financial statements) in fiscal 2016, a range of
$13.0 million to $13.2 million in fiscal 2017, $1.8 million for the three months ended September 30, 2016, reflected as a components of Cost of product sales and services
($0.3 million), Sales and marketing expense ($0.3 million), Research and development expense ($0.1 million), General and administrative expense ($1.0 million), and Other
income/expense ($0.1 million), and a range of $6.5 million to $6.8 million in the three months ended September 30, 2017 related to various other initiatives implemented to
restructure and reorganize our business as a standalone business with an appropriate management team and cost structure);
- (ii)
- legal settlement costs and intellectual property related fees associated with legacy matters prior to the AEA Acquisition, including fees and settlement costs related to product warranty litigation on MEMCOR products and certain discontinued products ($5.1 million in fiscal 2016, reflected as components of Cost of product sales and services ($2.0 million) and General and administrative expense ($3.1 million), a range of $2.4 to $2.5 million in fiscal 2017, $2.6 million for the three months ended September 30, 2016, primarily reflected as a component of General and administrative expense, and a range of $0.7 million to $0.8 million in the three months ended September 30, 2017);
18
- (iii)
- expenses
associated with our information technology and functional infrastructure transformation following the AEA Acquisition, including activities to optimize
information technology systems and functional infrastructure processes for a standalone business ($9.5 million, primarily reflected as components of Cost of product sales and services
($3.6 million), Sales and marketing expense ($2.5 million), General and administrative expense ($3.1 million) and Research and development expense ($0.3 million) in fiscal
2016, a range of $7.1 million to $7.4 million in fiscal 2017, $3.4 million for the three months ended September 30, 2016, primarily reflected as components of Cost of
product sales and services ($1.5 million), Research and development expense ($0.1 million), Sales and marketing expense ($0.8 million) and General and administrative expense
($1.0 million), and a range of $2.5 million to $2.7 million in the three months ended September 30, 2017); and
- (iv)
- costs
incurred by us in connection with this offering, including consultant costs and public company compliance costs ($0.5 million in fiscal 2016, a range
of $8.2 million to $8.4 million in fiscal 2017, $0.2 million for the three months ended September 30, 2016 and a range of $4.0 million to $4.1 million in the
three months ended September 30, 2017, all reflected as a component of General and administrative expense).
- (b)
- Represents
adjustments for the effect of the purchase accounting step-up in the value of inventory to fair value recognized in cost of goods sold as a result of the
AEA Acquisition and the acquisition of Magneto.
- (c)
- Represents
non-cash stock-based compensation expenses related to option awards. See Note 15 to our audited financial statements included elsewhere in this
prospectus for further detail.
- (d)
- Represents
management fees paid to AEA pursuant to the management agreement. Pursuant to the management agreement, AEA provided advisory and consulting services to
us in connection with the AEA Acquisition, including investment banking, due diligence, financial advisory and valuation services. AEA also provides ongoing advisory and consulting services (similar
in nature to the services provided in connection with the AEA Acquisition) to us pursuant to the management agreement. In connection with this offering, the management agreement will be terminated.
See "Certain Relationships and Related Party Transactions" and Note 18 to our audited financial statements included elsewhere in this prospectus for further detail.
- (e)
- Represents
expenses associated with acquisition and divestiture-related activities and post-acquisition integration costs and accounting, tax, consulting, legal and
other fees and expenses associated with certain acquisition transactions ($5.4 million in fiscal 2016, a range of $7.0 million to $7.4 million in fiscal 2017 and
$1.4 million in the three months ended September 30, 2016 and a range of $1.4 million to $1.7 million in the three months ended September 30, 2017).
- (f)
- Represents:
- (i)
- impact
of foreign exchange gains and losses ($0.5 million loss in fiscal 2016, a range of $6.8 million to $8.7 million gain in fiscal 2017,
$0.9 million gain in the three months ended September 30, 2016 and a range of $5.5 million to $6.0 million gain in the three months ended September 30, 2017);
- (ii)
- impact
of gain on the sale of assets, primarily related to the disposition of our non-core waste management location in Vernon, California (the "Vernon
Disposition") ($3.5 million in fiscal 2016 and $3.5 million in the three months ended September 30, 2016);
- (iii)
- foreign
exchange impact related to headquarter allocations ($0.7 million gain in fiscal 2016, a range of $1.0 million to $1.1 million loss in
fiscal 2017, $0.6 million gain in the three months ended September 30, 2016 and a range of $0.0 to $0.0 million gain in the three months ended September 30, 2017); and
- (iv)
- expenses
related to maintaining non-operational business locations ($1.8 million in fiscal 2016, a range of $1.8 million to $2.0 million in fiscal
2017, $1.8 million in the three months ended September 30, 2016 and a range of $0.2 million to $0.2 million in the three months ended September 30, 2017).
- (g)
- Represents the impact to earnings from the following acquired entities from the beginning of the period presented to the date of the acquisition: (i) Magneto, (ii) Delta UV, (iii) VAF, (iv) ETS, (v) Noble, (vi) ADI and (vii) Olson. Such amounts have been based on the individual books and records of the acquired entities. We believe that such amounts represent a reasonable estimate of earnings for the periods preceding the dates of such acquisitions; however, the individual books and records of the acquired entities have not been audited. As a result, there can be no assurances that such results accurately reflect the actual results of the acquired entities for the periods preceding the dates of such acquisitions or that such entities would have achieved the same results if we had acquired them at the beginning of such period. See "Management's Discussion and Analysis of Financial Condition and Results of Operations—Acquisitions" for further detail.
19
The chart below summarizes our ownership and corporate structure after giving effect to this offering.
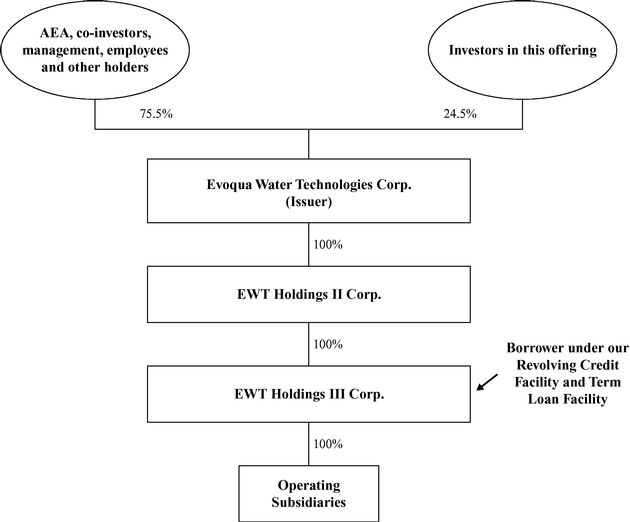
Evoqua Water Technologies Corp. (formerly EWT Holdings I Corp.) was incorporated as a Delaware corporation on October 7, 2013 under the name WTG Holdings I Corp. Our principal executive office is located at 210 Sixth Avenue, Pittsburgh, Pennsylvania 15222, and our telephone number at that address is (724) 772-0044. We maintain a website at www.evoqua.com, which contains information about us. The information contained on, or that can be accessed through, our website is not a part of, and should not be considered as being incorporated by reference into, this prospectus.
20
Common stock offered by us |
8,333,333 shares. | |
Common stock offered by the selling stockholders |
19,444,444 shares (or 23,611,110 shares if the underwriters exercise in full their option to purchase additional shares). |
|
Common stock to be outstanding immediately after this offering |
113,282,257 shares. |
|
Option to purchase additional shares from the selling stockholders |
The underwriters have an option to purchase up to an aggregate of 4,166,666 additional shares of common stock from the selling stockholders at the initial public offering price, less underwriting discounts and commissions. The underwriters can exercise this option at any time within 30 days from the date of this prospectus. |
|
Use of proceeds |
We estimate that the net proceeds to us from this offering, after deducting underwriting discounts and commissions and estimated offering expenses, will be approximately $135.4 million, assuming the shares are offered at $18.00 per share (the midpoint of the price range set forth on the cover page of this prospectus). |
|
|
We intend to use the net proceeds received by us in this offering to repay approximately $100.5 million of indebtedness (including accrued and unpaid interest) under the Term Loan Facility and any remainder for general corporate purposes. We will not receive any proceeds from the sale of shares by the selling stockholders. See "Use of Proceeds." |
|
Dividend policy |
We do not expect to pay any dividends on our common stock for the foreseeable future. See "Dividend Policy." |
|
Proposed NYSE symbol |
"AQUA." |
|
Directed share program |
The underwriters have reserved for sale, at the initial public offering price, up to 694,444 shares of common stock to be offered to our directors, officers and certain employees. We will offer these shares to the extent permitted under applicable regulations. The number of shares available for sale to the general public in this offering will be reduced to the extent these persons purchase reserved shares. Any reserved shares not purchased will be offered by the underwriters to the general public on the same terms as the other shares. See "Underwriting." |
21
Controlled company |
Following this offering, we will continue to be a "controlled company" within the meaning of the corporate governance standards of the NYSE. See "Risk Factors—Risks Relating to our Common Stock and this Offering—We are a 'controlled company' within the meaning of the corporate governance standards of the NYSE and, as a result, will qualify for, and may rely on, exemptions from certain corporate governance requirements." | |
Risk factors |
Investing in our common stock involves a high degree of risk. See "Risk Factors" beginning on page 28 of this prospectus for a discussion of factors you should carefully consider before investing in our common stock. |
The number of shares of common stock to be outstanding after this offering excludes:
- •
- 9,168,049 shares of common stock issuable upon the exercise of options outstanding under our Stock Option Plan as of October 16, 2017 at
a weighted average exercise price of approximately $5.18 per share;
- •
- 5,100,000 shares reserved for future issuance under our 2017 Equity Incentive Plan, which has been approved in connection with this offering;
and
- •
- an estimated 1,406,029 shares underlying grants of stock-settled restricted stock unit awards (estimated using the initial public offering price of $18.00 per share, the midpoint of the price range set forth on the cover page of this prospectus) expected to be made in connection with this offering to certain members of management, the aggregate value of which equals $25 million, with the actual number of restricted stock unit awards to be calculated based on the closing price of our common stock on the NYSE on the first day of trading.
Unless otherwise indicated, all information contained in this prospectus:
- •
- assumes an initial public offering price of $18.00 per share, which is the midpoint of the price range set forth on the cover page of this
prospectus;
- •
- assumes the underwriters' option to purchase additional shares from the selling stockholders will not be exercised;
- •
- gives effect to an approximate 26.9576-for-one stock split effected on October 16, 2017; and
- •
- gives effect to our amended and restated certificate of incorporation and our amended and restated bylaws, which became effective on October 16, 2017.
22
Summary Consolidated Financial and Operating Data
Our summary consolidated balance sheet data presented below as of September 30, 2015 and 2016 and our summary consolidated statements of operations and cash flow data presented below for the period from October 1, 2013 through January 15, 2014 and the period from January 16, 2014 through September 30, 2014 (each as described below) and for each of the fiscal years ended September 30, 2015 and 2016 have been derived from our audited consolidated financial statements included elsewhere in this prospectus. Our summary consolidated balance sheet data presented below as of January 15, 2014 and September 30, 2014 has been derived from our unaudited financial information and our audited consolidated financial statements, respectively, not included in this prospectus. Our summary consolidated balance sheet data presented below as of June 30, 2017 and our summary consolidated statements of operations and cash flow data presented below for the nine months ended June 30, 2016 and 2017 has been derived from the unaudited consolidated financial statements included elsewhere in this prospectus. Our summary consolidated balance sheet data presented below as of June 30, 2016 has been derived from our unaudited consolidated financial statements not included in this prospectus. The unaudited consolidated financial statements were prepared on a basis consistent with that used in preparing our audited consolidated financial statements and include all adjustments, consisting of normal and recurring items, that we consider necessary for a fair presentation of our financial position and results of operations for the unaudited periods. The summary consolidated financial data of our Predecessor as of January 15, 2014 and for the period from October 1, 2013 through January 15, 2014 was prepared on a "carve-out" basis for the purpose of presenting our historical financial position, results of operations and cash flows.
On January 15, 2014, Evoqua Water Technologies Corp. (formerly EWT Holdings I Corp.) acquired, through its wholly-owned entities, EWT Holdings II Corp. and EWT Holdings III Corp., all of the capital stock of the Predecessor. As a result of the AEA Acquisition and resulting change in control and changes due to the impact of purchase accounting, we are required to present separately the operating results for the Predecessor and Successor. We refer to the period from October 1, 2013 through January 15, 2014 as "Predecessor Period 2014," and the consolidated financial statements for that period include the accounts of the Predecessor. The financial data presented for this period is not necessarily indicative of our current or future performance and does not reflect what our performance would have been had we operated as a separate stand-alone entity during this period. We refer to the period from January 16, 2014 through September 30, 2014 as "Successor Period 2014," and the consolidated financial statements for that period include the accounts of the Successor. The Successor was incorporated on October 7, 2013. From October 7, 2013 to January 15, 2014, the Successor had no activities other than the incurrence of transaction costs related to the AEA Acquisition, which are included in the Successor Period 2014. Consequently, Successor Period 2014, fiscal 2015 and fiscal 2016 may not be comparable to Predecessor Period 2014.
Our historical results presented below are not necessarily indicative of the results to be expected for any future period. The summary consolidated financial and operating data presented below should be read in conjunction with "Capitalization," "Management's Discussion and Analysis of Financial Condition and Results of Operations," "Selected Historical Consolidated Financial Data," "Unaudited Pro Forma Financial Information" and our consolidated financial statements and related notes included elsewhere in this prospectus.
Our unaudited summary pro forma financial information presented below has been derived from our unaudited pro forma consolidated financial information included in this prospectus under "Unaudited Pro Forma Financial Information" and has been prepared to give effect to the transactions described in this prospectus under "Unaudited Pro Forma Financial Information" as if they had occurred on the dates discussed therein. The following unaudited summary pro forma financial information is presented for illustrative purposes only and is not necessarily indicative of the operating results or financial position that would have occurred if the relevant transactions had been
23
consummated on the date indicated, nor is it indicative of future operating results. Furthermore, unaudited summary pro forma financial information includes various estimates which are subject to material change. See "Unaudited Pro Forma Financial Information" for a complete description of the adjustments and assumptions underlying the unaudited summary pro forma financial information.
| |
Pro Forma | Historical | |||||||||||||||||||||||||
|---|---|---|---|---|---|---|---|---|---|---|---|---|---|---|---|---|---|---|---|---|---|---|---|---|---|---|---|
| |
|
|
Predecessor |
|
Successor | ||||||||||||||||||||||
| |
|
|
|||||||||||||||||||||||||
| |
|
|
October 1, 2013 Through January 15, 2014 |
January 16, 2014 Through September 30, 2014 |
Fiscal Years Ended September 30, |
Nine Months Ended June 30, |
|||||||||||||||||||||
| |
Fiscal Year Ended September 30, 2016 |
Nine Months Ended June 30, 2017 |
|||||||||||||||||||||||||
| |
2015 | 2016 | 2016 | 2017 | |||||||||||||||||||||||
| |
(unaudited) |
|
|
|
|
|
(unaudited) |
||||||||||||||||||||
| |
(in thousands, except per share data) |
||||||||||||||||||||||||||
Statement of Operations Data: |
|||||||||||||||||||||||||||
Revenue from product sales and services |
$ | 1,171,389 | $ | 890,916 | $ | 306,314 | $ | 791,154 | $ | 1,060,966 | $ | 1,137,196 | $ | 817,788 | $ | 890,916 | |||||||||||
Cost of product sales and services |
(818,895 | ) | (614,088 | ) | (228,227 | ) | (700,245 | ) | (768,549 | ) | (804,131 | ) | (575,234 | ) | (614,088 | ) | |||||||||||
| | | | | | | | | | | | | | | | | | | | | | | | | | | | |
Gross profit |
352,494 | 276,828 | 78,087 | 90,909 | 292,417 | 333,065 | 242,554 | 276,828 | |||||||||||||||||||
Research and development expense |
(22,897 | ) | (15,684 | ) | (6,728 | ) | (18,829 | ) | (25,909 | ) | (22,897 | ) | (17,469 | ) | (15,684 | ) | |||||||||||
Sales and marketing expense |
(149,920 | ) | (108,729 | ) | (38,479 | ) | (90,947 | ) | (124,429 | ) | (135,208 | ) | (97,078 | ) | (108,729 | ) | |||||||||||
General and administrative expense |
(139,661 | ) | (117,477 | ) | (35,652 | ) | (104,122 | ) | (147,663 | ) | (144,771 | ) | (108,496 | ) | (120,534 | ) | |||||||||||
Other operating income (expense), net |
7,010 | 981 | (1,198 | ) | (522 | ) | 74 | 6,966 | 2,404 | 981 | |||||||||||||||||
Interest expense |
(46,575 | ) | (33,257 | ) | (23 | ) | (23,994 | ) | (34,060 | ) | (42,518 | ) | (29,467 | ) | (39,117 | ) | |||||||||||
Equity income of non-consolidated affiliate(1) |
— | — | 518 | 1,283 | 1,424 | — | — | — | |||||||||||||||||||
| | | | | | | | | | | | | | | | | | | | | | | | | | | | |
Loss before income taxes |
451 | 2,662 | (3,475 | ) | (146,222 | ) | (38,146 | ) | (5,363 | ) | (7,552 | ) | (6,255 | ) | |||||||||||||
| | | | | | | | | | | | | | | | | | | | | | | | | | | | |
Income tax benefit (expense) |
16,359 | (3,416 | ) | 1,173 | 48,465 | (47,905 | ) | 18,394 | 20,419 | (295 | ) | ||||||||||||||||
| | | | | | | | | | | | | | | | | | | | | | | | | | | | |
Net income (loss) |
16,810 | (754 | ) | (2,302 | ) | (97,757 | ) | (86,051 | ) | 13,031 | 12,867 | (6,550 | ) | ||||||||||||||
| | | | | | | | | | | | | | | | | | | | | | | | | | | | |
Net income attributable to non-controlling interest |
1,392 | 2,348 | — | — | — | 1,392 | 1,055 | 2,348 | |||||||||||||||||||
| | | | | | | | | | | | | | | | | | | | | | | | | | | | |
Net income (loss) attributable to the Company |
$ | 15,418 | $ | (3,102 | ) | $ | (2,302 | ) | $ | (97,757 | ) | $ | (86,051 | ) | $ | 11,639 | $ | 11,812 | $ | (8,898 | ) | ||||||
| | | | | | | | | | | | | | | | | | | | | | | | | | | | |
| | | | | | | | | | | | | | | | | | | | | | | | | | | | |
| | | | | | | | | | | | | | | | | | | | | | | | | | | | |
Weighted average shares outstanding |
|||||||||||||||||||||||||||
Basic |
112,587 | 113,154 | — | 100,964 | 101,763 | 104,254 | 103,657 | 104,821 | |||||||||||||||||||
Diluted |
114,494 | 113,154 | — | 100,964 | 101,763 | 106,161 | 104,493 | 104,821 | |||||||||||||||||||
Earnings (loss) per common share |
|||||||||||||||||||||||||||
Basic |
$ | 0.14 | $ | (0.03 | ) | — | $ | (0.97 | ) | $ | (0.85 | ) | $ | 0.11 | $ | 0.11 | $ | (0.08 | ) | ||||||||
Diluted |
$ | 0.13 | $ | (0.03 | ) | — | $ | (0.97 | ) | $ | (0.85 | ) | $ | 0.11 | $ | 0.11 | $ | (0.08 | ) | ||||||||
Cash Flow Data: |
|||||||||||||||||||||||||||
Net cash provided by (used in) operating activities |
$ | 45,577 | $ | 37,478 | $ | 41,944 | $ | 31,919 | $ | 10,655 | $ | 15,793 | |||||||||||||||
Net cash provided by (used in) investing activities |
(7,524 | ) | (762,087 | ) | (46,866 | ) | (344,610 | ) | (331,227 | ) | (117,266 | ) | |||||||||||||||
Net cash provided by (used in) financing activities |
89,901 | 911,444 | (6,263 | ) | 191,389 | 199,067 | 104,449 | ||||||||||||||||||||
Effect of exchange rate changes on cash |
(243 | ) | (1,399 | ) | (5,225 | ) | 2,637 | 369 | 680 | ||||||||||||||||||
| | | | | | | | | | | | | | | | | | | | | | | | | | | | |
Change in cash and cash equivalents |
$ | 127,711 | $ | 185,436 | $ | (16,410 | ) | $ | (118,665 | ) | $ | (121,136 | ) | $ | 3,656 | ||||||||||||
| | | | | | | | | | | | | | | | | | | | | | | | | | | | |
| | | | | | | | | | | | | | | | | | | | | | | | | | | | |
| | | | | | | | | | | | | | | | | | | | | | | | | | | | |
Balance Sheet Data (as of end of period): |
|||||||||||||||||||||||||||
Cash and cash equivalents |
$ | 106,546 | $ | 167,568 | $ | 177,887 | $ | 169,027 | $ | 50,362 | $ | 47,891 | $ | 54,018 | |||||||||||||
Property, plant, and equipment, net |
271,830 | 209,345 | 222,163 | 235,828 | 256,765 | 250,090 | 271,830 | ||||||||||||||||||||
Other assets |
1,094,855 | 840,467 | 734,990 | 635,016 | 989,104 | 983,403 | 1,094,855 | ||||||||||||||||||||
| | | | | | | | | | | | | | | | | | | | | | | | | | | | |
Total assets |
$ | 1,473,231 | $ | 1,217,380 | $ | 1,135,040 | $ | 1,039,871 | $ | 1,296,231 | $ | 1,281,384 | $ | 1,420,703 | |||||||||||||
| | | | | | | | | | | | | | | | | | | | | | | | | | | | |
| | | | | | | | | | | | | | | | | | | | | | | | | | | | |
| | | | | | | | | | | | | | | | | | | | | | | | | | | | |
Long-term debt |
797,341 | — | 553,506 | 547,032 | 728,132 | 735,022 | 800,628 | ||||||||||||||||||||
Other liabilities |
343,811 | 417,886 | 326,121 | 318,479 | 364,164 | 335,454 | 418,588 | ||||||||||||||||||||
| | | | | | | | | | | | | | | | | | | | | | | | | | | | |
Total liabilities |
1,141,152 | 417,886 | 879,627 | 865,511 | 1,092,296 | 1,070,476 | 1,219,216 | ||||||||||||||||||||
Net parent investment |
— | 799,494 | — | — | — | — | — | ||||||||||||||||||||
Total shareholders' equity |
332,079 | — | 255,413 | 174,360 | 203,935 | 210,908 | 201,487 | ||||||||||||||||||||
| | | | | | | | | | | | | | | | | | | | | | | | | | | | |
Total liabilities and shareholders' equity |
$ | 1,473,231 | $ | 1,217,380 | $ | 1,135,040 | $ | 1,039,871 | $ | 1,296,231 | $ | 1,281,384 | $ | 1,420,703 | |||||||||||||
| | | | | | | | | | | | | | | | | | | | | | | | | | | | |
| | | | | | | | | | | | | | | | | | | | | | | | | | | | |
| | | | | | | | | | | | | | | | | | | | | | | | | | | | |
Other Financial and Operating Data: |
|||||||||||||||||||||||||||
Adjusted EBITDA(2) |
$ | 182,449 | (3) | $ | 145,606 | (3) | $ | 11,482 | $ | 105,710 | $ | 119,911 | $ | 160,053 | $ | 100,633 | $ | 136,303 | |||||||||
- (1)
- We hold a 50% partnership interest in TWO, which, for the fiscal years ended September 30, 2014 and 2015, we accounted for under the equity method and did not consolidate, as we did not have a controlling financial interest based on the shared powers of both joint venture partners to direct the activities that most significantly impact TWO's financial performance. On October 1, 2015, a change occurred in the partnership structure of TWO such that we are now obligated to absorb all risk of loss up to 100% of the joint venture partner's equity. As such, the accounting for our 50% interest changed from equity method investment to full consolidation as a variable interest entity under Accounting Standards Codification ("ASC") Topic 810, Consolidation ("ASC 810").
24
- (2)
- Adjusted
EBITDA is one of the primary metrics used by management to evaluate the financial performance of our business. Adjusted EBITDA is defined as net income
(loss) before interest expense, income tax benefit (expense) and depreciation and amortization, adjusted for the impact of certain other items, including restructuring and related business
transformation costs, purchase accounting adjustment costs, non-cash stock-based compensation, sponsor fees, transaction costs and other gains, losses and expenses.
We present Adjusted EBITDA, which is not a recognized financial measure under GAAP, because we believe it is frequently used by analysts, investors and other interested parties to evaluate companies in our industry. Further, we believe it is helpful in highlighting trends in our operating results, because it excludes the results of decisions that are outside the control of management, while other measures can differ significantly depending on long-term strategic decisions regarding capital structure, the tax jurisdictions in which we operate and capital investments. Management uses Adjusted EBITDA to supplement GAAP measures of performance as follows:
- •
- to assist investors and analysts in comparing our operating performance across reporting periods on a
consistent basis by excluding items that we do not believe are indicative of our core operating performance;
- •
- in our management incentive compensation which is based in part on components of Adjusted EBITDA;
- •
- in certain calculations under our Senior Secured Credit Facilities, which use components of Adjusted
EBITDA;
- •
- to evaluate the effectiveness of our business strategies;
- •
- to make budgeting decisions; and
- •
- to compare our performance against that of other peer companies using similar measures.
You are encouraged to evaluate each adjustment and the reasons we consider it appropriate for supplemental analysis. In addition, in evaluating Adjusted EBITDA, you should be aware that in the future, we may incur expenses similar to the adjustments in the presentation of Adjusted EBITDA. Our presentation of Adjusted EBITDA should not be construed as an inference that our future results will be unaffected by unusual or non-recurring items. In addition, Adjusted EBITDA may not be comparable to similarly titled measures used by other companies in our industry or across different industries.
Adjusted EBITDA has its limitations as an analytical tool and you should not consider it in isolation, or as a substitute for analysis of our results as reported under GAAP. Some of these limitations include the following:
- •
- Adjusted EBITDA does not reflect every expenditure, future requirements for capital expenditures or
contractual commitments;
- •
- Adjusted EBITDA does not reflect changes in our working capital needs;
- •
- Adjusted EBITDA does not reflect the significant interest expense, or the amounts necessary to service
interest or principal payments on our Senior Secured Credit Facilities;
- •
- Adjusted EBITDA does not reflect income tax expense (benefit), and because the payment of taxes is part
of our operations, tax expense is a necessary element of our costs and ability to operate;
- •
- although depreciation and amortization are eliminated in the calculation of Adjusted EBITDA, the assets
being depreciated and amortized will often have to be replaced in the future, and Adjusted EBITDA does not reflect any costs of such replacements;
- •
- Adjusted EBITDA does not reflect the noncash component of employee compensation;
- •
- Adjusted EBITDA does not reflect the impact of earnings or charges resulting from matters we consider not
to be reflective, on a recurring basis, of our ongoing operations;
- •
- other companies in our industry may calculate Adjusted EBITDA or similarly titled measures differently
than we do, limiting its usefulness as a comparative measure; and
- •
- Adjusted EBITDA (pro forma as adjusted for contributions from insignificant completed acquisitions) does
not necessarily reflect the results of operations of such acquired businesses as if they had been acquired at the beginning of each such period presented.
We compensate for these limitations by relying primarily on our GAAP results and using Adjusted EBITDA only as supplemental information.
- (3)
- Throughout this prospectus, as noted, we make adjustments to Adjusted EBITDA, with respect to the pro forma periods presented herein, to give further effect to contributions from insignificant completed acquisitions for the applicable periods.
25
The following is a reconciliation of our net income (loss) to Adjusted EBITDA:
| |
Pro Forma | Historical | |||||||||||||||||||||||||
|---|---|---|---|---|---|---|---|---|---|---|---|---|---|---|---|---|---|---|---|---|---|---|---|---|---|---|---|
| |
|
|
Predecessor |
|
Successor | ||||||||||||||||||||||
| |
|
|
|||||||||||||||||||||||||
| |
|
|
October 1, 2013 Through January 15, 2014 |
January 16, 2014 Through September 30, 2014 |
Fiscal Years Ended September 30, |
Nine Months Ended June 30, |
|||||||||||||||||||||
| |
Fiscal Year Ended September 30, 2016 |
Nine Months Ended June 30, 2017 |
|||||||||||||||||||||||||
| |
2015 | 2016 | 2016 | 2017 | |||||||||||||||||||||||
| |
(unaudited) |
|
|
|
|
|
(unaudited) |
||||||||||||||||||||
| |
(in thousands) |
||||||||||||||||||||||||||
Net income (loss) |
$ | 16,810 | $ | (754 | ) | $ | (2,302 | ) | $ | (97,757 | ) | $ | (86,051 | ) | $ | 13,031 | $ | 12,867 | $ | (6,550 | ) | ||||||
Interest expense |
46,575 | 33,257 | 23 | 23,994 | 34,060 | 42,518 | 29,467 | 39,117 | |||||||||||||||||||
Income tax (benefit) expense |
(16,359 | ) | 3,416 | (1,173 | ) | (48,465 | ) | 47,905 | (18,394 | ) | (20,419 | ) | 295 | ||||||||||||||
Depreciation and amortization |
73,751 | 55,813 | 14,934 | 139,933 | 58,139 | 69,289 | 50,986 | 55,813 | |||||||||||||||||||
| | | | | | | | | | | | | | | | | | | | | | | | | | | | |
EBITDA |
$ | 120,777 | $ | 91,732 | $ | 11,482 | $ | 17,705 | $ | 54,053 | $ | 106,444 | $ | 72,901 | $ | 88,675 | |||||||||||
Restructuring and related business transformation costs(a) |
43,075 | 36,382 | — | 41,027 | 32,842 | 43,075 | 18,208 | 36,382 | |||||||||||||||||||
Purchase accounting adjustment costs(b) |
1,267 | 229 | 18,326 | — | 1,267 | — | 229 | ||||||||||||||||||||
Stock-based compensation(c) |
1,999 | 1,634 | — | 342 | 1,587 | 1,999 | 1,447 | 1,634 | |||||||||||||||||||
Sponsor fees(d) |
— | — | — | 4,369 | 5,012 | 3,758 | 2,810 | 3,042 | |||||||||||||||||||
Transaction costs(e) |
3,274 | 5,659 | — | 10,121 | — | 5,374 | 3,943 | 5,659 | |||||||||||||||||||
Other gains, losses and expenses(f) |
(1,864 | ) | 683 | — | 13,820 | 26,417 | (1,864 | ) | 1,324 | 682 | |||||||||||||||||
| | | | | | | | | | | | | | | | | | | | | | | | | | | | |
Adjusted EBITDA |
$ | 168,528 | $ | 136,319 | $ | 11,482 | $ | 105,710 | $ | 119,911 | $ | 160,053 | $ | 100,633 | $ | 136,303 | |||||||||||
| | | | | | | | | | | | | | | | | | | | | | | | | | | | |
Contributions from insignificant completed acquisitions(g) |
13,921 | 9,287 | |||||||||||||||||||||||||
| | | | | | | | | | | | | | | | | | | | | | | | | | | | |
Adjusted EBITDA (pro forma as adjusted for contributions from insignificant completed acquisitions) |
$ | 182,449 | $ | 145,606 | |||||||||||||||||||||||
| | | | | | | | | | | | | | | | | | | | | | | | | | | | |
| | | | | | | | | | | | | | | | | | | | | | | | | | | | |
| | | | | | | | | | | | | | | | | | | | | | | | | | | | |
- (a)
- Represents:
- (i)
- costs
and expenses in connection with various restructuring initiatives since the AEA Acquisition, including severance costs, relocation costs, recruiting expenses,
write-offs of inventory and fixed assets and third-party consultant costs to assist with these initiatives (includes (A) $16.9 million in fiscal 2016 (all of which is reflected as a
component of Restructuring charges in "Note 12—Restructuring and Related Charges" to our audited consolidated financial statements) and $19.2 million for the nine months
ended June 30, 2017 (all of which is reflected as a component of Restructuring charges in "Note 11—Restructuring and Related Charges" to our unaudited condensed consolidated
financial statements) related to our voluntary separation plan pursuant to which approximately 220 employees accepted separation packages, and (B) $12.4 million (of which
$4.4 million is reflected as a component of Restructuring charges in "Note 12—Restructuring and Related Charges" to our audited consolidated financial statements) in the
Successor Period, $9.2 million (of which $6.5 million is reflected as a component of Restructuring charges in "Note 12—Restructuring and Related Charges" to our
audited consolidated financial statements) in fiscal 2015, $11.1 million (all of which is reflected as a component of Restructuring charges in "Note 12—Restructuring and
Related Charges" to our audited consolidated financial statements) in fiscal 2016, $9.3 million (of which $8.1 million is reflected as a component of Restructuring charges in
"Note 11—Restructuring and Related Charges" to our unaudited condensed consolidated financial statements) in the nine months ended June 30, 2016 and $6.5 million (of
which $2.9 million is reflected as a component of Restructuring charges in "Note 11—Restructuring and Related Charges" to our unaudited condensed consolidated financial
statements) in the nine months ended June 30, 2017 related to various other initiatives implemented to restructure and reorganize our business as a standalone business with an appropriate
management team and cost structure). Differences between amounts reflected as Restructuring charges in "Note 12—Restructuring and Related Charges" to our audited financial
statements and amounts reflected in this adjustment relate primarily to retention payments made to employees in the Successor Period of $5.6 million that have been reflected as components of
Cost of product sales and services ($1.2 million), Research and development expense ($0.2 million), Sales and marketing expense ($1.9 million) and General and administrative
expense ($2.3 million) as well as other administrative costs associated with separation from the Predecessor that have been reflected in the Successor Period as a component of General and
administrative expense (2.4 million). Differences between amounts reflected as Restructuring charges in "Note 12—Restructuring and Related Charges" to our audited financial
statements and amounts reflected in this adjustment also relate to retention payments made to employees in fiscal 2015 of $2.5 million that have been reflected as components of Cost of product
sales and services ($1.1 million), Research and development expense ($0.1 million), Sales and marketing expense ($1.0 million) and General and administrative expense
($0.3 million). Differences between amounts reflected as Restructuring charges in "Note 11—Restructuring and Related Charges" to our unaudited condensed consolidated
financial statements in the nine months ended June 30, 2016 and June 30, 2017 and amounts reflected in this adjustment relate primarily to consulting costs and other charges related to
implementing such initiatives that have primarily been recorded as a component of General and administrative expense ($1.2 million) in the nine months ended June 30, 2016 and Cost of
product sales and services ($1.4 million), Sales and marketing expenses ($1.0 million) and General and administrative expense ($1.0 million) in the nine months ended
June 30, 2017;
- (ii)
- legal settlement costs and intellectual property related fees associated with legacy matters prior to the AEA Acquisition, including fees and settlement costs related to product warranty litigation on MEMCOR products and certain discontinued products ($11.7 million in the Successor Period, reflected as a component of Cost of product sales and services, $11.7 million in fiscal 2015, reflected as components of Cost of product sales and services ($10.7 million) and General and administrative expenses ($1.0 million), $5.1 million, primarily reflected as a component of Cost of product sales and services in fiscal 2016, $2.5 million, primarily reflected as a component of Cost of product sales and services in the nine months ended June 30, 2016 and $1.8 million, primarily reflected as a component of General and administrative expense in the nine months ended June 30, 2017);
26
- (iii)
- expenses
associated with our information technology and functional infrastructure transformation following the AEA Acquisition, including activities to optimize
information technology systems and functional infrastructure processes for a standalone business ($16.9 million, primarily reflected as a component of General and administrative expense in the
Successor Period, $12.1 million, primarily reflected as components of Cost of product sales and services ($3.0 million), Research and development expense ($0.4 million), Sales and
marketing expense ($0.3 million) and General and administrative expense ($8.4 million) in fiscal 2015, $9.5 million, primarily reflected as components of Cost of product sales and
services ($3.6 million), Sales and marketing expense ($2.5 million), General and administrative expense ($3.1 million) and Research and development expense ($0.3 million)
in fiscal 2016, $6.1 million, primarily reflected as components of Cost of product sales and services ($2.9 million), Sales and marketing expense ($1.7 million) and General and
administrative expense ($1.5 million) in the nine months ended June 30, 2016 and $4.5 million, primarily reflected as components of Cost of product sales and services
($1.8 million), Sales and marketing expense ($0.7 million) and General and administrative expense ($2.0 million) in the nine months ended June 30, 2017); and
- (iv)
- costs
incurred by us in connection with this offering, including consultant costs and public company compliance costs ($0.5 million in fiscal 2016,
$0.3 million in the nine months ended June 30, 2016 and $4.4 million in the nine months ended June 30, 2017, all reflected as a component of General and administrative
expense).
- (b)
- Represents
adjustments for the effect of the purchase accounting step-up in the value of inventory to fair value recognized in cost of goods sold as a result of the
AEA Acquisition and the acquisition of Magneto.
- (c)
- Represents
non-cash stock-based compensation expenses related to option awards. See Note 15 to our audited financial statements included elsewhere in this
prospectus for further detail.
- (d)
- Represents
management fees paid to AEA pursuant to the management agreement. Pursuant to the management agreement, AEA provided advisory and consulting services to
us in connection with the AEA Acquisition, including investment banking, due diligence, financial advisory and valuation services. AEA also provides ongoing advisory and consulting services (similar
in nature to the services provided in connection with the AEA Acquisition) to us pursuant to the management agreement. In connection with this offering, the management agreement will be terminated.
See "Certain Relationships and Related Party Transactions" and Note 18 to our audited financial statements included elsewhere in this prospectus for further detail.
- (e)
- Represents
expenses associated with acquisition and divestiture-related activities and post-acquisition integration costs and accounting, tax, consulting, legal and
other fees and expenses associated with (i) the AEA Acquisition ($10.1 million in the Successor Period) and (ii) other acquisition transactions ($5.4 million in fiscal
2016, $3.9 million in the nine months ended June 30, 2016 and $5.7 million in the nine months ended June 30, 2017).
- (f)
- Represents:
- (i)
- impact
of foreign exchange gains and losses ($6.8 million loss in the Successor Period, $19.0 million loss in fiscal 2015, $0.5 million loss in
fiscal 2016, $1.4 million loss in the nine months ended June 30, 2016 and $2.1 million gain in the nine months ended June 30, 2017);
- (ii)
- $3.5 million
gain on the sale of assets, primarily related to the Vernon Disposition;
- (iii)
- foreign
exchange impact related to headquarter allocations ($0.7 million gain in fiscal 2016, $0.04 million gain in the nine months ended
June 30, 2016 and $1.0 million loss in the nine months ended June 30, 2017); and
- (iv)
- expenses
related to maintaining non-operational business locations ($7.0 million in the Successor Period, $7.4 million in fiscal 2015,
$1.8 million in fiscal 2016 and $1.7 million in the nine months ended June 30, 2017).
- (g)
- Represents the impact to earnings from the following acquired entities from the beginning of the period presented to the date of the acquisition: (i) Magneto, (ii) Delta UV, (iii) VAF, (iv) ETS, (v) Noble, (vi) ADI and (vii) Olson. Such amounts have been based on the individual books and records of the acquired entities. We believe that such amounts represent a reasonable estimate of earnings for the periods preceding the dates of such acquisitions; however, the individual books and records of the acquired entities have not been audited. As a result, there can be no assurances that such results accurately reflect the actual results of the acquired entities for the periods preceding the dates of such acquisitions or that such entities would have achieved the same results if we had acquired them at the beginning of such period. See "Management's Discussion and Analysis of Financial Condition and Results of Operations—Acquisitions" for further detail.
27
Investing in our common stock involves a high degree of risk. You should carefully consider the following risks, together with all of the other information contained in this prospectus, before deciding to invest in our common stock. Our business, financial condition, results of operations or prospects could be materially and adversely affected by any of these risks or uncertainties. In that case, the trading price of our common stock could decline, and you may lose all or part of your investment.
Risks Relating to Our Business
General global economic and business conditions may materially adversely affect demand for our products, services and solutions.
We compete in various end markets and geographic regions around the world. Among these, the most significant are global industrial markets and municipal markets. In fiscal 2016, 86% and 14% of our revenue was from customers located in the United States and Canada and in other markets, respectively. We have experienced, and expect to continue to experience, fluctuations in revenues and operating results due to economic and business cycles. Important factors for our businesses and the businesses of our customers, both in the United States and abroad, include local and global macroeconomic conditions, the overall strength of and our customers' confidence in the economy, industrial and governmental capital spending, governmental fiscal and trading policies, global environmental and regulatory policies, the strength of the residential and commercial real estate markets, unemployment rates, consumer spending, availability of financing, interest rates, tax rates and changes in tax laws, political conditions and energy and commodity prices. The businesses of many of our industrial customers are, to varying degrees, cyclical, and have experienced periodic downturns. While we attempt to minimize our exposure to economic or market fluctuations by serving a balanced mix of end markets and geographic regions, any of the above factors, individually or in the aggregate, or a significant or sustained downturn in a specific end market or geographic region, could materially reduce demand for our products, services and solutions.
Levels of municipal spending may particularly impact our business, financial condition, results of operations or prospects. Reduced tax revenue in certain regions, or inability to access traditional sources of credit, may limit spending and new development by municipalities or local governmental agencies, which in turn may materially adversely affect the demand for our solutions and reduce our revenue.
Failure to compete successfully in our markets could materially adversely affect our business, financial condition, results of operations or prospects.
We offer our products, services and solutions in highly competitive markets. We believe the principal points of competition in our markets are product performance, reliability and innovation of our solutions, application expertise and process knowledge, brand reputation, energy and water efficiency, product compliance with environmental and regulatory requirements, product lifecycle cost, scalability, timeliness of delivery, proximity of service centers to our customers, effectiveness of our distribution channels and price. Maintaining and improving our competitive position will require successful management of these factors, including continued investment by us in research and development, engineering, marketing, customer service and support and our distribution networks. Our future growth rate depends upon our ability to compete successfully, which is impacted by a number of factors, including our ability to (i) identify emerging technological trends in our target end markets, (ii) develop and maintain a wide range of competitive and appropriately priced products, services and solutions and defend our market share against an ever-expanding number of competitors including many new and non-traditional competitors, (iii) enhance our products by adding innovative and, where applicable, patented features that differentiate our products from those of our competitors and prevent
28
commoditization of our products, (iv) develop, manufacture, bring to market and drive commercial acceptance of compelling new products quickly and cost-effectively, (v) ensure that our products, services and solutions remain cost-competitive and (vi) attract, develop and retain individuals with the requisite technical expertise and understanding of customers' needs to develop and sell new technologies and products.
We operate in markets that are characterized by customer demand that is often broad in scope but localized in delivery. We compete with companies that may be better positioned to capitalize on highly localized relationships and knowledge that are difficult for us to replicate. Our potential customers may prefer local suppliers, in some cases because of existing relationships and in other cases because of local legal restrictions or incentives that favor local businesses. Smaller regional suppliers may also have lower cost structures. As a result, efforts to expand or support our service network may not improve our ability to penetrate new local markets or expand our footprint in existing markets.
Further, many of our customers actively monitor and review our company-wide safety record, and apply rigorous safety standards to us and our competitors. Although we take precautions to prevent workplace accidents and mechanical failures, such incidents are difficult to predict and may be outside of our control. If we are unable to meet our customers' stringent workplace safety standards, or if our customers perceive us to have a poor safety record, it could materially impact our ability to retain their business or attract new business.
We may not be successful in maintaining our competitive position for a number of reasons. We may fail to identify optimal vertical or geographic markets, focus our attention in suboptimal vertical or geographic markets or fail to execute an appropriate business model in certain vertical or geographic markets. Our competitors may develop disruptive technologies or products that are superior to our products, develop more efficient or effective methods of providing products and services or adapt more quickly than we do to new technologies or evolving customer requirements. The failure of our technologies or products to gain market acceptance due to more attractive offerings by our competitors could significantly reduce our revenues and materially adversely affect our competitive standing or prospects. Pricing pressures also could cause us to adjust the prices of certain products to stay competitive, which could materially adversely affect our margins and overall financial performance. Failure to continue competing successfully or to win business with our existing customers could materially adversely affect our business, financial condition, results of operations or prospects.
Our future growth is dependent upon our ability to continue to develop or acquire new products, services and solutions and adapt our businesses to meet the demands of our customers, comply with changes to government regulations and achieve market acceptance with acceptable margins.
Our future success depends upon a number of factors, including our ability to adapt our products, services and solutions to fit localities throughout our end markets, particularly in high growth emerging markets, such as China; identify emerging technological and other trends in our target end markets; and develop or acquire competitive products and services and bring them to market quickly and cost-effectively. If we are unable to continue to differentiate our products, services and solutions, or if we are forced to cut prices to remain competitive, our business, financial condition, results of operations or prospects could be materially and adversely affected.
We are also impacted by changing technology, competitively imposed process and safety standards and regulatory requirements, particularly under environmental regulations, each of which influences the demand for our products, services and solutions. Advances in technology and changes in industrial specifications or in legislative, regulatory and environmental requirements, including the availability of intellectual property protections in various jurisdictions, may render certain of our products, services and solutions obsolete.
29
In addition, our industrial and municipal customers have made considerable fixed-cost investments in the installation of their water and wastewater treatment products and systems, and our municipal customers are often subject to stringent appropriation requirements and extensive procurement processes. The replacement of our customers' installed products and systems with the new technologies that we develop could entail significant costs to such customers. Further, many of our potential customers engage and rely on engineering firms to recommend and select products and systems for their facilities, and many of our products are sold to OEMs as components of larger systems. Our inability to persuade our customers or other parties to adopt the technologies we develop could have an adverse effect on our business, financial condition, results of operations or prospects.
Our growth strategy includes acquisitions, and we may not be able to identify suitable acquisition targets or otherwise successfully implement our growth strategy.
Acquisitions have historically been a significant part of our growth strategy, and we expect to continue to grow through acquisitions in the future. We expect to continue evaluating potential strategic acquisitions of businesses, assets and product lines. We may not be able to identify suitable candidates, negotiate appropriate or favorable acquisition terms, obtain financing that may be needed to consummate such transactions or complete proposed acquisitions. There is significant competition for acquisition and expansion opportunities in our businesses.
In addition, acquisitions involve numerous risks, including (i) incurring the time and expense associated with identifying and evaluating potential acquisitions and negotiating potential transactions, resulting in management's attention being diverted from the operation of our existing business; (ii) using inaccurate estimates and judgments to evaluate credit, operations, funding, liquidity, business, management and market risks with respect to the target institution or assets; (iii) litigation relating to an acquisition, particularly in the context of a publicly held acquisition target, that could require us to incur significant expenses, result in management's attention being diverted from the operation of our existing business or delay or enjoin the transaction; (iv) failing to properly identify an acquisition candidate's liabilities, potential liabilities or risks; and (v) not receiving required regulatory approvals or such approvals being delayed or restrictively conditional. In addition, in connection with any acquisitions, we must comply with various antitrust requirements. It is possible that perceived or actual violations of these requirements could give rise to regulatory enforcement action or result in us not receiving the necessary approvals to complete a desired acquisition.
We routinely evaluate potential acquisition candidates and engage in discussions and negotiations regarding potential acquisitions; however, even if we execute a definitive agreement for an acquisition, there can be no assurance that we will consummate the transaction within the anticipated closing timeframe, or at all. Further, acquisitions typically involve the payment of a premium over book- and market-values and, therefore, some dilution of our tangible book value and earnings per common share may occur in connection with any future transaction.
We may have difficulty in operating or integrating any acquired businesses, assets or product lines profitably or in otherwise successfully implementing our growth strategy.
The anticipated benefits from any potential acquisitions may not be achieved unless the operations of the acquired business assets or product lines are successfully integrated in an efficient, effective and timely manner. The integration of our acquisitions will require substantial attention from management and operating personnel to ensure that the acquisition does not disrupt any existing operations, or affect our customers' opinions and perceptions of our services, products or customer support.
In addition, the integration of any acquisition includes numerous risks, including an acquired business not performing to our expectations, our not integrating it appropriately, failure to realize anticipated synergies and cost savings and difficulties, inefficiencies or cost overruns in integrating and
30
assimilating the organizational cultures, operations, technologies, data, services and products of the acquired business with ours.
The process of integrating acquired businesses, assets and product lines could cause the interruption of, or delays in, the operation of our existing business, which could have a material adverse effect on our business, financial condition, results of operations or prospects. Acquisitions also place a burden on our information, financial and operating systems and our employees and management. Our ability to manage our growth effectively and integrate the operations of acquired businesses, assets or product lines, will require us to continue to attract, train, motivate, manage and retain key employees and to expand our information technology, operational and financial systems. If we are unable to manage our growth effectively, we may spend time and resources on such acquisitions that do not ultimately increase our profitability or that cause loss of, or harm to, relationships with employees and customers.
Delays in enactment or repeals of environmental laws and regulations may make our products, services and solutions less economically beneficial to our customers, thereby affecting demand for our products, services and solutions.
Our products, services and solutions assist various industries and municipalities in meeting stringent environmental and safety requirements enacted for the purpose of making water cleaner and safer. Our future growth is dependent on the impact and timing of potential new water laws and regulations, as well as potential changes to existing laws and regulations, including the potential impact of environmental policies of the new Presidential administration installed in the United States in January of 2017. If stricter laws or regulations are delayed or are not enacted, or repealed or amended to be less strict, or enacted with prolonged phase-in periods, or not enforced, demand for our products and services may be reduced. For example, in response to Presidential Executive Order 13777, calling on each federal agency to establish a regulatory reform task force and evaluate existing rules and recommend repeal, replacement or modification to reduce regulatory burdens, the U.S. EPA established a task force and initiated reviews in several program areas. The U.S. EPA's Office of Water conducted such a review, soliciting public comments in the spring of 2017, including hosting a public listening session, seeking proposals for Office of Water rules that could be repealed, replaced or modified to make them less burdensome. We are currently unable to predict whether changes to statutes and rules which occur will affect demand for our products and services. To the extent that such changes have a negative impact on us, including as a result of related uncertainty, these changes may materially and adversely impact our business, financial condition, results of operations or prospects.
If we become subject to claims relating to handling, storage, release or disposal of hazardous materials, we could incur significant cost and time to comply.
Our business activities, including our manufacturing processes and waste recycling and treatment processes, currently involve the use, treatment, storage, transfer, handling and/or disposal of hazardous materials, chemicals and wastes. These activities create a risk of significant environmental liabilities and reputational damage. Under applicable environmental laws and regulations, we could be strictly, jointly and severally liable for releases of regulated substances by us at our current or former properties or the properties of others or by other businesses that previously owned or used our current or former properties, including if such releases result in contamination of air, water or soil, or cause harm to individuals. We could also be liable or incur reputational damage if we merely generate hazardous materials or wastes, or arrange for their transportation, disposal or treatment, or we transport such materials, and they are subsequently released or cause harm, or if some other entity conducted such activities and by virtue of an acquisition, under applicable law we are a successor to that entity.
Our business activities also create a risk of contamination or injury to our employees, customers or third parties, from the use, treatment, storage, transfer, handling and/or disposal of these materials, and
31
these activities could result in accidental contamination or injury to the general public, as end-users of our industrial and municipal customers' products and services.
In the event that our business activities result in environmental liabilities, such as those described above, we could incur significant costs or reputational damage in connection with the investigation and remediation of environmental contamination, and we could be liable for any resulting damages including natural resource damages. Such liabilities could exceed our available cash or any applicable insurance coverage we may have. Additionally, we are subject to, on an ongoing basis, federal, state and local laws and regulations governing the use, storage, handling and disposal of these materials and specified waste products. The cost of compliance with these laws and regulations may become significant and could have a material adverse effect on our business, financial condition, results of operations or prospects.
Further, we may incur costs to defend our position even if we are not liable for consequences arising out of a release of or exposure to a hazardous substance or waste, or other environmental damage. Our insurance policies may not be sufficient to cover the costs of such claims.
Failure to retain our existing senior management, skilled technical, engineering, sales and other key personnel or the inability to attract and retain new qualified personnel could materially adversely impact our ability to operate or grow our business.
Our success depends to a significant extent on our ability to retain or attract a significant number of employees in senior management, skilled technical, engineering, sales and other key personnel. Since the AEA Acquisition, we have focused on creating a high performance culture, in which our employees are highly enabled, empowered and accountable. Our inability to continue to develop and maintain our culture by empowering our senior management, other leaders and employees and promoting an entrepreneurial spirit, could result in our loss of key leaders and employees and have a material adverse effect on our business, financial condition, results of operations or prospects.
Effective succession planning is also important to our long-term success, as a failure to ensure effective transfer of knowledge and smooth transitions involving key employees could hinder our strategic planning and execution. We have implemented a voluntary separation program intended to mitigate the risks associated with knowledge transfer, but we cannot guarantee that it will be effective or cost-efficient.
We will need to continue to develop a roster of qualified talent to support business growth. Without a sufficient number of skilled employees, our operations and manufacturing quality could suffer. Our experienced sales team has also developed a number of meaningful customer relationships that would be difficult to replace. Therefore, competition for qualified technical personnel and for sales personnel with established customer relationships is intense, both in retaining our existing employees and in replacing or finding additional suitable employees. There can be no assurance that the labor pool from which we hire our personnel will increase or remain stable, and any failure to retain our existing technical and sales personnel and other employees or to attract additional skilled personnel could have a material adverse effect our business, financial condition, results of operations or prospects.
Product defects and unanticipated or improper use of our products could adversely affect our business, reputation and financial statements.
Manufacturing or design defects in (including in products or components that we source from third parties), unanticipated or improper use of, or inadequate disclosure of risks relating to the use of our products, services and solutions by our customers or third parties could create product safety, regulatory or other risks, including personal injury, death or property damage. These events could lead to recalls or safety alerts relating to our products, result in the removal of a product from the market and result in product liability claims being brought against us. Recalls, removals and product liability
32
claims can result in significant costs, as well as negative publicity and damage to our reputation that could reduce demand for our products and have a material adverse effect on our business, financial condition, results of operations or prospects.
Further, it is generally our responsibility to service the equipment we provide our customers throughout the duration of our contract with such customers, and our customers may be required to maintain insurance covering loss, damage or injury caused by our equipment. However, we are not able to monitor our customers' use or maintenance of their water systems or their compliance with our contracts or usage instructions. Customers' failure to properly use, maintain or safeguard their equipment or customers' noncompliance with insurance requirements may reflect poorly on us as the provider of such equipment and, as a result, damage our reputation.
We may incur liabilities to customers as a result of warranty claims or failure to meet performance guarantees, which could reduce our profitability.
Our customers typically require product warranties as to the proper operation and conformance to specifications of the products we manufacture or install and performance guarantees as to any effluent produced by our equipment and services. Failure of our products to operate properly or to meet specifications of our customers or our failure to meet our performance guarantees may increase costs by requiring additional engineering resources and services, replacement of parts and equipment and frequent replacement of consumables or monetary reimbursement to a customer or could otherwise result in liability to our customers. We have in the past received warranty claims, and we expect to continue to receive them in the future. There are significant uncertainties and judgments involved in estimating warranty and performance guarantee obligations, including changing product designs, differences in customer installation processes and failure to identify or disclaim certain variables in a customer's influent. To the extent that we incur substantial warranty or performance guarantee claims in any period, our reputation, earnings and ability to obtain future business could be materially adversely affected.
We may be unable to bid on or enter into significant long-term agreements if we are not able to obtain letters of credit, bank guarantees or surety bonds, and our liquidity may be adversely affected by bonding requirements.
A portion of our business, including our water treatment projects and solutions, requires us to provide letters of credit, bank guarantees or surety bonds in support of our commitments and as part of the terms and conditions on water treatment projects. In addition, we are required to provide letters of credit or surety bonds to the department of environmental protection or equivalent in some states in order to maintain our licenses to handle hazardous waste at certain of our regeneration facilities. We have in the past been, and may in the future be, required to provide bid bonds or performance bonds to secure our performance under these construction-type customer arrangements or, in some cases, as a pre-requisite to submit a bid on a potential project.
Current or future market conditions, as well as changes in surety companies' assessment of our operating and financial risk, could cause our surety providers and lenders to decline to issue or renew, or substantially reduce the amount of, bid or performance bonds for our work, and could increase our costs associated with collateral. These actions could be taken on short notice. Our inability to obtain adequate bonding or letters of credit to meet bid requirements or enter into significant long-term agreements could have a material adverse effect on our business, financial condition, results of operations or prospects.
Further, surety companies may require that we collateralize a percentage of the bond with cash or another form of credit enhancement. Some of our customers also require collateral guarantees in the form of letters of credit to secure performance or to fund possible damages as the result of an event of
33
default under our contracts with them. If we enter into significant long-term agreements that require the issuance of letters of credit, our liquidity could be negatively impacted.
Our inability to meet our customers' safety standards or adverse publicity affecting our reputation as a result of incidents such as workplace accidents, mechanical failures, spills, uncontrolled discharges, damage to customer or third-party property or the transmission of contaminants or diseases could have a material adverse effect on our sales and profitability.
Maintaining a strong and reliable reputation for safety is critical to our business. Many of our customers actively monitor and review our company-wide safety record. Further, reports and media coverage of incidents, such as those involving workplace accidents, mechanical failures, spills, uncontrolled discharges, damage to customer or third-party property, the transmission of contaminants or diseases and other adverse events can result in negative publicity, and considerable expansion in the use of social media over recent years has increased the ways in which our reputation can be impacted, and the speed with which such an impact can occur. Such incidents, or reports thereof, could lead to a negative perception among our customers, prospective customers and the general public regarding the safety or quality of our products, services and solutions, and anything that damages our reputation or our customers' perception of our safety record, whether or not justified, could have a materially adverse impact on demand for our products and services, result in additional costs to our business or the loss of customers, result in litigation against us or increase government or regulatory oversight over us.
Our products and facilities are subject to risks involving workplace accidents, mechanical failures spills, uncontrolled discharges and damage to customer or third-party property, including, among other things, personal injury or death caused by our products or occurring in our facilities, the destruction of customer or third-party property during the execution of a service arrangement or due to the malfunction of our products, delays in or suspension of service or the failure to timely deliver our products. A workplace accident, mechanical failure, spill, uncontrolled discharge or any problem involving any one or more of our products or facilities, or any perceived insufficiency in our response to any such deficiency or problem, could materially adversely affect our reputation. Many of our customers actively monitor and review our company-wide safety record, and apply rigorous safety standards to us and our competitors. Although we take precautions to prevent workplace accidents and mechanical failures, such incidents are difficult to predict and may be outside of our control. If we are unable to meet our customers' stringent workplace safety standards or, if our customers perceive us to have a poor safety record, it could materially impact our ability to retain their business or attract new business.
Water may be subject to contaminants, including hazardous chemicals, or pathogens that cause a number of illnesses, including cholera, typhoid fever, giardiasis, cryptosporidiosis, amoebiasis and free living amoebic infections. Such contaminants or pathogens may be found in the environment, and, as a result, there is a risk that they could become present in water treated using our systems or products. Illness and death may result if such contaminants or pathogens are not eliminated during the treatment process. In particular, such contamination could result from failing to properly treat reusable products before they are distributed to our customers, or from actions taken by our customers or other third parties using our products, which could result in material liability. Further, any pandemic or other public health crisis, including those involving non-waterborne illnesses, might adversely impact our business by diminishing the public trust in water and wastewater treatment facilities or by causing customers to seek sources of water other than those processed using our systems or products. The potential impact of a contamination of water treated using our products, services or solutions is difficult to predict and could lead to an increased risk of exposure to product liability claims, increased scrutiny by federal and state regulatory agencies and negative publicity. Further, an outbreak of disease in any one of the municipal markets we serve could result in a widespread loss of customers across other such markets.
34
Our operations are subject to various hazards that may cause personal injury or property damage and increase our operating costs, and which may exceed the coverage of our insurance or for which we are not insured.
There are inherent risks to our operations. We are exposed to risks posed by severe weather and other natural disasters, such as hurricanes and earthquakes. In addition to natural risks, hazards (such as fire, explosion, collapse or machinery failure) are inherent risks in our operations which may occur as a result of inadequate internal processes, technological flaws, human error or certain events beyond our control. We further utilize approximately 650 vehicles in connection with our offsite services and distribution operations and, from time to time, these drivers are involved in accidents which may cause injuries, spills or uncontrolled discharges and in which goods carried by these drivers may be lost or damaged. The hazards described above can cause significant personal injury or loss of life, severe damage to or destruction of property, plants and equipment, including customer or third-party property, contamination of, or damage to, the environment and suspension of operations. The occurrence of any of these events may result in our being subject to investigation, required to perform remediation or named as a defendant in lawsuits asserting claims for substantial damages, environmental cleanup costs, personal injury, natural resource damages and fines or penalties. As a result, we may from time to time become exposed to significant liabilities for which we may not have adequate insurance coverage. We may also become exposed to certain claims that are excluded from our insurance coverage, such as claims of fraud or for punitive damages. Although we have liability insurance, we cannot be certain that this insurance coverage will continue to be available to us at a reasonable cost or will be adequate to cover any product liability claims. In addition, such events may affect the availability of personnel, proper functioning of our information technology infrastructure and availability of third parties on whom we rely, any of which consequences could have a material adverse effect on our business, financial condition, results of operations or prospects.
Significant or prolonged disruptions in the supply of goods or services from third parties could materially adversely affect our business, financial condition, results of operations or prospects.
We are dependent on a continuing flow of goods and services from suppliers to provide our products, services and solutions to our customers. A disruption or prolonged delays in obtaining supplies or services, including, for example, chemicals, electricity or other materials, could materially adversely affect our ability to provide our products, services and solutions to our customers, and our ability to operate in compliance with all regulatory requirements, which could have a material adverse effect on our business, financial condition, results of operations or prospects. In certain circumstances, we rely on third parties to provide certain important services and a disruption in these services could materially adversely affect our business, financial condition, results of operations or prospects. Some possible reasons for a delay or disruption in the supply of important goods and services include:
- •
- our suppliers may not provide materials that meet our specifications in sufficient quantities;
- •
- our suppliers may face production delays due to natural disasters, strikes, lock-outs or other such events;
- •
- one or more suppliers could make strategic changes in the lines of products and services they offer; and
- •
- some of our suppliers, such as small companies, may be more likely to experience financial and operational difficulties than larger, well-established companies, because of their limited financial and other resources.
As a result of any of these, or other, factors, we may be required to find alternative suppliers for the materials and services on which we rely. Accordingly, we may experience delays in obtaining appropriate materials and services on a timely basis and in sufficient quantities from such alternative
35
suppliers at a reasonable price, which could interrupt services to our customers and materially adversely affect our business, financial condition, results of operations or prospects.
The loss of, or disruption in, our ability to efficiently operate our distribution network could have a material adverse impact on our business.
We rely on the orderly operation of our receiving and distribution process, which depends on our distribution system, adherence to shipping schedules and effective management of our distribution network. If complications arise with our distribution system or if our shipping or storage facilities (or a significant portion of inventory located there) is severely damaged or destroyed, our ability to receive and deliver our products on a timely basis will be significantly impaired. There can be no assurance that disruptions in operations due to natural or man-made disasters, fire, flooding, terrorism or other catastrophic events, system failure, labor disagreements or shipping problems will not result in delays in the delivery of our products to our customers. Such delays could materially adversely impact our business, financial condition, results of operations or prospects. In addition, we could incur significantly higher costs and longer lead times associated with distributing our products to our customers during the time it takes for us to reopen or replace our facilities. Moreover, our business interruption insurance may not be adequate to cover or compensate us for any losses that may occur.
We rely upon various means of transportation through third parties, including shipments by air, sea, rail and truck, to deliver products to our facilities from vendors and from our facilities to our customers, as well as for direct shipments from vendors to customers. Labor shortages or capacity constraints in the transportation industry, disruptions to the national and international transportation infrastructure, fuel shortages or transportation cost increases (such as increases in fuel costs or port fees) could materially adversely affect our business and operating results.
We rely, in part, on third-party sales representatives to assist in selling our products, services and solutions and the failure of these representatives to perform as expected could reduce our future sales.
Sales of our products, services and solutions to some of our customers, including to OEMs, are accomplished, in part, through the efforts of third-party sales representatives. We are unable to predict the extent to which these third-party sales representatives will be successful in marketing and selling our products. Moreover, many of these third-party sales representatives also market and sell competing products and may more aggressively pursue sales of our competitors' products. Our third-party sales representatives may terminate their relationships with us at any time on short or no notice. Our future performance may also depend, in part, on our ability to attract, incentivize and retain additional third-party sales representatives that will be able to market and support our products effectively, especially in markets in which we have not previously sold our products. If we cannot retain our current third-party sales representatives or recruit additional or replacement third-party sales representatives or if these sales representatives are not effective, it could have a material adverse effect on our business, financial condition, results of operations or prospects.
Our products, services and solutions, or our participation in large-scale projects, could expose us to litigation, regulatory or enforcement actions and reputational risk.
We are subject to various laws, ordinances, regulations and other requirements of government authorities in foreign countries and in the United States, any violation of which could potentially create substantial liability for us. Changes in laws, ordinances, regulations or other government policies, the nature, timing and effect of which are uncertain, may significantly increase our expenses and liabilities.
From time to time, we are involved in lawsuits that arise from our business. Litigation may, for example, relate to product liability claims, personal injury, property damage, accidents, regulatory issues, contract disputes or employment matters. We may face claims that are broader than the scope
36
of our involvement on a project, including claims that seek to impose liability on us for an entire solution or system for which we provided only limited components.
The occurrence of any of these matters could also create possible damage to our reputation. The defense and ultimate outcome of lawsuits against us may result in higher operating expenses. Higher operating expenses or reputational damage could have a material adverse effect on our business, financial condition, results of operations or prospects.
It is not possible to predict with certainty the outcome of claims, investigations and lawsuits, and we could in the future incur judgments, fines or penalties or enter into settlements of lawsuits and claims that could have a material adverse effect on our business, financial condition, results of operations or prospects in any particular period. Additionally, we may be required to change or cease operations at one or more facilities if a regulatory agency determines that we have failed to comply with laws, regulations or orders applicable to our business.
A number of factors may prevent or delay our building new plants, expanding our existing plants or installing equipment at our customers' facilities, including our dependence on third-party suppliers and construction companies.
A number of factors may prevent or delay construction, expansion or use of our facilities or installation of our equipment at our customers' facilities, including our dependence on third-party suppliers of equipment and materials, our dependence on third-party construction companies and the timing of equipment purchases.
Further, we enter into contracts for customers regarding long-term engineering, procurement and construction projects. If a construction company we have commissioned to build a new project defaults or fails to fulfill its contractual obligations, we could face significant delays and cost overruns. Any construction delays could have a material adverse impact on us.
The timing of equipment purchases can pose financial risks to us. We attempt to make purchases of equipment and/or material as needed. However, from time to time, there may be excess demand for certain types of equipment with substantial delays between the time we place orders and receive delivery. In those instances, to avoid construction delays, service disruptions or liquidated damages associated with the inability to own and place such equipment or materials into service when needed, we may place orders well in advance of deployment or when actual damage to the equipment or materials occurs. Thus, there is a risk that at the time of delivery of such equipment or materials, there may not yet be a need to use them; however, we are still required to accept delivery and make payment. In addition, due to the customization of some of our equipment or materials, there may be a limited market for resale of such equipment or material. This can result in our incurrence of material equipment and/or material costs, with no use for or ability to resell such equipment.
Our financial results may fluctuate from period to period and can be difficult to predict.
Our financial results may be impacted by large projects, the timing of which can change based upon customer requirements due to a number of factors affecting the project, such as funding, readiness of the project and regulatory approvals. Further, the cancellation of any such large projects may have a material adverse effect on our business, financial condition, results of operations or prospects. In addition, of our contracts for large capital water treatment projects, systems and solutions for municipal and industrial applications are generally fixed-price contracts with milestone billings. Additionally, competitive-bid processes impose significant uncertainty with respect to our prospects for success, and our failure to properly predict our win rate could reduce our margins. Accordingly, our financial results for any given period may fluctuate and can be difficult to predict.
37
Further, our capital expenditures for any given fiscal year may exceed our initial forecasts and may vary substantially if we are required to undertake certain actions to comply with new regulatory requirements or compete with new technologies. We may not have the capital to undertake the capital investments. If we are unable to do so, we may not be able to effectively compete.
Seasonality of sales and weather conditions may adversely affect, or cause volatility in, our financial results.
We experience seasonal demand in a number of our markets, as demand for infrastructure and municipal products and projects follows warm weather trends. Seasonal effects may vary from year to year and are impacted by weather patterns, particularly by temperatures, heavy flooding and droughts.
Additionally, our operating results and financial condition could be materially and adversely affected by severe weather, natural disasters, environmental factors, terrorist or other deliberate attacks or hazards (such as fire, explosion or mechanical failure) resulting from inadequate internal processes, technical flaws, human error or other circumstances. Repercussions of these catastrophic events may include:
- •
- shutting down or curtailing the operation of affected plants and facilities for limited or extended periods;
- •
- the need to obtain necessary equipment or supplies, including electricity, which may not be available to us in a timely manner or at a
reasonable cost;
- •
- evacuation of or injury to personnel;
- •
- damage or catastrophic loss to our equipment, facilities and project work sites, resulting in suspension of operations or delays in building or
maintaining our plants;
- •
- loss of productivity;
- •
- interruption to any projects that we may have in process; and
- •
- harm to our brand and reputation.
Government customers involve unique policy-, contract- and performance-related risks, and we may face challenges to our government contracts or our eligibility to serve government customers, any of which could materially adversely impact our business, financial condition, results of operations or prospects.
We derive, and expect to continue to derive in the future, a substantial portion of our revenues from government customers. Sales to governments and related entities present risks in addition to those involved in sales to industrial and other customers, including policy-related risks such as potential disruption due to appropriation and spending patterns, delays in the adoption of new technologies due to political, fiscal or bureaucratic processes, delays in approving budgets and the government's right to cancel contracts and purchase orders for its convenience. General political and economic conditions, which we cannot accurately predict, also directly and indirectly affect policies relating to the quantity and allocation of expenditures by government customers. In addition, government contracts may involve long purchase and payment cycles, competitive bidding requirements, qualification requirements, delays or changes in agreed-to funding, budgetary constraints, political agendas, extensive specification development and price negotiations, milestone requirements and the potential unenforceability of limitations on liability or other contractual provisions, any of which may create price pressure and reduce our margins. Because our water treatment projects and solutions for municipal customers often include fixed-price contracts with milestone billings and liquidated damages for our delay, our performance under such contracts involves risks such as not receiving payments, not receiving payments in a timely manner or incurring significant damages if certain milestones are not met or not met on schedule. As a result, we could experience a material adverse effect on our business, financial condition, results of operations or prospects.
38
Each government entity also maintains its own rules and regulations with which we must comply and which can vary significantly among customers. We face risks associated with the failure to comply with such rules and regulations. These risks include bid protests, in which our competitors could challenge the contracts we have obtained, or suspension, debarment or similar ineligibility from serving government customers. Challenges to our current or future government contracts or to our eligibility to serve government customers could result in a loss of government sales and have a material adverse effect on our business, financial condition, results of operations or prospects.
Our contracts with federal, state and local governments may be terminated or adversely modified prior to completion, which could adversely affect our business.
Government contracts generally contain provisions, and are subject to laws and regulations, that give the government rights and remedies not typically found in commercial contracts, including provisions permitting the government to:
- •
- terminate our existing contracts;
- •
- reduce potential future revenues from our existing contracts;
- •
- modify some of the terms and conditions in our existing contracts;
- •
- suspend or permanently prohibit us from doing business with the government or with any specific government agency;
- •
- impose fines and penalties;
- •
- subject us to criminal prosecution or debarment;
- •
- subject the award of some contracts to protest or challenge by competitors, which may require the contracting agency or department to suspend
our performance pending the outcome of the protest or challenge and which may also require the government to solicit new bids for the contract or result in the termination, reduction or modification
of the awarded contract;
- •
- suspend work under existing multiple year contracts and related task orders if the necessary funds are not appropriated by U.S. Congress or
state or local legislatures;
- •
- decline to exercise an option to extend an existing multiple year contract; and
- •
- claim rights in technologies and systems invented, developed or produced by us.
The government may terminate a contract with us either for convenience (for instance, due to a change in its perceived needs or its desire to consolidate work under another contract) or if we default by failing to perform under the contract. Upon a termination for convenience, we are generally able to recover the purchase price for delivered items and reimbursement of allowable work-in-process costs. If the government terminates a contract with us based upon our default, we generally would be denied any recovery for undelivered work, and instead may be liable for excess costs incurred by the government in procuring undelivered items from an alternative source and other damages as authorized by law. We may in the future receive show-cause or cure notices under contracts that, if not addressed to the government's satisfaction, could give the government the right to terminate those contracts for default or to cease procuring our services under those contracts.
The cost of complying with complex governmental regulations applicable to our business, sanctions resulting from non-compliance or reduced demand resulting from certain changes in regulations could increase our operating costs and reduce our profit.
Our operations are subject to various licensing, permitting, approval and reporting requirements imposed by federal, state, local and foreign laws. Our operations are subject to inspection and
39
regulation by various governmental agencies, including the U.S. EPA, the Occupational Safety and Health Administration and equivalent state and local agencies, as well as their counterparts in various states and foreign countries. A major risk inherent in our operations is the need to obtain and renew permits from federal, state and local authorities. Delays in obtaining permits, the failure to obtain a permit or a renewal permit for a project, challenges to our permits by local communities, citizen groups, landowners or others opposed to their issuance or the issuance of a permit with unreasonable conditions or costs could limit our ability to effectively provide our services. We are also required to secure and maintain licenses required by several states which can take a significant amount of time and result in our inability or delays in our ability to bid on and execute certain projects. If we fail to secure or maintain any such licenses or if states place burdensome restrictions or limitations on our ability to obtain or maintain such licenses, we may not be able to operate in such states and our business, financial condition, results of operations or prospects may be materially adversely affected as a result.
Our business may be further impacted by changes in federal, state and local requirements that set forth air and wastewater discharge parameters, constrain water availability and set quality and treatment standards. Our failure or inability to comply with the stringent standards set forth by regulating entities or to provide cost-effective and compliant design and construction solutions could result in fines or other penalties, and could have a material adverse effect on our business, financial condition, results of operations or prospects.
Foreign, federal, state and local environmental, health and safety laws and regulations impose substantial compliance requirements on our operations. Our operating costs could be significantly increased in order to comply with new or stricter regulatory standards imposed by foreign, federal and state environmental agencies.
Our operations, products and services are governed by various foreign, federal, state and local environmental protection and health and safety laws and regulations, including, without limitation, the federal Safe Drinking Water Act, the Clean Water Act, the Clean Air Act, the Resource Conservation and Recovery Act, the Occupational Safety and Health Act, the Toxic Substances Control Act and the Federal Insecticide, Fungicide, and Rodenticide Act in the United States, the Registration, Evaluation and Authorization of Chemicals, or REACH, directive in Europe, and similar foreign, federal, state and local laws and regulations and permits issued under these laws by the foreign, federal, state and local environmental and health and safety regulatory agencies. These laws and regulations establish, among other things, criteria and standards for drinking water and for discharges into the waters of the United States and its states, for the proper management of hazardous and non-hazardous solid waste and for protection of public and worker health and safety. Pursuant to these laws, we are required to obtain various environmental permits from environmental regulatory agencies for our operations. We cannot assure you that our operations, products or services will be at all times in total compliance with these laws, regulations and permits or that we will be able to obtain or renew all required permits. If we violate or fail to comply with these laws, regulations or permits, we could be fined or otherwise sanctioned by regulators and be subject to lawsuits, civil or criminal, seeking enforcement and/or injunctive relief. We may also be subject to civil claims by citizens groups seeking to enforce environmental laws. In the event of an accident or if we otherwise fail to comply with applicable regulations, we could lose our permits or approvals and/or be held liable for damages and monetary penalties.
Environmental laws and regulations are complex and change frequently. These laws, and the enforcement thereof, have tended to become more stringent over time. It is possible that new standards could be imposed, either stricter or more lenient, that could result in the obsolescence of our products or lead to an interruption or suspension of our operations and have a material adverse effect on the productivity and profitability of a particular manufacturing facility, service or product or on us as a whole.
40
Wastewater operations entail significant risks that may impose significant costs.
Wastewater treatment involves various unique risks. If our treatment systems fail or do not operate properly, or if there is a spill, untreated or partially treated wastewater could discharge onto property or into nearby streams and rivers, causing various damages and injuries, including environmental damage. These risks are most acute during periods of substantial rainfall or flooding, which are the main causes of sewer overflow and system failure. Liabilities resulting from such damages and injuries could materially adversely affect our business, financial condition, results of operations or prospects.
These risks could be increased by the potential physical impacts of climate change on our operations. The physical impacts of climate change are highly uncertain and would vary depending on geographical location, but could include changing temperatures, water shortages, changes in weather and rainfall patterns and changing storm patterns and intensities. Many climate change predictions, if true, present several potential challenges to water and wastewater service providers, such as increased precipitation and flooding, potential degradation of water quality and changes in demand for water services.
Failure to comply with applicable anti-corruption and trade laws, regulations and policies, including the U.S. Foreign Corrupt Practices Act, could result in fines and criminal penalties, causing a material adverse effect on our business, financial condition, results of operations or prospects.
Due to our global operations, we are subject to regulation under a wide variety of U.S. federal and state and non-U.S. laws, regulations and policies related to anti-corruption and trade, including those related to export and import compliance, anti-trust and money laundering. The U.S. Foreign Corrupt Practices Act, the U.K. Bribery Act of 2010 and similar anti-bribery laws in other jurisdictions generally prohibit companies and their intermediaries from making improper payments to government officials or other persons for the purpose of obtaining or retaining business. The International Traffic in Arms Regulations generally require export licenses from the U.S. Department of State for goods, technical data and services sent outside the United States that have military or strategic applications. The Export Administration Regulations regulate the export of certain "dual use" goods, software and technologies, and in some cases requires export licenses from the U.S. Department of Commerce. Office of Foreign Asset Control regulations implement various sanctions programs that include prohibitions of restrictions on dealings with certain sanctioned countries, governments, entities and individuals. Our policies mandate compliance with these anti-bribery and trade laws, regulations and policies, and we have established policies and procedures designed to assist us and our personnel in compliance with applicable United States and international laws and regulations. However, we operate in parts of the world that are recognized as having governmental and commercial corruption and in certain circumstances, strict compliance with anti-bribery and trade laws, regulations and policies may conflict with local customs and practices. We cannot assure you that our internal control policies and procedures will always protect us from improper conduct of our employees or business partners. In the event that we believe or have reason to believe that our employees or agents have or may have violated applicable laws, including anti-corruption and trade laws, regulations and policies, we may be required to investigate or engage outside counsel to investigate the relevant facts and circumstances, which can be expensive and require significant time and attention from senior management. Any such violation could result in substantial fines, sanctions, civil and/or criminal penalties, imprisonment, disgorgement of profits, debarment from government contracts and curtailment of operations in certain jurisdictions, and might materially adversely affect our business, financial condition, results of operations or prospects. In addition, actual or alleged violations could damage our reputation and diminish our ability to do business. Furthermore, detecting, investigating and resolving actual or alleged violations is expensive and can consume significant time and attention of our senior management.
41
Our business, results of operations and financial condition may be materially adversely affected by risks associated with international sales and operations.
Our international sales and operations are subject, in varying degrees, to risks inherent to doing business outside the United States. These risks include the following:
- •
- changes in trade protection measures, including tariff and trade barriers and import and export licensing requirements;
- •
- potential negative consequences from changes to taxation policies;
- •
- unanticipated changes in other laws, governmental policies and regulations, or in how such provisions are interpreted or administered;
- •
- risks associated with the withdrawal of the United Kingdom from the European Union, commonly known as "Brexit," including volatility in
worldwide and European financial markets, potential restrictions on the free movement of goods and labor between the United Kingdom and the European Union and other impediments to our ability to
transact within and between each of the United Kingdom and the European Union;
- •
- potential disruptions in our global supply chain;
- •
- possibility of unfavorable circumstances arising from host country laws or regulations;
- •
- restrictions on, or taxation of, dividends on repatriation of earnings under applicable local law, monetary transfer restrictions and foreign
currency exchange regulations in the jurisdictions in which our subsidiaries operate;
- •
- currency exchange rate fluctuations and restrictions on currency repatriation;
- •
- labor disturbances;
- •
- safety and security considerations;
- •
- increased costs and risks of developing and managing global operations, including our potential failure to implement global best practices,
experiences of employee dissatisfaction and the improper allocation of resources, as a result of distance as well as language and cultural differences; and
- •
- political instability insurrection, armed conflict, terrorism or war.
In addition to the general risks that we face outside the United States, our operations in emerging markets could involve additional uncertainties for us, including risks that governments may impose limitations on our ability to repatriate funds; governments may impose withholding or other taxes on remittances and other payments to us, or the amount of any such taxes may increase; an outbreak or escalation of any insurrection or armed conflict may occur; governments may seek to nationalize our assets; or governments may impose or increase investment barriers or other restrictions affecting our business. The emerging markets in which we are active, including China, pose other uncertainties, including the difficulty of enforcing agreements, collecting receivables, protecting of our intellectual property and other assets and pricing of our products appropriately, as well as higher business conduct risks, less qualified talent and risks of political instability. We cannot predict the impact such events might have on our business, financial condition, results of operations or prospects.
Our operations in China expose us to risks inherent in doing business there.
We currently have operations and source and manufacture certain of our materials and products for global distribution from third-party suppliers and manufacturers in China. The political, legal and economic climate in China, both nationally and regionally, is fluid and unpredictable, and operating in
42
China exposes us to political, legal and economic risks. Our ability to operate in China may be adversely affected by changes in U.S. and Chinese laws and regulations such as those related to, among other things, taxation, import and export tariffs, environmental regulations, land use rights, intellectual property, currency controls, network security, employee benefits and other matters, and we may not obtain or retain the requisite legal permits to continue to operate in China or we may become subject to costs or operational limitations imposed in connection with obtaining and complying with such permits. In addition, Chinese trade regulations are in a state of flux, and we may become subject to other forms of taxation, tariffs and duties in China. We may experience difficulty in establishing management, legal and financial controls, collecting financial data and preparing financial statements, books of account and corporate records and instituting business practices that meet U.S. and international standards. We may also experience difficulty in managing relations with our employees, distributors, suppliers or customers, with whom disagreements or conflicts of interest could materially adversely affect our operations or our ability to source and manufacture certain of our materials and products in China. Further, the third parties we rely on in China may disclose our confidential information or intellectual property to competitors or third parties, which could result in the illegal distribution and sale of counterfeit versions of our products. Any of these factors could have a material adverse effect on our business, financial condition, results of operations or prospects.
Additionally, the rapid development of the Chinese economy has led to increased labor costs, and the cost of labor in China may continue to increase in the future. Our results of operations will be materially and adversely affected if our labor costs, or the labor costs of our suppliers and manufacturers, increase significantly. We and our manufacturers and suppliers may be unable to find a sufficient number of qualified workers due to the intensely competitive and fluid market for skilled labor in China. Furthermore, pursuant to Chinese labor laws, employers in China are subject to various requirements when signing labor contracts, paying remuneration, determining the term of employees' probation and unilaterally terminating labor contracts. These labor laws and related regulations impose liabilities on employers and may significantly increase the costs of workforce reductions. If we decide to change or reduce our workforce, these labor laws could limit or restrict our ability to make such changes in a timely, favorable and effective manner. Any of these events could have a material adverse effect our business, financial condition, results of operations or prospects.
If we do not or cannot adequately protect our intellectual property, if third parties infringe our intellectual property rights, or if third parties claim that we are infringing or misappropriating their intellectual property rights, we may suffer competitive injury, expend significant resources enforcing our rights or defending against such claims, or be prevented from selling products or services.
We own numerous patents, trademarks, service marks, copyrights, trade secrets and other intellectual property and licenses to intellectual property owned by others, which in aggregate are important to our business. The intellectual property rights that we obtain, however, may not provide our products and services with a significant competitive advantage because our rights may not be sufficiently broad or may be challenged, invalidated, or subject to government march-in or sovereign rights or compulsory licensing, sunshine laws, or be subject to freedom of information requests, or court-ordered public disclosure, or be subject to open-source software licensing, or be circumvented, independently developed or designed-around, misappropriated, disparaged, diluted, or stolen, particularly in countries where intellectual property rights laws are not highly developed, protected or enforced. Our failure to obtain or maintain intellectual property rights that convey competitive advantage, adequately protect our intellectual property or detect or prevent circumvention or unauthorized use of such property and the cost of enforcing our intellectual property rights could materially adversely impact our business, financial condition, results of operations or prospects.
43
From time to time, we, or on occasion our suppliers, contractors or indemnified parties in our supply chain including end-users, receive notices from third parties alleging or warning of potential intellectual property infringement or misappropriation. Any dispute or litigation regarding intellectual property could be costly and time-consuming due to the complexity and the uncertainty of intellectual property litigation. Our intellectual property portfolio may not be useful in asserting a counterclaim, or negotiating a license, in response to a claim of infringement or misappropriation. We may incur significant costs and diversion of management attention and resources as a result of such claims of infringement or misappropriation, and we or our suppliers or sub-contractors could lose rights to critical technology, be unable to license critical technology, provide or sell critical products or services, or be required to pay substantial damages or license fees with respect to the infringed rights or be required to redesign, rework, re-program, or replace our or our customers' products, sub-components, software, or systems, or re-cast our valuable brands at substantial cost, any of which could materially adversely impact our competitive position, financial condition and results of operations even if we successfully defend against such claims of infringement or misappropriation.
We are increasingly dependent on the continuous and reliable operation of our information technology systems, and a disruption of these systems could materially adversely affect our business.
We rely on our information technology systems in connection with the operation of our business, including with respect to customer service and billing, accounting and, in some cases, the monitoring and operation of our installations. Many of our products, services and solutions depend on the integrity of our information technology systems, including our Water One remote system, monitoring and data analytics features and our automated control solutions. In addition, we rely on our systems to manage maintenance and construction projects, materials and supplies and our human resource functions. A loss of these systems, major problems with the operation of these systems, the failure to properly implement these systems, including in customer installations, or the failure to identify market trends and continuously update our information technology systems could materially adversely affect our operations, sales and reputation and have a material adverse effect on our business, financial condition, results of operations or prospects.
Specifically, our information technology systems may be vulnerable to damage or interruption from:
- •
- power loss, computer systems failures and internet, telecommunications or data network failures;
- •
- operator negligence or improper operation by, or supervision of, employees;
- •
- physical and electronic loss of data;
- •
- computer viruses;
- •
- intentional security breaches, hacking, denial of service actions, misappropriation of data and similar events; and
- •
- hurricanes, fires, floods, earthquakes and other natural disasters.
Such incidents may result in the loss or compromise of customer, financial or operational data, disruption of billing, collections or normal field service activities, disruption of data analytics and electronic monitoring and control of operational systems and delays in financial reporting and other normal management functions. Possible impacts associated with a cybersecurity incident may include remediation costs related to lost, stolen, or compromised data, repairs to infrastructure, physical systems or data processing systems, increased cybersecurity protection costs, adverse effects on our compliance with regulatory and environmental laws and regulations, including standards for drinking water, litigation and reputational damage.
44
We, and some of our third party vendors, have experienced cybersecurity attacks in the past and may experience them in the future, potentially with more frequency. To date, most of these attacks have been unsuccessful, and none have resulted in any material adverse impact to our business or operations. We have adopted measures to mitigate potential risks associated with information technology disruptions and cybersecurity threats, however, given the unpredictability of the timing, nature and scope of such disruptions, we could potentially be subject to production downtimes, operational delays, other detrimental impacts on our operations or ability to provide products and services to our customers, the compromising of confidential or otherwise protected information, destruction or corruption of data, security breaches, other manipulation or improper use of our systems or networks, financial losses from remedial actions, loss of business or potential liability, regulatory enforcement actions and/or damage to our reputation, any of which could have a material adverse effect on our competitive position, results of operations, cash flows or financial condition. We also have a concentration of operations on certain sites, such as production and shared services centers, where business interruptions could cause material damage and costs. Transport of goods from suppliers, and to customers, could also be hampered for the reasons stated above.
Although we continue to assess these risks, implement controls and perform business continuity and disaster recovery planning, we cannot be sure that interruptions with material adverse effects will not occur.
If we experience a significant data security breach or fail to detect and appropriately respond to a significant data security breach, our business and reputation could suffer.
The nature of our business involves the receipt and storage of information about our customers, suppliers and employees. Further, we rely on various information technology systems to capture, process, store and report data in connection with the products, services and solutions that we provide to our customers, such as our Water One smart water technology. We have procedures in place to detect and respond to data security incidents. However, because the techniques used to obtain unauthorized access, disable or degrade service, or sabotage systems change frequently and may be difficult to detect for long periods of time, we may be unable to anticipate these techniques or implement adequate preventive measures. In addition, hardware, software or applications we develop or procure from third parties may contain defects in design or manufacture or other problems that could unexpectedly compromise information security. We outsource administration of certain functions to vendors that could be targets of cyber attacks. Any theft, loss and/or fraudulent use of customer, employee or proprietary data as a result of a cyber attack could subject us to significant litigation, liability and costs, as well as adversely impact our reputation with customers and regulators, among others. Unauthorized parties may also attempt to gain access to our systems or facilities and to our proprietary business information. If our efforts to protect the security of information about our customers, suppliers and employees are unsuccessful, a significant data security breach may result in costly government enforcement actions, private litigation and negative publicity resulting in reputation or brand damage with customers, and our business, financial condition, results of operations or prospects could suffer.
Our business could be adversely affected by inflation and other manufacturing and operating cost increases.
Our operating costs are subject to fluctuations, particularly due to changes in commodity prices, raw materials, energy and related utilities, freight and cost of labor. In order to remain competitive, we may not be able to recuperate all or a portion of these higher costs from our customers through product price increases. In addition, many of our contracts are long-term in nature, and our failure to negotiate price escalation provisions, or to obtain adequate price escalation provisions, in our long-term contracts could, in the event of an inflationary or otherwise cost-increasing environment, have a material adverse effect on our business, financial condition, results of operations or prospects. Further,
45
in a declining price environment, our operating margins may contract because we account for inventory costs on the basis of an average or first-in, first-out method. Actions we take to mitigate volatility in manufacturing and operating costs may not be successful and, as a result, our business, financial condition, results of operations or prospects could be materially and adversely affected.
Our ability to use our net operating loss carryforwards may be limited.
As of September 30, 2016, we had approximately $88.6 million of U.S. federal and state net operating loss carryforwards ("NOLs"). Our NOLs begin to expire in 2019. Utilization of these NOLs depends on many factors, including our future income, which cannot be assured. We have full valuation allowance against the NOLs. In addition, Section 382 of the Internal Revenue Code of 1986, as amended ("Section 382"), generally imposes an annual limitation on the amount of taxable income that may be offset by NOLs when a corporation has undergone an "ownership change" (as determined under Section 382). Generally, a corporation experiences such an ownership change if the percentage of its stock owned by its "5-percent shareholders," as defined in Section 382, increases by more than 50 percentage points (by value) over a three-year period. Any unused annual limitation may, subject to certain limitations, be carried over to later years. We may undergo an ownership change in the future, including an ownership change as a result of the combined effect of this and future offerings, which would result in an annual limitation under Section 382 determined by multiplying the value of our stock at the time of the ownership change by the applicable long-term tax-exempt rate as defined in Section 382, increased under certain circumstances as a result of recognizing built-in gains in our assets existing at the time of the ownership change. The limitations arising from any ownership change may prevent utilization of our NOLs prior to their expiration. Future ownership changes or regulatory changes could further limit our ability to utilize our NOLs. To the extent we are not able to offset our future income with our NOLs, this could adversely affect our operating results and cash flows if we attain profitability.
Changes in our effective tax rates may adversely affect our financial results.
We offer our products, services and solutions in more than 100 countries and 16% of our revenue was generated outside the United States in fiscal 2016. Given the global nature of our business, a number of factors may increase our future effective tax rates, including:
- •
- our decision to repatriate non-U.S. earnings for which we have not previously provided for U.S. taxes;
- •
- the jurisdictions in which profits are determined to be earned and taxed;
- •
- sustainability of historical income tax rates in the jurisdictions in which we conduct business;
- •
- the resolution of issues arising from tax audits with various tax authorities; and
- •
- changes in the valuation of our deferred tax assets and liabilities, and changes in deferred tax valuation allowances.
Any significant increase in our future effective tax rates could reduce net income for future periods.
46
Our historical consolidated financial information may not be representative of our results if we had operated independently of Siemens and does not reflect further changes to our management structure following our separation from Siemens and, as a result, may not be a reliable indicator of the results that we will achieve as an independent company.
Prior to the AEA Acquisition in fiscal 2014, we operated as a subsidiary of Siemens. Consequently, some of the financial information included in this prospectus has been derived from the combined and consolidated financial statements and accounting records of Siemens and reflects assumptions and allocations made by Siemens. Our financial position, results of operations and cash flows, as presented, may be different from those that would have resulted if we had been operated as a standalone company or by a company other than Siemens. For example, in preparing our financial statements, Siemens made an allocation of Siemens' costs and expenses that were attributable to our business. However, these costs and expenses reflect the costs and expenses attributable to our business as part of a larger organization. They do not necessarily reflect costs and expenses that we would have incurred had we operated independently, and may not reflect costs and expenses that we would have incurred as a result of the acquisitions and divestitures that we have made since our separation from Siemens. In addition, our fiscal 2012 and fiscal 2013 selected historical consolidated financial statements were prepared on a "carve-out" basis for the purpose of presenting our historical financial position, results of operations and cash flows. Because the Predecessor represents a portion of the Siemens' business, the selected financial data presented for these periods in "Selected Historical Consolidated Financial Data" is not necessarily indicative of our current or future performance and does not reflect what our performance would have been had we operated as a separate stand-alone entity during these periods. Further, in fiscal 2016, we effected an organizational redesign to align the management activities of certain of our business centers with functional leaders and, in connection with the Neptune-Benson Acquisition, created a new Aquatics and Disinfection division, which we subsequently merged into our Products Segment. This realignment has had implications on how we manage our business. As a result, our historical financial information may not be a reliable indicator of our future results or the results that we will achieve following the acquisitions and divestitures that we have made and the realignment of our management structure following our separation from Siemens.
The unaudited pro forma financial information included in this prospectus is presented for illustrative purposes only and does not reflect what the financial position or results of operations of the combined company would have been had the transactions reflected therein been completed as of the dates assumed for purposes of that pro forma information nor does it reflect the actual financial position or results of operations of the combined company following the completion of such transactions.
The unaudited pro forma financial information included in this prospectus is presented for illustrative purposes only, contains a variety of adjustments, assumptions and preliminary estimates, is subject to numerous other uncertainties and does not reflect what the combined company's financial position or results of operations would have been had the transactions reflected therein been completed as of the dates assumed for purposes of that pro forma financial information, nor does it reflect the financial position or results of operations of the combined company following the completion of any of our other recent acquisitions. The unaudited pro forma financial information does not give effect to any unforeseen costs that could result from such transactions, nor does it include any other items not expected to have a continuing impact on our consolidated results of operations.
Our and Neptune-Benson's actual results of operations prior to the Neptune-Benson Acquisition and that of our Company following the Neptune-Benson Acquisition may not be consistent with, or evident from, the unaudited pro forma financial information included in this prospectus. In addition, the assumptions or estimates used in preparing the unaudited pro forma financial information included in this prospectus may not prove to be accurate and may be affected by other factors. Any significant changes in the costs associated with the acquisition (whether as a result of contractual purchase price
47
adjustments or otherwise), or in our ability to manage our combined operations, realize anticipated growth opportunities and optimize best practices, from those assumed or used for purposes of preparing the estimated pro forma financial information may cause a significant change in the pro forma financial information.
We are a holding company with no operations of our own, and we depend on our subsidiaries for cash.
We are a holding company and do not have any material assets or operations other than ownership of equity interests of our subsidiaries. Our operations are conducted almost entirely through our subsidiaries, and our ability to generate cash to meet our obligations or to pay dividends, if any, is highly dependent on the earnings of, and receipt of funds from, our subsidiaries through dividends or intercompany loans. The ability of our subsidiaries to generate sufficient cash flow from operations to allow us and them to make scheduled payments on our debt obligations will depend on their future financial performance, which will be affected by a range of economic, competitive and business factors, many of which are outside of our control. We cannot assure you that the cash flow and earnings of our operating subsidiaries will be adequate for our subsidiaries to service their debt obligations. Additionally, under the terms of our Senior Secured Credit Facilities, our operating subsidiaries are currently limited in their ability to pay cash dividends to us, and we expect these limitations to continue in the future under the terms of any future credit agreement or any future debt or preferred equity securities of ours or of our subsidiaries. If our subsidiaries do not generate sufficient cash flow from operations to satisfy corporate obligations, we may have to undertake alternative financing plans (such as refinancing), restructure debt, sell assets, reduce or delay capital investments or seek to raise additional capital. We cannot assure you that any such alternative refinancing would be possible, that any assets could be sold, or, if sold, of the timing of the sales and the amount of proceeds realized from those sales, that additional financing could be obtained on acceptable terms, if at all, or that additional financing would be permitted under the terms of our various debt instruments then in effect. Our inability to generate sufficient cash flow to satisfy our obligations, or to refinance our obligations on commercially reasonable terms, could have a material adverse effect on our business, financial condition, results of operations or prospects.
Furthermore, we and our subsidiaries may incur substantial additional indebtedness in the future that may severely restrict or prohibit our subsidiaries from making distributions, paying dividends, if any, or making loans to us.
We may incur impairment charges for our goodwill and other indefinite-lived intangible assets which would negatively impact our operating results.
We have a significant amount of goodwill and purchased intangible assets on our balance sheet as a result of the AEA Acquisition and subsequent acquisitions we have completed, including the Neptune-Benson Acquisition. As of June 30, 2017, the net carrying value of our goodwill and other indefinite-lived intangible assets totaled approximately $657 million. The carrying value of goodwill represents the fair value of an acquired business in excess of identifiable assets and liabilities as of the acquisition date. The carrying value of indefinite-lived intangible assets represents the fair value of trademarks and trade names as of the acquisition date. We do not amortize goodwill and indefinite-lived intangible assets that we expect to contribute indefinitely to our cash flows, but instead we evaluate these assets for impairment at least annually, or more frequently if changes in circumstances indicate that a potential impairment could exist. In testing for impairment, we will make a qualitative assessment, and if we believe that it is more likely than not that the fair value of a reporting unit is less than its carrying amount, the quantitative two-step goodwill impairment test is required. Significant negative industry or economic trends, disruptions to our business, inability to effectively integrate acquired businesses, unexpected significant changes or planned changes in use of the assets, divestitures and market capitalization declines may impair our goodwill and other indefinite-lived intangible assets.
48
Any charges relating to such impairments could materially adversely affect our financial condition and results of operations.
Risks Relating to our Indebtedness
Our substantial indebtedness could adversely affect our financial condition and limit our ability to raise additional capital to fund our operations.
We have a significant amount of indebtedness. As of June 30, 2017, we had total indebtedness of $893.2 million, including $818.7 million of borrowings under the Term Loan Facility, $60.0 million in borrowings under the Revolving Credit Facility and $7.5 million of letters of credit issued under the Revolving Credit Facility, with $27.5 million in additional borrowing capacity thereunder. An additional $8.4 million of letters of credit were issued under a separate uncommitted facility as of June 30, 2017. On August 8, 2017, we (i) borrowed $262.7 million in refinancing term loans, the net proceeds of which were used to refinance in their entirety the NB Incremental Loans, and (ii) increased the amount of our existing Term Loan Facility by borrowing $80.0 million of incremental term loans under the Term Loan Facility, the net proceeds of which were used to repay $60.0 million of revolving credit loans then outstanding under our Revolving Credit Facility and to pay related fees and expenses, and for other general corporate purposes (including permitted acquisitions and permitted investments pursuant to the First Lien Credit Agreement).
Our high level of indebtedness could have important consequences to us, including:
- •
- making it more difficult for us to satisfy our obligations with respect to our debt;
- •
- limiting our ability to obtain additional financing to fund future working capital, capital expenditures, investments or acquisitions or other
general corporate requirements;
- •
- requiring a substantial portion of our cash flows to be dedicated to debt service payments and/or debt repayment instead of other purposes,
thereby reducing the amount of cash flows available for working capital, capital expenditures, investments or acquisitions or other general corporate purposes;
- •
- increasing our vulnerability to adverse changes in general economic, industry and competitive conditions;
- •
- exposing us to the risk of increased interest rates as borrowings under our Senior Secured Credit Facilities (to the extent not hedged) bear
interest at variable rates, which could further adversely impact our cash flows;
- •
- limiting our flexibility in planning for and reacting to changes in our business and the industry in which we compete;
- •
- restricting us from making strategic acquisitions or causing us to make non-strategic divestitures;
- •
- impairing our ability to obtain additional financing in the future;
- •
- placing us at a disadvantage compared to other, less leveraged competitors; and
- •
- increasing our cost of borrowing.
Any one of these limitations could have a material effect on our business, financial condition, results of operations, prospects and our ability to satisfy our obligations in respect of our outstanding debt.
49
Despite our current debt levels, we may incur substantially more indebtedness, which could further exacerbate the risks associated with our substantial leverage.
We and our subsidiaries may be able to incur additional indebtedness in the future, which may be secured. While our Senior Secured Credit Facilities limit our ability and the ability of our subsidiaries to incur additional indebtedness, these restrictions are subject to a number of qualifications and exceptions and thus, notwithstanding these restrictions, we may still be able to incur substantially more debt. In addition, provided that no default or event of default (as defined in the First Lien Credit Agreement) has occurred and is continuing, we have the option to add one or more incremental term loan or revolving credit facilities or increase commitments under the Revolving Credit Facility by an aggregate amount which does not cause our total first lien net leverage ratio, on a pro forma basis (in each case, as defined in the First Lien Credit Agreement), to exceed 4.50 to 1.00, plus up to an additional $100.0 million (excluding incremental revolving credit facilities or increases under the Revolving Credit Facility in an aggregate principal amount not to exceed $30.0 million) (all of which remains available as of June 30, 2017). On August 8, 2017, we increased the amount of our existing Term Loan Facility by borrowing $80.0 million of incremental term loans under the Term Loan Facility, the net proceeds of which were used to repay $60.0 million of revolving credit loans then outstanding under our Revolving Credit Facility and to pay related fees and expenses, and for other general corporate purposes (including permitted acquisitions and permitted investments pursuant to the First Lien Credit Agreement). To the extent that we incur additional indebtedness, the risks that we now face related to our substantial indebtedness could increase.
To service our indebtedness, we require a significant amount of cash, which depends on many factors beyond our control.
We cannot assure you that our business will generate sufficient cash flow from operations, or that future borrowings will be available to us under our Senior Secured Credit Facilities in amounts sufficient to enable us to fund our liquidity needs.
If we do not generate sufficient cash flow from operations to satisfy our debt obligations, we may have to undertake alternative financing plans, such as:
- •
- refinancing or restructuring our debt;
- •
- selling assets; or
- •
- seeking to raise additional capital.
We cannot assure you that we would be able to enter into these alternative financing plans on commercially reasonable terms or at all. Moreover, any alternative financing plans that we may be required to undertake would still not guarantee that we would be able to meet our debt obligations. Our inability to generate sufficient cash flow to satisfy our debt obligations, or to obtain alternative financing, could materially adversely affect our business, financial condition, results of operations or prospects. See "Management's Discussion and Analysis of Financial Condition and Results of Operations—Liquidity and Capital Resources."
We will need to repay or refinance borrowings under our First Lien Facilities.
The Revolving Credit Facility and Term Loan Facility are scheduled to mature in January 2019 and January 2021, respectively. We will need to repay, refinance, replace or otherwise extend the maturity of our First Lien Facilities. Our ability to repay, refinance, replace or extend these facilities by their maturity dates will be dependent on, among other things, business conditions, our financial performance and the general condition of the financial markets. If a financial disruption were to occur at the time that we are required to repay indebtedness outstanding under our First Lien Facilities, we
50
could be forced to undertake alternate financings, including a sale of additional common stock, negotiate for an extension of the maturity of our First Lien Facilities or sell assets and delay capital expenditures in order to generate proceeds that could be used to repay indebtedness under our First Lien Facilities. We cannot assure you that we will be able to consummate any such transaction on terms that are commercially reasonable, on terms acceptable to us or at all.
Our variable rate indebtedness subjects us to interest rate risk, which could cause our debt service obligations to increase significantly.
Borrowings under our First Lien Facilities are at variable rates of interest and expose us to interest rate risk. Interest rates are still near historically low levels and are projected to rise in the future. If interest rates rise, our debt service obligations on the variable rate indebtedness will increase even though the amount borrowed may remain the same, and our net income and cash flows will correspondingly decrease. Assuming no prepayments of the Term Loan Facility (which had $818.7 million outstanding as of June 30, 2017) and that the $95.0 million Revolving Credit Facility was fully drawn, each 0.125% change in interest rates would result in an approximate change of $1.1 million in annual interest expense on the indebtedness under our First Lien Facilities.
The covenants in our Senior Secured Credit Facilities impose restrictions that may limit our operating and financial flexibility.
Our Senior Secured Credit Facilities contain a number of significant restrictions and covenants that limit our ability, among other things, to:
- •
- incur additional indebtedness;
- •
- pay dividends or distributions on our capital stock or repurchase or redeem our capital stock;
- •
- prepay, redeem or repurchase specified indebtedness;
- •
- create certain liens;
- •
- sell, transfer or otherwise convey certain assets;
- •
- make certain investments;
- •
- create dividend or other payment restrictions affecting subsidiaries;
- •
- engage in transactions with affiliates;
- •
- create unrestricted subsidiaries;
- •
- consolidate, merge or transfer all or substantially all of our assets or the assets of our subsidiaries;
- •
- enter into agreements containing certain prohibitions affecting us or our subsidiaries; and
- •
- enter into new lines of business.
In addition, the Senior Secured Credit Facilities contain a financial covenant requiring us to comply with a 5.55 to 1.00 first lien net leverage ratio test. This financial covenant is solely for the benefit of the lenders under our Revolving Credit Facility and is tested as of the last day of a quarter on which the aggregate amount of revolving loans and letters of credit outstanding under the Revolving Credit Facility (net of cash collateralized letters of credit and undrawn outstanding letters of credit in an amount of up to 50% of the Revolving Credit Facility) exceeds 25% of the total commitments thereunder.
51
These covenants could materially adversely affect our ability to finance our future operations or capital needs. Furthermore, they may restrict our ability to expand and pursue our business strategies and otherwise conduct our business. Our ability to comply with these covenants may be affected by circumstances and events beyond our control, such as prevailing economic conditions and changes in regulations, and we cannot assure you that we will be able to comply with such covenants. These restrictions also limit our ability to obtain future financings to withstand a future downturn in our business or the economy in general. In addition, complying with these covenants may also cause us to take actions that may make it more difficult for us to successfully execute our business strategy and compete against companies that are not subject to such restrictions.
A breach of any covenant in our Senior Secured Credit Facilities or the agreements and indentures governing any other indebtedness that we may have outstanding from time to time would result in a default under that agreement or indenture after any applicable grace periods. A default, if not waived, could result in acceleration of the debt outstanding under the agreement and in a default with respect to, and an acceleration of, the debt outstanding under other debt agreements. If that occurs, we may not be able to make all of the required payments or borrow sufficient funds to refinance such debt. Even if new financing were available at that time, it may not be on terms that are acceptable to us or terms as favorable as our current agreements. If our debt is in default for any reason, our business, results of operations and financial condition could be materially and adversely affected.
Risks Relating to our Common Stock and this Offering
There is no existing market for our common stock, and we do not know if one will develop to provide you with adequate liquidity to sell our common stock at prices equal to or greater than the price you paid in this offering.
Prior to this offering, there has not been a public market for our common stock. We cannot predict the extent to which investor interest in us will lead to the development of a trading market on the NYSE, or otherwise or how active and liquid that market may come to be. Although we have applied to list our common stock on the NYSE, if an active trading market for our common stock does not develop following this offering, you may not be able to sell your shares quickly or at or above the initial public offering price. The initial public offering price for our shares will be determined by negotiations between us, the selling stockholders and representatives of the underwriters and may not be indicative of prices that will prevail in the open market following this offering. Consequently, you may not be able to sell our common stock at prices equal to or greater than the price you paid in this offering.
The market price of our common stock may be highly volatile, and you may not be able to resell your shares at or above the initial public offering price.
The trading price of our common stock could be volatile, and you could lose all or part of your investment. We cannot assure you that an active public market for our common stock will be sustained. The following factors, in addition to other factors including those described in this "Risk Factors" section and elsewhere in this prospectus, may have a significant impact on the market price of our common stock:
- •
- negative trends in global economic conditions or activity levels in our industry;
- •
- changes in our relationship with our customers or
in customer needs, expectations or trends;
- •
- announcements concerning our competitors or our industry in general;
- •
- our ability to implement our business strategy;
- •
- our ability to complete and integrate acquisitions;
- •
- actual or anticipated fluctuations in our quarterly or annual operating results;
- •
- trading volume of our common stock;
52
- •
- the failure of securities analysts to cover the Company after this offering or changes in analysts' financial estimates;
- •
- severe weather, natural disasters, acts of war or terrorism or other external events;
- •
- economic, legal and regulatory factors unrelated to our performance;
- •
- changes in accounting principles;
- •
- the loss of any of our management or key personnel;
- •
- sales of our common stock by us, our executive officers and directors or our stockholders (including certain affiliates of AEA) in the future;
and
- •
- general economic and market conditions and overall fluctuations in the U.S. equity markets.
In addition, broad market and industry factors may negatively affect the market price of our common stock, regardless of our actual operating performance, and factors beyond our control may cause our stock price to decline rapidly and unexpectedly.
Because AEA controls a significant percentage of our common stock, it may influence major corporate decisions, and the interests of AEA and its affiliates, including certain of our directors, may conflict with your interests as an owner of our common stock and those of the Company.
We are controlled by AEA, which currently owns 58.5% of our common stock and will own approximately 43.0% after the completion of this offering (or 40.6% after the completion of this offering if the underwriters exercise in full their option to purchase additional shares). Through this beneficial ownership and a stockholders' agreement and irrevocable voting proxies, pursuant to which certain of our stockholders prior to this offering have agreed to vote all of their shares to elect one individual to our board of directors that has been nominated by AEA (so long as AEA holds an aggregate of at least 10% of our outstanding common stock), AEA may be deemed to beneficially own, after the completion of this offering, approximately 75.7% of the voting power of our outstanding common stock (or 72.1% if the underwriters exercise in full their option to purchase additional shares). As a result, AEA will be able to influence matters requiring approval by our stockholders and/or our board of directors, including the election of directors and the approval of business combinations or dispositions and other extraordinary transactions. See "Certain Relationships and Related Party Transactions."
AEA may have interests that are different from yours and may vote in a way with which you disagree and which may be adverse to your interests. Further, AEA's concentration of ownership could have the effect of delaying or preventing a change in control or otherwise discouraging a potential acquirer from attempting to obtain control of us, which could cause the market price of our common stock to decline or prevent our stockholders from realizing a premium over the market price for their common stock. Additionally, AEA and its affiliates are in the business of making investments in companies and may from time to time acquire and hold interests in businesses that compete directly or indirectly with us or supply us with goods and services. Stockholders should consider that the interests of AEA may differ from their interests in material respects.
Following this offering, three of our seven directors will be affiliated with AEA. These persons will have fiduciary duties to both us and AEA. As a result, they may have real or apparent conflicts of interest on matters affecting both us and AEA, which in some circumstances may have interests adverse to ours. In addition, as described below under "Description of Capital Stock," our amended and restated certificate of incorporation provides that the doctrine of "corporate opportunity" will not apply with respect to us, to AEA or certain related parties or any of our directors who are employees of AEA or its affiliates in a manner that would prohibit them from investing in competing businesses or doing business with our customers. AEA or its affiliates may also pursue acquisition opportunities that
53
may be complementary to our business and, as a result, those acquisition opportunities may not be available to us. To the extent they invest in such other businesses, AEA and its affiliates, including affiliates of AEA who serve on our board of directors, may have interests that differ from those of our other stockholders.
Investors purchasing common stock in this offering will experience immediate and substantial dilution as a result of this offering and future equity issuances.
Prior investors have paid substantially less per share for our common stock than the price in this offering. The initial public offering price of our common stock is substantially higher than the net tangible book value per share of our outstanding common stock prior to completion of the offering. Accordingly, based on the initial public offering price of $18.00 per share (the midpoint of the price range set forth on the cover page of this prospectus), if you purchase our common stock in this offering, you will pay substantially more for your shares than the amounts paid by our existing stockholders for their shares and you will suffer immediate dilution of approximately $20.87 per share in net tangible book value of our common stock. To the extent outstanding options are ultimately exercised, there will be further dilution to investors in this offering. In addition, if the underwriters exercise their option to purchase additional shares, or if we issue additional equity securities in the future, investors purchasing common stock in this offering will experience additional dilution. See "Dilution."
Sales, or the potential for sales, of a substantial number of shares of our common stock in the public market by us or our existing stockholders could cause our stock price to fall.
Sales of a substantial number of shares of our common stock in the public market or the perception that these sales might occur, could depress the market price of our common stock and could impair our ability to raise capital through the sale of additional equity securities. Substantially all of our existing stockholders are subject to lock-up agreements with the underwriters of this offering that restrict the stockholders' ability to transfer shares of our common stock for at least 180 days from the date of this prospectus, subject to certain exceptions. The lock-up agreements limit the number of shares of common stock that may be sold immediately following the public offering. After this offering, we will have 113,282,257 outstanding shares of common stock. Subject to limitations, approximately 83,544,087 shares will become eligible for sale upon expiration of the lock-up period, as calculated and described in more detail in the section entitled "Shares Eligible for Future Sale." In addition, shares issued or issuable upon exercise of options and warrants vested as of the expiration of the lock-up period will be eligible for sale at that time. Sales of stock by these stockholders could have a material adverse effect on the trading price of our common stock.
Moreover, after this offering, holders of an aggregate of 85,504,480 shares of our common stock will have rights, subject to certain conditions, to require us to file registration statements covering their shares or to include their shares in registration statements that we may file for ourselves or other stockholders. Registration of these shares under the Securities Act, would result in the shares becoming freely tradable without restriction under the Securities Act, except for shares held by our affiliates as defined in Rule 144 under the Securities Act. Any sales of securities by these stockholders could have a material adverse effect on the trading price of our common stock.
If securities or industry analysts do not publish or cease publishing research or reports about us, our business or our markets, or if they adversely change their recommendations or publish negative reports regarding our business or our stock, our stock price and trading volume could materially decline.
The trading market for our common stock will be influenced by the research and reports that industry or securities analysts may publish about us, our business, our markets or our competitors. We do not have any control over these analysts and we cannot provide any assurance that analysts will
54
cover us or provide favorable coverage. If any of the analysts who may cover us adversely change their recommendation regarding our stock, or provide more favorable relative recommendations about our competitors, our stock price could materially decline. If any analyst who may cover us were to cease coverage of our Company or fail to regularly publish reports on us, we could lose visibility in the financial markets, which in turn could cause our stock price or trading volume to materially decline.
Some provisions of our charter documents and Delaware law may have anti-takeover effects that could discourage an acquisition of us by others, even if an acquisition would be beneficial to our stockholders, and may prevent attempts by our stockholders to replace or remove our current management.
Provisions in our amended and restated certificate of incorporation and our amended and restated bylaws, as well as provisions of the Delaware General Corporation Law (the "DGCL"), could make it more difficult for a third party to acquire us or increase the cost of acquiring us, even if doing so would benefit our stockholders, including transactions in which stockholders might otherwise receive a premium for their shares. These provisions include:
- •
- establishing a classified board of directors such that not all members of the board of directors are elected at one time;
- •
- allowing the authorized number of our directors to be determined exclusively by resolution of our board of directors and granting to our board
of directors the sole power to fill any vacancy on the board of directors;
- •
- limiting the ability of stockholders to remove directors without cause if the control group, consisting of AEA and certain of our other
stockholders, ceases to own 50% or more of the voting power our common stock;
- •
- providing that our board of directors is expressly authorized to adopt, or to alter or repeal, our bylaws;
- •
- authorizing the issuance of "blank check" preferred stock by our board of directors, without further stockholder approval, to thwart a takeover
attempt;
- •
- prohibiting stockholder action by written consent (and, thus, requiring that all stockholder actions be taken at a meeting of our stockholders)
if the control group, consisting of AEA and certain of our other stockholders, ceases to own, or have the right to direct the vote of, 50% or more of the voting power our common stock;
- •
- eliminating the ability of stockholders to call a special meeting of stockholders, if the control group, consisting of AEA and certain of our
other stockholders, ceases to own, or have the right to direct the vote of, 50% or more of the voting power our common stock;
- •
- establishing advance notice requirements for nominations for election to the board of directors or for proposing matters that can be acted upon
at annual stockholder meetings; and
- •
- requiring the approval of the holders of at least two-thirds of the voting power of all outstanding stock entitled to vote thereon, voting together as a single class, to amend or repeal our certificate of incorporation or bylaws.
In addition, while we have opted out of Section 203 of the DGCL, our amended and restated certificate of incorporation contains similar provisions providing that we may not engage in certain "business combinations" with any "interested stockholder" for a three-year period following the time that the stockholder became an interested stockholder, unless:
- •
- prior to such time, our board of directors approved either the business combination or the transaction that resulted in the stockholder becoming an interested stockholder;
55
- •
- upon consummation of the transaction that resulted in the stockholder becoming an interested stockholder, the interested stockholder owned at
least 85% of our voting stock outstanding at the time the transaction commenced, excluding certain shares; or
- •
- at or subsequent to that time, the business combination is approved by our board of directors and by the affirmative vote of holders of at least two-thirds of our outstanding voting stock that is not owned by the interested stockholder.
These anti-takeover defenses could discourage, delay or prevent a transaction involving a change in control of our Company. These provisions could also discourage proxy contests and make it more difficult for you and other stockholders to elect directors of your choosing and cause us to take corporate actions other than those you desire. See "Description of Capital Stock."
Our amended and restated certificate of incorporation designates the Court of Chancery of the State of Delaware as the exclusive forum for certain litigation that may be initiated by our stockholders, which could limit our stockholders' ability to obtain a favorable judicial forum for disputes with us.
Our amended and restated certificate of incorporation provides that the Court of Chancery of the State of Delaware will be the sole and exclusive forum for (i) any derivative action or proceeding brought on our behalf, (ii) any action asserting a claim of breach of a fiduciary duty owed to us or our stockholders by any of our directors, officers, employees or agents, (iii) any action asserting a claim against us arising under the DGCL or (iv) any action asserting a claim against us that is governed by the internal affairs doctrine. By becoming a stockholder in our Company, you will be deemed to have notice of and have consented to the provisions of our amended and restated certificate of incorporation related to choice of forum. The choice of forum provision in our amended and restated certificate of incorporation may limit our stockholders' ability to obtain a favorable judicial forum for disputes with us.
We will be exposed to risks relating to evaluations of controls required by Section 404 of the Sarbanes-Oxley Act of 2002.
We are in the process of evaluating our internal controls systems to allow management to report on, and our independent auditors to audit, our internal controls over financial reporting. We will be performing the system and process evaluation and testing (and any necessary remediation) required to comply with the management certification and the auditor attestation requirements of Section 404 of the Sarbanes-Oxley Act of 2002 (the "Sarbanes-Oxley Act"). We will be required to comply with Section 404 in full (including an auditor attestation on management's internal controls report) in our annual report on Form 10-K for the year following our first annual report required to be filed with the SEC (subject to any change in applicable SEC rules). Furthermore, upon completion of this process, we may identify control deficiencies of varying degrees of severity under applicable SEC and Public Company Accounting Oversight Board rules and regulations that remain unremediated. As a public company, we will be required to report, among other things, control deficiencies that constitute a "material weakness" or changes in internal controls that, or that are reasonably likely to, materially affect internal controls over financial reporting. A "material weakness" is a deficiency, or a combination of deficiencies, in internal control over financial reporting, such that there is a reasonable possibility that a material misstatement of our annual or interim financial statements will not be prevented or detected on a timely basis. A "significant deficiency" is a deficiency, or a combination of deficiencies, in internal control over financial reporting that is less severe than a material weakness, yet important enough to merit attention by those responsible for oversight of our financial reporting.
If we fail to implement the requirements of Section 404 in a timely manner, regulatory authorities such as the SEC or the PCAOB might subject us to sanctions or investigation. If we do not implement improvements to our disclosure controls and procedures or to our internal controls in a timely manner,
56
our independent registered public accounting firm may not be able to certify as to the effectiveness of our internal controls over financial reporting pursuant to an audit of our controls. This may subject us to adverse regulatory consequences or a loss of confidence in the reliability of our financial statements. We could also suffer a loss of confidence in the reliability of our financial statements if our independent registered public accounting firm reports a material weakness in our internal controls, if we do not develop and maintain effective controls and procedures or if we are otherwise unable to deliver timely and reliable financial information.
Additionally, effective internal controls are necessary for us to provide reliable financial reports and prevent fraud. Any failure to implement required new or improved controls, or difficulties encountered in their implementation, could harm our operating results or cause us to fail to meet our reporting obligations. Inadequate internal controls could also cause investors to lose confidence in our reported financial information. Any loss of confidence in the reliability of our financial statements or other negative reaction to our failure to develop timely or adequate disclosure controls and procedures or internal controls could result in a decline in the price of our common stock. In addition, if we fail to remedy any material weakness, our financial statements may be inaccurate, we may face restricted access to the capital markets and our stock price may be adversely affected.
We do not currently expect to pay any cash dividends.
We currently anticipate that we will retain future earnings for the development, operation and expansion of our business, and the continued operation and expansion of our business will require substantial funding. Accordingly, we do not currently anticipate declaring or paying any cash dividends on shares of our common stock in the foreseeable future. Any determination to pay dividends in the future will be at the discretion of our board of directors and will depend upon results of operations, financial condition, contractual restrictions, restrictions imposed by applicable law and other factors that our board of directors deems relevant. We are a holding company, and substantially all of our operations are carried out by our operating subsidiaries. Under our Senior Secured Credit Facilities, our operating subsidiaries are currently limited in their ability to pay cash dividends, and we expect these limitations to continue in the future. Our ability to pay dividends may also be limited by the terms of any future credit agreement or any future debt or preferred equity securities of ours or of our subsidiaries. Accordingly, if you purchase shares in this offering, realization of a gain on your investment will depend on the appreciation of the price of our common stock, which may never occur. Investors seeking cash dividends in the foreseeable future should not purchase our common stock.
The requirements of being a public company, including compliance with the reporting requirements of the Exchange Act and the requirements of the Sarbanes-Oxley Act and the NYSE, may strain our resources, increase our costs and divert management's attention, and we may be unable to comply with these requirements in a timely or cost-effective manner.
As a public company, we will be subject to the reporting requirements of the Securities Exchange Act of 1934, as amended (the "Exchange Act"), and the corporate governance standards of the Sarbanes-Oxley Act and the NYSE. These requirements will place a strain on our management, systems and resources and we will incur significant legal, accounting, insurance and other expenses that we have not incurred as a private company. The Exchange Act will require us to file annual, quarterly and current reports with respect to our business and financial condition within specified time periods and to prepare a proxy statement with respect to our annual meeting of stockholders. The Sarbanes-Oxley Act will require that we maintain effective disclosure controls and procedures and internal controls over financial reporting. The NYSE will require that we comply with various corporate governance requirements. To maintain and improve the effectiveness of our disclosure controls and procedures and internal controls over financial reporting and comply with the Exchange Act and NYSE requirements, significant resources and management oversight will be required. This may divert management's
57
attention from other business concerns and lead to significant costs associated with compliance, which could have a material adverse effect on us and the price of our common stock.
The expenses incurred by public companies generally for reporting and corporate governance purposes have been increasing. We expect these rules and regulations to increase our legal and financial compliance costs and to make some activities more time-consuming and costly, although we are currently unable to estimate these costs with any degree of certainty. These laws and regulations could also make it more difficult or costly for us to obtain certain types of insurance, including director and officer liability insurance, and we may be forced to accept reduced policy limits and coverage or incur substantially higher costs to obtain the same or similar coverage. These laws and regulations could also make it more difficult for us to attract and retain qualified persons to serve on our board of directors or its committees or as our executive officers. Advocacy efforts by stockholders and third parties may also prompt even more changes in governance and reporting requirements. We cannot predict or estimate the amount of additional costs we may incur or the timing of these costs. Furthermore, if we are unable to satisfy our obligations as a public company, we could be subject to delisting of our common stock, fines, sanctions and other regulatory action and potentially civil litigation.
We may be subject to securities litigation, which is expensive and could divert management attention.
Our share price may be volatile and, in the past, companies that have experienced volatility in the market price of their stock have been subject to securities class action litigation. We may be the target of this type of litigation in the future. Litigation of this type could result in substantial costs and diversion of management's attention and resources, which could have a material adverse effect on our business, financial condition, results of operations or prospects. Any adverse determination in litigation could also subject us to significant liabilities.
We are a "controlled company" within the meaning of the corporate governance standards of the NYSE and, as a result, will qualify for, and may rely on, exemptions from certain corporate governance requirements.
Following the completion of this offering, we expect to be a "controlled company" within the meaning of the corporate governance standards of the NYSE. A company of which more than 50% of the voting power is held by an individual, a group or another company is a "controlled company" within the meaning of the corporate governance standards of the NYSE and may elect not to comply with certain corporate governance requirements of the NYSE, including:
- •
- the requirement that a majority of our board of directors consist of independent directors;
- •
- the requirement that we have a nominating/corporate governance committee that is composed entirely of independent directors with a written
charter addressing the committee's purpose and responsibilities; and
- •
- the requirement that we have a compensation committee that is composed entirely of independent directors with a written charter addressing the
committee's purpose and responsibilities; and
- •
- the requirement for an annual performance evaluation of the nominating and corporate governance and compensation committees.
Following this offering, we intend to rely on all of the exemptions listed above. If we do utilize the exemptions, we will not have a majority of independent directors and our nominating and corporate governance and compensation committees will not consist entirely of independent directors. As a result, our board of directors and those committees may have more directors who do not meet the NYSE's independence standards than they would if those standards were to apply. The independence standards are intended to ensure that directors who meet those standards are free of any conflicting interest that
58
could influence their actions as directors. Accordingly, you will not have the same protections afforded to stockholders of companies that are subject to all of the corporate governance requirements of the .
In addition, on June 20, 2012, the SEC adopted Rule 10C-1 under the Exchange Act to implement provisions of the Dodd-Frank Act pertaining to compensation committee independence and the role and disclosure of compensation consultants and other advisers to the compensation committee. The national securities exchanges have since adopted amendments to their existing listing standards to comply with provisions of Rule 10C-1, and on January 11, 2013, the SEC approved such amendments. The amended listing standards require, among other things, that
- •
- compensation committees be composed of fully independent directors, as determined pursuant to new and existing independence requirements;
- •
- compensation committees be explicitly charged with hiring and overseeing compensation consultants, legal counsel and other committee advisers;
and
- •
- compensation committees are required to consider, when engaging compensation consultants, legal counsel or other advisers, certain independence factors, including factors that examine the relationship between the consultant or adviser's employer and us.
As a "controlled company," we will not be subject to these compensation committee independence requirements, and accordingly, you will not have the same protections afforded to stockholders of companies that are subject to these compensation committee independence requirements.
59
CAUTIONARY NOTE REGARDING FORWARD-LOOKING STATEMENTS
This prospectus contains forward-looking statements that involve risks and uncertainties. You can generally identify forward-looking statements by our use of forward-looking terminology such as "anticipate," "believe," "continue," "could," "estimate," "expect," "intend," "may," "might," "plan," "potential," "predict," "projection," "seek," "should," "will" or "would" or the negative thereof or other variations thereon or comparable terminology. In particular, statements about the markets in which we operate, including growth of our various markets, and our expectations, beliefs, plans, strategies, objectives, prospects, assumptions, or future events or performance contained in this prospectus under the headings "Prospectus Summary," "Risk Factors," "Management's Discussion and Analysis of Financial Condition and Results of Operations" and "Business" are forward-looking statements.
We have based these forward-looking statements on our current expectations, assumptions, estimates and projections. While we believe these expectations, assumptions, estimates and projections are reasonable, such forward-looking statements are only predictions and involve known and unknown risks and uncertainties, many of which are beyond our control. These and other important factors, including those discussed in this prospectus under the headings "Prospectus Summary," "Risk Factors," "Management's Discussion and Analysis of Financial Condition and Results of Operations" and "Business," may cause our actual results, performance or achievements to differ materially from any future results, performance or achievements expressed or implied by these forward-looking statements, or could affect our share price. Some of the factors that could cause actual results to differ materially from those expressed or implied by the forward-looking statements include:
- •
- general global economic and business conditions;
- •
- our ability to compete successfully in our markets;
- •
- our ability to continue to develop or acquire new products, services and solutions and adapt our business to meet the demands of our customers,
comply with changes to government regulations and achieve market acceptance with acceptable margins;
- •
- our ability to implement our growth strategy, including acquisitions and our ability to identify suitable acquisition targets;
- •
- our ability to operate or integrate any acquired businesses, assets or product lines profitably or otherwise successfully implement our growth
strategy;
- •
- delays in enactment or repeals of environmental laws and regulations;
- •
- the potential for us to become subject to claims relating to handling, storage, release or disposal of hazardous materials;
- •
- risks associated with product defects and unanticipated or improper use of our products;
- •
- the potential for us to incur liabilities to customers as a result of warranty claims of failure to meet performance guarantees;
- •
- our ability to meet our customers' safety standards or the potential for adverse publicity affecting our reputation as a result of incidents
such as workplace accidents, mechanical failures, spills, uncontrolled discharges, damage to customer or third-party property or the transmission of contaminants or diseases;
- •
- litigation, regulatory or enforcement actions and reputational risk as a result of the nature of our business or our participation in
large-scale projects;
- •
- seasonality of sales and weather conditions;
60
- •
- risks related to government customers, including potential challenges to our government contracts or our eligibility to serve government
customers;
- •
- the potential for our contracts with federal, state and local governments to be terminated or adversely modified prior to completion;
- •
- risks related to foreign, federal, state and local environmental, health and safety laws and regulations and the costs associated therewith;
- •
- risks associated with international sales and operations, including our operations in China;
- •
- our ability to adequately protect our intellectual property from third-party infringement;
- •
- our increasing dependence on the continuous and reliable operation of our information technology systems;
- •
- risks related to our substantial indebtedness;
- •
- our need for a significant amount of cash, which depends on many factors beyond our control;
- •
- AEA's influence over us; and
- •
- other risks and uncertainties, including those listed under "Risk Factors."
Given these risks and uncertainties, you are cautioned not to place undue reliance on such forward-looking statements. The forward-looking statements contained in this prospectus are not guarantees of future performance and our actual results of operations, financial condition and liquidity, and the development of the industry in which we operate, may differ materially from the forward-looking statements contained in this prospectus. In addition, even if our results of operations, financial condition and liquidity, and events in the industry in which we operate, are consistent with the forward-looking statements contained in this prospectus, they may not be predictive of results or developments in future periods.
Any forward-looking statement that we make in this prospectus speaks only as of the date of such statement. Except as required by law, we do not undertake any obligation to update or revise, or to publicly announce any update or revision to, any of the forward-looking statements, whether as a result of new information, future events or otherwise, after the date of this prospectus.
61
We estimate that the net proceeds to us from our sale of 8,333,333 shares in this offering will be approximately $135.4 million, based on the assumed initial public offering price of $18.00 per share, which is the midpoint of the price range set forth on the cover page of this prospectus, and after deducting underwriting discounts and commissions and estimated offering expenses payable by us. We will not receive any of the proceeds from the sale of shares of common stock by the selling stockholders. We intend to use the net proceeds received by us in this offering to repay approximately $100.5 million of indebtedness (including accrued and unpaid interest) under the Term Loan Facility and any remainder for general corporate purposes.
The interest rate on borrowings under the Term Loan Facility, including the October 2016 Incremental Term Loans, as of June 30, 2017 was London Interbank Offered Rates ("LIBOR") + 3.75% and the maturity date is January 15, 2021. The interest rate on borrowings under the NB Incremental Loans as of June 30, 2017 was LIBOR + 4.50% and the maturity date is January 15, 2021. We incurred the NB Incremental Loans on April 15, 2016, which provided for the borrowing of $185.0 million of incremental term loans under the Term Loan Facility to finance the Neptune-Benson Acquisition, refinance certain then-existing indebtedness of Neptune-Benson and pay fees and expenses in connection with such transactions. As of August 8, 2017, the NB Incremental Loans are no longer outstanding. We entered into the October 2016 Refinancing on October 28, 2016, to (i) borrow an additional $150.0 million of incremental term loans under the Term Loan Facility to fund our repayment in full of the Second Lien Facility and revolving credit loans then outstanding and (ii) increase commitments under the Revolving Credit Facility by $20.0 million to a total of $95.0 million. We entered into the August 2017 Refinancing on August 8, 2017 in order to (i) borrow approximately $262.7 million of refinancing term loans, the net proceeds of which were used to refinance in their entirety the NB Incremental Loans and (ii) borrow an additional $80.0 million of incremental term loans under the Term Loan Facility, the net proceeds of which were used to repay $60.0 million of revolving credit loans then outstanding under our Revolving Credit Facility and to pay related fees and expenses, and for other general corporate purposes (including permitted acquisitions and permitted investments pursuant to the First Lien Credit Agreement). Pursuant to the August 2017 Refinancing, a single tranche of term loans is outstanding under the First Lien Credit Agreement, with the same terms, including pricing terms, as the First Lien Term Facility immediately prior to the August 2017 Refinancing. The terms governing the NB Incremental Loans were superseded in their entirety by the terms set forth in the August 2017 Refinancing. See "Description of Certain Indebtedness."
Each $1.00 increase (decrease) in the assumed initial public offering price of $18.00 per share, the midpoint of the price range set forth on the cover page of this prospectus, would increase (decrease) the net proceeds to us from this offering by approximately $7.8 million, assuming the number of shares offered by us, as set forth on the cover page of this prospectus, remains the same, and after deducting underwriting discounts and commissions and estimated offering expenses payable by us. Each increase (decrease) of 1.0 million shares in the number of shares sold in this offering, as set forth on the cover page of this prospectus, would increase (decrease) the net proceeds to us from this offering by approximately $16.9 million, assuming the assumed initial public offering price of $18.00 per share, the midpoint of the price range set forth on the cover page of this prospectus, remains the same, and after deducting underwriting discounts and commissions and estimated offering expenses payable by us. The information discussed above is illustrative only and will adjust based on the actual initial public offering price and other terms of this offering determined at pricing.
62
We do not currently expect to pay any cash dividends on our common stock for the foreseeable future. Instead, we intend to retain future earnings, if any, for the future operation and expansion of our business and the repayment of indebtedness. Any determination to pay dividends in the future will be at the discretion of our board of directors and will depend upon our results of operations, cash requirements, financial condition, contractual restrictions, restrictions imposed by applicable laws and other factors that our board of directors may deem relevant. Our business is conducted through our subsidiaries. Dividends from, and cash generated by, our subsidiaries will be our principal sources of cash to repay indebtedness and fund operations. Accordingly, our ability to pay dividends to our stockholders is dependent on the earnings and distributions of funds from our subsidiaries. In addition, the covenants in the agreements governing our existing indebtedness, including the First Lien Facilities, significantly restrict the ability of our subsidiaries to pay dividends or otherwise transfer assets to us. See "Description of Certain Indebtedness," "Risk Factors—Risks Relating to our Business—We are a holding company with no operations of our own, and we depend on our subsidiaries for cash" and "Risk Factors—Risks Relating to our Common Stock and this Offering—We do not currently expect to pay any cash dividends."
63
The following table sets forth our cash and cash equivalents and our total capitalization as of June 30, 2017:
- •
- on an actual basis;
- •
- on a pro forma basis giving effect to (i) the August 2017 Refinancing; (ii) our issuance and sale of 8,333,333 shares of our common stock in this offering at an assumed initial public offering price of $18.00 per share, the midpoint of the price range set forth on the cover page of this prospectus, after deducting estimated underwriting discounts and commissions and estimated offering expenses payable by us; and (iii) the intended use of the net proceeds received by us in this offering to repay $100.5 million (including accrued and unpaid interest) under the Term Loan Facility and any remainder for general corporate purposes, as set forth in "Use of Proceeds."
You should read the data set forth below in conjunction with "Unaudited Pro Forma Financial Information," "Selected Historical Consolidated Financial Data" and "Management's Discussion and Analysis of Financial Condition and Results of Operations" and our consolidated financial statements and related notes included elsewhere in this prospectus.
| |
As of June 30, 2017 | ||||||
|---|---|---|---|---|---|---|---|
| |
Actual | Pro Forma(1) | |||||
| |
(unaudited) |
||||||
| |
(in thousands except per share data) |
||||||
Cash and cash equivalents |
$ | 54,018 | $ | 106,546 | |||
| | | | | | | | |
| | | | | | | | |
| | | | | | | | |
Long-term indebtedness (including current portion): |
|||||||
First Lien Term Loan Facility, due January 15, 2021(2) |
$ | 636,003 | $ | 798,691 | |||
NB Incremental Loans, due January 15, 2021(2) |
182,688 | — | |||||
Revolving Credit Facility(2)(3) |
60,000 | — | |||||
Build Own Operate Financing, due June 30, 2024 |
7,100 | 7,100 | |||||
Notes Payable, due June 30, 2018 to July 31, 2023 |
7,414 | 7,414 | |||||
Unamortized discount and lender fees |
(19,484 | ) | (15,864 | ) | |||
| | | | | | | | |
Total debt, net of unamortized discount and lender fees |
873,721 | 797,341 | |||||
Stockholders' equity: |
|||||||
Common stock, par value $0.01 per share; 1,000,000 shares authorized; 105,359 shares issued and 104,990 outstanding, actual; 113,324 shares issued and outstanding, pro forma |
1,054 | 1,137 | |||||
Treasury stock |
(2,209 | ) | (2,209 | ) | |||
Additional paid-in capital |
388,369 | 538,286 | |||||
Retained deficit |
(181,067 | ) | (200,475 | ) | |||
Accumulated other comprehensive loss, net of tax |
(7,898 | ) | (7,898 | ) | |||
Non-controlling interest |
3,238 | 3,238 | |||||
| | | | | | | | |
Total stockholders' equity |
201,487 | 332,079 | |||||
| | | | | | | | |
Total capitalization |
$ | 1,075,208 | $ | 1,129,419 | |||
| | | | | | | | |
| | | | | | | | |
| | | | | | | | |
- (1)
- Each $1.00 increase (decrease) in the assumed initial public offering price of $18.00 per share, the midpoint of the price range set forth on the cover page of this prospectus, would increase (decrease) each of cash and cash equivalents, additional paid-in-capital, total stockholders' equity and total capitalization on a pro forma basis by approximately $7.8 million, assuming the number
64
of shares of common stock offered by us, as set forth on the cover page of this prospectus, remains the same, and after deducting underwriting discounts and commissions and estimated offering expenses payable by us. Each increase (decrease) of 1.0 million shares in the number of shares of common stock sold in this offering, as set forth on the cover page of this prospectus, would increase (decrease) each of cash and cash equivalents, additional paid-in-capital, total stockholders' equity and total capitalization on a pro forma basis by approximately $16.9 million, assuming an initial public offering price of $18.00 per share, the midpoint of the price range set forth on the cover page of this prospectus, remains the same, and after deducting underwriting discounts and commissions and estimated offering expenses payable by us.
- (2)
- On
August 8, 2017, we entered into the August 2017 Refinancing pursuant to which we (i) borrowed approximately $262.7 million in refinancing
term loans, the net proceeds of which were used to refinance in their entirety the NB Incremental Loans and (ii) increased the amount of our existing Term Loan Facility by borrowing
$80.0 million of additional incremental term loans under the Term Loan Facility, the net proceeds of which were used to repay $60.0 million of revolving credit loans then outstanding
under the Revolving Credit Facility, to pay related fees and expenses, and for other general corporate purposes (including permitted acquisitions and permitted investments pursuant to the First Lien
Credit Agreement).
- (3)
- As of August 8, 2017, we had $11.0 million drawn, $7.5 million of letters of credit issued and $76.5 million available to be borrowed under the Revolving Credit Facility. The $11.0 million of borrowings under the Revolving Credit Facility were subsequently repaid in the normal course of business prior to this offering using cash on hand, and as of October 16, 2017, we had no borrowings outstanding under the Revolving Credit Facility.
65
If you purchase any of the shares offered by this prospectus, you will experience dilution to the extent of the difference between the offering price per share that you pay in this offering and the net tangible book value (deficit) per share of our common stock immediately after this offering.
Our net tangible book value (deficit) as of June 30, 2017 was $(455.4) million, or $(4.34) per share of common stock. Net tangible book value (deficit) per share is determined by dividing our net tangible book value (deficit), which is total tangible assets less total liabilities, by the aggregate number of shares of common stock outstanding. Tangible assets represent total assets excluding goodwill and other intangible assets. Dilution in net tangible book value (deficit) per share represents the difference between the amount per share paid by purchasers of shares of our common stock in this offering and the pro forma net tangible book value (deficit) per share of our common stock immediately afterwards.
After giving effect to the August 2017 Refinancing, our pro forma net tangible book value (deficit) as of June 30, 2017 would have been $(458.4) million, or $(4.37) per share of common stock. After giving further effect to (i) the issuance and sale by us of 8,333,333 shares of our common stock in this offering at an assumed initial public offering price of $18.00 per share, the midpoint of the price range set forth on the cover page of this prospectus, after deducting estimated underwriting discounts and commissions and estimated offering expenses payable by us; and (ii) the intended use of the net proceeds to us from this offering to repay $100.5 million of indebtedness (including accrued and unpaid interest) under the Term Loan Facility, as set forth in "Use of Proceeds," our pro forma net tangible book value (deficit) as of June 30, 2017 would have been approximately $(324.9) million, or $(2.87) per share. This represents an immediate increase in net tangible book value (deficit) of $1.50 per share to our existing stockholders and an immediate dilution of $20.87 per share to new investors purchasing shares of common stock in this offering.
The following table illustrates this dilution on a per share basis:
Assumed initial public offering price per share |
$ | 18.00 | |||||
Historical net tangible book value (deficit) per share |
$ | (4.34 | ) | ||||
Decrease per share attributable to August 2017 Refinancing |
(0.03 | ) | |||||
| | | | | | | | |
Pro forma net tangible book value (deficit) per share before giving effect to this offering |
(4.37 | ) | |||||
Increase per share attributable to this offering |
1.50 | ||||||
| | | | | | | | |
Pro forma net tangible book value (deficit) per share after this offering |
$ | (2.87 | ) | ||||
| | | | | | | | |
Dilution per share to new investors |
$ | 20.87 | |||||
| | | | | | | | |
| | | | | | | | |
| | | | | | | | |
Each $1.00 increase (decrease) in the assumed initial offering price of $18.00 per share, the midpoint of the price range set forth on the cover page of this prospectus, would affect our net tangible book value after this offering by approximately $7.8 million, the net tangible book value per share after this offering by $0.07 per share, and the dilution per common share to new investors by $(0.93) per share, assuming the number of shares offered by us, as set forth on the cover page of this prospectus, remains the same, and after deducting underwriting discounts and commissions and estimated offering expenses payable by us. Each increase (decrease) of 1.0 million shares in the number of shares sold in this offering, as set forth on the cover page of this prospectus, would affect our net tangible book value after this offering by approximately $16.9 million, the net tangible book value per share after this offering by $0.17 per share, and the dilution per common share to new investors by $0.17 per share, assuming the assumed initial public offering price of $18.00 per share, the midpoint of the price range set forth on the cover page of this prospectus, remains the same, and after deducting underwriting discounts and commissions and estimated offering expenses payable by us.
The following table summarizes, as of June 30, 2017, on an as adjusted basis, the number of shares of common stock purchased or to be purchased from us, the total consideration paid or to be paid to
66
us and the average price per share paid or to be paid by existing stockholders and by new investors purchasing shares of common stock from us in this offering, before deducting the underwriting discounts and commissions and estimated offering expenses payable by us.
| |
|
|
Total Consideration |
|
||||||||||||
|---|---|---|---|---|---|---|---|---|---|---|---|---|---|---|---|---|
| |
Shares Purchased | |
||||||||||||||
| |
Average Price per Share | |||||||||||||||
| |
Number | Percent | Number | Percent | ||||||||||||
Existing stockholders |
104,990,000 | 92.6% | (1) | $ | 398,932,000 | 72.7 | % | $ | 3.80 | |||||||
New investors |
8,333,333 | 7.4% | (1) | $ | 150,000,000 | 27.3 | % | $ | 18.00 | |||||||
| | | | | | | | | | | | | | | | | |
Total |
113,323,333 | 100.0 | % | $ | 548,932,000 | 100.0 | % | $ | 4.84 | |||||||
| | | | | | | | | | | | | | | | | |
| | | | | | | | | | | | | | | | | |
| | | | | | | | | | | | | | | | | |
- (1)
- Sales of 19,444,444 shares of our common stock by the selling stockholders in this offering will reduce the percentage of shares of common stock held by existing stockholders to approximately 75.5% of the total shares outstanding after this offering, and will increase the percentage of shares held by new investors to approximately 24.5% of the total shares of common stock outstanding after this offering. Further, if the underwriters' option to purchase additional shares from the selling stockholders is exercised in full, our existing stockholders would own approximately 71.8% and our new investors would own approximately 28.2% of the total number of shares of our common stock outstanding after this offering
Each $1.00 increase (decrease) in the assumed initial offering price of $18.00 per share, the midpoint of the price range set forth on the cover page of this prospectus, would increase (decrease) total consideration paid by new investors, total consideration paid by all stockholders and average price per share paid by all stockholders by $8.3 million, $8.3 million and $0.07 per share, respectively, assuming the number of shares offered by us, as set fourth on the cover page of this prospectus, remains the same. Each increase (decrease) of 1.0 million shares in the number of shares sold by us in this offering, as set forth on the cover page of this prospectus, would increase (decrease) total consideration paid by new investors, total consideration paid by all stockholders and average price per share paid by all stockholders by $18.0 million, $18.0 million and $0.12 per share, respectively, assuming the assumed initial public offering price of $18.00 per share, the midpoint of the price range set forth on the cover page of this prospectus, remains the same.
The number of shares of our common stock to be outstanding following this offering excludes:
- •
- 9,168,049 shares of common stock issuable upon the exercise of options outstanding under our Stock Option Plan as of October 16, 2017 at
a weighted average exercise price of approximately $5.18 per share;
- •
- 5,100,000 shares reserved for future issuance under our 2017 Equity Incentive Plan, which has been approved in connection with this offering;
and
- •
- an estimated 1,406,029 shares underlying grants of stock-settled restricted stock unit awards (estimated using the initial public offering price of $18.00 per share, the midpoint of the price range set forth on the cover page of this prospectus) expected to be made in connection with this offering to certain members of management, the aggregate value of which equals $25 million, with the actual number of restricted stock unit awards to be calculated based on the closing price of our common stock on the NYSE on the first day of trading.
To the extent any options are granted and exercised in the future, there may be additional economic dilution to new investors.
In addition, we may choose to raise additional capital due to market conditions or strategic considerations, even if we believe we have sufficient funds for our current or future operating plans. To the extent that we raise additional capital through the sale of equity or convertible debt securities, the issuance of these securities by us could result in further dilution to our stockholders.
67
UNAUDITED PRO FORMA FINANCIAL INFORMATION
The following unaudited pro forma condensed consolidated balance sheet as of June 30, 2017 and the unaudited pro forma condensed consolidated statement of operations for the nine months ended June 30, 2017 are based on our unaudited condensed consolidated interim financial statements as of and for the nine months ended June 30, 2017. The unaudited pro forma combined statement of operations for the fiscal year ended September 30, 2016 is based on (i) our audited consolidated financial statements for the fiscal year ended September 30, 2016 and (ii) the unaudited financial data of Neptune-Benson for the period from October 1, 2015 through April 15, 2016.
The historical financial information has been adjusted in the unaudited pro forma financial information to give effect to pro forma events that are (i) directly attributable to the Transactions (as defined below), (ii) factually supportable and (iii) with respect to the unaudited pro forma combined and unaudited pro forma condensed consolidated statements of operations, expected to have a continuing impact on the combined results. However, such adjustments are estimates based on certain assumptions and may not prove to be accurate. Information regarding these adjustments is subject to risks and uncertainties that could cause actual results to differ materially from our unaudited pro forma financial information.
Our unaudited pro forma financial information and accompanying notes present the impact of the following Transactions (collectively, the "Transactions"):
- •
- the Neptune-Benson Acquisition completed on April 15, 2016 and our entry into the NB Incremental Loans to finance the Neptune-Benson
Acquisition;
- •
- our entry into the October 2016 Refinancing and the August 2017 Refinancing; and
- •
- the issuance and sale of our common stock in this offering after deducting estimated underwriting discounts and commissions and estimated offering expenses payable by us and the intended use of net proceeds received by us as described under "Use of Proceeds."
The unaudited pro forma financial information herein has been prepared to illustrate the effects of the Transactions in accordance with GAAP and pursuant to Article 11 of Regulation S-X. The assumptions underlying the pro forma adjustments are described fully in the accompanying notes, which should be read in conjunction with the unaudited pro forma financial information.
The unaudited pro forma condensed consolidated balance sheet as of June 30, 2017 gives effect to the Transactions as if they had occurred on June 30, 2017. The unaudited pro forma condensed consolidated statement of operations for the nine months ended June 30, 2017 and the combined statement of operations for the fiscal year ended September 30, 2016, each give effect to the Transactions as if they had occurred on October 1, 2015. The impact of the Neptune-Benson Acquisition and our entry into the NB Incremental Loans is reflected in our historical condensed consolidated balance sheet as of June 30, 2017 and in our historical condensed consolidated statement of operations for the nine months ended June 30, 2017. Accordingly, no corresponding pro forma adjustments have been made to the historical condensed consolidated balance sheet as of June 30, 2017 or the historical condensed consolidated statement of operations for the nine months ended June 30, 2017 for the Neptune-Benson Acquisition and the related financing.
The Neptune-Benson Acquisition was accounted for as a business combination using the acquisition method of accounting under the provisions of ASC Topic 805, Business Combinations ("ASC 805"), and using the fair value concepts defined in ASC Topic 820, Fair Value Measurements. Under ASC 805, all assets acquired and liabilities assumed are recorded at their acquisition date fair value. The determination of the fair values of the assets acquired and liabilities assumed (and the related determination of estimated useful lives of depreciable and amortizable tangible and identifiable intangible assets) requires significant judgment and estimates. The estimates and assumptions used
68
include the projected timing and amount of future cash flows and discount rates reflecting risk inherent in the future cash flows.
In our opinion, all adjustments necessary to reflect the effects of the Transactions described in the notes to the unaudited pro forma financial information have been included and are based upon currently available information and assumptions that we believe are reasonable as of the date of this prospectus. Any of the factors underlying these estimates and assumptions may change or prove to be materially different. The unaudited pro forma financial information also should not be considered representative of our future financial condition or results of operations.
The unaudited pro forma financial information is provided for informational and illustrative purposes only and should be read in conjunction with our historical financial statements and the historical financial statements of Neptune-Benson, each of which is included elsewhere in this prospectus, as well as the financial and other information appearing elsewhere in this prospectus, including information contained in "Risk Factors," "Use of Proceeds," "Capitalization," "Selected Historical Consolidated Financial Data" and "Management's Discussion and Analysis of Financial Condition and Results of Operations."
69
Unaudited Pro Forma Condensed Consolidated Balance Sheet
As of June 30, 2017
(in thousands)
| |
Historical Evoqua as of June 30, 2017 |
August 2017 Refinancing Adjustments |
|
Offering and Use of Proceeds Adjustments |
|
Pro Forma Combined |
|||||||||||
|---|---|---|---|---|---|---|---|---|---|---|---|---|---|---|---|---|---|
ASSETS |
|||||||||||||||||
Current assets |
$ | 469,044 | $ | 28,664 | $ | 23,863 | $ | 521,572 | |||||||||
| | | | | | | | | | | | | | | | | | |
Cash and cash equivalents |
54,018 | 28,664 | A | $ | 23,863 | B | $ | 106,546 | |||||||||
Receivables, net |
202,469 | 202,469 | |||||||||||||||
Inventories, net |
123,506 | 123,506 | |||||||||||||||
Cost and earnings in excess of billings on uncompleted contracts |
58,418 | 58,418 | |||||||||||||||
Prepaid and other current assets |
26,040 | 26,040 | |||||||||||||||
Income tax receivable |
4,593 | 4,593 | |||||||||||||||
| | | | | | | | | | | | | | | | | | |
Property, plant, and equipment, net |
271,830 | 271,830 | |||||||||||||||
| | | | | | | | | | | | | | | | | | |
Goodwill |
317,393 | 317,393 | |||||||||||||||
| | | | | | | | | | | | | | | | | | |
Intangible assets, net |
339,538 | 339,538 | |||||||||||||||
| | | | | | | | | | | | | | | | | | |
Deferred income taxes |
349 | 349 | |||||||||||||||
| | | | | | | | | | | | | | | | | | |
Other non-current assets |
22,549 | 22,549 | |||||||||||||||
| | | | | | | | | | | | | | | | | | |
Total assets |
$ | 1,420,703 | $ | 28,664 | $ | 23,863 | $ | 1,473,231 | |||||||||
| | | | | | | | | | | | | | | | | | |
| | | | | | | | | | | | | | | | | | |
| | | | | | | | | | | | | | | | | | |
LIABILITIES AND EQUITY |
|||||||||||||||||
Current liabilities: |
$ | 332,363 | $ | (47,919 | ) | $ | (26,858 | ) | $ | 257,586 | |||||||
| | | | | | | | | | | | | | | | | | |
Accounts payable |
106,421 | $ | 106,421 | ||||||||||||||
Current portion of debt |
73,093 | (46,772 | ) | A | (26,321 | ) | B | 0 | |||||||||
Billings in excess of costs incurred |
24,764 | 24,764 | |||||||||||||||
Product warranties |
10,692 | 10,692 | |||||||||||||||
Accrued expenses and other liabilities |
116,333 | (1,147 | ) | A | (537 | ) | B | 114,649 | |||||||||
Income tax payable |
1,060 | 1,060 | |||||||||||||||
| | | | | | | | | | | | | | | | | | |
Non-current liabilities |
886,853 | 79,524 | (82,812 | ) | 883,566 | ||||||||||||
| | | | | | | | | | | | | | | | | | |
Long-term debt |
$ | 800,628 | $ | 79,524 | A | $ | (82,812 | ) | B | 797,341 | |||||||
Product warranties |
6,683 | 6,683 | |||||||||||||||
Other non-current liabilities |
70,412 | 70,412 | |||||||||||||||
Deferred income taxes |
9,130 | 9,130 | |||||||||||||||
| | | | | | | | | | | | | | | | | | |
Total liabilities |
$ | 1,219,216 | $ | 31,605 | $ | (109,669 | ) | $ | 1,141,152 | ||||||||
| | | | | | | | | | | | | | | | | | |
| | | | | | | | | | | | | | | | | | |
| | | | | | | | | | | | | | | | | | |
Commitments and Contingent Liabilities |
— | ||||||||||||||||
Shareholders' equity |
|
|
|||||||||||||||
Common stock, par value $0.01 per share; 1,000,000 shares authorized; 105,359 shares issued and 104,990 outstanding, actual; 113,324 shares issued and outstanding, pro forma |
1,054 | 83 | C | 1,137 | |||||||||||||
Treasury stock: 369 shares at June 30, 2017 |
(2,209 | ) | (2,209 | ) | |||||||||||||
Additional paid-in capital |
388,369 | 149,917 | C | 538,286 | |||||||||||||
Retained Deficit |
(181,067 | ) | (2,941 | ) | A | (16,467 | ) | C | (200,475 | ) | |||||||
Accumulated other comprehensive loss, net of tax |
(7,898 | ) | (7,898 | ) | |||||||||||||
Total Evoqua Water Technologies Corp. equity |
198,249 | (2,941 | ) | 133,533 | 328,841 | ||||||||||||
Non-controlling interest |
3,238 | 3,238 | |||||||||||||||
| | | | | | | | | | | | | | | | | | |
Total shareholders' equity |
201,487 | (2,941 | ) | 133,533 | 332,079 | ||||||||||||
| | | | | | | | | | | | | | | | | | |
Total liabilities and shareholders' equity |
$ | 1,420,703 | $ | 28,664 | $ | 23,863 | $ | 1,473,231 | |||||||||
| | | | | | | | | | | | | | | | | | |
| | | | | | | | | | | | | | | | | | |
| | | | | | | | | | | | | | | | | | |
See the accompanying notes to the unaudited pro forma condensed consolidated balance sheet.
70
Unaudited Pro Forma Combined Statement of Operations
For the Fiscal Year Ended September 30, 2016
(in thousands, except per share data)
| |
Historical Evoqua for the Fiscal Year Ended Septembr 30, 2016 |
Historical Neptune- Benson October 1, 2015 Through April 15, 2016 |
Reclassification Adjustments (D) |
Neptune- Benson Acquisition and NB Incremental Loans Adjustments |
|
October 2016 and August 2017 Refinancing Adjustments |
|
Offering and Use of Proceeds Adjustments |
|
Pro Forma Combined |
|||||||||||||||||||||
|---|---|---|---|---|---|---|---|---|---|---|---|---|---|---|---|---|---|---|---|---|---|---|---|---|---|---|---|---|---|---|---|
Revenue from product sales |
$ | 587,087 | — | $ | 34,193 | — | — | — | $ | 621,280 | |||||||||||||||||||||
Revenue from services |
550,109 | — | — | — | — | — | 550,109 | ||||||||||||||||||||||||
Net sales |
— | 34,193 | (34,193 | ) | — | — | — | — | |||||||||||||||||||||||
| | | | | | | | | | | | | | | | | | | | | | | | | | | | | | | | |
|
1,137,196 | 34,193 | — | — | — | — | 1,171,389 | ||||||||||||||||||||||||
Cost of product sales |
(407,354 | ) | — | (14,764 | ) | — | — | — | (422,118 | ) | |||||||||||||||||||||
Cost of services |
(396,777 | ) | — | — | — | — | — | (396,777 | ) | ||||||||||||||||||||||
Cost of goods sold |
— | (14,720 | ) | 14,720 | — | — | — | — | |||||||||||||||||||||||
| | | | | | | | | | | | | | | | | | | | | | | | | | | | | | | | |
|
(804,131 | ) | (14,720 | ) | (44 | ) | — | — | — | (818,895 | ) | ||||||||||||||||||||
| | | | | | | | | | | | | | | | | | | | | | | | | | | | | | | | |
Gross Profit |
333,065 | 19,473 | (44 | ) | — | — | — | 352,494 | |||||||||||||||||||||||
| | | | | | | | | | | | | | | | | | | | | | | | | | | | | | | | |
Commission income |
— | 46 | (46 | ) | — | — | — | — | |||||||||||||||||||||||
Research and development expense |
(22,897 | ) | — | — | — | — | — | (22,897 | ) | ||||||||||||||||||||||
Sales and marketing expense |
(135,208 | ) | — | (14,712 | ) | — | — | — | (149,920 | ) | |||||||||||||||||||||
Selling, general and administrative expenses |
— | (24,520 | ) | 24,520 | — | — | — | — | |||||||||||||||||||||||
General and administrative expenses |
(144,771 | ) | — | (14,605 | ) | 15,338 | E, F, K | — | 4,377 | K | (139,661 | ) | |||||||||||||||||||
Other operating income (expense), net |
6,966 | — | 44 | — | — | — | 7,010 | ||||||||||||||||||||||||
Interest expense |
(42,518 | ) | (2,932 | ) | — | (3,297 | ) | G | (3,503 | ) | I | 5,675 | L | (46,575 | ) | ||||||||||||||||
Acquisition related expenses |
— | (137 | ) | 137 | — | — | — | — | |||||||||||||||||||||||
Management fees |
— | (460 | ) | 460 | — | — | — | — | |||||||||||||||||||||||
Intangible asset amortization expense |
— | (4,094 | ) | 4,094 | — | — | — | — | |||||||||||||||||||||||
Pension Benefit |
— | (119 | ) | 119 | — | — | — | — | |||||||||||||||||||||||
Foreign exchange gain (loss) |
— | (30 | ) | 30 | — | — | — | — | |||||||||||||||||||||||
Other income (expense), net |
— | (2 | ) | 2 | — | — | — | — | |||||||||||||||||||||||
| | | | | | | | | | | | | | | | | | | | | | | | | | | | | | | | |
Income (loss) before income taxes |
(5,363 | ) | (12,775 | ) | — | 12,041 | (3,503 | ) | 10,052 | 451 | |||||||||||||||||||||
Income tax benefit (expense) |
18,394 | — | — | 257 | H | 1,226 | J | (3,518 | ) | M | 16,359 | ||||||||||||||||||||
| | | | | | | | | | | | | | | | | | | | | | | | | | | | | | | | |
Net income (loss) |
13,031 | (12,775 | ) | — | 12,298 | (2,277 | ) | 6,534 | 16,810 | ||||||||||||||||||||||
| | | | | | | | | | | | | | | | | | | | | | | | | | | | | | | | |
Net income attributable to non-controlling interest |
1,392 | — | — | — | — | — | 1,392 | ||||||||||||||||||||||||
| | | | | | | | | | | | | | | | | | | | | | | | | | | | | | | | |
Net income (loss) attributable to Evoqua |
$ | 11,639 | $ | (12,775 | ) | — | $ | 12,298 | $ | (2,277 | ) | $ | 6,534 | $ | 15,418 | ||||||||||||||||
| | | | | | | | | | | | | | | | | | | | | | | | | | | | | | | | |
| | | | | | | | | | | | | | | | | | | | | | | | | | | | | | | | |
| | | | | | | | | | | | | | | | | | | | | | | | | | | | | | | | |
Basic earnings (loss) per common share |
$ | 0.11 | $ | 0.14 | |||||||||||||||||||||||||||
Diluted earnings (loss) per common share |
$ | 0.11 | $ | 0.13 | |||||||||||||||||||||||||||
| | | | | | | | | | | | | | | | | | | | | | | | | | | | | | | | |
Weighted-average shares and equivalent shares outstanding: |
|||||||||||||||||||||||||||||||
Basic |
104,254 | — | 8,333 | S | 112,587 | ||||||||||||||||||||||||||
Diluted |
106,161 | — | 8,333 | S | 114,494 | ||||||||||||||||||||||||||
See the accompanying notes to the unaudited pro forma combined statement of operations.
71
Unaudited Pro Forma Condensed Consolidated Statement of Operations
For the Nine Months Ended June 30, 2017
(in thousands, except per share data)
| |
Historical Evoqua Nine Months Ended June 30, 2017 |
October 2016 and August 2017 Refinancing Adjustments |
|
Offering and Use of Proceeds Adjustments |
|
Pro Forma Combined |
|||||||||||
|---|---|---|---|---|---|---|---|---|---|---|---|---|---|---|---|---|---|
Revenue from product sales and services |
$ | 890,916 | — | $ | 890,916 | ||||||||||||
Cost of product sales and services |
(614,088 | ) | — | (614,088 | ) | ||||||||||||
| | | | | | | | | | | | | | | | | | |
Gross Profit |
276,828 | — | — | 276,828 | |||||||||||||
| | | | | | | | | | | | | | | | | | |
Research and development expense |
(15,684 | ) | — | (15,684 | ) | ||||||||||||
Sales and marketing expense |
(108,729 | ) | — | (108,729 | ) | ||||||||||||
General and administrative expenses |
(120,534 | ) | — | 3,057 | P | (117,477 | ) | ||||||||||
Other operating income (expense), net |
981 | — | 981 | ||||||||||||||
Interest expense |
(39,117 | ) | 1,324 | N | 4,536 | Q | (33,257 | ) | |||||||||
| | | | | | | | | | | | | | | | | | |
Income (loss) before income taxes |
(6,255 | ) | 1,324 | 7,593 | 2,662 | ||||||||||||
Income tax benefit (expense) |
(295 | ) | (463 | ) | O | (2,658 | ) | R | (3,416 | ) | |||||||
| | | | | | | | | | | | | | | | | | |
Net income (loss) |
(6,550 | ) | 861 | 4,935 | (754 | ) | |||||||||||
| | | | | | | | | | | | | | | | | | |
| | | | | | | | | | | | | | | | | | |
| | | | | | | | | | | | | | | | | | |
Net income attributable to non-controlling interest |
2,348 | — | — | 2,348 | |||||||||||||
Net income (loss) attributable to Evoqua |
$ | (8,898 | ) | $ | 861 | $ | 4,935 | $ | (3,102 | ) | |||||||
Income (loss) per share: |
|||||||||||||||||
Basic |
$ | (0.08 | ) | $ | (0.03 | ) | |||||||||||
Diluted |
$ | (0.08 | ) | $ | (0.03 | ) | |||||||||||
| | | | | | | | | | | | | | | | | | |
Weighted-average shares and equivalent shares outstanding: |
|||||||||||||||||
Basic |
104,821 | — | 8,333 | S | 113,154 | ||||||||||||
Diluted |
104,821 | — | 8,333 | S | 113,154 | ||||||||||||
See the accompanying notes to the unaudited pro forma condensed consolidated statement of operations.
72
Notes to the Unaudited Pro Forma Financial Information
Description of Transactions
On April 15, 2016, EWT Holdings III Corp., our wholly owned subsidiary, acquired 100% of privately held Neptune-Benson, a leading manufacturer of high-quality water filtration and disinfection products for the recreational, industrial and municipal water markets, for total consideration of $283.7 million, less cash received of $2.4 million, of which $185.0 million was funded through the entry into the NB Incremental Loans, $9.0 million was in the form of shares of the Company provided to the sellers, and the remaining was paid with available cash.
The following summarizes the aggregate consideration paid for Neptune-Benson (in thousands):
Cash consideration |
$ | 274,754 | ||
Registrant shares issued |
8,950 | |||
| | | | | |
Total |
$ | 283,704 | ||
| | | | | |
| | | | | |
| | | | | |
We have accounted for the Neptune-Benson Acquisition under the acquisition method of accounting in accordance with the authoritative guidance on business combinations under the provisions of ASC 805. The major assets acquired and liabilities assumed from Neptune-Benson and their estimated acquisition date fair values are set forth below (in thousands):
Current assets |
$ | 29,521 | ||
Property, plant and equipment |
2,480 | |||
Goodwill |
143,680 | |||
Other intangible assets |
149,127 | |||
Other noncurrent assets |
3,576 | |||
| | | | | |
Total assets acquired |
$ | 328,384 | ||
Total liabilities assumed |
(44,680 | ) | ||
| | | | | |
Net assets acquired |
$ | 283,704 | ||
| | | | | |
| | | | | |
| | | | | |
On October 28, 2016, we entered into the October 2016 Refinancing, in which we increased the amount of our existing Term Loan Facility by borrowing $150.0 million of additional October 2016 Incremental Term Loans under the First Lien Facilities pursuant to an incremental amendment to the First Lien Credit Agreement. The net proceeds of the October 2016 Incremental Term Loans were used, among other things, to repay all amounts then-outstanding under the Second Lien Credit Agreement (the "Second Lien Repayment") and all loans then outstanding under the Revolving Credit Facility (without permanent reduction of commitments thereunder), to pay fees and expenses in connection with the transactions thereunder, and for working capital, capital expenditures and other general corporate purposes. We refer to the First Lien Facilities and, until the Second Lien Repayment, the Second Lien Facility, collectively as the "Senior Secured Credit Facilities." We also upsized commitments under our existing Revolving Credit Facility by $20.0 million to a total of $95.0 million.
On August 8, 2017, we entered into the August 2017 Refinancing, in which we increased the amount of our existing Term Loan Facility by borrowing $262.7 million of additional incremental term loans under the First Lien Facilities, pursuant to an incremental amendment to the credit agreement governing the existing Term Loan Facility. The net proceeds were used to repay all loans then outstanding under the NB Incremental Loans, $60.0 million of revolving credit loans then outstanding under the Revolving Credit Facility and to pay related fees and expenses, and for working capital, capital expenditures and other general corporate purposes.
The initial public offering of shares herein includes the sale of 8,333,333 shares of common stock by us in this offering at the initial public offering price of $18.00 per share, the midpoint of the price
73
range set forth on the cover of this prospectus, after deducting estimated underwriting discounts and commissions and estimated offering expenses payable by us and the application of the net proceeds received by us therefrom to repay outstanding indebtedness under the Term Loan Facility and any remainder for general corporate purposes.
Basis of Presentation
The unaudited pro forma financial information was derived from the application of pro forma adjustments to our audited consolidated financial statements and unaudited condensed consolidated financial statements. The unaudited pro forma condensed consolidated balance sheet as of June 30, 2017 gives effect to this offering of 8,333,333 shares and the application of the net proceeds received by us therefrom, as if they had occurred on June 30, 2017. The unaudited pro forma combined statement of operations for the fiscal year ended September 30, 2016 and the unaudited condensed consolidated statement of operations for the nine months ended June 30, 2017 each give effect to the Transactions as if they had occurred on October 1, 2015. The unaudited pro forma combined and condensed consolidated financial information herein has been prepared to illustrate the effects of the Transactions in accordance with GAAP and pursuant to Article 11 of Regulation S-X.
The impact of the Neptune-Benson Acquisition and our entry into the NB Incremental Loans is reflected in our historical condensed consolidated balance sheet as of June 30, 2017 and in our historical condensed consolidated statement of operations for the nine months ended June 30, 2017. Accordingly, no corresponding pro forma adjustments have been made to the historical condensed consolidated balance sheet as of June 30, 2017 or the historical condensed consolidated statement of operations for the nine months ended June 30, 2017 for the Neptune-Benson Acquisition and the related financing.
The unaudited pro forma financial information is presented solely for informational purposes and is not necessarily indicative of the combined results of operations or financial position that might have been achieved as of and for the periods presented, nor is it necessarily indicative of the future results of the combined company. The unaudited pro forma financial information does not reflect any cost savings from future operating synergies or integration activities, if any, or any revenue, tax, or other synergies, if any, that could result from the Neptune-Benson Acquisition, nor does it reflect the completion of any of our other recent acquisitions during the periods presented.
The following table presents the calculation of the Neptune-Benson historical statement of income for the period from October 1, 2015 to April 15, 2016 (in thousands):
| |
|
|
|
|
Total | |
||||||||||
|---|---|---|---|---|---|---|---|---|---|---|---|---|---|---|---|---|
| |
October 1, 2015 - December 31, 2015 |
January 1, 2016 - March 31, 2016 |
April 1, 2016 - April 15, 2016 |
|
October 1, 2015 - April 15, 2016 |
|
||||||||||
Net sales |
$ | 20,937 | $ | 12,155 | $ | 1,101 | $ | 34,193 | ||||||||
Cost of goods sold |
(8,328 | ) | (5,306 | ) | (1,086 | ) | (14,720 | ) | ||||||||
| | | | | | | | | | | | | | | | | |
Gross profit |
12,609 | 6,849 | 15 | 19,473 | ||||||||||||
Commission income |
32 | 14 | — | 46 | ||||||||||||
Selling, general and administrative expenses |
(4,648 | ) | (3,651 | ) | (16,221 | ) | (24,520 | ) | ||||||||
Acquisition related expenses |
— | — | (137 | ) | (137 | ) | ||||||||||
Intangible asset amortization expense |
(1,901 | ) | (1,901 | ) | (292 | ) | (4,094 | ) | ||||||||
Management fees |
(222 | ) | (222 | ) | (16 | ) | (460 | ) | ||||||||
Pension benefit |
(55 | ) | (56 | ) | (8 | ) | (119 | ) | ||||||||
Other income (expense): |
6 | (39 | ) | 31 | (2 | ) | ||||||||||
Foreign currency gain (loss) |
6 | (33 | ) | (3 | ) | (30 | ) | |||||||||
Interest expense |
(1,454 | ) | (1,189 | ) | (289 | ) | (2,932 | ) | ||||||||
| | | | | | | | | | | | | | | | | |
Net income (loss) |
$ | 4,373 | $ | (228 | ) | $ | (16,920 | ) | $ | (12,775 | ) | |||||
| | | | | | | | | | | | | | | | | |
| | | | | | | | | | | | | | | | | |
| | | | | | | | | | | | | | | | | |
74
Unaudited Pro Forma Condensed Consolidated Balance Sheet Adjustments
- (A)
- We completed the August 2017 Refinancing on August 8, 2017. The net proceeds of $262.7 million were used to (a) repay the NB Incremental Loans, (b) repay $60.0 million of revolving credit loans outstanding under the Revolving Credit Facility at the time the August 2017 Refinancing was completed, (c) pay accrued interest on the NB Incremental Loans and Revolving Credit Facility and (d) pay fees and expenses in connection with the refinancing.
| |
As of June 30, 2017 | |||
|---|---|---|---|---|
| |
(in thousands) |
|||
Repayment of Revolving Credit Facility |
$ | (60,000 | ) | |
Incremental borrowings under the Revolving Credit Facility prior to August 2017 Refinancing |
11,000 | (a) | ||
Repayment of NB Incremental Loans (current) |
(1,850 | ) | ||
New borrowings under the First Lien Term Facility (current) |
4,078 | |||
| | | | | |
Net adjustment to current portion of debt |
(46,772 | ) | ||
Payment of accrued interest |
(1,147 |
) |
||
| | | | | |
Net adjustment to Accrued expenses and other liabilities |
(1,147 | ) | ||
New borrowings under the First Lien Term Facility (non-current) |
258,610 |
|||
Repayment of NB Incremental Loans (non-current) |
(180,838 | ) | ||
Write-off of deferred debt issuance costs due to partial extinguishment |
1,752 | |||
| | | | | |
Net adjustment to Long-term debt |
79,524 | |||
Third party fees and costs paid and expensed as incurred |
(1,189 |
) |
||
Write-off of deferred debt issuance costs due to partial extinguishment |
(1,752 | ) | ||
| | | | | |
Net adjustment to retained deficit |
(2,941 | ) | ||
Cash on balance sheet to be used for other general corporate purposes |
28,664 |
|||
| | | | | |
Net adjustment to cash and cash equivalents |
$ | 28,664 | ||
| | | | | |
| | | | | |
| | | | | |
- (a)
- As of June 30, 2017, we had $60.0 million of revolving credit loans outstanding under the Revolving Credit Facility. Prior to the August 2017 Refinancing, we borrowed an additional $11.0 million under the Revolving Credit Facility in the normal course of business. The $11.0 million of incremental borrowings under the Revolving Credit Facility were subsequently repaid in the normal course of business prior to the offering using cash on hand. See Note (B) below.
- (B)
- We estimate that the net proceeds to us from our sale of 8,333,333 shares in this offering will be approximately $135.4 million, based on the assumed initial public offering price of $18.00 per share, which is the midpoint of the price range set forth on the cover page of this prospectus, and after deducting underwriting discounts and commissions and estimated offering expenses payable by us.
75
We intend to use the net proceeds received by us in this offering to repay approximately $100.5 million of indebtedness (including accrued and unpaid interest) under the Term Loan Facility and any remainder for general corporate purposes.
| (in thousands except per share amonts) |
|
|||
|---|---|---|---|---|
Offering price per share |
$ | 18.00 | ||
Shares of common stock issued by us in this offering |
8,333 | |||
| | | | | |
Gross proceeds |
$ | 150,000 | ||
Less: underwriting discounts and commissions and offering expenses |
14,600 | |||
| | | | | |
Net cash proceeds received by us in this offering |
135,400 | |||
| | | | | |
| | | | | |
| | | | | |
Repayment of debt |
100,000 | (a) | ||
Payment of accrued interest |
537 | |||
| | | | | |
Net cash from offering available for general business purposes |
$ | 34,863 | ||
Less: Payoff of Revolving Credit Facility using cash on hand |
11,000 | (b) | ||
Net pro forma adjustment to Cash and cash equivalents |
$ | 23,863 | ||
| | | | | |
| | | | | |
| | | | | |
- (a)
- The net pro forma adjustments to Current portion of debt and Long-term debt are comprised of the following:
i. Current portion of debt |
||||
Repayment of current portion of First Lien Term Loan Facility |
$ |
(15,321 |
) |
|
Repayment of borrowings under the Revolving Credit Facility using cash on hand |
(11,000 | ) | ||
| | | | | |
Net pro forma adjustment to Current portion of debt |
$ | (26,321 | ) | |
ii. Long-term debt |
||||
Repayment of long-term portion of First Lien Term Loan Facility |
$ |
(84,679 |
) |
|
Non-cash write-off of deferred debt issuance costs |
1,867 | |||
| | | | | |
Net pro forma adjustment to Long-term debt |
$ | (82,812 | ) |
- (b)
- Prior to the completion of this offering, we repaid the $11.0 million of incremental borrowings under the Revolving Credit Facility (see Note (A)) using cash on hand. Upon completion of this offering we will continue to have no revolving credit loans outstanding under our Revolving Credit Facility.
- (C)
- Reflects the reclassification of equity as a result of the anticipated post-offering capital structure. As of the closing date of this offering, the shareholders' equity will reflect the issuance of common stock to the public and will reflect the $0.01 par value of 113.3 million outstanding shares of common stock.
| (in thousands except par value per share) |
|
|||
|---|---|---|---|---|
Shares of common stock issued in this offering |
8,333 | |||
Par value per share |
$ | 0.01 | ||
| | | | | |
Net adjustment to Common stock |
$ | 83 | ||
Gross proceeds from stock issued in this offering |
$ | 150,000 | ||
Less: adjustment to Common stock |
83 | |||
| | | | | |
Net adjustment to Additional paid-in capital |
$ | 149,917 | ||
Underwriting discounts and commissions and offering expenses |
$ | 14,600 | ||
Write-off of deferred debt issuance costs due to partial extinguishment |
$ | 1,867 | ||
| | | | | |
Net adjustment to retained deficit |
$ | 16,467 | ||
76
Unaudited Pro Forma Combined Statement of Operations for the Fiscal Year Ended September 30, 2016
- (D)
- Certain reclassification adjustments have been made to the Neptune-Benson historical financial statements to conform to the Company's presentation (in thousands):
Amount
|
Reclassification description | ||
|---|---|---|---|
| $ | 34,193 | From "Net sales" to "Revenue from product sales" | |
| 14,720 | From "Cost of goods sold" to Cost of product sales" | ||
| 44 | From "Pension Benefit" to "Cost of product sales" | ||
| 14,712 | From "Selling, general and administrative expenses" to "Sales and marketing expense" | ||
| 9,809 | From "Selling, general and administrative expenses" to "General and administrative expenses" | ||
| 137 | From "Acquisition related expenses" to "General and administrative expenses" | ||
| 460 | From "Management fees" to "General and administrative expenses" | ||
| 4,094 | From "Intangible asset amortization expense" to "General and administrative expenses" | ||
| 75 | From "Pension Benefit" to "General and administrative expenses" | ||
| 30 | From "Foreign currency (gain) loss" to "General and administrative expenses" | ||
| 2 | From "Other income (expense), net" to "Other operating income" | ||
| 46 | From "Commission income" to "Other operating income" | ||
- (E)
- Represents the elimination of historical Neptune-Benson intangible asset amortization expense for the period from October 1, 2015 through April 15, 2016 of $4.1 million and the recognition of pro forma intangible asset amortization expense for the same period of $4.5 million on the portion of the purchase price allocated to definite-lived intangible assets as follows (in thousands):
| |
Preliminary Fair Value |
Estimated Useful Life (years) |
Annual Amortization Expense |
|||||||
|---|---|---|---|---|---|---|---|---|---|---|
Trade Name |
$ | 10,760 | 15 | $ | 717 | |||||
Technology |
8,230 | 10 | 823 | |||||||
Non Compete |
200 | 1 | 200 | |||||||
Customer Relationships |
129,930 | 20 | 6,497 | |||||||
Favorable Lease |
7 | 5 | 1 | |||||||
| | | | | | | | | | | |
Total |
$ | 149,127 | $ | 8,238 | ||||||
| | | | | | | | | | | |
| | | | | | | | | | | |
| | | | | | | | | | | |
Calculated amortization 10/1/15 to 4/15/16 |
4,462 | |||||||||
|
4,094 |
|||||||||
| | | | | | | | | | | |
Net adjustment to general and administrative expenses |
$ | 368 | ||||||||
| | | | | | | | | | | |
| | | | | | | | | | | |
| | | | | | | | | | | |
Amortization expense has been calculated using the straight-line method over the estimated useful life.
- (F)
- Reflects the elimination of $15.2 million of direct, incremental transaction costs incurred by us and Neptune-Benson related to the Neptune-Benson Acquisition that are reflected in the historical statement of operations. The impact of these direct, incremental transaction costs already incurred have been eliminated in the unaudited pro forma combined statement of operations because these costs are nonrecurring in nature. These charges include financial advisory fees, legal, accounting and other professional fees incurred by us and Neptune-Benson that are directly related to the Neptune-Benson Acquisition.
77
- (G)
- We borrowed an additional $185.0 million to finance the Neptune-Benson Acquisition, including the repayment of Neptune-Benson historical outstanding indebtedness. This adjustment represents the net incremental interest expense of $3.3 million for the period from October 1, 2015 to April 15, 2016 based on a variable rate subject to a 1% floor plus a 4.5% spread (5.5% as of September 30, 2016). If the interest rate differed from the rates used in the pro forma interest expense by 0.125% for the fiscal year ended September 30, 2016, interest expense would have increased or decreased by approximately $0.2 million for the fiscal year ended September 30, 2016.
The following summarizes the pro forma adjustment for interest expense (in thousands):
| |
For the Period From October 1, 2015 Through April 15, 2016 |
|||
|---|---|---|---|---|
Elimination of historical Neptune-Benson interest expense on debt repaid upon the Neptune-Benson Acquisition |
$ | (2,932 | ) | |
Interest expense related to the NB Incremental Loans |
5,511 | |||
Amortization of deferred financing costs and debt discount related to the NB Incremental Loans |
718 | |||
| | | | | |
Net adjustment to interest expense |
$ | 3,297 | ||
| | | | | |
| | | | | |
| | | | | |
- (H)
- Represents the income tax effect for the unaudited pro forma combined statement of operations adjustments related to the Neptune-Benson Acquisition and our entry into the NB Incremental Loans calculated using the United Stated federal statutory tax rate of 35%. Because the adjustments contained in this unaudited pro forma combined financial information are based on estimates, the effective tax rate will likely vary from the effective rate in periods subsequent to the Neptune-Benson Acquisition.
As Neptune-Benson was historically a pass-through entity for tax purposes, the pro forma adjustment herein includes application of the U.S. federal statutory tax rate of 35% to the historical net loss of Neptune-Benson, resulting in a tax benefit of $4.5 million for the period from October 1, 2015 through April 15, 2016 for pro forma purposes. See the table below for a break out of the adjustment due to the historical tax structure of Neptune-Benson and due to the Neptune-Benson Acquisition and NB Incremental Loans adjustments (in thousands):
Historical Neptune-Benson net loss |
$ | (12,775 | ) | |
U.S. federal statutory tax rate |
35 | % | ||
| | | | | |
Pro forma income tax benefit |
(4,471 | ) | ||
Neptune-Benson Acquisition and NB Incremental Loan adjustments |
12,041 |
|||
U.S. federal statutory tax rate |
35 | % | ||
| | | | | |
Pro forma income tax expense |
4,214 | |||
| | | | | |
Net income tax provision adjustment |
$ | (257 | ) | |
| | | | | |
| | | | | |
| | | | | |
- (I)
- We completed the October 2016 Refinancing on October 28, 2016. The net proceeds of $150.0 million were used to repay $33.0 million outstanding on the Revolving Credit Facility, as well as to extinguish the $75.0 million Second Lien Facility. Subsequently, we also completed the August 2017 Refinancing on August 8, 2017. The net proceeds of $262.7 million were used to repay the $182.7 million remaining on the NB Incremental Loans and $60.0 million of revolving credit loans outstanding on the Revolving Credit Facility at the time the August 2017 Refinancing was completed.
The net adjustment represents incremental interest expense of $3.5 million based on the applicable interest rates for each tranche of debt repaid or issued in the October 2016 Refinancing and the August 2017 Refinancing, plus the incremental interest expense related to deferred refinancing costs incurred and the impact of commitment fees owed on the upsized Revolving Credit Facility,
78
in accordance with the terms of the credit agreement. If the interest rate differed from the rates used in the pro forma interest expense by 0.125% for the fiscal year ended September 30, 2016, interest expense would have increased or decreased by approximately $0.5 million for the fiscal year ended September 30, 2016.
| |
For the Fiscal Year Ended September 30, 2016 |
|||
|---|---|---|---|---|
| |
(in thousands) |
|||
Elimination of interest expense on Second Lien Facility |
(6,862 | ) | ||
Elimination of interest expense on NB Incremental Loans |
(10,253 | )(a) | ||
Elimination of interest expense on Revolving Credit Facility |
(384 | ) | ||
Interest expense related to new indebtedness incurred under the October 2016 Refinancing |
7,125 | |||
Interest expense related to new indebtedness incurred under the August 2017 Refinancing |
12,478 | |||
Interest expense on incremental borrowings under the Revolving Credit Facility prior to the August 2017 Refinancing |
513 | |||
Deferred refinancing cost, debt discount amortization expense and commitment fee costs related to the new indebtedness incurred under the October 2016 Refinancing and August 2017 Refinancing |
886 | |||
| | | | | |
Net adjustment to interest expense |
$ | 3,503 | ||
| | | | | |
| | | | | |
| | | | | |
- (a)
- The elimination of interest expense on the NB Incremental Loans consisted of $5.5 million of pro forma interest expense (see footnote G) and $4.7 million of historical interest expense incurred for the period of April 16, 2016 through September 30, 2016.
- (J)
- Represents
the income tax effect of the pro forma adjustments related to the October 2016 Refinancing and August 2017 Refinancing calculated using the U.S.
federal statutory tax rate of 35%. Because the adjustments contained in this unaudited pro forma combined financial information are based on estimates, the effective tax rate will likely vary from the
effective rate in subsequent periods.
- (K)
- Included in Neptune-Benson's consolidated results for the period from October 1, 2015 through April 15, 2016 are fees incurred by Neptune-Benson under a management services agreement with the majority investor in Neptune-Benson's former parent entity. This agreement was terminated upon the consummation of the Neptune-Benson Acquisition. The adjustment eliminates the fees recognized in Neptune-Benson's unaudited historical financial data. The adjustment to general and administrative expenses was $0.5 million for the period from October 1, 2015 through April 15, 2016.
Included in our consolidated results are fees incurred by us under the management agreement with AEA. This agreement will terminate pursuant to its terms upon the consummation of this offering. The adjustment eliminates the amount of fees recognized in our historical consolidated financial statements. The adjustment to general and administrative expenses was $4.4 million for the fiscal year ended September 30, 2016. See "Certain Relationships and Related Party Transactions" and Note 18 to our audited financial statements included elsewhere in this prospectus for further detail.
- (L)
- This adjustment represents reduction of interest expense related to this offering and the use of proceeds therefrom for the fiscal year ended September 30, 2016. We intend to use the net proceeds received by us in this offering to repay approximately $100.5 million of indebtedness (including accrued and unpaid interest) under the Term Loan Facility and any remainder for general corporate purposes.
79
- (M)
- Represents the income tax effect for the unaudited pro forma combined statement of operations adjustments related to this offering and use of proceeds therefrom calculated using the U.S. federal statutory tax rate of 35%. Because the adjustments contained in this unaudited pro forma combined financial information are based on estimates, the effective tax rate will likely vary from the effective rate in periods subsequent to this offering and use of proceeds.
Unaudited Pro Forma Condensed Consolidated Statement of Operations for the Nine Months Ended June 30, 2017
- (N)
- This adjustment represents a net reduction of interest expense of $1.3 million resulting from the October 2016 Refinancing for the period from October 1, 2016 to October 28, 2016 and the August 2017 Refinancing based on the applicable interest rates for each tranche of debt repaid or issued in the October 2016 Refinancing and the August 2017 Refinancing, plus the incremental interest expense related to deferred refinancing costs incurred and the impact of commitment fees owed on the unused portion of the upsized Revolving Credit Facility, in accordance with the terms of the credit agreement. If the interest rate differed from the rates used in the pro forma interest expense by 0.125% for the six months ended June 30, 2017, any change in interest expense would have been $0.3 million.
| |
For the Period From October 1, 2016 Through June 30, 2017 |
|||
|---|---|---|---|---|
| |
(in thousands) |
|||
Elimination of interest expense on Second Lien Facility |
(3,545 | ) | ||
Elimination of interest expense on NB Incremental Loans |
(7,726 | ) | ||
Elimination of interest expense on Revolving Credit Facility |
(181 | ) | ||
Interest expense related to new indebtedness incurred under the October 2016 Refinancing |
547 | |||
Interest expense related to new indebtedness incurred under the August 2017 Refinancing |
9,359 | |||
Interest expense on incremental borrowings under the Revolving Credit Facility prior to the August 2017 Refinancing |
536 | |||
Deferred refinancing cost, debt discount amortization expense and commitment fee costs related to the new indebtedness incurred under the October 2016 Refinancing and August 2017 Refinancing |
(314 | ) | ||
| | | | | |
Net adjustment to interest expense |
$ | (1,324 | ) | |
| | | | | |
| | | | | |
| | | | | |
- (O)
- Represents
the income tax effect of the pro forma adjustments related to the October 2016 Refinancing and the August 2017 Refinancing calculated using the
U.S. federal statutory tax rate of 35%. Because the adjustments contained in this unaudited pro forma condensed consolidated statement of operations are based on estimates, the effective tax rate will
likely vary from the effective rate in subsequent periods.
- (P)
- Included
in our consolidated results are fees incurred by us under the management agreement with AEA. This agreement will terminate pursuant to its terms upon the
consummation of this offering. The adjustment eliminates the amount of fees recognized in our historical consolidated results. The adjustment to general and administrative expenses was
$3.1 million for the nine months ended June 30, 2017. See "Certain Relationships and Related Party Transactions" and Note 18 to our audited financial statements included elsewhere
in this prospectus for further detail.
- (Q)
- This adjustment represents reduction of interest expense related to this offering and the use of proceeds therefrom for the nine months ended June 30, 2017. We intend to use the net proceeds received by us in this offering to repay approximately $100.5 million of indebtedness (including
80
accrued and unpaid interest) under the Term Loan Facility and any remainder for general corporate purposes.
- (R)
- Represents the income tax effect for the unaudited pro forma condensed consolidated statement of operations adjustments related to this offering and use of proceeds therefrom calculated using the U.S. federal statutory tax rate of 35%. Because the adjustments contained in this unaudited pro forma condensed consolidated statement of operations are based on estimates, the effective tax rate will likely vary from the effective rate in periods subsequent to this offering and use of proceeds.
Pro Forma Earnings (Loss) Per Share Attributable to Common Stockholders
- (S)
- Pro forma basic earnings (loss) per common share attributable to common stockholders has been calculated based on the number of shares assumed to be outstanding, assuming such shares were outstanding for the full period presented. The following table sets forth the computation of unaudited pro forma basic and diluted earnings (loss) per share attributable to common stockholders (in thousands except per share data):
For the nine months ended June 30, 2017:
| |
Nine months ended June 30, 2017 |
|||
|---|---|---|---|---|
Pro forma net income (loss) attributable to Evoqua |
$ | (3,102 | ) | |
Historical weighted average shares of common stock outstanding— basic and diluted |
104,821 | |||
Pro forma adjustment to reflect the assumed issuance of common stock |
8,333 | |||
| | | | | |
Weighted average shares of common stock outstanding used in computing pro forma net income (loss) per share—basic and diluted |
113,154 | |||
| | | | | |
Pro forma net income (loss) per share—basic and diluted |
$ | (0.03 | ) | |
| | | | | |
| | | | | |
| | | | | |
For the fiscal year ended September 30, 2016:
| |
Fiscal year ended September 30, 2016 |
|||
|---|---|---|---|---|
Pro forma net income (loss) attributable to Evoqua |
$ | 15,418 | ||
Historical weighted average shares of common stock outstanding—basic |
104,254 | |||
Pro forma adjustment to reflect the assumed issuance of common stock |
8,333 | |||
| | | | | |
Weighted average shares of common stock outstanding used in computing pro forma net income (loss) per share—basic |
112,587 | |||
| | | | | |
Pro forma net income (loss) per share—basic |
$ | 0.14 | ||
| | | | | |
| | | | | |
| | | | | |
81
For the fiscal year ended September 30, 2016:
| |
Fiscal year ended September 30, 2016 |
|||
|---|---|---|---|---|
Pro forma net income (loss) attributable to Evoqua |
$ | 15,418 | ||
Historical weighted average shares of common stock outstanding—diluted |
106,161 | |||
Pro forma adjustment to reflect the assumed issuance of common stock |
8,333 | |||
| | | | | |
Weighted average shares of common stock outstanding used in computing pro forma net income (loss) per share—diluted |
114,494 | |||
| | | | | |
Pro forma net income (loss) per share—diluted |
$ | 0.13 | ||
| | | | | |
| | | | | |
| | | | | |
82
SELECTED HISTORICAL CONSOLIDATED FINANCIAL DATA
Our selected historical consolidated balance sheet data presented below as of September 30, 2015 and 2016 and our selected historical consolidated statements of operations and cash flow data presented below for the period from October 1, 2013 through January 15, 2014 and the period from January 16, 2014 through September 30, 2014 (each as described below) and for each of the fiscal years ended September 30, 2015 and 2016 has been derived from our audited consolidated financial statements included elsewhere in this prospectus. Our selected historical consolidated balance sheet data presented below as of January 15, 2014 and September 30, 2014 has been derived from our unaudited financial information and our audited consolidated financial statements, respectively, not included in this prospectus. Our selected historical consolidated balance sheet, statement of operations and cash flow data presented below as of and for the fiscal year ended September 30, 2013 has been derived from our audited consolidated financial statements not included in this prospectus. Our selected historical consolidated balance sheet, statement of operations and cash flow data presented below as of and for the fiscal year ended September 30, 2012 has been derived from our unaudited consolidated financial information not included in this prospectus. The consolidated financial data of our Predecessor as of and for the fiscal years ended September 30, 2012 and 2013 and as of January 15, 2014 and for the period from October 1, 2013 to January 15, 2014 was prepared on a "carve-out" basis for the purpose of presenting our historical financial position, results of operations and cash flows. Because the Predecessor represents a portion of the Siemens' business, the selected financial data presented for these periods is not necessarily indicative of our current or future performance and does not reflect what our performance would have been had we operated as a separate stand-alone entity during these periods.
Our selected historical consolidated financial data presented below as of June 30, 2017 and for the nine months ended June 30, 2016 and 2017 has been derived from our unaudited condensed consolidated financial statements included elsewhere in this prospectus. Our selected historical consolidated financial data presented below as of June 30, 2016 has been derived from our unaudited condensed consolidated financial statements not included in this prospectus. The unaudited condensed consolidated financial statements were prepared on a basis consistent with that used in preparing our audited consolidated financial statements and include all adjustments, consisting of normal and recurring items, that we consider necessary for a fair presentation of our financial position and results of operations for the unaudited periods.
On January 15, 2014, Evoqua Water Technologies Corp. (formerly EWT Holdings I Corp.) acquired, through its wholly-owned entities, EWT Holdings II Corp. and EWT Holdings III Corp., all of the capital stock of the Predecessor. As a result of the AEA Acquisition and resulting change in control and changes due to the impact of purchase accounting, we are required to present separately the operating results for the Predecessor and Successor. We refer to the period from October 1, 2013 through January 15, 2014 as "Predecessor Period 2014," and the consolidated financial statements for that period include the accounts of the Predecessor. We refer to the period from January 16, 2014 through September 30, 2014 as "Successor Period 2014," and the consolidated financial statements for that period include the accounts of the Successor. The Successor was incorporated on October 7, 2013. From October 7, 2013 to January 15, 2014, the Successor had no activities other than the incurrence of transaction costs related to the AEA Acquisition, which are included in the Successor Period 2014. Consequently, Successor Period 2014, fiscal 2015 and fiscal 2016 may not be comparable to Predecessor Period 2014.
The historical results presented below are not necessarily indicative of the results to be expected for any future period. The selected historical consolidated financial data presented below should be read in conjunction with "Capitalization," "Management's Discussion and Analysis of Financial Condition and Results of Operations," "Business" and our consolidated financial statements and related notes included elsewhere in this prospectus.
83
| |
|
|
|
|
|
|
|
|
|
||||||||||||||||||
|---|---|---|---|---|---|---|---|---|---|---|---|---|---|---|---|---|---|---|---|---|---|---|---|---|---|---|---|
| |
Predecessor | Successor | |||||||||||||||||||||||||
| |
Fiscal Years Ended September 30, |
October 1, 2013 Through January 15, 2014 |
January 16, 2014 Through September 30, 2014 |
Fiscal Years Ended September 30, |
Nine Months Ended June 30, |
||||||||||||||||||||||
| |
2012 | 2013 | 2015 | 2016 | 2016 | 2017 | |||||||||||||||||||||
| |
(unaudited) |
|
|
|
|
|
|
(unaudited) |
|||||||||||||||||||
| |
(in thousands, except per share data) |
||||||||||||||||||||||||||
Statement of Operations Data: |
|||||||||||||||||||||||||||
Revenue from product sales and services |
$ | 1,368,601 | $ | 1,185,161 | $ | 306,314 | $ | 791,154 | $ | 1,060,966 | $ | 1,137,196 | $ | 817,788 | $ | 890,916 | |||||||||||
Costs of product sales and services |
(1,096,003 | ) | (952,481 | ) | (228,227 | ) | (700,245 | ) | (768,549 | ) | (804,131 | ) | (575,234 | ) | (614,088 | ) | |||||||||||
| | | | | | | | | | | | | | | | | | | | | | | | | | | | |
Gross profit |
272,598 | 232,680 | 78,087 | 90,909 | 292,417 | 333,065 | 242,554 | 276,828 | |||||||||||||||||||
Research and development expense |
(32,410 | ) | (28,091 | ) | (6,728 | ) | (18,829 | ) | (25,909 | ) | (22,897 | ) | (17,469 | ) | (15,684 | ) | |||||||||||
Sales and marketing expense |
(170,726 | ) | (148,948 | ) | (38,479 | ) | (90,947 | ) | (124,429 | ) | (135,208 | ) | (97,078 | ) | (108,729 | ) | |||||||||||
General and administrative expense |
(46,475 | ) | (17,641 | ) | (35,652 | ) | (104,122 | ) | (147,663 | ) | (144,771 | ) | (108,496 | ) | (120,534 | ) | |||||||||||
Parent corporate headquarter costs allocation |
— | (32,607 | ) | — | — | — | — | — | — | ||||||||||||||||||
Other operating income (expense), net |
2,969 | (629 | ) | (1,198 | ) | (522 | ) | 74 | 6,966 | 2,404 | 981 | ||||||||||||||||
Interest expense |
— | — | (23 | ) | (23,994 | ) | (34,060 | ) | (42,518 | ) | (29,467 | ) | (39,117 | ) | |||||||||||||
Equity income of non-consolidated affiliate(1) |
1,898 | 1,805 | 518 | 1,283 | 1,424 | — | — | — | |||||||||||||||||||
| | | | | | | | | | | | | | | | | | | | | | | | | | | | |
Income (loss) before income taxes |
27,854 | 6,569 | (3,475 | ) | (146,222 | ) | (38,146 | ) | (5,363 | ) | (7,552 | ) | (6,255 | ) | |||||||||||||
| | | | | | | | | | | | | | | | | | | | | | | | | | | | |
Income tax benefit (expense) |
— | (6,508 | ) | 1,173 | 48,465 | (47,905 | ) | 18,394 | 20,419 | (295 | ) | ||||||||||||||||
| | | | | | | | | | | | | | | | | | | | | | | | | | | | |
Net income (loss) |
27,854 | 61 | (2,302 | ) | (97,757 | ) | (86,051 | ) | 13,031 | 12,867 | (6,550 | ) | |||||||||||||||
| | | | | | | | | | | | | | | | | | | | | | | | | | | | |
Net income attributable to non-controlling interest |
— | — | — | — | — | 1,392 | 1,055 | 2,348 | |||||||||||||||||||
| | | | | | | | | | | | | | | | | | | | | | | | | | | | |
Net income (loss) attributable to the Company |
$ | 27,854 | $ | 61 | $ | (2,302 | ) | $ | (97,757 | ) | $ | (86,051 | ) | $ | 11,639 | $ | 11,812 | $ | (8,898 | ) | |||||||
| | | | | | | | | | | | | | | | | | | | | | | | | | | | |
| | | | | | | | | | | | | | | | | | | | | | | | | | | | |
| | | | | | | | | | | | | | | | | | | | | | | | | | | | |
Weighted average shares outstanding |
|||||||||||||||||||||||||||
Basic |
100,964 | 101,763 | 104,254 | 103,657 | 104,821 | ||||||||||||||||||||||
Diluted |
100,964 | 101,763 | 106,161 | 104,493 | 104,821 | ||||||||||||||||||||||
Earnings (loss) per share |
|||||||||||||||||||||||||||
Basic |
$ | (0.97 | ) | $ | (0.85 | ) | $ | 0.11 | $ | 0.11 | $ | (0.08 | ) | ||||||||||||||
Diluted |
$ | (0.97 | ) | $ | (0.85 | ) | $ | 0.11 | $ | 0.11 | $ | (0.08 | ) | ||||||||||||||
Cash Flow Data: |
|||||||||||||||||||||||||||
Net cash provided by (used in) operating activities |
$ | 91,844 | $ | 105,961 | $ | 45,577 | $ | 37,478 | $ | 41,944 | $ | 31,919 | $ | 10,655 | $ | 15,793 | |||||||||||
Net cash provided by (used in) investing activities |
(47,603 | ) | (22,609 | ) | (7,524 | ) | (762,087 | ) | (46,866 | ) | (344,610 | ) | (331,227 | ) | (117,266 | ) | |||||||||||
Net cash provided by (used in) financing activities |
— | (43,470 | ) | 89,901 | 911,444 | (6,263 | ) | 191,389 | 199,067 | 104,449 | |||||||||||||||||
Effect of exchange rate changes on cash |
— | (25 | ) | (243 | ) | (1,399 | ) | (5,225 | ) | 2,637 | 369 | 680 | |||||||||||||||
| | | | | | | | | | | | | | | | | | | | | | | | | | | | |
Change in cash and cash equivalents(2) |
$ | 44,241 | $ | 39,857 | $ | 127,711 | $ | 185,436 | $ | (16,410 | ) | $ | (118,665 | ) | $ | (121,136 | ) | $ | 3,656 | ||||||||
| | | | | | | | | | | | | | | | | | | | | | | | | | | | |
| | | | | | | | | | | | | | | | | | | | | | | | | | | | |
| | | | | | | | | | | | | | | | | | | | | | | | | | | | |
Balance Sheet Data (as of end of period): |
|||||||||||||||||||||||||||
Cash and cash equivalents(2) |
— | $ | 39,857 | $ | 167,568 | $ | 177,887 | $ | 169,027 | $ | 50,362 | $ | 47,891 | $ | 54,018 | ||||||||||||
Property, plant, and equipment, net(3) |
194,828 | 212,627 | 209,345 | 222,163 | 235,828 | 256,765 | 250,090 | 271,830 | |||||||||||||||||||
Other assets(4) |
549,537 | 876,035 | 840,467 | 734,990 | 635,016 | 989,104 | 983,403 | 1,094,855 | |||||||||||||||||||
| | | | | | | | | | | | | | | | | | | | | | | | | | | | |
Total assets |
$ | 744,365 | $ | 1,128,519 | $ | 1,217,380 | $ | 1,135,040 | $ | 1,039,871 | $ | 1,296,231 | $ | 1,281,384 | $ | 1,420,703 | |||||||||||
| | | | | | | | | | | | | | | | | | | | | | | | | | | | |
| | | | | | | | | | | | | | | | | | | | | | | | | | | | |
| | | | | | | | | | | | | | | | | | | | | | | | | | | | |
Long-term debt |
— | — | — | $ | 553,506 | $ | 547,032 | $ | 728,132 | $ | 735,022 | $ | 800,628 | ||||||||||||||
Other liabilities |
293,802 | 416,309 | 417,886 | 326,121 | 318,479 | 364,164 | 335,454 | 418,588 | |||||||||||||||||||
| | | | | | | | | | | | | | | | | | | | | | | | | | | | |
Total liabilities |
293,802 | 416,309 | 417,886 | 879,627 | 865,511 | 1,092,296 | 1,070,476 | 1,219,216 | |||||||||||||||||||
Net parent investment |
450,563 | 712,210 | 799,494 | — | — | — | — | — | |||||||||||||||||||
Total shareholders' equity |
— | — | — | $ | 255,413 | $ | 174,360 | $ | 203,935 | $ | 210,908 | $ | 201,487 | ||||||||||||||
| | | | | | | | | | | | | | | | | | | | | | | | | | | | |
Total liabilities and shareholders' equity |
$ | 744,365 | $ | 1,128,519 | $ | 1,217,380 | $ | 1,135,040 | $ | 1,039,871 | $ | 1,296,231 | $ | 1,281,384 | $ | 1,420,703 | |||||||||||
| | | | | | | | | | | | | | | | | | | | | | | | | | | | |
| | | | | | | | | | | | | | | | | | | | | | | | | | | | |
| | | | | | | | | | | | | | | | | | | | | | | | | | | | |
- (1)
- We
hold a 50% partnership interest in TWO, which, for the fiscal years ended September 30, 2014 and 2015, we accounted for under the equity method and did not
consolidate, as we did not have a controlling financial interest based on the shared powers of both joint venture partners to direct the activities that most significantly impact TWO's financial
performance. On October 1, 2015, a change occurred in the partnership structure of TWO such that we are now obligated to absorb all risk of loss up to 100% of the joint venture partner's
equity. As such, the accounting for our 50% interest changed from equity method investment to full consolidation as a variable interest entity under ASC 810.
- (2)
- For
fiscal 2012, the selected financial data reflects net cash from operations but the balance sheet data reflects zero cash balance because of the Predecessor's
centralized cash positions.
- (3)
- In
fiscal 2012, land and buildings representing $54.8 million was recorded on the real estate division of Siemens and was transferred in fiscal 2013 to
Predecessor.
- (4)
- Other assets in fiscal 2013 includes $271.2 million of goodwill, which had been identifiable to Predecessor but was recorded at a higher level within Siemens. Fiscal 2012 does not include goodwill.
84
MANAGEMENT'S DISCUSSION AND ANALYSIS OF
FINANCIAL CONDITION AND RESULTS OF OPERATIONS
The following discussion and analysis of our financial condition and results of operations should be read in conjunction with the sections titled "Selected Historical Consolidated Financial Data" and "Unaudited Pro Forma Financial Information," and our consolidated financial statements and related notes and other information included elsewhere in this prospectus. This discussion contains forward-looking statements that involve risks and uncertainties. Our actual results could differ materially from such forward-looking statements. Factors that could cause or contribute to those differences include, but are not limited to, those identified below and those discussed in the sections titled "Risk Factors" and "Cautionary Note Regarding Forward-Looking Statements" included elsewhere in this prospectus. Unless otherwise specified, all dollar amounts in this section are referred to in thousands.
Overview and Background
We are a leading provider of mission critical water treatment solutions, offering services, systems and technologies to support our customers' full water lifecycle needs. With over 200,000 installations worldwide, we hold leading positions in the industrial, commercial and municipal water treatment markets in North America. We offer a comprehensive portfolio of differentiated, proprietary technology solutions sold under a number of market-leading and well-established brands. We deliver and maintain these mission critical solutions through the largest service network in North America assuring our customers continuous uptime with 86 branches which are located no further than a two-hour drive from more than 90% of our customers' sites. We believe that the customer intimacy created through our service network is a significant competitive advantage.
Our solutions are designed to provide "worry-free water" by ensuring that our customers have access to an uninterrupted quantity and level of quality of water that meets their unique product, process and recycle or reuse specifications. We enable our customers to achieve lower costs through greater uptime, throughput and efficiency in their operations and support their regulatory compliance and environmental sustainability. We have worked to protect water, the environment and our employees for over 100 years. As a result, we have earned a reputation for quality, safety and reliability and are sought out by our customers to solve the full range of their water treatment needs, and maintaining our reputation is critical to the success of our business and solution set.
Our vision "to be the world's first choice in water solutions" and our values of "integrity, customers and performance" foster a corporate culture that is focused on employee enablement, empowerment and accountability, which creates a highly entrepreneurial and dynamic work environment. Our purpose is "Transforming water. Enriching life." We draw from a long legacy of water treatment innovations and industry firsts, supported by more than 1,250 granted or pending patents, which in aggregate are important to our business. Our core technologies are primarily focused on removing impurities from water, rather than neutralizing them through the addition of chemicals, and we are able to achieve purification levels which are 1,000 times greater than typical drinking water.
On January 15, 2014, Evoqua Water Technologies Corp. (formerly EWT Holdings I Corp.) acquired, through its wholly-owned entities, EWT Holdings II Corp. and EWT Holdings III Corp., all of the capital stock of the Predecessor. As a result of the AEA Acquisition and resulting change in control and changes due to the impact of purchase accounting, we are required to present separately the operating results for the Predecessor and Successor. We refer to the period from October 1, 2013 through January 15, 2014 as "Predecessor Period 2014," and the consolidated financial statements for that period include the accounts of the Predecessor. We refer to the period from January 16, 2014 through September 30, 2014 as "Successor Period 2014," and the consolidated financial statements for that period include the accounts of the Successor. The Successor was incorporated on October 7, 2013. From October 7, 2013 to January 16, 2014, the Successor had no activities other than the incurrence of transaction costs related to the AEA Acquisition, which are included in the Successor Period 2014.
85
Consequently, Successor Period 2014, fiscal 2015 and fiscal 2016 may not be comparable to Predecessor Period 2014.
Business Segments
Our business is organized by customer base and offerings into three reportable segments that each draw from the same reservoir of leading technologies, shared manufacturing infrastructure, common business processes and corporate philosophies. Our reportable segments consist of: (i) our Industrial Segment, (ii) our Municipal Segment and (iii) our Products Segment. The key factors used to identify these reportable segments are the organization and alignment of our internal operations, the nature of the products and services and customer type.
- •
- Within the Industrial Segment, we primarily provide tailored solutions in collaboration with our customers backed by life-cycle services
including on-demand water, BOO, recycle and reuse and emergency response service alternatives to improve operational reliability, performance and environmental compliance.
- •
- Within the Municipal Segment, we primarily deliver solutions, equipment and services to engineering firms, OEMs and municipalities to
treat wastewater and purify drinking water.
- •
- Within the Products Segment, we provide a highly differentiated and scalable range of products and technologies specified by global water treatment designers, OEMs, engineering firms and integrators.
We evaluate our business segments' operating results based on income from operations and EBITDA on a segment basis. Corporate activities include general corporate expenses, elimination of intersegment transactions, interest income and expense and other unallocated charges, which have not been allocated to business segments. As such, the segment results provided herein may not be comparable to other companies.
For the fiscal years ended September 30, 2014 (on a combined Predecessor Period 2014 and Successor Period 2014 basis), 2015 and 2016, our Industrial Segment accounted for 55.7%, 53.6% and 53.1% of our revenues, respectively; our Municipal Segment accounted for 23.5%, 25.8% and 24.4% of our revenues, respectively; and our Products Segment accounted for 20.8%, 20.6% and 22.5% of revenues, respectively.
Organic Growth Drivers
Market Growth
We maintain a leading position among customers in growing industries that utilize water as a critical part of their operations or production processes, including pharmaceuticals and health sciences, microelectronics, food and beverage, hydrocarbon and chemical processing, power, general manufacturing, municipal drinking and wastewater, marine and aquatics. Water treatment is an essential, non-discretionary market that is growing in importance as access to clean water has become an international priority. Underpinning this growth are a number of global, long-term trends that have resulted in increasingly stringent effluent regulations, along with a growing demand for cleaner and sustainable waste streams for reuse. These trends include the growing global population, increasing levels of urbanization and continued global economic growth, and we have seen these trends manifest themselves within our various end markets creating multiple avenues of growth. For example, within the industrial market, water is an integral and meaningful component in the production of a wide-range of goods spanning from consumer electronics to automobiles.
Our Existing Customer Base
We believe our strong brands, leading position in highly fragmented markets, scalable and global offerings, leading installed base and unique ability to provide complete treatment solutions will enable
86
us to capture a larger share of our existing customers' water treatment spend while expanding with existing and new customers into adjacent end-markets and underpenetrated regions, including by investing in our sales force and cross-selling to existing customers. We are uniquely positioned to further penetrate our core markets, with over 200,000 installations across over 38,000 global customers. We maintain a customer-intimate business model with strong brand value and provide solutions-focused offerings capable of serving a customer's full lifecycle water treatment needs, both in current and new geographic regions.
Our Service Model
We selectively target high value projects with opportunities for recurring business through service, parts and other aftermarket opportunities over the lifecycle of the process or capital equipment. In particular, we have developed a pipeline of smart, internet-connected monitoring technologies through the deployment of our Water One smart water platform that provides us with an increasing ability to handle our customers' complete water needs through on-demand water management, predictive maintenance and service response planning. Water One also enables us to transition our customers to more accurate pricing models based on usage, which otherwise would not have been possible without technological advancement. Our technology solutions provide customers with increased stability and predictability in water-related costs, while enabling us to optimize our service route network and on demand offerings through predictive analytics, which we believe will result in market share gains, improved service levels, increased barriers to entry and reduced costs.
Product and Technology Development
We develop our technologies through in-house research, development and engineering and targeted tuck-in, technology-enhancing and geography-expanding acquisitions. We have a reservoir of recently launched technologies and a strong pipeline of new offerings designed to provide customers with innovative, value-enhancing solutions. Furthermore, we have successfully completed eight technology-enhancing and geography-expanding acquisitions since April 2016 to add new capabilities and cross-selling opportunities in areas such as electrochemical and electrochlorination cells, regenerative media filtration, anodes, UV disinfection and aerobic and anaerobic biological treatment technologies. We are able to rapidly scale new technologies using our leading direct and third-party sales channels and our relationships with key influencers, including municipal representatives, engineering firms, designers and other system specifiers. We believe our continued investment in driving penetration of our recently launched technologies, robust pipeline of new capabilities and best-in-class channels to market will allow us to continue to address our customer needs across the water lifecycle.
Operational Excellence
We believe that continuous improvement of our operations, processes and organizational structure is a key driver of our earnings growth. Since fiscal 2014, we have realigned our organizational structure, achieved significant cost savings through operational efficiencies and revitalized our culture, which has energized our workforce and reduced employee turnover. We have identified and are pursuing a number of discrete initiatives which, if successful, we expect could result in additional cost savings over the next three years. These initiatives include our ePro and supply chain improvement programs to consolidate and manage global spending, our improved logistics and transportation management program, further optimizing our engineering cost structure, capturing benefits of our Water One remote system monitoring and data analytics offerings. We refer to these initiatives as "Value Creators" as these improvements focus on creating value for customers through reduced leadtimes, improved quality and superior customer support, while also creating value for stockholders through enhanced earnings growth. Furthermore, as a result of significant investments we have made in our footprint and facilities, we have capacity to support our planned growth without commensurate increase in fixed costs.
87
Acquisitions
We believe that tuck-in acquisitions present a key opportunity within our overall growth strategy, which we will continue to evaluate strategically. These strategic acquisitions will enable us to accelerate our growth in our current addressable market, as well as in new geographies and new end market verticals. Our existing customer relationships, best-in-class channels to market and ability to rapidly commercialize technologies provide a strong platform to drive rapid growth in the businesses we acquire. To capitalize on these opportunities, we have built an experienced team dedicated to mergers and acquisitions that has successfully completed eight technology-enhancing and geography-expanding acquisitions since April 2016, with purchase prices ranging from approximately $3.3 million to approximately $283.7 million, and pre-acquisition revenues ranging from approximately $3.1 million to approximately $55.7 million. We will continue to actively evaluate acquisition opportunities that are consistent with our business strategy and financial model, and, although we may not be able to continue to identify suitable acquisition targets and implement our growth strategy, we currently have a pipeline which includes more than 60 potential targets, which has been developed proactively by our team as well as informed by our customer base. Our acquisitions include:
- •
- Magneto—On April 11, 2016, we completed the acquisition of 100% of the
issued and outstanding capital stock of privately held Magneto, a leader in the development and manufacture of anodes for the electrochemical industry and refurbishment of electrochlorination cells
for seawater electrolysis for €23.4 million (or approximately $26.5 million). Magneto is included in the results of our Products Segment.
- •
- Neptune-Benson—On April 15, 2016, we completed the acquisition of 100% of
the issued and outstanding capital stock of privately held Neptune-Benson, a leading manufacturer of high-quality water filtration and disinfection products for the commercial, industrial and
municipal water markets for $283.7 million. Neptune-Benson is included in the results of our Products Segment.
- •
- VAF—On July 1, 2016, we completed the acquisition of substantially all of
the assets of VAF for approximately $3.3 million, consisting of $2.7 million cash at closing and $0.6 million related to a $1.0 million maximum earnout payment subject to
various performance metrics over the next five years. VAF is a leading screen filtration manufacturer based in Arvada, Colorado. VAF is included in the results of our Products Segment.
- •
- Delta UV—On August 3, 2016, we completed the acquisition of 100% of the
issued and outstanding capital stock of Delta UV, a leading manufacturer and marketer of UV-C technology in North America for $4.8 million. Delta UV is included in the results of our Products
Segment.
- •
- ETS—On November 1, 2016, we completed the acquisition of substantially all
of the assets of ETS, which adds organic wastewater treatment capability to our industrial treatment solutions, for $10.7 million. ETS further allows us to insource manufacturing of dissolved
air flotation units, the production of which we previously outsourced. ETS is included in the results of our Industrial Segment.
- •
- Noble—On May 9, 2017, we completed the acquisition of substantially all of
the assets of Noble, which provides water equipment and treatment systems for commercial buildings, industrial plants, medical laboratories and the pharmaceutical industry, with a focus on the Texas
market, for $7.6 million, consisting of $5.9 million cash paid at closing and $1.7 million related to a $2.4 million maximum earnout payment subject to various performance
metrics measured at the end of the 12 month period following closing. Noble supports our existing high-purity water capabilities and is based in Dallas, Texas. Noble will be included in the
results of our Industrial Segment going forward.
- •
- ADI—On June 30, 2017, we completed the acquisition of ADI, a leader in anaerobic digestion, aerobic treatment and biogas treatment, green energy recovery and water reuse technologies, as
88
- •
- Olson—On June 30, 2017, we completed the acquisition of all of the issued and outstanding shares of capital stock of privately held Olson, a leading designer and producer of filters and irrigation components for the agriculture and industrial markets, for $9.4 million. Olson will be included in the results of our Products Segment going forward.
well as industrial wastewater cover liners and containment systems for a base purchase price of CAD 71.4 million (or approximately $54.9 million), of which CAD 67.3 million ($51.8 million) in cash was paid at closing and included the fair value of the earnout payments of CAD 4.1 million ($3.1 million). The maximum earnout payment of CAD 7.5 million (or approximately $5.7 million), is payable over a period of twenty-four months based upon the achievement of certain specified performance metrics. ADI will be included in the results of our Industrial Segment going forward.
Key Factors and Trends Affecting Our Business and Financial Statements
Various trends and other factors affect or have affected our operating results, including:
Overall economic trends. The overall economic environment and related changes in industrial, commercial and municipal spending impact our business. In general, positive conditions in the broader economy promote industrial, commercial and municipal customer spending, while economic weakness results in a reduction of new industrial, commercial and municipal project activity. Macroeconomic factors that can affect customer spending patterns, and thereby our results of operations, include population growth, total water consumption, municipal budgets, employment rates, business conditions, the availability of credit or capital, interest rates, tax rates and regulatory changes. Since the businesses of our customers vary in cyclicality, periodic downturns in any specific sector typically have modest impacts on our overall business.
New products and technologies. Our ability to maintain our appeal to existing customers and attract new customers depends on our ability to originate, develop and offer a compelling array of products, services and solutions responsive to evolving customer innovations, preferences and specifications. We expect that increased use of water in industrial and commercial processes will drive increased customer demand in the future, and our ability to grow will depend in part on effectively responding to innovation in our customers' processes and systems. Further, our ability to provide products that comply with evolving government regulations will also be a driver of the appeal of our products, services and solutions to industrial and commercial customers.
Changes in costs. We have significant exposures to certain commodities, including steel, caustic, carbon, calcium nitrate and iridium, and volatility in the market price of these commodity input materials has a direct impact on our costs. If we are unable to manage commodity fluctuations through pricing actions, cost savings projects and sourcing decisions as well as through consistent productivity improvements, it may adversely impact our gross profit and gross margin. Further, additional potential acquisitions and international expansion will place increased demands on our operational, managerial, administrative and other resources. Managing our growth effectively will require us to continue to enhance our management systems, financial and management controls and information systems. We will also be required to hire, train and retain operational and sales personnel, which affects our operating margins.
Government policies. Decaying water systems in the United States will require critical drinking water and wastewater repairs, often led by municipal governments. Further, as U.S. states increase regulation on existing and emerging contaminants, we expect that our customers will increasingly require sustainable solutions to their water-related needs. In general, increased infrastructure investment and more stringent municipal, state and federal regulations promote increased spending on our products, services and solutions, while a slowdown in investment in public infrastructure or the
89
elimination of key environmental regulations could result in lower industrial and municipal spending on water systems and products.
Availability of water. In general, we expect demand for our products and services to increase as the availability of clean water from public sources decreases. Secular trends that will drive demand for water across a multitude of industrial, commercial and municipal applications include global population growth, urbanization, industrialization and overall economic growth. In addition, the supply of clean water could be adversely impacted by factors including an aging water infrastructure within North America and increased levels of water stress from seasonal rainfall, inadequate water storage options or treatment technologies. Because water is a critical component and byproduct of many processes, including in manufacturing and product development, we expect that, as global consumption patterns evolve and water shortages persist, demand for our equipment and services will continue to increase.
Operational investment. Our historical operating results reflect the impact of our ongoing investments to support our growth. We have made significant investments in our business that we believe have laid the foundation for continued profitable growth. We believe that our strengthened sales force, mergers and acquisitions team, enhanced information systems, research, development and engineering investments and other factors enable us to support our operating model.
Our ability to source and distribute products effectively. Our revenues are affected by our ability to purchase our inputs in sufficient quantities at competitive prices. While we believe our suppliers have adequate capacity to meet our current and anticipated demand, our level of revenues could be adversely affected in the event of constraints in our supply chain, including the inability of our suppliers to produce sufficient quantities of raw materials in a manner that is able to match demand from our customers.
Fluctuation in quarterly results. Our quarterly results have historically varied depending upon a variety of factors, including funding, readiness of projects and regulatory approvals. In addition, our contracts for large capital water treatment projects, systems and solutions for industrial, commercial and municipal applications are generally fixed-price contracts with milestone billings. As a result of these factors, our working capital requirements and demands on our distribution and delivery network may fluctuate during the year.
Contractual relationships with customers. Due to our large installed base and the nature of our contractual relationships with our customers, we have high visibility into a large portion of our revenue. The one- to twenty-year terms of many of our service contracts and the regular delivery and replacement of many of our products help to insulate us from the negative impact of any economic decline.
Inflation and deflation trends. Our financial results can be expected to be directly impacted by substantial increases in costs due to commodity cost increases or general inflation which could lead to a reduction in our revenues as well as greater margin pressure as increased costs may not be able to be passed on to customers. To date, changes in commodity prices and general inflation have not materially impacted our business.
Exchange rates. The reporting currency for our financial statements is the U.S. dollar. We operate in numerous countries around the world and therefore, certain of our assets, liabilities, revenues and expenses are denominated in functional currencies other than the U.S. dollar, primarily in the euro, U.K. sterling, Chinese renminbi, Canadian dollar, Australian dollar and Singapore dollar. To prepare our consolidated financial statements we must translate those assets, liabilities, revenues and expenses into U.S. dollars at the applicable exchange rate. As a result, increases or decreases in the value of the U.S. dollar against these other currencies will affect the amount of these items recorded in our consolidated financial statements, even if their value has not changed in the functional currency. While we believe we are not susceptible to any material impact on our results of operations caused by
90
fluctuations in exchange rates because our operations are primarily conducted in the United States, if we expand our foreign operations in the future, substantial increases or decreases in the value of the U.S. dollar relative to these other currencies could have a significant impact on our results of operations.
Public company costs. As a result of this initial public offering, we will incur additional legal, accounting and other expenses that we did not previously incur, including costs associated with SEC reporting and corporate governance requirements. These requirements include compliance with the Sarbanes-Oxley Act as well as other rules implemented by the SEC and the NYSE. Our financial statements following this offering will reflect the impact of these expenses. In addition, the one-time grant of stock-settled restricted stock unit awards expected to be made in connection with this offering to certain members of management will result in increased non-cash stock-based compensation expense, which will be incremental to our ongoing stock-based compensation expense. This stock-based compensation expense will be finalized following the pricing of this offering and is expected to be expensed beginning in the fiscal quarter in which this offering closes and continuing over the following eight fiscal quarters. For more information, please see "Compensation Discussion and Analysis—IPO Awards—Restricted Stock Units."
Debt refinancings. In October 2016, we repaid our Second Lien Facility in full and revolving credit loans then-outstanding and borrowed an additional $150.0 million of term loans under the Term Loan Facility at lower rates, and we have the option to add one or more incremental term loan under the Term Loan Facility or revolving credit facilities or increase commitments under our Revolving Credit Facility. Further, the Revolving Credit Facility and Term Loan Facility are scheduled to mature in January 2019 and January 2021, respectively, and we will need to repay, refinance, replace or otherwise extend the maturity of our First Lien Facilities. Accordingly, our results have been and will be impacted by substantial changes in our net interest expense throughout the periods presented and in the future. See "—Liquidity and Capital Resources" below.
How We Assess the Performance of Our Business
In assessing the performance of our business, we consider a variety of performance and financial measures. The key indicators of the financial condition and operating performance of our business are revenue, gross profit, gross margin, operating expenses, net income (loss) and Adjusted EBITDA.
Revenue
Our sales are a function of sales volumes and selling prices, each of which is a function of the mix of product and service sales, and consist primarily of:
- •
- sales of tailored light industry technologies, heavy industry technologies and environmental products, services and solutions in collaboration
with our industrial customers, backed by lifecycle services including emergency response services and build-own-operate alternatives, to a broad group of industrial customers in our U.S., Canada and
Singapore markets;
- •
- sales of products, services and solutions to engineering firms and municipalities to purify drinking water and treat wastewater globally;
and
- •
- sales of a wide variety of differentiated products and technologies, to an array of OEM, distributor, end-user, engineering firm and integrator customers in all of our geographic markets and aftermarket channels.
Cost of Sales, Gross Profit and Gross Margin
Gross profit is determined by subtracting cost of product sales and cost of services from our product and services revenue. Gross margin measures gross profit as a percentage of our combined product and services revenue.
Cost of product sales consists of all manufacturing costs required to bring a product to a ready for sale condition, including direct and indirect materials, direct and indirect labor costs including benefits, freight, depreciation, information technology, rental and insurance, repair and maintenance, utilities, other manufacturing costs, warranties and third party commissions.
91
Cost of services primarily consists of the cost of personnel and travel for our field service, supply chain and technicians, depreciation of equipment and field service vehicles and freight costs.
Operating Expenses
Operating expenses consist primarily of sales and marketing, general and administrative and research and development expenses.
Sales and Marketing. Sales and marketing expenses consist primarily of advertising and marketing promotions of our products, services and solutions and related personnel expenses (including all Evoqua sales and application employees' base compensation and incentives), as well as sponsorship costs, consulting and contractor expenses, travel, display expenses and related amortization. We expect our sales and marketing expenses to increase as we continue to actively promote our products, services and solutions.
General and Administrative. General and administrative expenses consist of fixed overhead personnel expenses associated with our service organization (including district and branch managers, customer service, contract renewals and regeneration plant management). We expect our general and administrative expenses to increase due to the anticipated growth of our business and related infrastructure as well as legal, accounting, insurance, investor relations and other costs associated with becoming a public company.
Research and Development. Research and development expenses consist primarily of personnel expenses related to research and development, patents, sustaining engineering, consulting and contractor expenses, tooling and prototype materials and overhead costs allocated to such expenses. Substantially all of our research and development expenses are related to developing new products and services and improving our existing products and services. To date, research and development expenses have been expensed as incurred, because the period between achieving technological feasibility and the release of products and services for sale has been short and development costs qualifying for capitalization have been insignificant.
We expect our research and development expenses to increase as we continue to invest in developing new products, services and solutions and enhancing our existing products, services and solutions.
Net Income (Loss)
Net income (loss) is determined by subtracting operating expenses and interest expense from, and adding other operating income (expense), equity income from our partnership interest in TWO and income tax benefit (expense) to, gross profit. For more information on how we determine gross profit, see "—Gross Profit."
Adjusted EBITDA
Adjusted EBITDA is one of the primary metrics used by management to evaluate the financial performance of our business. We present Adjusted EBITDA, which is not a recognized financial measure under GAAP, because we believe it is frequently used by analysts, investors and other interested parties to evaluate companies in our industry. Further, we believe it is helpful in highlighting trends in our operating results, because it excludes the results of decisions that are outside the control of management, while other measures can differ significantly depending on long-term strategic decisions regarding capital structure, the tax jurisdictions in which we operate and capital investments. Management uses Adjusted EBITDA to supplement GAAP measures of performance as follows:
- •
- to assist investors and analysts in comparing our operating performance across reporting periods on a consistent basis by excluding items that we do not believe are indicative of our core operating performance;
92
- •
- in our management incentive compensation which is based in part on components of Adjusted EBITDA;
- •
- in certain calculations under our Senior Secured Credit Facilities, which use components of Adjusted EBITDA.
- •
- to evaluate the effectiveness of our business strategies;
- •
- to make budgeting decisions; and
- •
- to compare our performance against that of other peer companies using similar measures.
In addition to the above, our chief operating decision maker uses EBITDA of each reportable segment to evaluate the operating performance of such segments.
Adjusted EBITDA is defined as net income (loss) before interest expense, income tax expense (benefit) and depreciation and amortization, adjusted for the impact of certain other items, including restructuring and related business transformation costs, purchase accounting adjustment costs, non-cash stock based compensation, sponsor fees, transaction costs and other gains, losses and expenses.
You are encouraged to evaluate each adjustment and the reasons we consider it appropriate for supplemental analysis. In addition, in evaluating Adjusted EBITDA, you should be aware that in the future, we may incur expenses similar to the adjustments in the presentation of Adjusted EBITDA. Our presentation of Adjusted EBITDA should not be construed as an inference that our future results will be unaffected by unusual or non-recurring items. In addition, Adjusted EBITDA may not be comparable to similarly titled measures used by other companies in our industry or across different industries.
The following is a reconciliation of our net income (loss) to Adjusted EBITDA:
| |
Predecessor |
|
Successor | ||||||||||||||||||
|---|---|---|---|---|---|---|---|---|---|---|---|---|---|---|---|---|---|---|---|---|---|
| |
October 1, 2013 Through January 15, 2014 |
January 16, 2014 Through September 30, 2014 |
Fiscal Years Ended September 30 |
Nine Months Ended June 30, |
|||||||||||||||||
| |
2015 | 2016 | 2016 | 2017 | |||||||||||||||||
| |
|
|
|
|
|
(unaudited) |
|||||||||||||||
| |
(in thousands) |
||||||||||||||||||||
| |
|
|
|
||||||||||||||||||
Net income (loss) |
$ | (2,302 | ) | $ | (97,757 | ) | $ | (86,051 | ) | $ | 13,031 | $ | 12,867 | $ | (6,550 | ) | |||||
Interest expense |
23 | 23,994 | 34,060 | 42,518 | 29,467 | 39,117 | |||||||||||||||
Income tax (benefit) expense |
(1,173 | ) | (48,465 | ) | 47,905 | (18,394 | ) | (20,419 | ) | 295 | |||||||||||
Depreciation and amortization |
14,934 | 139,933 | 58,139 | 69,289 | 50,986 | 55,813 | |||||||||||||||
| | | | | | | | | | | | | | | | | | | | | | |
EBITDA |
$ | 11,482 | $ | 17,705 | $ | 54,053 | $ | 106,444 | $ | 72,901 | $ | 88,675 | |||||||||
Restructuring and related business transformation costs(a) |
— | 41,027 | 32,842 | 43,075 | 18,208 | 36,382 | |||||||||||||||
Purchase accounting adjustment costs(b) |
— | 18,326 | — | 1,267 | — | 229 | |||||||||||||||
Stock-based compensation(c) |
— | 342 | 1,587 | 1,999 | 1,447 | 1,634 | |||||||||||||||
Sponsor fees(d) |
— | 4,369 | 5,012 | 3,758 | 2,810 | 3,042 | |||||||||||||||
Transaction costs(e) |
— | 10,121 | — | 5,374 | 3,943 | 5,659 | |||||||||||||||
Other gains, losses and expenses(f) |
— | 13,820 | 26,417 | (1,864 | ) | 1,324 | 682 | ||||||||||||||
| | | | | | | | | | | | | | | | | | | | | | |
Adjusted EBITDA |
$ | 11,482 | $ | 105,710 | $ | 119,911 | $ | 160,053 | $ | 100,633 | $ | 136,303 | |||||||||
| | | | | | | | | | | | | | | | | | | | | | |
| | | | | | | | | | | | | | | | | | | | | | |
| | | | | | | | | | | | | | | | | | | | | | |
- (a)
- Represents:
- (i)
- costs and expenses in connection with various restructuring initiatives since the AEA Acquisition, including severance costs, relocation costs, recruiting expenses, write-offs of inventory and fixed assets and third-party consultant costs to
93
- (ii)
- legal
settlement costs and intellectual property related fees associated with legacy matters prior to the AEA Acquisition, including fees and settlement costs
related to product warranty litigation on MEMCOR products and certain discontinued products ($11.7 million in the Successor Period, reflected as a component of Cost of product sales and
services, $11.7 million in fiscal 2015, reflected as components of Cost of product sales and services ($10.7 million) and General and administrative expenses ($1.0 million),
$5.1 million, primarily reflected as a component of Cost of product sales and services in fiscal 2016, $2.5 million, primarily reflected as a component of Cost of product sales and
services in the nine months ended June 30, 2016 and $1.8 million, primarily reflected as a component of General and administrative expense in the nine months ended June 30, 2017);
- (iii)
- expenses
associated with our information technology and functional infrastructure transformation following the AEA Acquisition, including activities to optimize
information technology systems and functional infrastructure processes for a standalone business ($16.9 million, primarily reflected as a component of General and administrative expense in the
Successor Period, $12.1 million, primarily reflected as components of Cost of product sales and services ($3.0 million), Research and development expense ($0.4 million), Sales and
marketing expense ($0.3 million) and General and administrative expense ($8.4 million) in fiscal 2015, $9.5 million, primarily reflected as components of Cost of product sales and
services ($3.6 million), Sales and marketing expense ($2.5 million), General and administrative expense ($3.1 million) and Research and development expense ($0.3 million)
in fiscal 2016, $6.1 million, primarily reflected as components of Cost of product sales and services ($2.9 million), Sales and marketing expense ($1.7 million) and General and
administrative expense ($1.5 million) in the nine months ended June 30, 2016 and $4.5 million, primarily reflected as components of Cost of product sales and services
($1.8 million), Sales and marketing expense ($0.7 million) and General and administrative expense ($2.0 million) in the nine months ended June 30, 2017); and
- (iv)
- costs
incurred by us in connection with this offering, including consultant costs and public company compliance costs ($0.5 million in fiscal 2016,
$0.3 million in the nine months ended June 30, 2016 and $4.4 million in the nine months ended June 30, 2017, all reflected as a component of General and administrative
expense).
assist with these initiatives (includes (A) $16.9 million in fiscal 2016 (all of which is reflected as a component of Restructuring charges in "Note 12—Restructuring and Related Charges" to our audited consolidated financial statements) and $19.2 million for the nine months ended June 30, 2017 (all of which is reflected as a component of Restructuring charges in "Note 11—Restructuring and Related Charges" to our unaudited condensed consolidated financial statements) related to our voluntary separation plan pursuant to which approximately 220 employees accepted separation packages, and (B) $12.4 million (of which $4.4 million is reflected as a component of Restructuring charges in "Note 12—Restructuring and Related Charges" to our audited consolidated financial statements) in the Successor Period, $9.2 million (of which $6.5 million is reflected as a component of Restructuring charges in "Note 12—Restructuring and Related Charges" to our audited consolidated financial statements) in fiscal 2015, $11.1 million (all of which is reflected as a component of Restructuring charges in "Note 12—Restructuring and Related Charges" to our audited consolidated financial statements) in fiscal 2016, $9.3 million (of which $8.1 million is reflected as a component of Restructuring charges in "Note 11—Restructuring and Related Charges" to our unaudited condensed consolidated financial statements) in the nine months ended June 30, 2016 and $6.5 million (of which $2.9 million is reflected as a component of Restructuring charges in "Note 11—Restructuring and Related Charges" to our unaudited condensed consolidated financial statements) in the nine months ended June 30, 2017 related to various other initiatives implemented to restructure and reorganize our business as a standalone business with an appropriate management team and cost structure). Differences between amounts reflected as Restructuring charges in "Note 12—Restructuring and Related Charges" to our audited financial statements and amounts reflected in this adjustment relate primarily to retention payments made to employees in the Successor Period of $5.6 million that have been reflected as components of Cost of product sales and services ($1.2 million), Research and development expense ($0.2 million), Sales and marketing expense ($1.9 million) and General and administrative expense ($2.3 million) as well as other administrative costs associated with separation from the Predecessor that have been reflected in the Successor Period as a component of General and administrative expense ($2.4 million). Differences between amounts reflected as Restructuring charges in "Note 12—Restructuring and Related Charges" to our audited financial statements and amounts reflected in this adjustment also relate to retention payments made to employees in fiscal 2015 of $2.5 million that have been reflected as components of Cost of product sales and services ($1.1 million), Research and development expense ($0.1 million), Sales and marketing expense ($1.0 million) and General and administrative expense ($0.3 million). Differences between amounts reflected as Restructuring charges in "Note 11—Restructuring and Related Charges" to our unaudited condensed consolidated financial statements in the nine months ended June 30, 2016 and June 30, 2017 and amounts reflected in this adjustment relate primarily to consulting costs and other charges related to implementing such initiatives that have primarily been recorded as a component of General and administrative expense ($1.2 million) in the nine months ended June 30, 2016 and Cost of product sales and services ($1.4 million), Sales and marketing expenses ($1.0 million) and General and administrative expense ($1.0 million) in the nine months ended June 30, 2017;
- (b)
- Represents adjustments for the effect of the purchase accounting step-up in the value of inventory to fair value recognized in cost of goods sold as a result of the AEA Acquisition and the acquisition of Magneto.
94
- (c)
- Represents
non-cash stock-based compensation expenses related to option awards. See Note 15 to our audited financial statements included elsewhere in this
prospectus for further detail.
- (d)
- Represents
management fees paid to AEA pursuant to the management agreement. Pursuant to the management agreement, AEA provided advisory and consulting services to
us in connection with the AEA Acquisition, including investment banking, due diligence, financial advisory and valuation services. AEA also provides ongoing advisory and consulting services (similar
in nature to the services provided in connection with the AEA Acquisition) to us pursuant to the management agreement. In connection with this offering, the management agreement will be terminated.
See "Certain Relationships and Related Party Transactions" and Note 18 to our audited financial statements included elsewhere in this prospectus for further detail.
- (e)
- Represents
expenses associated with acquisition and divestiture-related activities and post-acquisition integration costs and accounting, tax, consulting, legal and
other fees and expenses associated with (i) the AEA Acquisition ($10.1 million in the Successor Period) and (ii) other acquisition transactions ($5.4 million in fiscal
2016, $3.9 million in the nine months ended June 30, 2016 and $5.7 million in the nine months ended June 30, 2017).
- (f)
- Represents:
- (i)
- impact
of foreign exchange gains and losses ($6.8 million loss in the Successor Period, $19.0 million loss in fiscal 2015, $0.5 million loss in
fiscal 2016, $1.4 million loss in the nine months ended June 30, 2016 and $2.1 million gain in the nine months ended June 30, 2017);
- (ii)
- $3.5 million
gain on the sale of assets, primarily related to the Vernon Disposition;
- (iii)
- foreign
exchange impact related to headquarter allocations ($0.7 million gain in fiscal 2016, $0.04 million gain in the nine months ended
June 30, 2016 and $1.0 million loss in the nine months ended June 30, 2017); and
- (iv)
- expenses related to maintaining non-operational business locations ($7.0 million in the Successor Period, $7.4 million in fiscal 2015, $1.8 million in fiscal 2016 and $1.7 million in the nine months ended June 30, 2017).
95
Results of Operations
The following tables summarize key components of our results of operations for the periods indicated:
| |
Predecessor |
|
Successor | ||||||||||||||||||
|---|---|---|---|---|---|---|---|---|---|---|---|---|---|---|---|---|---|---|---|---|---|
| |
October 1, 2013 Through January 15, 2014 |
January 16, 2014 Through September 30, 2014 |
Fiscal Years Ended September 30 |
Nine Months Ended June 30, |
|||||||||||||||||
| |
2015 | 2016 | 2016 | 2017 | |||||||||||||||||
| |
|
|
|
|
|
(unaudited) |
|||||||||||||||
| |
|
|
(in thousands, except per share data) |
||||||||||||||||||
Statement of Operations Data: |
|||||||||||||||||||||
Revenue from product sales and services |
$ | 306,314 | $ | 791,154 | $ | 1,060,966 | $ | 1,137,196 | $ | 817,788 | $ | 890,916 | |||||||||
Cost of product sales and services |
(228,227 | ) | (700,245 | ) | (768,549 | ) | (804,131 | ) | (575,234 | ) | (614,088 | ) | |||||||||
| | | | | | | | | | | | | | | | | | | | | | |
Gross profit |
78,087 | 90,909 | 292,417 | 333,065 | 242,554 | 276,828 | |||||||||||||||
Research and development expense |
(6,728 | ) | (18,829 | ) | (25,909 | ) | (22,897 | ) | (17,469 | ) | (15,684 | ) | |||||||||
Sales and marketing expense |
(38,479 | ) | (90,947 | ) | (124,429 | ) | (135,208 | ) | (97,078 | ) | (108,729 | ) | |||||||||
General and administrative expense |
(35,652 | ) | (104,122 | ) | (147,663 | ) | (144,771 | ) | (108,496 | ) | (120,534 | ) | |||||||||
Other operating (expense) income, net |
(1,198 | ) | (522 | ) | 74 | 6,966 | 2,404 | 981 | |||||||||||||
Interest expense |
(23 | ) | (23,994 | ) | (34,060 | ) | (42,518 | ) | (29,467 | ) | (39,117 | ) | |||||||||
Equity income of non-consolidated affiliate(1) |
518 | 1,283 | 1,424 | — | — | — | |||||||||||||||
| | | | | | | | | | | | | | | | | | | | | | |
Loss before income taxes |
(3,475 | ) | (146,222 | ) | (38,146 | ) | (5,363 | ) | (7,552 | ) | (6,255 | ) | |||||||||
| | | | | | | | | | | | | | | | | | | | | | |
Income tax benefit (expense) |
1,173 | 48,465 | (47,905 | ) | 18,394 | 20,419 | (295 | ) | |||||||||||||
| | | | | | | | | | | | | | | | | | | | | | |
Net income (loss) |
(2,302 | ) | (97,757 | ) | (86,051 | ) | 13,031 | 12,867 | (6,550 | ) | |||||||||||
| | | | | | | | | | | | | | | | | | | | | | |
Net income attributable to non-controlling interest |
— | — | — | 1,392 | 1,055 | 2,348 | |||||||||||||||
| | | | | | | | | | | | | | | | | | | | | | |
Net income (loss) attributable to the Company |
$ | (2,302 | ) | $ | (97,757 | ) | $ | (86,051 | ) | $ | 11,639 | $ | 11,812 | $ | (8,898 | ) | |||||
| | | | | | | | | | | | | | | | | | | | | | |
| | | | | | | | | | | | | | | | | | | | | | |
| | | | | | | | | | | | | | | | | | | | | | |
Weighted average shares outstanding |
|||||||||||||||||||||
Basic |
100,964 | 101,763 | 104,254 | 103,657 | 104,821 | ||||||||||||||||
Diluted |
100,964 | 101,763 | 106,161 | 104,493 | 104,821 | ||||||||||||||||
Earnings (loss) per share |
|||||||||||||||||||||
Basic |
$ | (0.97 | ) | $ | (0.85 | ) | $ | 0.11 | $ | 0.11 | $ | (0.08 | ) | ||||||||
Diluted |
$ | (0.97 | ) | $ | (0.85 | ) | $ | 0.11 | $ | 0.11 | $ | (0.08 | ) | ||||||||
- (1)
- We hold a 50% partnership interest in TWO, which, for the fiscal years ended September 30, 2014 and 2015, we accounted for under the equity method and did not consolidate, as we did not have a controlling financial interest based on the shared powers of both joint venture partners to direct the activities that most significantly impact TWO's financial performance. On October 1, 2015, a change occurred in the partnership structure of TWO such that we are now obligated to absorb all risk of loss up to 100% of the joint venture partner's equity. As such, the accounting for our 50% interest changed from equity method investment to full consolidation as a variable interest entity under ASC 810.
96
Nine Months Ended June 30, 2016 and June 30, 2017
| |
Nine Months Ended June 30, | |
||||||||||||||
|---|---|---|---|---|---|---|---|---|---|---|---|---|---|---|---|---|
| |
2016 | 2017 | |
|||||||||||||
| |
(unaudited) |
|
||||||||||||||
| |
(in thousands) |
|
||||||||||||||
| |
|
% of Revenues |
|
% of Revenues |
% Variance |
|||||||||||
Revenue from product sales and services |
$ | 817,788 | 100 | % | $ | 890,916 | 100 | % | 8.9 | % | ||||||
Cost of product sales and services |
(575,234 | ) | (70.3 | )% | (614,088 | ) | (68.9 | )% | 6.8 | % | ||||||
Gross profit |
242,554 | 29.7 | % | 276,828 | 31.1 | % | 14.1 | % | ||||||||
Research and development expense |
(17,469 | ) | (2.1 | )% | (15,684 | ) | (1.8 | )% | (10.2 | )% | ||||||
Sales and marketing expense |
(97,078 | ) | (11.9 | )% | (108,729 | ) | (12.2 | )% | 12.0 | % | ||||||
General and administrative expense |
(108,496 | ) | (13.3 | )% | (120,534 | ) | (13.5 | )% | 11.1 | % | ||||||
Other operating income (expense), net |
2,404 | 0.3 | % | 981 | 0.1 | % | (59.2 | )% | ||||||||
Interest expense |
(29,467 | ) | (3.6 | )% | (39,117 | ) | (4.4 | )% | 32.8 | % | ||||||
| | | | | | | | | | | | | | | | | |
Loss before income taxes |
(7,552 | ) | (0.9 | )% | (6,255 | ) | (0.7 | )% | (17.2 | )% | ||||||
Income tax benefit (expense) |
20,419 | 2.5 | % | (295 | ) | — | % | (101.4 | )% | |||||||
| | | | | | | | | | | | | | | | | |
Net income (loss) before non-controlling interest |
12,867 | 1.6 | % | (6,550 | ) | (0.7 | )% | (150.9 | )% | |||||||
| | | | | | | | | | | | | | | | | |
Net income attributable to non-controlling interest |
1,055 | 0.1 | % | 2,348 | 0.3 | % | 122.6 | % | ||||||||
| | | | | | | | | | | | | | | | | |
Net income (loss) attributable to the Company |
$ | 11,812 | 1.4 | % | $ | (8,898 | ) | (1.0 | )% | (175.3 | )% | |||||
| | | | | | | | | | | | | | | | | |
| | | | | | | | | | | | | | | | | |
| | | | | | | | | | | | | | | | | |
Other financial data: |
||||||||||||||||
Adjusted EBITDA(1) |
$ | 100,633 | 12.3 | % | $ | 136,303 | 15.3 | % | 35.4 | % | ||||||
- (1)
- For the definition of Adjusted EBITDA and a reconciliation to net income (loss), its most directly comparable financial measure presented in accordance with GAAP, see footnote 2 to the table under the heading "Prospectus Summary—Summary Consolidated Financial and Operating Data."
Consolidated Results
Revenues—Revenues increased $73.1 million, or 8.9%, to $890.9 million in the nine months ended June 30, 2017 from $817.8 million in the nine months ended June 30, 2016.
The following table provides the change in revenues from product sales and revenues from services, respectively:
| |
Nine Months Ended June 30, 2016 |
% of Revenues |
Nine Months Ended June 30, 2017 |
% of Revenues |
% Variance | |||||||||||
|---|---|---|---|---|---|---|---|---|---|---|---|---|---|---|---|---|
Revenue from product sales |
$ | 415.6 | 50.8 | % | $ | 474.5 | 53.3 | % | 14.2 | % | ||||||
Revenue from services |
402.2 | 49.2 | % | 416.4 | 46.7 | % | 3.5 | % | ||||||||
| | | | | | | | | | | | | | | | | |
|
$ | 817.8 | 100.0 | % | $ | 890.9 | 100.0 | % | ||||||||
| | | | | | | | | | | | | | | | | |
| | | | | | | | | | | | | | | | | |
| | | | | | | | | | | | | | | | | |
Revenues from product sales increased $58.9 million, or 14.2%, to $474.5 million in the nine months ended June 30, 2017 from $415.6 million in the nine months ended June 30, 2016. The increase in product revenues was primarily due to the acquisitions of Neptune-Benson, VAF, Delta UV, Magneto and ETS. These acquisitions accounted for approximately $56.3 million of the increase in revenues.
97
Additionally, there was organic revenue growth of approximately $5.0 million in the power and microelectronics markets in the Asia region driven by product sales of Electrodeionization equipment in the Asia market, approximately $6.0 million related to increased Municipal wastewater business, and $0.8 million in the power market in the U.S. driven by product sales of dewatering equipment and intake screens. These revenue increases were partially offset by lower sales volumes in certain product lines, including a decline of $6.1 million in revenues related to our Municipal MEMCOR product line as we transition to higher growth end markets in both Municipal wastewater and Industrial, a decline of $3.4 million in revenues related to our Electro-catalytic equipment sales, which provide chlorination products for the global marine and hydrocarbon markets, and $1.9 million of revenue decline related to our Italian operations in the nine months ended June 30, 2016 that did not reoccur due to the wind down of our Italian operations.
Revenues from services increased $14.2 million, or 3.5%, to $416.4 million in the nine months ended June 30, 2017 from $402.2 million in the nine months ended June 30, 2016. The increase was driven by organic revenue growth, including volume driven increases in Industrial service revenue of approximately $18.5 million associated with higher U.S. customer production levels in the general manufacturing and pharmaceutical and healthcare end markets and new account penetration in the power and hydrocarbon and chemical processing end markets, and an increase of approximately $1.4 million related to our Municipal services business. These increases were offset by approximately $6.0 million in revenues related to our Vernon location in the nine months ended June 30, 2016 that did not reoccur because of the Vernon Disposition as of September 30, 2016.
Cost of Sales and Gross Margin—Total gross margin increased to 31.1% in the nine months ended June 30, 2017 from 29.7% in the nine months ended June 30, 2016.
The following table provides the change in cost of product sales and cost of services, respectively, along with related gross margins:
| |
Nine Months Ended June 30, | ||||||||||||
|---|---|---|---|---|---|---|---|---|---|---|---|---|---|
| |
2016 | 2017 | |||||||||||
| |
|
Gross Margin % |
|
Gross Margin % |
|||||||||
Cost of product sales |
$ | 287.6 | 30.8 | % | $ | 316.8 | 33.2 | % | |||||
Cost of services |
287.6 | 28.5 | % | 297.3 | 28.6 | % | |||||||
| | | | | | | | | | | | | | |
|
$ | 575.2 | 29.7 | % | $ | 614.1 | 31.1 | % | |||||
| | | | | | | | | | | | | | |
| | | | | | | | | | | | | | |
| | | | | | | | | | | | | | |
Cost of product sales increased by approximately $29.2 million in the nine months ended June 30, 2017 as compared to the nine months ended June 30, 2016. The increase in cost of product sales was primarily driven by the impact of the acquisitions of Neptune Benson, VAF, Delta UV and Magneto, which accounted for approximately $27.7 million of the increase. These accretive acquisitions were the primary driver of the 2.4% increase in gross margin. The remaining increase in cost of product sales was due to organic growth driven by higher sales volumes due to increased U.S. customer production levels in the general manufacturing and pharmaceutical and healthcare end markets and the power and microelectronics markets in the Asia region. These increases in cost of product sales were partially offset by a decrease of $3.6 million in cost of sales related to the wind down of our Italian operations.
Cost of services increased by approximately $9.7 million in the nine months ended June 30, 2017 as compared to the nine months ended June 30, 2016. The increase in cost of services was related to the overall increase in revenue volume, which increased cost of sales by approximately $14.3 million, offset by the decrease in cost of services related to the Vernon Disposition as of September 30, 2016.
98
Operating Expenses—Operating expenses increased $21.9 million, or 9.8%, to $244.9 million in the nine months ended June 30, 2017 from $223.0 million in the nine months ended June 30, 2016. The increase in operating expense was primarily due to the operating expenses associated with the acquired companies of Neptune-Benson, VAF, Delta UV and Magneto, which accounted for $17.4 million of the operating expense increase. A discussion of operating expenses by category is as follows:
Research and Development Expense—Research and development expenses decreased $1.8 million, or 10.2%, to $15.7 million in the nine months ended June 30, 2017 from $17.5 million in the nine months ended June 30, 2016. Research and development expenses increased $0.6 million with the acquisition of Magneto and their extensive research and development programs related to anode coatings, but was offset by decrease of approximately $1.5 million in research and development expenses in connection with the consolidation and restructuring of our Singaporean research and development center as well as a reduction of approximately $0.9 million associated with the completion of a research and development program in the Municipal Segment in the nine months ended June 30, 2016.
Sales and Marketing Expense—Sales and marketing expenses increased $11.6 million, or 12.0%, to $108.7 million in the nine months ended June 30, 2017 from $97.1 million in the nine months ended June 30, 2016. The driving factor in the increase in sales and marketing expense was an increase of $8.5 million associated with the sales and marketing activities of the acquired companies of Neptune Benson, VAF, Delta UV and Magneto.
General and Administrative Expense—General and administrative expenses increased $12.0 million, or 11.1%, to $120.5 million in the nine months ended June 30, 2017 from $108.5 million in the nine months ended June 30, 2016. The acquisitions of Neptune-Benson, VAF, Delta UV, and Magneto accounted for $8.2 million of the increase. The balance of the increase in general and administrative expenses was primarily due to changes in foreign currency, costs related to restructuring and the integration of acquisitions.
Other Operating Income (Expense), Net—Other operating income (expense), net decreased $1.4 million, or 58.3%, to $1.0 million of income in the nine months ended June 30, 2017 from $2.4 million of income in the nine months ended June 30, 2016. The net decrease in other income was primarily due to a gain on the sale of property in the nine months ended June 30, 2016 that did not reoccur in the nine months ended June 30, 2017.
Interest Expense—Interest expense increased $9.7 million, or 32.7%, to $39.1 million in the nine months ended June 30, 2017 from $29.5 million in the nine months ended June 30, 2016. The increase in interest expense was primarily due to an increase in borrowing for acquisitions, interest on capital leases and fees associated with the Senior Secured Credit Facilities.
Income Tax Benefit (Expense)—Income tax was an expense of $0.3 million in the nine months ended June 30, 2017 as compared to a benefit of $20.4 million in the nine months ended June 30, 2016, an increase of 101.4%. The effective tax rate in the nine months ended June 30, 2017 was (4.7%) as compared to 270.4% in the nine months ended June 30, 2016. The increase in tax expense was primarily the result of applying a higher than expected annual tax rate in a jurisdiction that excludes certain items from the valuation allowance analysis. The decrease in the effective tax rate in the nine months ended June 30, 2017 is attributable to higher pre-tax losses in proportion to income tax benefits.
Net Income—Net income attributable to Evoqua Water Technologies Corp. decreased by $20.7 million, or 175.4%, to a net loss of $8.9 million for the nine months ended June 30, 2017 as compared to net income of $11.8 million for the nine months ended June 30, 2016. This decrease was primarily driven by increased tax expense of $0.3 million in the nine months ended June 30, 2017 as
99
compared to a tax benefit of $20.4 million in the nine months ended June 30, 2016, a difference of $20.7 million. Furthermore, $9.6 million of additional interest expense was incurred in the nine months ended June 30, 2017. These factors offset the increased revenue volume and profitability associated with the acquisitions of Neptune-Benson, VAF, Delta UV and Magneto, which accounted for $6.7 million of increased net income for the nine months ended June 30, 2017. Furthermore, increased volume and profitability as well as incremental benefits from restructuring activities and operational efficiencies that were implemented in the prior year (net of charges from additional restructuring actions taken in the nine months ended June 30, 2017) contributed $2.9 million to net income for the nine months ended June 30, 2017.
Adjusted EBITDA—Adjusted EBITDA increased $35.7 million, or 35.4%, to $136.3 million for the nine months ended June 30, 2017 from $100.6 million for the nine months ended June 30, 2016. Increased volume and carry over benefits from restructuring and operational efficiencies that we implemented in the prior year provided $21.0 million of the increase in Adjusted EBITDA. Additionally, revenue volume and profitability associated with the acquisitions of Neptune-Benson, VAF, Delta UV and Magneto contributed the remainder of the $14.7 million increase in Adjusted EBITDA.
100
Segment Results
| |
Nine Months Ended June 30, |
|
||||||||
|---|---|---|---|---|---|---|---|---|---|---|
| |
2016 | 2017 | |
|||||||
| |
(unaudited) |
|
||||||||
| |
(in thousands) |
% Variance |
||||||||
Revenues |
||||||||||
Industrial |
$ | 443,813 | $ | 460,861 | 3.8 | % | ||||
Municipal |
199,481 | 198,927 | (0.3 | )% | ||||||
Products |
174,494 | 231,128 | 32.5 | % | ||||||
| | | | | | | | | | | |
Total Consolidated |
$ | 817,788 | $ | 890,916 | 8.9 | % | ||||
| | | | | | | | | | | |
| | | | | | | | | | | |
| | | | | | | | | | | |
Percentage of total consolidated revenues |
||||||||||
Industrial |
54.3 | % | 51.7 | % | ||||||
Municipal |
24.4 | % | 22.3 | % | ||||||
Products |
21.3 | % | 26.0 | % | ||||||
| | | | | | | | | | | |
Total Consolidated |
100.0 | % | 100.0 | % | ||||||
| | | | | | | | | | | |
| | | | | | | | | | | |
| | | | | | | | | | | |
Operating Profit |
||||||||||
Industrial |
$ | 61,244 | $ | 74,501 | 21.6 | % | ||||
Municipal |
21,401 | 23,525 | 9.9 | % | ||||||
Products |
28,170 | 45,254 | 60.6 | % | ||||||
Corporate |
(88,900 | ) | (110,418 | ) | 24.9 | % | ||||
| | | | | | | | | | | |
Total Consolidated |
$ | 21,915 | $ | 32,862 | 50.0 | % | ||||
| | | | | | | | | | | |
| | | | | | | | | | | |
| | | | | | | | | | | |
Operating profit as a percentage of total consolidated revenues |
||||||||||
Industrial |
7.5 | % | 8.4 | % | ||||||
Municipal |
2.6 | % | 2.6 | % | ||||||
Products |
3.4 | % | 5.1 | % | ||||||
Corporate |
(10.8 | )% | (12.4 | )% | ||||||
| | | | | | | | | | | |
Total Consolidated |
2.7 | % | 3.7 | % | ||||||
| | | | | | | | | | | |
| | | | | | | | | | | |
| | | | | | | | | | | |
EBITDA |
||||||||||
Industrial |
$ | 89,716 | $ | 102,133 | 13.8 | % | ||||
Municipal |
27,427 | 29,644 | 8.1 | % | ||||||
Products |
31,941 | 53,667 | 68.0 | % | ||||||
Corporate and unallocated costs |
(76,183 | ) | (96,754 | ) | 27.0 | % | ||||
| | | | | | | | | | | |
Total Consolidated |
$ | 72,901 | $ | 88,690 | 21.7 | % | ||||
| | | | | | | | | | | |
| | | | | | | | | | | |
| | | | | | | | | | | |
EBITDA as a percentage of total consolidated revenues |
||||||||||
Industrial |
11.0 | % | 11.5 | % | ||||||
Municipal |
3.4 | % | 3.3 | % | ||||||
Products |
3.9 | % | 6.0 | % | ||||||
Corporate and unallocated costs |
(9.3 | )% | (10.9 | )% | ||||||
| | | | | | | | | | | |
Total Consolidated |
8.9 | % | 10.0 | % | ||||||
| | | | | | | | | | | |
| | | | | | | | | | | |
| | | | | | | | | | | |
101
EBITDA on a segment basis is defined as earnings before interest, taxes, depreciation and amortization. The following is a reconciliation of our segment operating profit to EBITDA on a segment basis:
| |
Nine Months Ended June 30, | ||||||||||||||||||
|---|---|---|---|---|---|---|---|---|---|---|---|---|---|---|---|---|---|---|---|
| |
2016 | 2017 | |||||||||||||||||
| |
Industrial | Municipal | Products | Industrial | Municipal | Products | |||||||||||||
| |
(unaudited) (in thousands) |
||||||||||||||||||
Operating Profit |
$ | 61,244 | $ | 21,401 | $ | 28,170 | $ | 74,501 | $ | 23,525 | $ | 45,254 | |||||||
Interest expense(1) |
— | — | — | — | — | — | |||||||||||||
Income tax expense (benefit)(1) |
— | — | — | — | — | — | |||||||||||||
Depreciation and amortization |
28,472 | 6,026 | 3,771 | 27,632 | 6,119 | 8,413 | |||||||||||||
| | | | | | | | | | | | | | | | | | | | |
EBITDA |
$ | 89,716 | $ | 27,427 | $ | 31,941 | $ | 102,133 | $ | 29,644 | $ | 53,667 | |||||||
- (1)
- Interest expense and Income tax expense (benefit) are corporate activities that are not allocated to our three reportable segments.
Industrial
Revenues in the Industrial Segment increased $17.0 million, or 4%, to $460.9 million in the nine months ended June 30, 2017 from $443.8 million in the nine months ended June 30, 2016. The increase in revenues was primarily due to an increase in service revenues of $18.3 million driven by higher customer production levels in general manufacturing and pharmaceutical and healthcare end markets and new account penetration in power and hydrocarbon and chemical processing end markets. In addition, an increase of $3.6 million of revenue was attributable to our acquisition of ETS on November 1, 2016. Our increased revenues were partially offset by a decrease of $6.0 million in revenues related to the Vernon Disposition as of September 30, 2016.
Operating profit in the Industrial Segment increased $13.3 million, or 22%, to $74.5 million in the nine months ended June 30 2017 from $61.2 million in the nine months ended June 30 2016. The increase in operating profit was primarily related to an increase in volume of $5.3 million as well as $7.1 million of benefits experienced as a result of our Value Creator initiatives. Value Creator benefits include carry over benefits from ePro initiatives that we implemented in the prior year and continued benefits from operational efficiencies.
EBITDA in the Industrial Segment increased $12.4 million, or 14%, to $102.1 million in the nine months ended June 30 2017 from $89.7 million in the nine months ended June 30 2016. The increase in EBITDA resulted from the same factors which impacted operating profit in the Industrial Segment during this period.
Municipal
Revenues in the Municipal Segment decreased $0.6 million, or 0.3%, to $198.9 million in the nine months ended June 30 2017 from $199.5 million in the nine months ended June 30 2016. The decrease in revenues was primarily related to the closure of operations in Italy of $1.9 million, but also driven by the changes in product mix with the decline in our MEMCOR product line by $6.1 million, as we transition to higher growth end markets in both municipal wastewater and industrial. This is offset by growth in both our municipal services and waste water businesses of $7.5 million as compared to the prior year.
Operating profit in the Municipal Segment increased $2.1 million, or 9.9%, to $23.5 million in the nine months ended June 30 2017 from $21.4 million in the nine months ended June 30 2016. The
102
increase in operating profit was primarily due to continued Value Creator benefits in both project execution and ePro of $1.3 million, benefits from the alignment to a more customer focused organizational structure of $1.9 million and reduced warranty expense of $0.7 million. This was partially offset by declining revenue volumes and increased labor costs.
EBITDA in the Municipal Segment increased $2.2 million, or 8.1%, to $29.6 million in the nine months ended June 30 2017 from $27.4 million in the nine months ended June 30 2016. EBITDA increased as a result of the same factors which impacted operating profit in the Municipal Segment during this period.
Products
Revenues in the Products Segment increased $56.6 million, or 32%, to $231.1 million in the nine months ended June 30 2017 from $174.5 million in the nine months ended June 30 2016. The increase in revenues was primarily due to the acquisitions of Neptune-Benson, VAF, Delta UV and Magneto. These acquisitions accounted for an aggregate of $52.7 million of the increased revenues. The Products Segment also increased revenues in the amount of $5.0 million in our power and microelectronics markets in the Asia region and $0.8 million in the power market in the U.S. These increases were principally due to higher product sales of electrodeionization equipment in our legal entity in China. Increases in these markets more than offset a decline of $3.3 million in the global marine and hydrocarbon markets. The downturn in these markets impacted the Products Segment sale of electro-catalytic equipment which provides chlorination products for the offshore oil and gas and marine industries.
Operating profit in the Products Segment increased $17.1 million, or 61%, to $45.3 million in the nine months ended June 30 2017 from the $28.2 million in the nine months ended June 30 2016. The increase in operating profit was primarily due to the additional revenue volume and profitability associated with the acquisitions of Neptune-Benson, VAF, Delta UV and Magneto. These acquisitions accounted for $12.7 million of the operating profit increase during the nine months ended June 30 2017. Operating profit in the electrodeionization equipment product lines also improved due to the increased revenues of $5.8 million in the Asia region. This accounted for $2.0 million in additional operating profit. In the Electro-catalytic market, operating profits actually increased by $0.6 million despite the downturn due to a carryover benefit from prior year operational efficiency initiatives which reduced operating expense. The balance of $1.8 million in operating profit resulted from other restructure and cost improvement activities in the Products Segment.
EBITDA in the Products Segment increased $21.7 million, or 68%, to $53.7 million in the nine months ended June 30 2017 from $31.9 million in the nine months ended June 30 2016 with $17.4 million attributable to the Neptune-Benson, VAF, Delta UV and Magneto. The balance of $4.3 million was due to growth in the other product lines and reduced operating expenses from restructuring in the prior period.
103
Fiscal Years Ended September 30, 2015 and September 30, 2016
| |
Fiscal Years Ended September 30 | |
||||||||||||||
|---|---|---|---|---|---|---|---|---|---|---|---|---|---|---|---|---|
| |
2015 | 2016 | |
|||||||||||||
| |
|
% of Revenues | |
% of Revenues | % Variance | |||||||||||
| |
(in thousands) |
|
||||||||||||||
Revenue from product sales and services |
$ | 1,060,966 | 100 | % | $ | 1,137,196 | 100 | % | 7.2 | % | ||||||
Cost of product sales and services |
(768,549 | ) | (72.4 | )% | (804,131 | ) | (70.7 | )% | 4.6 | % | ||||||
| | | | | | | | | | | | | | | | | |
Gross profit |
292,417 | 27.6 | % | 333,065 | 29.3 | % | 13.9 | % | ||||||||
Research and development expense |
(25,909 | ) | (2.4 | )% | (22,897 | ) | (2.0 | )% | (11.6 | )% | ||||||
Sales and marketing expense |
(124,429 | ) | (11.7 | )% | (135,208 | ) | (11.9 | )% | 8.7 | % | ||||||
General and administrative expense |
(147,663 | ) | (13.9 | )% | (144,771 | ) | (12.7 | )% | (2.0 | )% | ||||||
Other operating income (expense), net |
74 | 0.0 | % | 6,966 | 0.6 | % | N/M | |||||||||
Interest expense |
(34,060 | ) | (3.2 | )% | (42,518 | ) | (3.7 | )% | 24.8 | % | ||||||
Equity income of a non-consolidated affiliate(1) |
1,424 | 0.1 | % | — | — | % | N/M | |||||||||
| | | | | | | | | | | | | | | | | |
Loss before income taxes |
(38,146 | ) | (3.6 | )% | (5,363 | ) | (0.5 | )% | (85.9 | )% | ||||||
Income tax benefit (expense) |
(47,905 | ) | (4.5 | )% | 18,394 | 1.6 | % | 138.4 | % | |||||||
| | | | | | | | | | | | | | | | | |
Net income (loss) |
(86,051 | ) | (8.1 | )% | 13,031 | 1.1 | % | 115.1 | % | |||||||
| | | | | | | | | | | | | | | | | |
Net income attributable to non-controlling interest |
— | — | % | 1,392 | 0.1 | % | N/M | |||||||||
| | | | | | | | | | | | | | | | | |
Net income (loss) attributable to the Company |
$ | (86,051 | ) | (8.1 | )% | $ | 11,639 | 1.0 | % | 113.5 | % | |||||
| | | | | | | | | | | | | | | | | |
| | | | | | | | | | | | | | | | | |
| | | | | | | | | | | | | | | | | |
Other financial data: |
||||||||||||||||
Adjusted EBITDA(2) |
$ | 119,911 | 11.3 | % | $ | 160,053 | 14.1 | % | 33.5 | % | ||||||
- (1)
- We
hold a 50% partnership interest in TWO, which, for the fiscal years ended September 30, 2014 and 2015, we accounted for under the equity method and did not
consolidate, as we did not have a controlling financial interest based on the shared powers of both joint venture partners to direct the activities that most significantly impact TWO's financial
performance. On October 1, 2015, a change occurred in the partnership structure of TWO such that we are now obligated to absorb all risk of loss up to 100% of the joint venture partner's
equity. As such, the accounting for our 50% interest changed from equity method investment to full consolidation as a variable interest entity under ASC 810.
- (2)
- For
the definition of Adjusted EBITDA and a reconciliation to net income (loss), its most directly comparable financial measure presented in accordance with GAAP,
see footnote 2 to the table under the heading "Prospectus Summary—Summary Consolidated Financial and Operating Data."
- N/M—Not meaningful
Consolidated Results
Revenues—Revenues increased $76.2 million, or 7.2%, to $1,137.2 million in the fiscal year ended September 30, 2016 from $1,061.0 million in the fiscal year ended September 30, 2015.
104
The following table provides the change in revenues from product sales and revenues from services, respectively:
| |
Fiscal Years Ended September 30, | |
||||||||||||||
|---|---|---|---|---|---|---|---|---|---|---|---|---|---|---|---|---|
| |
2015 | 2016 | |
|||||||||||||
| |
|
% of Revenues | |
% of Revenues | % Variance | |||||||||||
Revenue from product sales |
$ | 533.7 | 50.3 | % | $ | 587.1 | 51.6 | % | 10.0 | % | ||||||
Revenue from services |
527.3 | 49.7 | % | 550.1 | 48.4 | % | 4.3 | % | ||||||||
| | | | | | | | | | | | | | | | | |
|
$ | 1,061.0 | 100.0 | % | $ | 1,137.2 | 100.0 | % | ||||||||
| | | | | | | | | | | | | | | | | |
| | | | | | | | | | | | | | | | | |
| | | | | | | | | | | | | | | | | |
Revenues from product sales increased $53.4 million, or 10.0%, to $587.1 million in the fiscal year ended September 30, 2016 from $533.7 million in the fiscal year ended September 30, 2015. The increase in revenues was primarily due to the acquisitions of Neptune-Benson, VAF, Delta UV, ETS and Magneto. These acquisitions accounted for $44.4 million of the increase in product revenues. Other areas of product revenue growth included an increase in the execution of capital project orders of approximately $17.3 million as compared to the prior year in the power and pulp and paper end markets, as well as an increase of approximately $7.8 million for products related to highly purified water in the microelectronics and power markets with the establishment of a new legal entity and sales presence in the China market. This increase was partially offset by delays in the marine and power product retrofit markets, which experienced a decrease in product revenues of approximately $14.0 million.
Revenues from services increased $22.8 million, or 4.3%, to $550.1 million in the fiscal year ended September 30, 2016 from $527.3 million in the fiscal year ended September 30, 2015. Service and capital system support revenues increased in the power, hydrocarbon and chemical processing end markets for approximately $6.4 million, driven by penetration into new and existing customer accounts, as well as service business growth in the Municipal Segment for approximately $4.4 million through geographical expansion and rollout of new service offerings. The consolidation of TWO, our joint venture that sells water management equipment and services, also accounted for approximately $11.6 million of the increase in service revenues.
Cost of Sales and Gross Margin—Total gross margin increased to 29.3% in the fiscal year ended September 30, 2016 from 27.6% in the fiscal year ended September 30, 2015.
The following table provides the change in cost of product sales and cost of services, respectively, along with related gross margins:
| |
Fiscal Years Ended September 30, | ||||||||||||
|---|---|---|---|---|---|---|---|---|---|---|---|---|---|
| |
2015 | 2016 | |||||||||||
| |
|
Gross Margin % |
|
Gross Margin % |
|||||||||
Cost of product sales |
$ | 385.2 | 27.8 | % | $ | 407.4 | 30.6 | % | |||||
Cost of services |
383.3 | 27.3 | % | 396.8 | 27.9 | % | |||||||
| | | | | | | | | | | | | | |
|
$ | 768.5 | 27.6 | % | $ | 804.2 | 29.3 | % | |||||
| | | | | | | | | | | | | | |
| | | | | | | | | | | | | | |
| | | | | | | | | | | | | | |
Cost of product sales increased by approximately $22.2 million in the year ended September 30, 2016 as compared to the year ended September 30, 2015. The increase in cost of sales for our products business was primarily due to the impact of the acquisitions of Neptune-Benson, VAF, Delta UV and Magneto. These acquisitions accounted for $21.2 million of the increase in cost of sales as well as a corresponding gross profit increase of approximately $23.2 million and were the primary driver of the 2.8% increase in gross margin. Increases in revenues related to capital project orders and sales in the microelectronics and power markets drove an increase in cost of sales of approximately $17.4 million,
105
however, purchasing and supply chain productivity measures that were implemented to adjust for the standalone nature of the Company supported a reduction in cost of sales of approximately $6.2 million. Cost of product sales was also favorably impacted by the final stages of the wind down of our Italian operations, which drove a decrease of approximately $11.7 million in cost of sales and a corresponding increase in gross profit of $4.5 million as compared to the prior year. Additionally, commensurate with the delays in revenues, cost of sales were reduced in the marine and power product retrofit markets by approximately $9.7 million.
Cost of services increased approximately $13.5 million in the year ended September 30, 2016 as compared to the year ended September 30, 2015. This was commensurate with the increase in revenue volume, offset by the beneficial impact of various restructuring initiatives put in place over the previous period.
Operating Expenses—Operating expenses increased $4.9 million, or 1.6%, to $302.9 million in the fiscal year ended September 30, 2016 from $298.0 million in the fiscal year ended September 30, 2015. The largest driver in the increase in operating expenses was primarily due to the acquisitions of Neptune-Benson, VAF and Delta UV accounting for $9.8 million of the operating expense increase and Magneto accounting for $2.7 million of the increase. These increases in operating expenses were offset with decreases in expenses in the other segments. A discussion of operating expenses by category is as follows:
Research and Development Expense—Research and development expenses decreased $3.0 million, or 11.6%, to $22.9 million in the fiscal year ended September 30, 2016 from $25.9 million in the fiscal year ended September 30, 2015. Research and development expenses increased $0.2 million with the acquisition of Magneto and their extensive research and development programs related to anode coatings.
Sales and Marketing Expense—Sales and marketing expenses increased $10.8 million, or 8.7%, to $135.2 million in the fiscal year ended September 30, 2016 from $124.4 million in the fiscal year ended September 30, 2015. The driving factor for the increase in sales and marketing expenses associated with reinvigoration and expansion of the sales force, which drove an increase in salaries and benefits of approximately $9.8 million, coupled with implementation of sales initiatives such as training and rebranding, which incurred approximately $1.2 million of additional cost.
General and Administrative Expense—General and administrative expenses decreased $2.9 million, or 2.0%, to $144.8 million in the fiscal year ended September 30, 2016 from $147.7 million in the fiscal year ended September 30, 2015. The acquisitions of Neptune-Benson, VAF, Delta UV and Magneto accounted for a $11.7 million increase in general and administrative expenses, which was offset by a $14.6 million decrease in general and administrative expenses as a result of restructuring actions and other cost savings initiatives taken across the business.
Other Operating Income, Net—Other operating income increased $6.9 million to $7.0 million in the fiscal year ended September 30, 2016 from $0.1 million in the fiscal year ended September 30, 2015. The increase in other operating income was primarily due to a gain on disposal of assets, including the Vernon Disposition.
Interest Expense—Interest expense increased $8.4 million, or 24.8%, to $42.5 million in the fiscal year ended September 30, 2016 from $34.1 million in the fiscal year ended September 30, 2015. The increase in interest expense is due to an increase in borrowing for acquisitions, interest on capital leases and fees associated with the Senior Secured Credit Facilities.
Income Tax Benefit (Expense)—Income tax expense decreased $66.3 million, or 138.4%, to an income tax benefit of $18.4 million in the fiscal year ended September 30, 2016 from an expense of $47.9 million in the fiscal year ended September 30, 2015. The effective tax rate in the fiscal year
106
ended September 30, 2016 was 343.0% compared to an effective tax rate of (125.6)% in the fiscal year ended September 30, 2015. The decrease in income tax expense and effective tax rate in the fiscal year ended September 30, 2016 was primarily due to the benefit resulting from the release of valuation allowance as a result of additional deferred tax liabilities recognized in connection with the Neptune-Benson Acquisition.
Net Income—Net income increased $99.1 million, or 115.1%, to net income of $13.0 million for the fiscal year ended September 30, 2016 from a net loss of $86.1 million for the fiscal year ended September 30, 2015. The primary driver of the increase in net income was the transition from a large tax expense of $47.9 million in the fiscal year ended September 30, 2015 to a tax benefit of $18.4 million in the fiscal year ended September 30, 2016, a change of approximately $66.3 million. The change in tax expense was related to the establishment and subsequent partial release of valuation allowance. Additional contributors to the increase in net income included the improvement in gross profit of approximately $40.7 million driven by revenue volume and profitability as discussed above, as well as the increase in other operating income of approximately $6.9 million discussed above. These contributors to net income were offset by the overall increase in operating expenses of approximately $4.9 million.
Adjusted EBITDA—Adjusted EBITDA increased $40.2 million, or 33.5%, to $160.1 million for the fiscal year ended September 30, 2016 from $119.9 million for the fiscal year ended September 30, 2015. Increased volume and carry over benefits from restructuring and operational efficiencies that we implemented in the prior year provided $17.1 million of the increase in Adjusted EBITDA. Additionally, revenue volume and profitability associated with the acquisitions of Neptune-Benson, VAF, Delta UV and Magneto contributed approximately $15.9 million of the increase in Adjusted EBITDA, while the final stages in closure of our Italian operations improved our profitability by $5.9 million for the fiscal year ended September 30, 2016.
107
Segment Results
| |
Fiscal Years Ended September 30, |
|
||||||||
|---|---|---|---|---|---|---|---|---|---|---|
| |
2015 | 2016 | % Variance | |||||||
| |
(in thousands) |
|
||||||||
Revenues |
||||||||||
Industrial |
$ | 569,007 | $ | 604,192 | 6.2 | % | ||||
Municipal |
273,574 | 278,000 | 1.6 | % | ||||||
Products |
218,335 | 255,004 | 16.8 | % | ||||||
Other |
50 | — | N/M | |||||||
| | | | | | | | | | | |
Total Consolidated |
$ | 1,060,966 | $ | 1,137,196 | 7.2 | % | ||||
| | | | | | | | | | | |
| | | | | | | | | | | |
| | | | | | | | | | | |
Percentage of total consolidated revenues |
||||||||||
Industrial |
53.6 | % | 53.1 | % | ||||||
Municipal |
25.8 | % | 24.4 | % | ||||||
Products |
20.6 | % | 22.5 | % | ||||||
| | | | | | | | | | | |
Total Consolidated |
100 | % | 100 | % | ||||||
| | | | | | | | | | | |
| | | | | | | | | | | |
| | | | | | | | | | | |
Operating Profit |
||||||||||
Industrial |
$ | 86,316 | $ | 91,396 | 5.9 | % | ||||
Municipal |
22,141 | 31,287 | 41.3 | % | ||||||
Products |
37,528 | 48,712 | 29.8 | % | ||||||
Corporate |
(150,071 | ) | (134,240 | ) | (10.5 | )% | ||||
| | | | | | | | | | | |
Total Consolidated |
$ | (4,086 | ) | $ | 37,155 | N/M | ||||
| | | | | | | | | | | |
| | | | | | | | | | | |
| | | | | | | | | | | |
Operating profit as a percentage of total consolidated revenues |
||||||||||
Industrial |
8.1 | % | 8.0 | % | ||||||
Municipal |
2.1 | % | 2.8 | % | ||||||
Products |
3.5 | % | 4.3 | % | ||||||
Corporate |
(14.1 | )% | (11.8 | )% | ||||||
| | | | | | | | | | | |
Total Consolidated |
(0.4 | )% | 3.3 | % | ||||||
| | | | | | | | | | | |
| | | | | | | | | | | |
| | | | | | | | | | | |
EBITDA |
||||||||||
Industrial |
$ | 116,883 | $ | 129,662 | 10.9 | % | ||||
Municipal |
29,797 | 39,434 | 32.3 | % | ||||||
Products |
39,223 | 55,099 | 40.5 | % | ||||||
Corporate and unallocated costs |
(131,850 | ) | (117,751 | ) | (10.7 | )% | ||||
| | | | | | | | | | | |
Total Consolidated |
$ | 54,053 | $ | 106,444 | 96.9 | % | ||||
| | | | | | | | | | | |
| | | | | | | | | | | |
| | | | | | | | | | | |
EBITDA as a percentage of total consolidated revenues |
||||||||||
Industrial |
11.0 | % | 11.4 | % | ||||||
Municipal |
2.8 | % | 3.5 | % | ||||||
Products |
3.7 | % | 4.8 | % | ||||||
Corporate and unallocated costs |
(12.4 | )% | (10.4 | )% | ||||||
| | | | | | | | | | | |
Total Consolidated |
5.1 | % | 9.4 | % | ||||||
| | | | | | | | | | | |
| | | | | | | | | | | |
| | | | | | | | | | | |
N/M—Not meaningful
108
EBITDA on a segment basis is defined as earnings before interest, taxes, depreciation and amortization. The following is a reconciliation of our segment operating profit to EBITDA on a segment basis:
| |
Fiscal Years Ended September 30, | ||||||||||||||||||
|---|---|---|---|---|---|---|---|---|---|---|---|---|---|---|---|---|---|---|---|
| |
2015 | 2016 | |||||||||||||||||
| |
Industrial | Municipal | Products | Industrial | Municipal | Products | |||||||||||||
| |
(in thousands) |
||||||||||||||||||
Operating Profit |
$ | 86,316 | $ | 22,141 | $ | 37,528 | $ | 91,396 | $ | 31,287 | $ | 48,712 | |||||||
Interest expense(1) |
— | — | — | — | — | — | |||||||||||||
Income tax expense (benefit)(1) |
— | — | — | — | — | — | |||||||||||||
Depreciation and amortization |
30,567 | 7,656 | 1,695 | 38,266 | 8,147 | 6,387 | |||||||||||||
| | | | | | | | | | | | | | | | | | | | |
EBITDA |
$ | 116,883 | $ | 29,797 | $ | 39,223 | $ | 129,662 | $ | 39,434 | $ | 55,099 | |||||||
| | | | | | | | | | | | | | | | | | | | |
| | | | | | | | | | | | | | | | | | | | |
| | | | | | | | | | | | | | | | | | | | |
- (1)
- Interest expense and Income tax expense (benefit) are corporate activities that are not allocated to our three reportable segments.
Industrial
Revenues in the Industrial Segment increased $35.2 million, or 6.2%, to $604.2 million in the fiscal year ended September 30, 2016 from $569.0 million in the fiscal year ended September 30, 2015. The increase in revenues was primarily due to the execution of an additional $17.3 million of capital project orders compared to the prior fiscal year in the power, pulp and paper end markets. Service and capital system revenues increased in power and hydrocarbon and chemical processing end markets by $6.4 million, driven by penetration into new and existing accounts. In addition the consolidation of TWO drove a net increase in revenue of $11.6 million. This increase was partially offset by a decline in aftermarket revenue.
Operating profit in the Industrial Segment increased $5.1 million, or 5.9%, to $91.4 million in the fiscal year ended September 30, 2016 from $86.3 million in the fiscal year ended September 30, 2015. The increase in operating profit was primarily due to increased volume of $5.8 million. Additionally, as part of the Value Creator program we initiated ePro activities, which resulted in a reduction to costs of $1.8 million and operational improvements in supply chain that resulted in reduced warranty expense and liabilities of $1.6 million. These benefits were partially offset by unfavorable product mix of $4.3 million driven by large capital revenue that carries lower margins.
EBITDA in the Industrial Segment increased $12.8 million, or 10.9%, to $129.7 million in the fiscal year ended September 30, 2016 from $116.9 million in the fiscal year ended September 30, 2015. The increase in EBITDA was primarily a result of the same factors which impacted operating profit in the Industrial Segment during this period. In addition, our ePro initiatives included a program to optimize fleet vehicles. This program resulted in a reduction to the fleet size, upgrades to vehicles to improve service technician productivity and conversion of the relevant contract from an operating lease to a capital lease resulting in a total increase to EBITDA of $6.8 million. These benefits were partially offset by the same factors affecting operating profit during this period.
Municipal
Revenues in the Municipal Segment increased $4.4 million, or 1.6%, to $278.0 million in the fiscal year ended September 30, 2016 from $273.6 million in the fiscal year ended September 30, 2015. The increase in revenues was primarily due to volume sold in both our service business, through geographical expansion and new product rollouts delivering $6.6 million increase from the prior year, and growth in aftermarket $6.4 million. This is offsetting a decline of $4.5 million in capital due project
109
timing. This revenue growth was also partially offset by a decline of $4.1 million in revenues due to the final stages in closure of our Italian operations.
Operating profit in the Municipal Segment increased $9.2 million, or 41.3%, to $31.3 million in the fiscal year ended September 30, 2016 from $22.1 million in the fiscal year ended September 30, 2015. The increase in operating profit excluding Italy was primarily due to $2.6 million from volume, and the implementation of the Value Creator program, which delivered efficiencies in order execution and $2.8 million savings in ePro. The final stages in closure of our Italian operations improved our operating profit by $5.9 million, while operational efficiencies in both project execution and ePro noted above, and continued alignment to a more customer focused organizational structure favorably drove the results by $2.1 million. This increase was partially offset by sales investments.
EBITDA in the Municipal Segment increased $9.6 million, or 32.3%, to $39.4 million in the fiscal year ended September 30, 2016 from $29.8 million in the fiscal year ended September 30, 2015. EBITDA increased because of the same factors that affected operating profit in the Municipal Segment during this period, with the addition of our fleet optimization as part of our Value Creator program, converting it from an operating lease to a capital lease driving an increase of approximately $0.8 million in EBITDA.
Products
Revenues in the Products Segment increased $36.7 million, or 16.8%, to $255.0 million in the fiscal year ended September 30, 2016 from $218.3 million in the fiscal year ended September 30, 2015. The increase was primarily due to the acquisitions of Neptune-Benson, VAF, Delta UV and Magneto which accounted for $42.9 million of additional revenues. The increase was partially offset by delays in the marine and power product retrofit markets which experienced a decrease in product revenues of $14.0 million. Revenues for highly purified water in the microelectronics and power markets increased by $7.8 million with the establishment of a new legal entity and sales presence in China.
Operating profit in the Products Segment increased $11.2 million, or 29.8%, to $48.7 million in the fiscal year ended September 30, 2016 from $37.5 million in the fiscal year ended September 30, 2015. The increase in operating profit was primarily due to the Neptune-Benson, VAF, Delta UV and Magneto acquisitions. The declines in operating profit in the electrochlorination, dewatering and intake product lines were offset by increases in the IonPure product line with our expansion in China.
EBITDA in the Products Segment increased $15.9 million, or 40.5%, to $55.1 million in the fiscal year ended September 30, 2016 from $39.2 million in the fiscal year ended September 30, 2015. The increase in EBITDA was primarily due to the Neptune-Benson, VAF, Delta UV and Magneto acquisitions.
110
Fiscal Year Ended September 30, 2015, Successor Period 2014 and Predecessor Period 2014
| |
Predecessor |
|
Successor | |||||||||
|---|---|---|---|---|---|---|---|---|---|---|---|---|
| |
October 1, 2013 Through January 15, 2014 |
|
January 16, 2014 Through September 30, 2014 |
|
||||||||
| |
|
Fiscal Year Ended September 30, 2015 |
||||||||||
| |
|
|||||||||||
| |
|
|||||||||||
| |
|
|||||||||||
| |
(in thousands) |
|||||||||||
Revenue from product sales and services |
$ | 306,314 | $ | 791,154 | $ | 1,060,966 | ||||||
Cost of product sales and services |
(228,227 | ) | (700,245 | ) | (768,549 | ) | ||||||
| | | | | | | | | | | | | |
Gross profit |
78,087 | 90,909 | 292,417 | |||||||||
Research and development expense |
(6,728 | ) | (18,829 | ) | (25,909 | ) | ||||||
Sales and marketing expense |
(38,479 | ) | (90,947 | ) | (124,429 | ) | ||||||
General and administrative expense |
(35,652 | ) | (104,122 | ) | (147,663 | ) | ||||||
Other operating (expense) income, net |
(1,198 | ) | (522 | ) | 74 | |||||||
Interest expense |
(23 | ) | (23,994 | ) | (34,060 | ) | ||||||
Equity income of a non-consolidated affiliate |
518 | 1,283 | 1,424 | |||||||||
| | | | | | | | | | | | | |
Loss before income taxes |
(3,475 | ) | (146,222 | ) | (38,146 | ) | ||||||
Income tax benefit (expense) |
1,173 | 48,465 | (47,905 | ) | ||||||||
| | | | | | | | | | | | | |
Net income (loss) |
$ | (2,302 | ) | $ | (97,757 | ) | $ | (86,051 | ) | |||
| | | | | | | | | | | | | |
| | | | | | | | | | | | | |
| | | | | | | | | | | | | |
Other financial data: |
||||||||||||
Adjusted EBITDA(1) |
$ | 11,482 | $ | 105,710 | $ | 119,911 | ||||||
- (1)
- For the definition of Adjusted EBITDA and a reconciliation to net income (loss), its most directly comparable financial measure presented in accordance with GAAP, see footnote 2 under the heading "Prospectus Summary—Summary Consolidated Financial and Operating Data."
Consolidated Results
Revenues—Revenues were $1,061.0 million in the fiscal year ended September 30, 2015. Revenues during the Successor Period 2014 and the Predecessor Period 2014 were $791.2 million and $306.3 million, respectively, for a combined $1,097.5 million.
The following table delineates the change in revenues from product sales and revenues from services, respectively:
| |
Predecessor | Successor | |
|
|
|
|
|||||||||||||||
|---|---|---|---|---|---|---|---|---|---|---|---|---|---|---|---|---|---|---|---|---|---|---|
| |
October 1, 2013 through January 15, 2014 |
January 16, 2014 through September 30, 2014 |
|
|
September 30, 2015 | |
||||||||||||||||
| |
Combined Revenues |
Combined % of Revenues |
|
% of Revenues |
% Variance |
|||||||||||||||||
Revenue from product sales |
$ | 169.1 | $ | 414.9 | $ | 584.0 | 53.2 | % | $ | 533.7 | 50.3 | % | (8.6 | )% | ||||||||
Revenue from services |
137.2 | 376.3 | 513.5 | 46.8 | % | 527.3 | 49.7 | % | 2.7 | % | ||||||||||||
| | | | | | | | | | | | | | | | | | | | | | | |
|
$ | 306.3 | $ | 791.2 | $ | 1,097.5 | 100.0 | % | $ | 1,061.0 | 100.0 | % | ||||||||||
| | | | | | | | | | | | | | | | | | | | | | | |
| | | | | | | | | | | | | | | | | | | | | | | |
| | | | | | | | | | | | | | | | | | | | | | | |
Revenues from product sales decreased $50.3 million, or 8.6%, to $533.7 million in the fiscal year ended September 30, 2015 from $169.1 million and $414.9 million for the Predecessor and Successor periods, respectively, or $584.0 million for the combined Predecessor and Successor periods in the fiscal year ended September 30, 2014. Our fiscal 2015 performance in product revenues was impacted by the timing of large capital project orders in the microelectronics and power markets, which experienced a decline of approximately $43.8 million year over year. Product sales associated with the hydrocarbon and marine markets also declined by approximately $10.1 million, along with an impact of approximately $10 million associated with weakening foreign currencies associated with the product
111
operations in Europe and Asia. This overall decline in product revenues was offset somewhat by increases in aftermarket product sales in both the Industrial and Municipal Segments of approximately $13.8 million.
Revenue from services increased $13.8 million, or 2.7%, to $527.3 million in the fiscal year ended September 30, 2015 from $137.2 million and $376.3 million for the Predecessor and Successor periods, respectively, or $513.5 million for the combined Predecessor and Successor periods in the fiscal year ended September 30, 2014. Growth in service revenues was driven primarily by $6.1 million additional volume within the Industrial Segment and $6.1 million additional volume in the Municipal Segment.
Cost of Sales and Gross Margin—Total gross margin increased to 27.6% in the fiscal year ended September 30, 2015 from 15.4% for the combined Predecessor and Successor periods in the fiscal year ended September 30, 2014.
The following table provides the change in cost of product sales and cost of services, respectively, along with related gross margins:
| |
Predecessor | Successor | |
|
|
|
|||||||||||||
|---|---|---|---|---|---|---|---|---|---|---|---|---|---|---|---|---|---|---|---|
| |
October 1, 2013 through January 15, 2014 |
January 16, 2014 through September 30, 2014 |
|
|
September 30, 2015 | ||||||||||||||
| |
Combined Cost of Sales |
Combined Gross Margin % |
|
Gross Margin % |
|||||||||||||||
Cost of product sales |
$ | 124.8 | $ | 366.1 | $ | 490.9 | 15.9 | % | $ | 385.2 | 27.8 | % | |||||||
Cost of services |
103.4 | 334.1 | 437.5 | 14.8 | % | 383.3 | 27.3 | % | |||||||||||
| | | | | | | | | | | | | | | | | | | | |
|
$ | 228.2 | $ | 700.2 | $ | 928.4 | 15.4 | % | $ | 768.5 | 27.6 | % | |||||||
| | | | | | | | | | | | | | | | | | | | |
| | | | | | | | | | | | | | | | | | | | |
| | | | | | | | | | | | | | | | | | | | |
Cost of product sales decreased by approximately $105.7 million to $385.2 million in the fiscal year ended September 30, 2015 as compared to $124.8 million and $366.1 million in the Predecessor and Successor periods, respectively, or $490.9 million for the combined. Predecessor and Successor periods in the fiscal year ended September 30, 2014. The cost of product sales in the combined periods of the Successor Period 2014 and Predecessor Period 2014 were impacted by the amortization expensing of the step up in inventory for approximately $18.3 million and amortization of the step up in project backlog of approximately $43.7 million related to the AEA Acquisition in the Successor Period 2014. Additionally, the step up in fixed assets from Successor Period 2014 to fiscal 2015 associated with the AEA Acquisition drove approximately $5.1 million in additional depreciation expense. Cost of product sales in the combined periods ended September 30, 2014 were also impacted by $6.1 million for the recognition of warranty provisions for specific product issues. The remaining decline in cost of sales from fiscal 2015 as compared to the Successor Period 2014 and Predecessor Period 2014 was related to the overall decline in volume in product revenues noted above, which drove a corresponding decrease in cost of sales of approximately $37.6 million.
Cost of services decreased by approximately $54.2 million in the year ended September 30, 2015 to $383.3 million as compared to $103.4 million and $334.1 million in the Predecessor and Successor periods, respectively, or $437.5 million for the combined Predecessor and Successor periods in the fiscal year ended September 30, 2014. Cost of services in the combined periods ended 2014 was impacted by various purchase accounting items including the amortization of the step-up in project backlog of approximately $43.7 million in the Successor Period and accelerated depreciation of certain fixed assets of approximately $5.1 million related to the AEA Acquisition in the Successor Period 2014.
Operating Expenses—Operating expenses were $298.0 million in the fiscal year ended September 30, 2015. Operating expenses for the Successor Period 2014 and the Predecessor Period
112
2014 were $213.9 million and $80.9 million, respectively, for a combined total of $294.8 million. A discussion of operating expenses by category is as follows:
Research and Development Expense—Research and development expenses were $25.9 million in the fiscal year ended September 30, 2015. Research and development expenses during the Successor Period 2014 and the Predecessor Period 2014 were $18.8 million and $6.7 million, respectively, for a combined $25.5 million. There were no significant changes during this period other than normal currency fluctuations and inflation explaining the increase in research and development expenses of $0.4 million.
Sales and Marketing Expense—Sales and marketing expenses were $124.4 million in the fiscal year ended September 30, 2015. Sales and marketing expenses during the Successor Period 2014 and the Predecessor Period 2014 were $90.9 million and $38.5 million, respectively, for a combined $129.4 million. The decrease in sales and marketing expenses is attributable to cost savings associated with restructure and reorganization.
General and Administrative Expense—General and administrative expenses were $147.7 million in the fiscal year ended September 30, 2015. General and administrative expenses during the Successor Period 2014 and the Predecessor Period 2014 were $104.1 million and $35.7 million, respectively, for a combined $139.8 million. The increase in general and administrative expenses was principally attributable to increased costs of restructure and reorganization.
Other Operating (Expense) Income, Net—Other operating income was $0.1 million in the fiscal year ended September 30, 2015. Other operating expense for the Successor Period 2014 and the Predecessor Period 2014 was $0.5 million and $1.2 million, respectively, for a combined total of $1.7 million. Our performance in other operating income was primarily impacted by the gain on disposal of fixed assets.
Interest Expense—Interest expenses were $34.1 million in the fiscal year ended September 30, 2015. Interest expenses during the Successor Period 2014 and the Predecessor Period 2014 were $24.0 million and $0.0 million, respectively for a combined $24.0 million. The increase in interest expense is explained by our senior secured credit facility being in place for a full year in fiscal 2015 as compared to only 8.5 months in the Successor Period 2014. The senior secured credit facility was not in place during the Predecessor Period 2014.
Income Tax Benefit (Expense)—Income tax expense was $47.9 million in the fiscal year ended September 30, 2015. Income tax benefit for the Successor Period 2014 and the Predecessor Period 2014 was $48.5 million and $1.2 million, respectively. The effective tax rate in the fiscal year ended September 30, 2015 was (125.6)%. We experienced an increase in income tax expense and effective tax rate in the fiscal year ended September 30, 2015 primarily due to the establishment of valuation reserves of $63.5 million against our net deferred tax assets.
Net Loss—Net loss was $86.1 million for the fiscal year ended September 30, 2015. Net loss during the Successor Period 2014 and the Predecessor Period 2014 were a loss of $97.8 million and $2.3 million, respectively, for a combined loss of $100.1 million. The improvement in net loss in fiscal 2015 as compared to the prior periods was primarily related to the significant charges incurred in the Successor period related to the AEA Acquisition, including $18.3 million in amortization of inventory step-up, amortization of $87.4 million in project backlog intangible and an additional $10.1 million in fixed asset depreciation, which combined for total charges of approximately $115.8 million. These charges did not reoccur for the fiscal year ended September 30, 2016. However, we recognized an income tax charge for establishment of valuation reserves against our net deferred tax assets of $63.5 million, which drove overall income tax expense of $47.9 million for the year ended September 30, 2015 as compared to a combined income tax benefit of $49.7 million for the Successor and Predecessor periods. The impact of these activities were the primary drivers of the overall change in net loss period over period.
113
Adjusted EBITDA—Adjusted EBITDA was $119.9 million for the fiscal year ended September 30, 2015. Adjusted EBITDA during the Successor Period 2014 and the Predecessor Period 2014 were $105.7 million and $11.5 million, respectively, for a combined $117.2 million. The increase in Adjusted EBITDA in fiscal 2015 as compared to the prior periods was primarily related to cost reductions in connection with restructuring activities that were implemented in the prior period, offset by the adverse impact of decreased capital projects volume discussed above.
Segment Results
| |
Predecessor | |
Successor | |||||||||
|---|---|---|---|---|---|---|---|---|---|---|---|---|
| |
October 1, 2013 Through January 15, 2014 |
|
January 16, 2014 Through September 30, 2014 |
Fiscal Year Ended September 30, 2015 |
||||||||
| |
(in thousands) |
|||||||||||
Revenues |
||||||||||||
Industrial |
$ | 167,205 | $ | 430,514 | $ | 569,007 | ||||||
Municipal |
70,982 | 187,252 | 273,574 | |||||||||
Products |
60,330 | 167,838 | 218,335 | |||||||||
Other |
7,797 | 5,550 | 50 | |||||||||
| | | | | | | | | | | | | |
Total Consolidated |
$ | 306,314 | $ | 791,154 | $ | 1,060,966 | ||||||
| | | | | | | | | | | | | |
| | | | | | | | | | | | | |
| | | | | | | | | | | | | |
Percentage of total consolidated revenues |
||||||||||||
Industrial |
54.6 | % | 54.4 | % | 53.6 | % | ||||||
Municipal |
23.2 | % | 23.7 | % | 25.8 | % | ||||||
Products |
19.7 | % | 21.2 | % | 20.6 | % | ||||||
Other |
2.5 | % | 0.7 | % | 0.0 | % | ||||||
| | | | | | | | | | | | | |
Total Consolidated |
100 | % | 100 | % | 100 | % | ||||||
| | | | | | | | | | | | | |
| | | | | | | | | | | | | |
| | | | | | | | | | | | | |
Operating Profit |
||||||||||||
Industrial |
$ | 50,131 | $ | 48,798 | $ | 86,316 | ||||||
Municipal |
(4,680 | ) | 4,441 | 22,141 | ||||||||
Products |
15,248 | 24,920 | 37,528 | |||||||||
Corporate |
(64,151 | ) | (200,387 | ) | (150,071 | ) | ||||||
| | | | | | | | | | | | | |
Total Consolidated |
$ | (3,452 | ) | $ | (122,228 | ) | $ | (4,086 | ) | |||
| | | | | | | | | | | | | |
| | | | | | | | | | | | | |
| | | | | | | | | | | | | |
Operating profit as a percentage of total consolidated revenues |
||||||||||||
Industrial |
16.4 | % | 6.2 | % | 8.1 | % | ||||||
Municipal |
(1.5 | )% | 0.6 | % | 2.1 | % | ||||||
Products |
5.0 | % | 3.1 | % | 3.5 | % | ||||||
Corporate |
(20.9 | )% | (25.3 | )% | (14.1 | )% | ||||||
| | | | | | | | | | | | | |
Total Consolidated |
(1.1 | )% | (15.4 | )% | (0.4 | )% | ||||||
| | | | | | | | | | | | | |
| | | | | | | | | | | | | |
| | | | | | | | | | | | | |
EBITDA |
||||||||||||
Industrial |
$ | 56,112 | $ | 73,316 | $ | 116,883 | ||||||
Municipal |
(2,247 | ) | 21,347 | 29,797 | ||||||||
Products |
15,600 | 26,500 | 39,223 | |||||||||
Corporate and unallocated costs |
(57,983 | ) | (103,458 | ) | (131,850 | ) | ||||||
| | | | | | | | | | | | | |
Total Consolidated |
$ | 11,482 | $ | 17,705 | $ | 54,053 | ||||||
| | | | | | | | | | | | | |
| | | | | | | | | | | | | |
| | | | | | | | | | | | | |
EBITDA as a percentage of total consolidated revenues |
||||||||||||
Industrial |
18.3 | % | 9.3 | % | 11.0 | % | ||||||
Municipal |
(0.7 | )% | 2.7 | % | 2.8 | % | ||||||
Products |
5.1 | % | 3.3 | % | 3.7 | % | ||||||
Corporate and unallocated costs |
(18.9 | )% | (13.1 | )% | (12.4 | )% | ||||||
| | | | | | | | | | | | | |
Total Consolidated |
3.7 | % | 2.2 | % | 5.1 | % | ||||||
| | | | | | | | | | | | | |
| | | | | | | | | | | | | |
| | | | | | | | | | | | | |
114
EBITDA on a segment basis is defined as earnings before interest, taxes, depreciation and amortization. The following is a reconciliation of our segment operating profit to EBITDA on a segment basis:
| |
Predecessor | |
Successor | |||||||||||||||||||||||||||
|---|---|---|---|---|---|---|---|---|---|---|---|---|---|---|---|---|---|---|---|---|---|---|---|---|---|---|---|---|---|---|
| |
October 1, 2013 Through January 15, 2014 |
|
January 16, 2014 Through September 30, 2014 |
Fiscal Year Ended September 30, 2015 |
||||||||||||||||||||||||||
| |
Industrial | Municipal | Products |
|
Industrial | Municipal | Products | Industrial | Municipal | Products | ||||||||||||||||||||
| |
|
|||||||||||||||||||||||||||||
| |
(in thousands) |
|
||||||||||||||||||||||||||||
Operating Profit (Loss) |
$ | 50,131 | $ | (4,680 | ) | $ | 15,248 | $ | 48,798 | $ | 4,441 | $ | 24,920 | $ | 86,316 | $ | 22,141 | $ | 37,528 | |||||||||||
Interest expense(1) |
— | — | — | — | — | — | — | — | — | |||||||||||||||||||||
Income tax expense (benefit)(1) |
— | — | — | — | — | — | — | — | — | |||||||||||||||||||||
Depreciation and amortization |
5,981 | 2,433 | 352 | 24,518 | 16,906 | 1,580 | 30,567 | 7,656 | 1,695 | |||||||||||||||||||||
| | | | | | | | | | | | | | | | | | | | | | | | | | | | | | | |
EBITDA |
$ | 56,112 | $ | (2,247 | ) | $ | 15,600 | $ | 73,316 | $ | 21,347 | $ | 26,500 | $ | 116,883 | $ | 29,797 | $ | 39,223 | |||||||||||
| | | | | | | | | | | | | | | | | | | | | | | | | | | | | | | |
| | | | | | | | | | | | | | | | | | | | | | | | | | | | | | | |
| | | | | | | | | | | | | | | | | | | | | | | | | | | | | | | |
- (1)
- Interest expense and income tax expense (benefit) are corporate activities that are not allocated to our three reportable segments.
Industrial
Revenues in the Industrial Segment were $569.0 million in the fiscal year ended September 30, 2015. Revenues in the Industrial Segment for the Successor Period 2014 and the Predecessor Period 2014 were $430.5 million and $167.2 million, respectively. Revenues in fiscal 2015 were adversely impacted by the timing of large capital project orders primarily in the microelectronics and power markets. This resulted in a decline in revenue of $43.8 million from fiscal 2014 to fiscal 2015. This decline was partially offset by an increase in service and aftermarket revenue across all end markets of $6.1 million and $7.7 million respectively.
Operating profit in the Industrial Segment was $86.3 million in the fiscal year ended September 30, 2015. Operating profit in the Industrial Segment for the Successor Period 2014 and the Predecessor Period 2014 was $48.8 million and $50.1 million, respectively. Operating profit in fiscal 2015 was adversely impacted by large capital revenue volume of $16.7 million. This decline was which was partially offset by operational efficiencies and increased service and aftermarket revenue volume of $4.2 million.
EBITDA in the Industrial Segment was $116.9 million in the fiscal year ended September 30, 2015. EBITDA in the Industrial Segment for the Successor Period 2014 and the Predecessor Period 2014 was $73.3 million and $56.1 million, respectively. EBITDA in fiscal 2015 was adversely impacted by the same factors which impacted operating profit during this period.
Municipal
Revenues in the Municipal Segment were $273.6 million in the fiscal year ended September 30, 2015. Revenues in the Municipal Segment for the Successor Period 2014 and the Predecessor Period 2014 were $187.3 million and $71.0 million, respectively. The increase in revenues was primarily due to volume sold in MEMCOR aftermarket of $6.1 million driven by large aftermarket orders in the United Kingdom, and the reorganization and combination of our aftermarket with our capital sales organization. This was partially offset by the initial stages of closing our operations in Italy.
Operating profit in the Municipal Segment was $22.1 million in the fiscal year ended September 30, 2015. Operating profit in the Municipal Segment for the Successor Period 2014 and the Predecessor Period 2014 was $4.4 million and loss of $4.7 million, respectively. The increase in operating profit excluding Italy was primarily due to $3.1 million from volume and operational improvement initiatives delivering approximately $2.8 million in savings. This increase was partially offset by investment in sales resources.
115
EBITDA in the Municipal Segment was $29.8 million in the fiscal year ended September 30, 2015. EBITDA in the Municipal Segment for the Successor Period 2014 and the Predecessor Period 2014 was $21.3 million and a loss of $2.2 million, respectively. EBITDA increased because of the same factors that affected operating profit in the Municipal Segment during this period.
Products
Revenues in the Products Segment were $218.3 million in the fiscal year ended September 30, 2015. Revenues in the Products Segment for the Successor Period 2014 and the Predecessor Period 2014 were $167.8 million and $60.3 million, respectively. The decrease in revenues in the Products Segment in fiscal 2015 was affected by the timing of capital project orders in the hydrocarbon and marine markets and weakening foreign currencies impacting the product operations in the Europe and Asia. The impacts to revenues in these markets was partially offset by revenue increases in the microelectronic market in Asia.
Operating profit in the Products Segment was $37.5 million in the fiscal year ended September 30, 2015. Operating profit in the Products Segment for the Successor Period 2014 and the Predecessor Period 2014 was $24.9 million and $15.2 million, respectively. Operating profit in fiscal 2015 was adversely impacted by delays in our capital projects, weakening foreign currencies and investments being made in additional sales resources for the Products Segment, which was partially offset by a reduction in operating expense for back-office functions.
EBITDA in the Products Segment was $39.2 million in the fiscal year ended September 30, 2015. EBITDA in the Products Segment for the Successor Period 2014 and the Predecessor Period 2014 was $26.5 million and $15.6 million, respectively. EBITDA in fiscal 2015 was adversely impacted by the capital projects and currency impacts that affected our operating profit in the same period, partially offset by cost reductions related to operational improvement initiatives.
Liquidity and Capital Resources
Liquidity describes the ability of a company to generate sufficient cash flows to meet the cash requirements of its business operations, including working capital needs, debt service, acquisitions, other commitments and contractual obligations. We consider liquidity in terms of cash flows from operations and their sufficiency to fund our operating and investing activities.
Our principal sources of liquidity are our cash generated by operating activities and borrowings under our Revolving Credit Facility. Historically, we have financed our operations primarily from cash generated from operations and periodic borrowings under our Revolving Credit Facility. Our primary cash needs are for day to day operations, to pay interest and principal on our indebtedness, to fund working capital requirements and to make capital expenditures.
We expect to continue to finance our liquidity requirements through internally generated funds, the proceeds of this offering and borrowings under our Revolving Credit Facility. We believe that our projected cash flows generated from operations, together with a portion of the proceeds of this offering and borrowings under our Revolving Credit Facility are sufficient to fund our principal debt payments, interest expense, our working capital needs and our expected capital expenditures for the next twelve months. We currently anticipate incurring between $55 million and $60 million of capital expenditures during fiscal 2017. However, our budgeted capital expenditures can vary from period to period based on the nature of capital intensive project awards. We may draw on our Revolving Credit Facility from time to time to fund or partially fund an acquisition.
In connection with the AEA Acquisition, we entered into the Senior Secured Credit Facilities, which originally consisted of (a) a seven-year $505.0 million senior secured first lien term loan facility,
116
scheduled to mature on January 15, 2021 and a $75.0 million senior secured revolving credit facility, scheduled to mature on January 15, 2019 and (b) a seven-year $75.0 million senior secured second lien term loan facility, scheduled to mature on January 15, 2022 (which is no longer outstanding). On April 15, 2016, we entered into an amendment to the First Lien Credit Agreement, to borrow an additional $185.0 million of term loans under the Term Loan Facility to fund a portion of the consideration for the Neptune-Benson Acquisition. On October 28, 2016, we entered into the October 2016 Refinancing to (i) borrow an additional $150.0 million of term loans under the Term Loan Facility to fund our repayment in full of the Second Lien Facility and revolving credit loans then outstanding and (ii) increase commitments under the Revolving Credit Facility by $20.0 million to a total of $95.0 million. On August 8, 2017, we entered into the August 2017 Refinancing pursuant to which we (i) borrowed approximately $262.7 million in refinancing term loans, the net proceeds of which were used to refinance in their entirety the NB Incremental Loans and (ii) increased the amount of our existing Term Loan Facility by borrowing $80.0 million of incremental term loans under the Term Loan Facility, the net proceeds of which were used to repay $60.0 million of revolving credit loans then outstanding under the Revolving Credit Facility and to pay related fees and expenses, and for other general corporate purposes (including permitted acquisitions and permitted investments pursuant to the First Lien Credit Agreement). Our Senior Secured Credit Facilities also include an uncommitted incremental facility, which, subject to certain conditions, provides for additional term loans and/or revolving loans in an aggregate amount that does not cause our first lien net leverage ratio to exceed 4.50 to 1.00 (calculated as the ratio of consolidated funded first lien debt for borrowed money (net of unrestricted cash and cash equivalents) to trailing four-quarter Consolidated EBITDA (as defined therein), plus an additional $100 million (excluding incremental revolving credit loans or increases in revolving credit commitments not exceeding $30.0 million) (all of which remained available as of June 30, 2017).
As of June 30, 2017, we had total indebtedness of $893.2 million, including $818.7 million of borrowings under the Term Loan Facility, $60.0 million in borrowings under the Revolving Credit Facility and $7.5 million of letters of credit issued under the Revolving Credit Facility, with $27.5 million in additional borrowing capacity thereunder. An additional $8.4 million of letters of credit were issued under a separate uncommitted facility as of June 30, 2017.
The Senior Secured Credit Facilities contain a number of covenants imposing certain restrictions on our business. These restrictions may affect our ability to operate our business and may limit our ability to take advantage of potential business opportunities as they arise. The restrictions these covenants place on our business operations, include limitations on our or our subsidiaries' ability to:
- •
- incur or guarantee additional indebtedness;
- •
- make certain investments;
- •
- pay dividends or make distributions on our capital stock;
- •
- sell assets, including capital stock of restricted subsidiaries;
- •
- agree to payment restrictions affecting our restricted subsidiaries;
- •
- consolidate, merge, sell or otherwise dispose of all or substantially all of our assets;
- •
- enter into transactions with our affiliates;
- •
- incur liens; or
- •
- designate any of our subsidiaries as unrestricted subsidiaries.
117
Evoqua Water Technologies Corp. is a holding company that does not conduct any business operations of its own. As a result, our ability to pay cash dividends on our common stock, if any, is dependent upon cash dividends and distributions and other transfers from our operating subsidiaries. Under the terms of our Senior Secured Credit Facilities, our operating subsidiaries are currently limited in their ability to pay cash dividends to Evoqua Water Technologies Corp., and we expect these limitations to continue in the future under the terms of any future credit agreement or any future debt or preferred equity securities of ours or of our subsidiaries.
In addition, our Revolving Credit Facility, but not the Term Loans, contains a financial covenant which requires us to comply with the maximum first lien net leverage ratio of 5.55 to 1.00 as of the last day of any quarter on which the aggregate amount of revolving loans and letters of credit outstanding under the Revolving Credit Facility (net of cash collateralized letters of credit and undrawn outstanding letters of credit in an amount of up to 50% of the Revolving Credit Facility) exceeds 25% of the total commitments thereunder.
As of September 30, 2016 and June 30, 2017, we were in compliance with the covenants contained in the Senior Secured Credit Facilities.
Our indebtedness could adversely affect our ability to raise additional capital, limit our ability to react to changes in the economy or our industry, expose us to interest rate risk and prevent us from meeting our obligations. See "Risk Factors—Risks Relating to Our Indebtedness—Our substantial indebtedness could adversely affect our financial condition and limit our ability to raise additional capital to fund our operations."
Cash Flows
The following table summarizes the changes to our cash flows for the periods presented:
| |
|
|
Successor | ||||||||||||||||||
|---|---|---|---|---|---|---|---|---|---|---|---|---|---|---|---|---|---|---|---|---|---|
| |
Predecessor |
|
|||||||||||||||||||
| |
|
|
Years Ended September 30, |
Nine Months Ended June 30, |
|||||||||||||||||
| |
October 1, 2013 Through January 15, 2014 |
|
January 16, 2014 Through September 30, 2014 |
||||||||||||||||||
| |
|
||||||||||||||||||||
| |
|
2015 | 2016 | 2016 | 2017 | ||||||||||||||||
| |
|
||||||||||||||||||||
| |
(in thousands) |
|
|||||||||||||||||||
| |
|
|
|
|
|
(unaudited) |
|||||||||||||||
Statement of Cash Flows Data |
|||||||||||||||||||||
Net cash provided by (used in) operating activities |
$ | 45,577 | $ | 37,478 | $ | 41,944 | $ | 31,919 | $ | 10,655 | $ | 15,793 | |||||||||
Net cash provided by (used in) investing activities |
(7,524 | ) | (762,087 | ) | (46,866 | ) | (344,610 | ) | (331,227 | ) | (117,266 | ) | |||||||||
Net cash provided by (used in) financing activities |
89,901 | 911,444 | (6,263 | ) | 191,389 | 199,067 | 104,449 | ||||||||||||||
Effect of exchange rate changes on cash |
(243 | ) | (1,399 | ) | (5,225 | ) | 2,637 | 369 | 680 | ||||||||||||
| | | | | | | | | | | | | | | | | | | | | | |
Change in cash and cash equivalents |
$ | 127,711 | $ | 185,436 | $ | (16,410 | ) | $ | (118,665 | ) | $ | (121,136 | ) | $ | 3,656 | ||||||
| | | | | | | | | | | | | | | | | | | | | | |
| | | | | | | | | | | | | | | | | | | | | | |
| | | | | | | | | | | | | | | | | | | | | | |
118
Operating Activities
Cash flows from operating activities can fluctuate significantly from period-to-period as working capital needs and the timing of payments for restructuring activities and other items impact reported cash flows.
Net cash provided by operating activities increased to $15.8 million in the nine months ended June 30, 2017 from $10.7 million in the nine months ended June 30, 2016.
- •
- Operating cash flows in the nine months ended June 30, 2017 reflect a decrease in net income of $19.4 million as compared to the
comparable period in 2016 and increased non-cash charges of $28.5 million primarily relating to deferred taxes and increased depreciation and amortization. The increased deferred tax impacts
relate to increases in valuation allowances as compared to the nine months ended June 30, 2016 driven by realizing tax expense in a jurisdiction that excludes certain items from the valuation
allowance analysis. The increased depreciation and amortization expense primarily relates to the amortization of intangible assets acquired in connection with the AEA Acquisition in fiscal 2014 and
additional intangible assets obtained through various acquisitions completed in fiscal 2016 and fiscal 2017.
- •
- The aggregate of receivables, inventories, cost and earnings in excess of billings on uncompleted contracts, accounts payable and billings in
excess of costs incurred on uncompleted contracts used $24.1 million in operating cash flows in the nine months ended June 30, 2017 compared to $11.4 million in operating cash
flows in the comparable period in 2016. The amount of cash flow generated from or used by the above mentioned accounts depends upon how effectively we manage our cash conversion cycle, which is a
representation of the number of days that elapse from the date of purchase of raw materials and components to the collection of cash from customers. Our cash conversion cycle can be significantly
impacted by the timing of collections and payments in a period. Further, as it relates to capital projects, fiscal 2016 represented a continued rebuilding of the pipeline of capital projects as
compared to the period prior to the AEA Acquisition, which represented a depletion of the pipeline of capital projects. This build-up of capital project activity contributed to the variability of
accounts receivable, inventories, excess billings on uncompleted contracts or billings in excess of costs incurred on uncompleted contracts from period to period.
- •
- The aggregate of prepaid expense and other assets and other non-current assets and liabilities used $3.9 million in operating cash flows
in the nine months ended June 30, 2017 compared to $7.9 million provided in the comparable period of 2016. The use of operational cash flow in the period ended June 30, 2017 was
primarily related to the continued payments received from an outstanding lease receivable, offset by an $8.3 million increase in capital lease liabilities. The increase in capital leases of
approximately $6.6 million was the primary driver of operational cash flows in fiscal 2016.
- •
- Accrued expenses and other liabilities used $10.7 million in operating cash flows in the nine months ended June 30, 2017 compared to a use of $32.8 million in the comparable period of 2016. The use of operational cash flow in both periods resulted primarily from the timing of cash payments for various employee-related liabilities.
Net cash provided by operating activities decreased $10.0 million to $31.9 million in the fiscal year ended September 30, 2016 from $41.9 million in the fiscal year ended September 30, 2015. This decrease was primarily due to the following:
- •
- Operating cash flows in the fiscal year ended September 30, 2016 reflected an increase in net income of $99.1 million from fiscal 2015. Net income in fiscal 2016 included a benefit from the relief of the income tax valuation allowance of $15.4 million compared to establishing an income tax valuation allowance of $63.3 million in fiscal 2015. Additionally in fiscal 2016, net income
119
- •
- The aggregate of receivables, inventories, cost and earnings in excess of billings on uncompleted contracts, accounts payable and billings in
excess of costs incurred on uncompleted contracts used $14.5 million in operating cash flows in fiscal 2016 compared to $19.9 million of operating cash flows provided in fiscal 2015. The
amount of cash flow generated from or used by the above mentioned accounts depends upon how effectively we manage our cash conversion cycle, which is a representation of the number of days that elapse
from the date of purchase of raw materials and components to the collection of cash from customers. Our cash conversion cycle can be significantly impacted by the timing of collections and payments in
a period. Further, as it relates to capital projects, fiscal 2016 represented a continued rebuilding of the pipeline of capital projects as compared to the period prior to the AEA Acquisition, which
represented a depletion of the pipeline of capital projects. This build-up of capital project activity contributed to the variability of accounts receivable, inventories, excess billings on
uncompleted contracts or billings in excess of costs incurred on uncompleted contracts from period to period.
- •
- Accrued expenses and other liabilities used $31.4 million in operating cash flows in fiscal 2016 compared to $14.6 million used
in fiscal 2015. This increased use of operational cash flow resulted primarily from the timing of cash payments for various employee-related and other restructuring activities during fiscal 2016
compared to fiscal 2015.
- •
- The aggregate of non-current assets and non-current liabilities provided $16.0 million in operating cash flows in fiscal 2016 compared to $3.2 million used in fiscal 2015. The cash flows related to this increase in fiscal 2016 include an increase in pension liabilities of $8.1 million compared to a decrease of pension liability of $0.3 million in fiscal 2015, driven by declines in discount rates used to value projected benefit obligations. Additionally, $8.8 million of long term capital leases were entered into in fiscal 2016.
included the non-cash impact of foreign currency losses for intracompany loans primarily denominated in euro of $0.1 million compared to $19.3 million in fiscal 2015.
Net cash provided by operating activities decreased $41.2 million to $41.9 million in the fiscal year ended September 30, 2015 from $37.5 million in the Successor Period 2014 and $45.6 million in the Predecessor Period 2014. This decrease was primarily due to the following:
- •
- Fiscal 2015 operating cash flows reflected a decrease in net loss of $14.0 million as compared to the comparable 2014 period. The
Successor Period 2014 included a tax benefit of $48.5 million. In fiscal 2015, net loss included a valuation allowance on deferred tax assets of $63.5 million. Additionally, net loss in
the Predecessor and Successor periods 2014 included depreciation and amortization of $154.9 million compared to $58.1 million in fiscal 2015 primarily resulting from $87.4 million
of backlog (useful life of one year) amortization recognized in the Successor Period of 2014. Intangible amortization expense primarily relates to the amortization of intangible assets acquired in
connection with the AEA Acquisition. Additionally, in fiscal 2015, net loss included a non-cash impact of foreign currency losses for intracompany loans primarily denominated in euro of
$19.3 million compared to $6.8 million in Successor Period 2014.
- •
- In fiscal 2014, operating cash flow included the build-up a $36.3 million payment on balances due to affiliates of the Predecessor which
were settled as part of the AEA Acquisition.
- •
- The aggregate of receivables, inventories, cost and earnings in excess of billings on uncompleted contracts, accounts payable and billings in excess of costs incurred on uncompleted contracts provided $19.9 million in operating cash flows in fiscal 2015 compared to $55.8 million of operating cash flows provided in fiscal 2014. The amount of cash flow generated from or used by the above mentioned accounts depends upon how effectively we manage our cash conversion cycle, which is a representation of the number of days that elapse from the date of purchase of raw materials and components to the collection of cash from customers. Our cash conversion cycle can be significantly impacted by the timing of collections and payments in a period.
120
- •
- Prepaid expense and other assets provided $4.3 million in operating cash flows in fiscal 2015 compared to $17.3 million provided in fiscal 2014. This change in operational cash flow resulted primarily from the timing of cash payments for income taxes and prepaid rents during fiscal 2015 compared to fiscal 2014.
Further, as it relates to capital projects, fiscal 2015 represented a rebuilding of the pipeline of capital projects, as compared to the period prior to the AEA Acquisition, which represented a depletion of the pipeline of capital projects. This build-up of capital project activity contributed to the variability accounts receivable, inventories, of excess billings on uncompleted contracts or billings in excess of costs incurred on uncompleted contracts from period to period.
Investing Activities
Net cash used in investing activities decreased $214.0 million from $331.3 million in the nine months ended June 30, 2016 to $117.3 million in the nine months ended June 30, 2017. This decrease was largely driven by the relative size of acquisitions completed during the comparative periods. During the nine months ended June 30, 2016 we completed the acquisitions of Magneto and Neptune-Benson, requiring a net cash outlay of $299.6 million, while the acquisitions of ETS, Noble, Olson and ADI completed during the nine months ended June 30, 2017, were significantly smaller, requiring a net cash outlay of only $77.8 million. This reduction in net cash used in acquisitions was offset, in part, by a period over period increase of $5.8 million in cash outlays for the purchase of property, plant and equipment in support of customer orders, and a period over period increase of $3.9 million in cash outlays for intangible assets related to the purchase of software licenses with varying useful lives.
Net cash used in investing activities increased $297.7 million from $46.9 million in the fiscal year ended September 30, 2015 to $344.6 million in the fiscal year ended September 30, 2016. This increase was primarily due to the acquisitions of Neptune Benson, Magneto, VAF and Delta UV, which were consummated during fiscal 2016 with a total cash outlay of $306.4 million. This cash outlay on acquisitions was offset, in part, by proceeds of $4.5 million from the Vernon Disposition, and $5.2 million on the sale of vacant facilities.
Net cash used in investing activities decreased $722.7 million to $46.9 million in the fiscal year ended September 30, 2015 from $762.1 million in the Successor Period 2014 and $7.5 million in the Predecessor Period 2014. This decrease primarily resulted from the occurrence of the AEA Acquisition in fiscal 2014 for $730.6 million, which did not recur in fiscal 2015. The overall decrease in net cash used in investing activities was partially offset by a $7.4 million increase in purchases of property, plant and equipment related to ongoing maintenance of our facilities and equipment.
Financing Activities
Net cash provided by financing activities decreased $94.6 million from $199.1 million of net cash provided by financing activities in the nine months ended June 30, 2016 to net cash provided by financing activities of $104.4 million in the nine months ended June 30, 2017. This lower amount of cash provided by financing activities in the nine months ended June 30, 2017 was primarily due to higher repayment of outstanding debt. During the nine months ending June 30, 2017, we refinanced $75.0 million of our Second Lien Facilities into the First Lien Facilities and used proceeds from our Revolving Credit Facility for two acquisitions which closed in June 2017. In addition, we continued to repay debt in accordance with each applicable credit agreement's terms, including repayment of amounts borrowed from the Revolving Credit Facility during fiscal 2016.
Net cash provided by financing activities increased $197.7 million from $6.3 million of net cash used in financing activities in the fiscal year ended September 30, 2015 to net cash provided by financing activities of $191.4 million in the fiscal year ended September 30, 2016. This increase was primarily due to issuance of debt of $185.0 million under the Senior Secured Credit Facilities proceeds
121
from capital contributions and issuance of common stock of approximately $17.2 million, both in support of acquisition activities.v
Net cash provided by financing activities decreased $1,007.6 million from net cash provided by financing activities of $911.4 million in the Successor Period 2014 and $89.9 million in the Predecessor Period 2014 to net cash used in financing activities of $6.3 million in the fiscal year ended September 30, 2015. This decrease was primarily due to issuance of debt related to the AEA Acquisition and the related proceeds from issuance of common stock in the Successor Period 2014, partially offset by the reduction in borrowings under the Senior Secured Credit Facilities and investor transaction fees.
Seasonality
While we do not believe it to be significant, our business does exhibit seasonality resulting from our customers' increasing demand for our products and services during the spring and summer months as compared to the fall and winter months. For example, our Municipal Segment experiences increased demand for our odor control product lines and services in the warmer months which, together with other factors, typically results in improved performance in the second half of our fiscal year. Inclement weather, such as hurricanes, droughts and floods, can also drive increased demand for our products and services. As a result, our results from operations may vary from period to period.
Off-Balance Sheet Arrangements
As of September 30, 2016 and June 30, 2017, we had letters of credit totaling $18.1 million and $15.9 million, respectively, and surety bonds totaling $102.2 million and $80.3 million respectively, outstanding under our credit arrangements. The longest maturity date of the letters of credit and surety bonds related to commercial contracts in effect as of June 30, 2017 was March 31, 2024. Additionally, as of September 30, 2016 and June 30, 2017, we had letters of credit totaling $1.5 million and $1.1 million, respectively, and surety bonds totaling $43.7 million and $14.3 million, respectively, outstanding under our prior arrangement with Siemens.
Contractual Obligations
We enter into long-term obligations and commitments in the normal course of business, primarily debt obligations and non-cancelable operating leases. As of September 30, 2016, without giving effect to this offering or the use of proceeds therefrom, our contractual cash obligations over the next several periods were as follows (in thousands):
| |
Total | Less than 1 year |
1 to 3 years |
3 to 5 years |
More than 5 years |
|||||||||||
|---|---|---|---|---|---|---|---|---|---|---|---|---|---|---|---|---|
Operating lease commitments(a) |
$ | 47,369 | $ | 13,232 | $ | 17,665 | $ | 10,688 | $ | 5,784 | ||||||
Capital lease commitments(b) |
28,354 | 7,530 | 13,013 | 6,972 | 839 | |||||||||||
Long-term debt obligations |
779,411 | 30,024 | 18,314 | 730,355 | 718 | |||||||||||
Interest payments on long-term debt obligations |
171,201 | 40,315 | 79,921 | 50,965 | — | |||||||||||
| | | | | | | | | | | | | | | | | |
Total |
$ | 1,026,335 | $ | 91,101 | $ | 128,913 | $ | 798,980 | $ | 7,341 | ||||||
| | | | | | | | | | | | | | | | | |
| | | | | | | | | | | | | | | | | |
| | | | | | | | | | | | | | | | | |
- (a)
- We
occupy certain facilities and operate certain equipment and vehicles under non-cancelable lease arrangements. Lease agreements may contain lease escalation
clauses and purchase and renewal options. We recognize scheduled lease escalation clauses over the course of the applicable lease term on a straight-line basis.
- (b)
- We lease certain equipment classified as capital leases. The leased equipment is depreciated on a straight line basis over the life of the lease and is included in depreciation expense.
122
Critical Accounting Policies and Estimates
The preparation of financial statements in accordance with accounting principles generally accepted in the United States requires management to make estimates and assumptions about future events that affect amounts reported in our consolidated financial statements and related notes, as well as the related disclosure of contingent assets and liabilities at the date of the financial statements. Management evaluates its accounting policies, estimates and judgments on an on-going basis. Management bases its estimates and judgments on historical experience and various other factors that are believed to be reasonable under the circumstances. Actual results may differ from these estimates under different assumptions and conditions.
Management evaluated the development and selection of its critical accounting policies and estimates and believes that the following involve a higher degree of judgment or complexity and are most significant to reporting our results of operations and financial position, and are therefore discussed as critical. The following critical accounting policies reflect the significant estimates and judgments used in the preparation of our consolidated financial statements. With respect to critical accounting policies, even a relatively minor variance between actual and expected experience can potentially have a materially favorable or unfavorable impact on subsequent results of operations. More information on all of our significant accounting policies can be found in "Note 2—Summary of Significant Accounting Policies" to our audited consolidated financial statements included elsewhere in this prospectus.
Use of Estimates
Our consolidated financial statements are prepared in conformity with GAAP and require management to make estimates and assumptions. These assumptions affect the reported amounts of assets and liabilities and disclosure of contingent assets and liabilities at the date of the consolidated financial statements and the reported amounts of revenue and expenses during the reporting period. Estimates and assumptions are used for, but not limited to: (i) revenue recognition; (ii) allowance for doubtful accounts; (iii) inventory valuation, asset valuations, impairment and recoverability assessments; (iv) depreciable lives of assets; (v) useful lives of intangible assets; (vi) income tax reserves and valuation allowances and (vii) product warranty and litigation reserves. Estimates are revised as additional information becomes available. Actual results could differ from these estimates.
Accounts Receivable
Receivables are primarily comprised of uncollected amounts owed to us from transactions with customers and are presented net of allowances for doubtful accounts. Allowances are estimated based on historical write-offs and the economic status of customers. We consider a receivable delinquent if it is unpaid after the term of the related invoice has expired. Write-offs are recorded at the time all collection efforts have been exhausted.
Inventories
Inventories are stated at the lower of cost or market, where cost is generally determined on the basis of an average or first-in, first-out method. Production costs comprise direct material and labor and applicable manufacturing overheads, including depreciation charges. We regularly review inventory quantities on hand and write off excess or obsolete inventory based on estimated forecasts of product demand and production requirements. Manufacturing operations recognize cost of product sales using standard costing rates with overhead absorption which generally approximates actual cost.
123
Property, Plant, and Equipment
Property, plant, and equipment is valued at cost less accumulated depreciation and impairment losses. If the costs of certain components of an item of property, plant, and equipment are significant in relation to the total cost of the item, they are accounted for and depreciated separately. Depreciation expense is recognized using the straight-line method. Useful lives are reviewed annually and, if expectations differ from previous estimates, adjusted accordingly. Estimated useful lives for major classes of depreciable assets are as follows:
Asset Class
|
Estimated Useful Life | |
|---|---|---|
Machinery and equipment |
3 to 20 years | |
Buildings and improvements |
10 to 40 years |
Leasehold improvements are depreciated over the shorter of their estimated useful life or the term of the lease. Costs related to maintenance and repairs that do not extend the assets' useful life are expensed as incurred.
Goodwill and Other Intangible Assets
We review goodwill to determine potential impairment annually during the fourth quarter of our fiscal year, or more frequently if events and circumstances indicate that the asset might be impaired. Impairment testing for goodwill is performed at a reporting unit level. We have determined that we have four reporting units. Our quantitative impairment testing utilizes both a market (guideline public company) and income (discounted cash flows) method for determining fair value. In estimating the fair value of the reporting unit utilizing a discounted cash flow valuation technique, we incorporate our judgment and estimates of future cash flows, future revenue and gross profit growth rates, terminal value amount, capital expenditures and applicable weighted-average cost of capital used to discount these estimated cash flows. The estimates and projections used in the estimate of fair value are consistent with our current budget and long-range plans, including anticipated change in market conditions, industry trend, growth rates and planned capital expenditures, among other considerations. If the carrying value of the reporting unit is greater than the fair value, the second step is performed, where the implied fair value of goodwill is compared to its carrying value.
Impairment of Long-Lived Assets
Long-lived assets, such as property, plant and equipment, and purchased intangibles subject to amortization, are reviewed for impairment whenever events or changes in circumstances indicate that the carrying amount of an asset or asset group may not be recoverable. Conditions that may indicate impairment include, but are not limited to, a significant adverse change in customer demand or business climate that could affect the value of an asset, a product recall or an adverse action by a regulator. Recoverability of the asset or asset group is measured by comparison of its carrying amount to undiscounted future net cash flows the asset or asset group is expected to generate. If the carrying amount of an asset or asset group is not recoverable, we recognize an impairment loss based on the excess of the carrying amount of the asset or asset group over its respective fair value which is generally determined as the present value of estimated future cash flows or as the appraised value.
We amortize these assets with finite lives over their estimated useful lives on a straight-line basis. This amortization methodology best matches the pattern of economic benefit that is expected from the definite-lived intangible assets.
124
Revenue Recognition
Sales of goods and services are recognized when persuasive evidence of an arrangement exists, the price is fixed or determinable, collectability is reasonably assured and delivery has occurred or services have been rendered.
For sales of aftermarket parts or products with a low level of customization and engineering time, we recognize revenues at the time title and risks and rewards of ownership pass, which is generally when products are shipped or delivered to the customer as we have no obligation for installation. Sales of short-term service arrangements are recognized as the services are performed, and sales of long-term service arrangements are typically recognized on a straight-line basis over the life of the agreement.
For certain arrangements where there is significant customization to the product, we recognize revenue under the provisions of ASC 605-35, Revenue Recognition—Construction-Type and Production-Type Contracts. These products include large capital water treatment projects, systems and solutions for municipal and industrial applications. Revenues from construction-type contracts are generally recognized under the percentage-of-completion method, based on the input of costs incurred to date as a percentage of total estimated contract costs. The nature of the contracts are generally fixed price with milestone billings. As needed, we update estimates of future costs for agreements in process and report any cumulative effect of such adjustments in current operations. Approximately $33.5 million, $29.7 million and $21.6 million of revenues from construction-type contracts were recognized on a completed contract method, which is typically when the product is delivered and accepted by the customer, during the fiscal years ended September 30, 2016, 2015 and 2014. The completed contract method is principally used when the contract is short in duration (generally less than twelve months) and where results of operations would not vary materially from those resulting from the use of the percentage-of-completion method. Cost and earnings in excess of billings under construction-type arrangements are recorded when contracts have net asset balances where contract costs plus recognized profits less recognized losses exceed progress billings. Billings in excess of costs incurred are recorded when contract progress billings exceed costs and recognized profit less recognized losses.
Product Warranties
Accruals for estimated expenses related to warranties are made at the time products are sold and are recorded as a component of cost of product sales in the Consolidated Statements of Operations and Comprehensive Loss in our financial statements included elsewhere in this prospectus. The estimated warranty obligation is based on product warranty terms offered to customers, ongoing product failure rates, material usage and service delivery costs expected to be incurred in correcting a product failure, as well as specific obligations for known failures and other currently available evidence. We assess the adequacy of the recorded warranty liabilities on a regular basis and adjust amounts as necessary.
Income Taxes
We recognize deferred tax assets and liabilities for the future tax consequences attributable to differences between the financial statement carrying amounts of existing assets and liabilities and their respective tax bases. Deferred tax assets and liabilities are measured using enacted tax rates expected to apply to taxable income in the years in which those temporary differences are expected to be recovered or settled. The effect on deferred tax assets and liabilities of a change in tax rates is recognized in income in the period that included the enactment date. Valuation allowances are provided against deferred tax assets when it is deemed more likely than not that some portion or all of the deferred tax asset will not be realized within a reasonable time period. We assess tax positions using a two-step process. A tax position is recognized if it meets a more-likely-than-not threshold, and is measured at
125
the largest amount of benefit that is greater than 50% of being realized. Uncertain tax positions are reviewed each balance sheet date.
In November 2015, the Financial Accounting Standards Board ("FASB") issued Accounting Standard Update ("ASU") 2015-17, Balance Sheet Classification of Deferred Taxes. This update simplifies the presentation of deferred income taxes. The amendments in this update require that deferred tax liabilities and assets be classified as noncurrent for all entities that present a classified statement of financial position. The current requirement that deferred tax liabilities and assets of a tax-paying component of an entity be offset and presented as a single amount is not affected by the amendments in this update. The amendments in this update are effective for non-public entity financial statements issued for annual periods beginning after December 15, 2017, and interim periods with annual periods beginning after December 15, 2018. Earlier application is permitted for all entities as of the beginning of an interim or annual reporting period. The amendments in this update may be applied either prospectively to all deferred tax liabilities and assets or retrospectively to all periods presented. Management has elected to prospectively adopt this update early as of October 1, 2015. By adopting this update prospectively, prior periods were not retrospectively adjusted.
Equity-based Compensation
We account for awards of equity instruments in accordance with relevant authoritative literature. Given the absence of a public trading market for our common stock, the fair value of the common stock underlying our share-based awards was determined by our board, with input from management, in each case using the income and market valuation approach. We believe that our board has the relevant experience and expertise to determine the fair value of our common stock. In accordance with the Accounting and Valuation Guide: Valuation of Privately-Held-Company Equity Securities Issued as Compensation published by the American Institute of Certified Public Accountants, our board exercised reasonable judgment and considered numerous objective and subjective factors to determine the best estimate of the fair value of our common stock including:
- •
- our historical and projected operating and financial results, including capital expenditures;
- •
- current business conditions and performance, including dispositions and discontinued operations;
- •
- present value of estimated future cash flows;
- •
- the market performance and financial results of comparable publicly-traded companies;
- •
- amounts of indebtedness;
- •
- industry or company-specific considerations;
- •
- likelihood of achieving a liquidity event, such as an initial public offering or a sale of the company;
- •
- lack of marketability of our common stock; and
- •
- the U.S. and global capital market conditions.
These estimates will not be necessary to determine the fair value of new awards once the underlying shares begin trading publicly. Stock options are granted with exercise prices equal to or greater than the estimated fair market value on the date of grant as authorized by our compensation committee. Options granted vest ratably at 25% per year and are exercisable at the time of vesting. Stock option grants are generally subject to forfeiture if employment terminates prior to vesting. We have selected the Black-Scholes option pricing model for estimating the grant date fair value of stock option awards granted. We have considered the retirement and forfeiture provisions of the options and utilized our historical experience and the experience of similar public companies to estimate the expected life of the options. We base the risk-free interest rate on the yield of a zero coupon U.S.
126
Treasury security with a maturity generally equal to the expected life of the option from the date of the grant. We estimate the volatility of the share price of our common stock by considering the historical volatility of the stock of similar public entities. We estimate the dividend yield to be zero as we do not intend to pay dividends in the future. In determining the appropriateness of the public entities included in the volatility assumption we considered a number of factors, including the entity's life cycle stage, growth profile, size, financial leverage and products offered. Stock-based compensation cost is measured at the grant date based on the value of the award, net of estimated forfeitures, and is recognized as a component of general and administrative expense over the requisite vesting period.
In March 2016, the FASB issued ASU 2016-09, Improvements to Employee Share-Based Payment Accounting, which amends ASC Topic 718, Compensation—Stock Compensation. The ASU includes provisions intended to simplify various aspects related to how share-based payments are accounted for and presented in the financial statements. ASU 2016-09 will be effective for non-public entities for the quarter ending December 31, 2017. This update is not expected to have an impact on our consolidated financial statements.
Retirement Benefits
We apply ASC Topic 715, Compensation—Retirement Benefits, which requires the recognition in pension obligations and accumulated other comprehensive income of actuarial gains or losses, prior service costs or credits and transition assets or obligations that have previously been deferred. The determination of retirement benefit pension obligations and associated costs requires the use of actuarial computations to estimate participant plan benefits to which the employees will be entitled. The significant assumptions primarily relate to discount rates, expected long-term rates of return on plan assets, rate of future compensation increases, mortality, years of service and other factors. We develop each assumption using relevant experience in conjunction with market-related data for each individual country in which such plans exist. All actuarial assumptions are reviewed annually with third-party consultants and adjusted as necessary. For the recognition of net periodic postretirement cost, the calculation of the expected return on plan assets is generally derived by applying the expected long-term rate of return on the market-related value of plan assets. The fair value of plan assets is determined based on actual market prices or estimated fair value at the measurement date.
Recent Accounting Pronouncements
In May 2014, the FASB issued ASU No. 2014-09, Revenue from Contracts with Customers (Topic 606). ASU No. 2014-09 clarifies the principles for recognizing revenue when an entity either enters into a contract with customers to transfer goods or services or enters into a contract for the transfer of non-financial assets. ASU 2014-09 may be adopted using either of two acceptable methods: (1) retrospective adoption to each prior period presented with the option to elect certain practical expedients; or (2) adoption with the cumulative effect recognized at the date of initial application and providing certain disclosures. To assess at which time revenue should be recognized, an entity should use the following steps: (1) identify the contract(s) with a customer; (2) identify the performance obligations in the contract; (3) determine the transaction price; (4) allocate the transaction price to the performance obligations in the contract; and (5) recognize revenue when, or as, the entity satisfies a performance obligation. The standard is effective for the Company for the quarter ending December 31, 2018. We have engaged a third party to assist in assessing the impact adoption of this guidance will have on its consolidated financial statements.
In February 2016, the FASB issued ASU 2016-02, Leases (Topic 842). ASU 2016-02 requires recognition of operating leases as lease assets and liabilities on the balance sheet, and disclosure of key information about leasing arrangements. ASU 2016-02 will be effective retrospectively for us for the quarter ending December 31, 2019, with early adoption permitted. We are currently assessing the impact adoption of this guidance will have on our consolidated financial statements.
127
In March 2016, the FASB issued (ASU) 2016-09, Improvements to Employee Share-Based Payment Accounting, which amends ASC Topic 718, Compensation—Stock Compensation. The ASU includes provisions intended to simplify various aspects related to how share-based payments are accounted for and presented in the financial statements. ASU No. 2016-09 will be effective for the Company for the quarter ending December 31, 2017. This update is not expected to have an impact on the Company's consolidated financial statements. The Company is currently assessing the impact adoption of this guidance will have on its consolidated financial statements.
In August 2016, the FASB issued ASU 2016-15, Statement of Cash Flows (Topic 230): Classification of Certain Cash Receipts and Cash Payments (a consensus of the Emerging Issues Task Force). This new guidance is intended to reduce diversity in practice in how certain transactions are classified in the statement of cash flows. ASU 2016-15 will be effective for us for the quarter ending December 31, 2018, with early adoption permitted. The guidance should be applied retrospectively to all periods presented, unless deemed impracticable, in which case prospective application is permitted. We are currently evaluating the potential impact of adoption on our consolidated financial statements.
In October 2016, the FASB issued ASU 2016-17, Consolidations (Topic 810): Interests Held through Related Parties that are under Common Control. The ASU changes how a single decision maker of a VIE that holds indirect interest in the entity through related parties that are under common control determines whether it is the primary beneficiary of the VIE. The new guidance amends ASU 2015-02, Consolidation (Topic 810): Amendments to the Consolidation Analysis, issued in February 2015. The guidance should be applied coincidentally with the adoption of ASU 2015-02, which was effective for us for the quarter ended December 31, 2016. The adoption of this guidance did not have a significant impact on our consolidated financial statements.
In January 2017, the FASB issued ASU 2017-04, Simplifying the Test for Goodwill Impairment. This ASU simplifies how an entity is required to test goodwill for impairment by eliminating Step 2 from the goodwill impairment test. Step 2 measures goodwill impairment loss by comparing the implied value of a reporting unit's goodwill with the carrying amount of that goodwill. The amendments in this ASU are effective for us for the quarter ending December 31, 2020. We do not expect the adoption of this ASU to have a material impact on our consolidated financial statements.
In May 2017, the FASB issued ASU 2017-09, Scope of Modification Accounting, which amended Accounting Standards Code Topic 718. FASB issued ASU 2017-09 to reduce the cost and complexity when applying Topic 718 and standardize the practice of applying Topic 718 to financial reporting. The ASU was not developed to fundamentally change the definition of a modification, but instead to provide guidance for what changes would qualify as a modification. ASU No. 2017-09 will be effective for us for the quarter ending December 31, 2018. We are currently evaluating the potential impact of adoption on the Company's Consolidated Financial Statements.
Quantitative and Qualitative Disclosures about Market Risk
Interest Rate Risk
We have market risk exposure arising from changes in interest rates on our Senior Secured Credit Facilities, which bear interest at rates that are benchmarked against LIBOR. Based on our overall interest rate exposure to variable rate debt outstanding as of June 30, 2017, a 1% increase or decrease in interest rates would increase or decrease income (loss) before income taxes by approximately $8.1 million.
Impact of Inflation
Our results of operations and financial condition are presented based on historical cost. While it is difficult to accurately measure the impact of inflation due to the imprecise nature of the estimates
128
required, we believe the effects of inflation, if any, on our results of operations and financial condition have been immaterial. We cannot assure you, however, that our results of operations and financial condition will not be materially impacted by inflation in the future.
Foreign Currency Risk
We have global operations and therefore enter into transactions denominated in various foreign currencies. While we believe we are not susceptible to any material impact on our results of operations caused by fluctuations in exchange rates because our operations are primarily conducted in the United States, if we expand our foreign operations in the future, substantial increases or decreases in the value of the U.S. dollar relative to these other currencies could have a significant impact on our results of operations.
To mitigate cross-currency transaction risk, we analyze significant exposures where we have receipts or payments in a currency other than the functional currency of our operations, and from time to time we may strategically enter into short-term foreign currency forward contracts to lock in some or all of the cash flows associated with these transactions. We also are subject to currency translation risk associated with converting our foreign operations' financial statements into U.S. dollars. We use short-term foreign currency forward contracts and swaps to mitigate the impact of foreign exchange fluctuations on consolidated earnings. We use foreign currency derivative contracts in order to manage the effect of exchange fluctuations on forecasted sales, purchases, acquisitions, inventory, capital expenditures and certain intercompany transactions that are denominated in foreign currencies. We do not use derivative financial instruments for trading or speculative purposes.
Internal Control over Financial Reporting
The process of improving our internal controls has required and will continue to require us to expend significant resources to design, implement and maintain a system of internal controls that is adequate to satisfy our reporting obligations as a public company. There can be no assurance that any actions we take will be completely successful. We will continue to evaluate the effectiveness of our disclosure controls and procedures and internal control over financial reporting on an on-going basis. As part of this process, we may identify specific internal controls as being deficient.
In fiscal 2016, we began evaluating and implementing our internal control procedures in order to comply with the requirements of Section 404 of the Sarbanes-Oxley Act. Section 404 requires annual management assessments of the effectiveness of our internal control over financial reporting and a report by our independent auditors addressing these assessments. We will be required to comply with Section 404 in full (including the management certification requirements and an auditor attestation on management's internal controls report) in our annual report on Form 10-K for the year following our first annual report required to be filed with the SEC (subject to any change in applicable SEC rules).
129
Company Overview
We are a leading provider of mission critical water treatment solutions, offering services, systems and technologies to support our customers' full water lifecycle needs. With over 200,000 installations worldwide, we hold leading positions in the industrial, commercial and municipal water treatment markets in North America. We offer a comprehensive portfolio of differentiated, proprietary technology solutions sold under a number of market-leading and well-established brands. We deliver and maintain these mission critical solutions through the largest service network in North America, assuring our customers continuous uptime with 86 branches which are located no further than a two-hour drive from over 90% of our customers' sites. We believe that the customer intimacy created through our service network is a significant competitive advantage.
Our solutions are designed to provide "worry-free water" by ensuring that our customers have access to an uninterrupted quantity and level of quality of water that meets their unique product, process and recycle or reuse specifications. We enable our customers to achieve lower costs through greater uptime, throughput and efficiency in their operations and support their regulatory compliance and environmental sustainability. We have worked to protect water, the environment and our employees for over 100 years. As a result, we have earned a reputation for quality, safety and reliability and are sought out by our customers to solve the full range of their water treatment needs, and maintaining our reputation is critical to the success of our business.
Our vision "to be the world's first choice in water solutions" and our values of "integrity, customers and performance" foster a corporate culture that is focused on employee enablement, empowerment and accountability, which creates a highly entrepreneurial and dynamic work environment. Our purpose is "Transforming water. Enriching life." We draw from a long legacy of water treatment innovations and industry firsts, supported by more than 1,250 granted or pending patents, which in aggregate are important to our business and solution set. Our core technologies are primarily focused on removing impurities from water, rather than neutralizing them through the addition of chemicals, and we are able to achieve purification levels which are 1,000 times greater than typical drinking water.
We provide solutions across the entire water cycle. The water cycle begins with "influent" water, which is sourced from oceans, rivers, lakes, as well as other sources. We treat the influent water so that it can be used for a wide variety of industrial, commercial and municipal applications. In industrial applications, influent water, after it is treated, is used as process water for applications, such as microelectronic production, as an ingredient in the production of food and beverage and other goods and in utility applications including boiler feed water, cooling water and steam condensate. Commercial applications for influent water include laboratory testing and aquatic activities, while municipal applications for influent water include treatment to produce safe drinking water and wastewater that is compliant with applicable regulations. After the water is used it is considered "effluent water," and we enable its treatment through the removal of impurities so that it can be discharged safely back into the environment or reused for industrial, commercial or municipal applications. As our solutions span the entire water cycle, we believe we have the most comprehensive and innovative range of solutions in the entire water treatment industry. Our future growth is dependent upon our ability to accretively develop
130
and acquire products, services and solutions, adapt our business to meet the demands of our customers, comply with changes to government regulations and achieve market acceptance.
We have developed a broad set of well-established, unique relationships across a highly diverse customer base. These relationships produce a visible flow of reoccurring business, with approximately 58% of our revenue for fiscal 2016 derived from service, consumables and aftermarket parts that come from our repeat business and backlog. Additionally, approximately 24% of our revenue for fiscal 2016 consisted of capital orders already in backlog at the beginning of fiscal 2016, resulting in significant visibility into over 82% of our overall annual sales for fiscal 2016. In the industrial market we serve over 25,000 customers, including a substantial majority of the industrial companies within the Fortune 500. We partner with our industrial customers through our direct sales and service team, which is organized geographically and by specific end market. In the municipal market we serve over 7,800 U.S. wastewater sites and over 1,800 global drinking water treatment sites, providing solutions that help treat over 40% of the U.S. municipal wastewater sites as of June 30, 2017. Our deep institutional relationships with independent sales representatives across North America, who serve as the primary channel for new municipal water treatment projects, and upon whom we depend to successfully market and sell our products, services and solutions provide us significant access to new projects up for bid and for servicing our installed base.
For the fiscal year ended September 30, 2016, we generated 86% of our revenues in North America with a strong and growing international presence and we currently employ approximately 4,000 individuals across eight countries. For the fiscal year ended September 30, 2016, we generated revenue, net income and Adjusted EBITDA of $1.1 billion, $13.0 million and $160.1 million, respectively. For the fiscal year ended September 30, 2016, we generated pro forma revenue, pro forma net income and Adjusted EBITDA (pro forma as adjusted for contributions from insignificant completed acquisitions) of $1.2 billion, $16.8 million and $182.4 million, respectively. For more information on Adjusted EBITDA, including a reconciliation to the most directly comparable GAAP financial measure, see "—Summary Consolidated Financial and Operating Data."
131
We serve our customers through three segments: Industrial, Municipal and Products. These segments all draw from the same reservoir of leading technologies, shared manufacturing infrastructure, common business processes and corporate philosophies. Our Industrial Segment provides fully-integrated systems and service solutions that selectively utilize our comprehensive portfolio of water treatment technologies to satisfy our customers' unique water needs. Our Municipal Segment provides engineered water treatment equipment and solutions based on our proprietary technology and odor and corrosion control services. Our Products Segment sells equipment, based on our broad technology portfolio, that is used as components in integrated solutions specified by water treatment designers and offered by OEMs, engineering firms, integrators and our own Industrial and Municipal Segments.
| |
Industrial | Municipal | Products | ||||
|---|---|---|---|---|---|---|---|
| Overview | • Tailored solutions in collaboration with our customers backed by life-cycle services including on-demand water, BOO, recycle / reuse and emergency response service alternatives to improve operational reliability, performance and environmental compliance |
• Delivers solutions, equipment and services to engineering firms, OEMs and municipalities to treat wastewater and purify drinking water |
• Highly differentiated and scalable range of products and technologies specified by global water treatment designers, OEMs, engineering firms and integrators |
||||
Channel |
• Direct sales with market vertical focus |
• Independent representative network supported by technical sales team
• Direct sales and aftermarket channels |
• Direct and indirect sales and aftermarket channels |
||||
Key offerings |
• Full lifecycle service and solutions for influent, effluent and process water, including on-demand water, BOO, recycle / reuse and emergency response services
• Equipment systems for industrial needs: influent water, boiler feed water, ultrahigh purity, process water, wastewater treatment and recycle / reuse
• Full-scale outsourcing of operations and maintenance |
• Wide range of wastewater solutions:
— Ultrafiltration membrane bioreactors
— Advanced biological treatment
— Clarifiers, aerators, screens and dewatering
— Ballasted clarification
— Odor and corrosion control equipment and services
• Ultrafiltration for drinking water
• Retrofit, rehabilitation and aftermarket |
• Filtration
— Regenerative media and microsand
— Self-cleaning filters and intake screens
• Disinfection
— Low and medium pressure UV
— Electrochlorination and gas chlorination
• Anode technology
• Electrodeionization
• Analyzers and controllers |
||||
Percentage of FY 2016 revenue |
53% |
24% |
23% |
132
As depicted in the table below, we target attractive global end-markets that utilize water as a critical part of their operations or production processes including pharmaceuticals and health sciences, microelectronics, food and beverage, hydrocarbon and chemical processing, power, general manufacturing, municipal drinking water and wastewater, marine and aquatics end markets. While a decline in general global and economic conditions could adversely affect us, our business is highly diversified across our key attractive and growing end markets presented below, and we believe that no single end market drives the overall results of our business.
|
|
• Meets stringent process and wastewater requirements in both research and development and manufacturing as defined by FDA standards |
|
• Provides equipment and support for utility water, boiler feed water, cooling water and steam condensate |
|||
|
• Enables next generation of wafer size/geometry with ultra-pure input water and treatment of contaminated wastewater |
|
• Manages water intake screens, boiler feedwater systems (including polishing using continuous electrodeionization) and condensate polishing |
|||
|
• Ensures process / product water complies with regulations for food and beverage production |
|
• Provides full service process water and wastewater treatment services supported by a mobile fleet guaranteeing maximum up-time |
|||
|
• Provides reliably clean drinking water to the largest cities in the world through integrated membrane systems and disinfection products |
|
• Provides solutions and services to the industry for marine growth prevention, biological fouling protection and ballast water treatment |
|||
|
• Develops efficient and reliable waste treatment systems to handle specific geographic needs
• Offers comprehensive and customizable odor and corrosion control solutions and services |
|
• Meets the rigorous treatment demands across aquatic applications for leisure facilities, fountains, water features and theme parks |
Industrial. Our Industrial Segment provides application-specific solutions and full lifecycle services for critical water applications. We focus on treating industrial process water, utility water and wastewater. Industrial process water requires specific purity standards, which are used in making goods in industries such as microelectronics, pharmaceuticals and health sciences and food and beverage, including ingredient water. Industrial utility water is used for critical industrial applications including boiler feed and cooling water. Industrial wastewater is effluent water discharged from plants or facilities which is treated before it is returned to the environment or recycled or reused within the water cycle. Our operations across the water cycle are complex and, if conducted improperly, may result in potential costs and liabilities, including as a result of environmental damage. Our comprehensive solutions are comprised of capital systems and related recurring aftermarket services, parts and consumables, along with long-term and short-term service contracts and emergency services. Our comprehensive capabilities range from discrete offerings to the provision of highly complex, fully integrated solutions. We are able
133
to leverage our broad range of products and technologies to deliver a tailored solution that best addresses a specific customer's needs, including a growing portfolio of smart water technologies encompassed in our Water One platform. Key capital and related aftermarket service and product offerings include filtration, reverse osmosis, ion exchange and continuous deionization. As a result of our speed, capabilities and experience, we are a trusted partner to 25,000 industrial customers, including a substantial majority of Fortune 500 industrial companies. As water is a critical component in many industrial production processes, unavailability of proper water purity, specification or quality can lead to significant constraints, downtime and increased operating costs.
The cost of an installation can range from a few thousand dollars to a few million dollars and often presents an ongoing service and aftermarket revenue opportunity that can reach or exceed the original project cost. The service and aftermarket sales component is supported by our broad application and process expertise and the largest integrated industrial service network in North America, based on management's estimate. Our network is comprised of certified technicians and the largest fleet of mobile reverse osmosis and deionization water treatment systems in North America based on management's estimate, and enables us to provide a complete range of services spanning from regular maintenance and emergency support to our unique Water One platform. Water One provides remote monitoring capabilities which enable us to optimize our routine service calls through predictive analytics and provide customers a more predictable, cost-efficient water solution. We offer services which include water on-demand, mobile solutions and smart water systems that leverage our extensive branch network, technical personnel and technology portfolio.
We market our Industrial offerings through our direct sales force, which is organized by market vertical and is complemented by an inside sales force, field sales engineers and a growing e-commerce platform.
Municipal. Our Municipal Segment provides engineered solutions and equipment for the treatment of wastewater, purification of drinking water and odor and corrosion control for municipalities. Our portfolio of solutions includes ultrafiltration systems, advanced biological treatment, clarifiers, aerators, odor and corrosion control services, equipment for new municipal plant builds and retrofit, rehabilitation and aftermarket parts and services for our extensive installed base. We have provided solutions across a large municipal installed base with capacities ranging from 25,000 gallons per day to over 100 million gallons per day. Our operations are focused within the U.S. market, with a presence in the United Kingdom, Australia, Canada and Singapore.
We maintain a comprehensive municipal representative network that broadly covers the United States, providing us with a differentiated ability to influence specifications and the basis of design for new treatment facilities. We also maintain relationships with engineering firms, operators and other key influencers through our direct technical sales force to drive adoption of our offerings.
Products. Our Products Segment sells differentiated technologies to a diverse set of water treatment system specifiers, integrators and end users globally. Our offerings are highlighted by our filtration and disinfection, electrodeionization and electrochlorination technologies, separation technologies and anodes offerings. Our filtration and disinfection offerings include our Defender line of products, which is a regenerative media filtration leader in the commercial aquatics market. Our IONPURE electrodeionization solutions allow customers to achieve ultrahigh purity water without the use of chemicals in the treatment process. Our electrochlorination products provide extensive water treatment solutions for the maritime, oil and gas and power markets. We also have extensive capabilities in anode technologies, cathodic protection, solid and liquid separation technologies and various aftermarket parts, consumables and accessories. All of our offerings are highly scalable and designed to meet current and future water treatment needs, with a focus on generating repeat business from our customers. We generally service the equipment we provide our customers: however, their failure to properly use, safeguard or maintain their equipment of product defects or unanticipated use of our products could result in liability to us.
134
Our portfolio of technologies and products are sold either as discrete offerings or as components of broader Evoqua solutions through our Industrial and Municipal Segments. Our Products Segment also sells externally to a customer base comprised of globally located OEMs, integrators, regional distributors, customers, regional engineering firms and various other end users that we reach through multiple established sales and aftermarket channels.
Our Industry
We estimate the global water and wastewater market to represent more than $600 billion in total revenue and include both capital and operating expenditures for the treatment and transportation of water by industrial, municipal, commercial and residential end users. Within the global water and wastewater market, we estimate our addressable market, comprised of equipment, consumables, aftermarket parts and operations-related and maintenance-related services for the treatment of water for industrial, commercial and municipal end users, to represent over $85 billion in total revenue. Our addressable market is further refined to include our served market, which is currently focused on the North American region, and totals approximately $10 billion in total revenue according to Amane Advisors. As compared to our larger addressable market, our served market excludes sectors that would require meaningful growth investment on our part to capture new customers or market opportunities. The following diagram illustrates the breakdown of total revenue in our total market and our addressable global market:
Source: Management estimates, Amane Advisors; data is as of 2016.
- (1)
- Evoqua does not provide EPC services, but does sell products and solutions to EPC firms.
While a decline in general global economic and business conditions may adversely affect demand for our products, services and solutions, we believe the global water market will continue to experience growth, supported by a variety of anticipated secular trends that will drive the demand for water across
135
a multitude of industrial, commercial and municipal applications. These secular trends include global population growth, urbanization, industrialization and overall economic growth. In addition, the supply of clean water could be adversely impacted by factors including an aging water infrastructure within North America and increased levels of water stress from seasonal rainfall, inadequate water storage options or treatment technologies. More specific to our business, water is a critical component and byproduct of many processes, including in manufacturing and product development. As such as global consumption patterns evolve and water shortages persist, demand for equipment and services will continue to increase. We estimate the global water market is expected to grow in total revenue by approximately 3% annually from 2017 to 2020, although such growth may not be concentrated in the markets that we serve or may be otherwise affected by global or regional economic conditions.
We hold the number one position, with approximately 11% market share, in the highly fragmented North American water treatment market we serve, based on fiscal 2016 revenue, according to Amane Advisors. Our approximately 11% market share is over 1.5 times that of our nearest competitor across the combined industrial, commercial and municipal market verticals, according to Amane Advisors. As a result of the complex route to market and diverse set of customers, most market participants are niche-offering focused, with a majority of the broader market served by a large number of small, regional providers. More specifically, according to Amane Advisors, the top five market participants comprised approximately 30% of the North American market share in 2016 with a significant tail of smaller, regionally focused competitors. Our leading positions in our market verticals have been cultivated by our suite of differentiated solutions and our comprehensive service network, which had over four times as many locations as our closest competitor at June 30, 2017. Despite our leading positions in the individual market verticals where we participate, our market share did not exceed 25% in any single market vertical in which we participated during fiscal 2016. We must continue to maintain and improve our competitive position, which requires focus on product performance, application expertise and compliance with environmental and regulatory requirements.
We serve three primary market verticals: (i) industrial, (ii) commercial and (iii) municipal. Industrial and commercial customers vary in size, scope and the complexity of their water treatment needs and include small manufacturing clients with a single facility, large commercial waterparks and multinational corporations with a significant global footprint. The municipal market consists of potable water and wastewater treatment solutions that are sold to municipalities and private companies operating under a concession agreement to own and operate treatment facilities on behalf of municipalities. We serve each market with a full range of solutions, services, technologies and aftermarket offerings.
Industrial and commercial markets. The served North America industrial and commercial markets represent an approximately $6 billion revenue opportunity, according to Amane Advisors. Our served North America industrial and commercial water markets consist of industrial process water, industrial utility and wastewater and commercial aquatics. Industrial process water includes the treatment of an influent water source prior to its direct use within a specific industrial application such as an ingredient in the development of a product. Industrial customers rely on specific purity standards for process water with purity needs that range from a small volume of water requiring minimal treatment to ultrapure water that support advanced manufacturing processes and are derived from highly advanced water treatment systems. Industrial utility water treatment includes solutions to remove contaminants before water is utilized to support an industrial process such as boiler feed water. Wastewater is then treated before it is either discharged to a municipal wastewater system or discharged directly to the environment or reused within the facility. Commercial aquatics include the filtration and disinfection of water within large commercial applications including pools and water parks.
The industrial market is comprised of direct end market distribution channels. The commercial market includes a variety of routes to market including direct and third-party channel relationships.
136
Municipal market. There were more than 19,500 municipalities in the United States as of 2012, according to the United States Census Bureau. Together, these municipalities provided drinking and wastewater services to over 282 million people in 2016, according to the U.S. EPA. According to Amane Advisors, our served municipal market in North America is estimated to be approximately $4 billion in total revenue. The criticality of water has also increased due to heightened safety standards, stricter environmental regulation and aging infrastructure. The municipal market is comprised of a wide range of drinking and wastewater treatment facilities. Key market participants include engineering firms and EPC companies that drive plant design and specifications, along with local municipal sales representatives.
Our Strengths
Number one market position in North America offering comprehensive, mission-critical lifecycle water treatment solutions. According to Amane Advisors, we are the leader in the highly fragmented approximately $10 billion North American served water treatment market across industrial, commercial and municipal process and wastewater treatment, based on our fiscal 2016 revenue. We have a global installed base that exceeds 200,000 installations and supports the full breadth of our water lifecycle solutions including application specific treatment equipment, aftermarket parts, consumables and routine or emergency service. Our approximately 11% market share in the North American water treatment market is nearly 1.5 times that of our closest competitor according to Amane Advisors, and yet we still enjoy room for growth given the highly fragmented nature of the market made up predominately of smaller, local companies. According to Amane Advisors, we operate in a highly competitive but fragmented industry, with the top five companies in our industry representing approximately 30% of the market. Our growth is supported by our global manufacturing capabilities, differentiated channels to market and deep technology reservoir.
We believe our market position is derived from our ability to provide holistic water solutions as compared to our competitors who lack both the breadth of our product and technology portfolio and our extensive North American service network. We have a vast array of products and systems with the expertise to adapt core technologies to meet specific customer needs, particularly within the industrial space. Additionally, we are able to offer our clients a full outsourced water experience with guaranteed water quality and quantity through a full suite of mobile technologies, including our national fleet of over 600 mobile treatment assets as of June 30, 2017.
Positioned to capitalize on favorable industry growth dynamics and benefit from diverse end-market exposure. While a decline in general global economic and business conditions may adversely affect demand for our products, services and solutions, water treatment is an essential, non-discretionary market that is growing in importance as access to clean water has become an international priority. A number of global, long-term secular trends underpin anticipated industry growth dynamics and have resulted in increasingly stringent effluent regulations along with a growing demand for cleaner and sustainable waste streams for reuse. These trends include the growing global population, increasing levels of urbanization and continued global economic growth. We have seen these trends manifest themselves within our various end markets creating multiple avenues of growth, but we are unable to predict the impact of potential countervailing considerations. For example, within the industrial market, water is an integral component in the production of a wide range of goods spanning from consumer electronics to automobiles. Additionally, recent events such as the crisis in Flint, Michigan have renewed focus on clean drinking water in the United States, which, combined with historical increases in infrastructure investment, translates to growing demand for our solutions and services in the municipal market. Furthermore, our long-standing reputation among engineering firms and independent sales representatives positions us to benefit from increased municipal demand, particularly as water treatment plants are upgraded and expanded.
Given the wide use and importance of water, we enjoy low concentration within our end markets, with no single market vertical comprising over 19% of our revenue and no single customer comprising
137
over 1% of our revenue for the fiscal year ended September 30, 2016. As a result, we believe our business is diversified and insulated from dislocations in specific market verticals. We estimate our end markets are growing at a weighted average of approximately 3% per annum. Further, we believe many of our end markets represents significant market opportunities because they are highly fragmented and not yet fully penetrated.
Unparalleled channels to market and service network to support our diversified, blue-chip customer base. With over four times as many branches as our next largest competitor based on management's estimates and analysis, our 86 service branches are located within a two-hour drive of approximately 90% of our more than 25,000 industrial customer sites in North America. Across our global service branches, we have nearly 600 sales and support personnel and 800 field technicians. We believe our direct sales force is important to our customers. Most of our sales personnel are assigned to specific end markets and possess extensive application-specific knowledge, allowing us to provide customized and fully integrated solutions leading to a unique level of intimacy with our end users. Our continued success depends on our ability to retain or attract skilled technical, engineering, sales and other key personnel, for whom competition is intense, both in retaining our existing employees and in replacing or finding additional employees. We complement our sales approach with our Global Corporate Accounts Management team, which we use to drive greater penetration across our extensive portfolio of large blue-chip customers and engineering firms. The efforts of our sales force are further enhanced by the ongoing dialogue and interactions our field technicians have with customers, which provides us real-time feedback and serve as a source of leads on new sales opportunities. We also have a growing global product network that provides us access to commercial opportunities beyond our installed base and core geographic regions. Overall, we believe that our channels to market play a key role in our success in our core market while also allowing us to rapidly commercialize new technologies as well as scale tuck-in acquisitions. Further, our customer base consists of over 38,000 customers including a substantial majority of the industrial companies within the Fortune 500 and spans a wide array of end-markets. We face low customer concentration, with no single customer accounting for over 1% of our revenue for the fiscal year ended September 30, 2016.
Iconic brands supported by leading proprietary and differentiated technologies. We believe our brands are known across the water treatment marketplace for innovation, quality, customer service, safety and reliability. Our customers' familiarity with our brands enhances our sales capabilities and allows us to more effectively engage existing and new customers. Our reputation depends on our ability to provide our industry-leading water treatment solution offering, and we have a number of patent-protected cornerstone technologies that support our business. Leveraging these technologies allows us to offer solutions across the entire spectrum of the water treatment lifecycle. Our innovation process is supported through six global research, development and engineering facilities, along with partnerships spanning leading universities research centers and other outside agencies. Our internal RD&E framework, the Evoqua Innovation Process, is fully deployed and uses a stage-gate approach to identifying, prioritizing and implementing innovation projects across the organization.
Our innovation platform has generated an extensive portfolio of intellectual property with more than 1,250 granted or pending patents. In the fiscal year ended September 30, 2016, excluding parts and service, approximately 47% of our revenue was directly or indirectly covered by our granted or pending patents. Our core and established technologies include electrodeionization and advanced oxidation, which allow for chemical free ultra-high purity water solutions; Water One, which leverages advanced sensing and analytics to provide water on demand, remote condition monitoring and predictive maintenance; and mobile treatment services, which provide expedited services in emergency situations. Our newly developed and acquired technologies include our recently acquired Defender line of regenerative media filtration, which is a leader in commercial aquatics filtration; BioMag and CoMag, which address the need for capital-light solutions to increase throughput within municipal treatment facilities; and SeaCURE, which treats ballast water in order to actively remove, kill or inactivate organisms before discharge. We must continue to develop and acquire new products, services
138
and solutions to meet the demands of our customers and compete in our markets. Our current pipeline of technologies in development includes biological wastewater diffused aeration, on-site electrolytic chlorination and electrochemical desalination, which are designed to help lower customer costs and expand our market reach.
Stable, recurring flow of business with a large installed base drives superior topline visibility. We had high visibility into over 82% of our overall revenue at the beginning of fiscal 2016. Approximately 58% of our revenue for fiscal 2016 was related to service, consumables and aftermarket parts that come from our repeat business and backlog. A portion of this revenue is covered by annual and multi-year industrial contracts that had a 98% and 99% renewal rate in fiscal 2015 and 2016, respectively. We generate service and aftermarket revenue from a wide range of activities, including the regular delivery and installation of consumable ion-exchange replacement bottles across 25,000 industrial customer sites and the regular replacement of approximately 400,000 ultra-filtration membranes installed across 1,800 locations on 4-6 year cycles as of June 30, 2017. In particular, more than 80% of Industrial customers who purchased capital equipment during the two fiscal years ended September 30, 2015 and 2016 have also purchased services and/or aftermarket products over the past three years. Approximately 24% of our revenue for fiscal 2016 consisted of capital orders already contracted in backlog. The remaining approximately 18% of revenue for the fiscal year ended September 30, 2016 represented book-to-bill projects, which we typically win and convert to revenue within the same fiscal year. For our capital related sales, we selectively focus on projects that we believe have the potential to produce continuing service, aftermarket and consumables sales. We believe the visibility and predictability we experience with our revenue enhances our ability to consistently drive profitability.
Well invested manufacturing and service footprint provides operating leverage and supports our growth. We believe our manufacturing, service and sales functions are capable of supporting our long-term growth targets. Our manufacturing base is currently operating at approximately 40% of its maximum capacity levels at June 30, 2017, creating an opportunity for volume and margin expansion without significant new capital investments. This dynamic also enhances our ability to absorb new acquisitions into our existing operations, though we may not be able to successfully identify, integrate or compete for acquisition targets. We have also identified and are pursuing several operational improvement campaigns including ePro and LEAN, our supply chain excellence initiative that centralizes and standardizes purchasing across the organization. These initiatives, combined with low levels of maintenance capital expenditures and efficient working capital management, create flexibility to deploy cash flow for accretive investments.
Experienced management team with proven operational capabilities that has made Evoqua an employer of choice. We are highly dependent on our leadership team, which consists of industry veterans with a track record of executing effective strategies and achieving profitable growth. Ron Keating, our CEO, is a highly experienced executive with a strategic, commercial and operational background developed in senior roles, where he reshaped organizations and corporate portfolios for growth. Ben Stas, our CFO, has held a variety of senior financial and business roles in the capital goods sector. Our leadership developed and deployed standard operating processes under the Evoqua Growth System that repositioned the business and improved margins through operational programs and standards such as LEAN operating systems, service growth and ePro, among others. These programs combined with our newly implemented sales methodology, Evoqua EDGE, have improved our free cash flow profile and growth prospects. Our management team has also expanded our operations to new target markets and geographies and has demonstrated successful acquisition and integration capabilities. Our success depends to a significant extent on our ability to retain or attract employees in senior management, skilled technical, engineering, sales and other key personnel.
After the AEA Acquisition, we began a transformation of our business into a global organization with an independent, professional management team. We believe our transformation has made us into a premier partner and employer in our industry, resulting in differentiated capabilities and talent within
139
our organization. We have instilled an entrepreneurial environment where employees believe in the mission and leverage the collective intellect and expertise of service technicians and engineers. To develop a safety focused culture, we have invested heavily in our EH&S program, which is committed to providing employees with a safe and healthy workplace while protecting our shared environment. Following the completion of this offering, we expect to be a "controlled company" within the meaning of the corporate governance standards of the NYSE. See "Risk Factors—Risks Relating to our Common Stock and this Offering—We are a 'controlled company' within the meaning of the corporate governance standards of the NYSE and, as a result, will qualify for, and may rely on, exemptions from certain corporate governance requirements."
Our Growth Strategy
The key elements of our strategy include:
Grow and further penetrate our existing customer base. We believe our strong brands, leading position in highly fragmented markets, scalable and global offerings, leading installed base and unique ability to provide complete treatment solutions will enable us to capture a larger share of our existing customers' water treatment spend while expanding with existing and new customers into adjacent end-markets and underpenetrated regions, including by investing in our sales force and cross-selling to existing customers. Despite having the leading market share in the North American water treatment market, our share does not exceed 25% in any single market vertical according to Amane Advisors. Furthermore, our share of any given customer's water treatment related spend is often limited to select regions, thereby creating a significant opportunity to further penetrate existing customer accounts by offering additional solutions and serving more sites, both in current and new geographic regions. Our growth initiatives include both expanding our presence in our core North American market as well as replicating our leading position and strategies into underpenetrated global regions. For example, through innovative technologies such as IONPURE continuous electrodeionization and Defender aquatic regenerative media filtration systems, we have expanded our positions in markets such as Asia and the Middle East.
In order to maintain and enhance our customers relationships, we intend to continue to invest in our sales force. Since fiscal 2014 we have increased the proportion of customer facing employees by over 25%, developed a best-in-class training program, restructured our customer relationship management system and realigned our compensation packages. Sales of our products, services and solutions to some of our customers are accomplished in part, through the efforts of third-party sales representatives. Through direct sales efforts, outreach and education, we plan to continue to enhance our relationships and enable further adoption of our products, technologies and solutions by end customers and key influencers, including municipal representatives, engineering firms, designers and other system specifiers. Our performance depends, in part, on our ability to attract, incentivize and retain third-party sales representatives that will be able to market and support our products effectively, and competing for sales personnel with established customer relationships intense.
Continued transition of our customers to a higher value-add service-based business model. Our goal is to provide "worry-free water" by combining our products and technologies with extensive service and distribution capabilities. We selectively target high value projects with opportunities for recurring business through service, parts and other aftermarket opportunities over the lifecycle of the process or capital equipment. In particular, we have developed a pipeline of smart, internet-connected monitoring technologies through the deployment of our Water One smart water platform that provides us with an increasing ability to handle our customers' complete water needs through on-demand water management, predictive maintenance and service response planning. Water One also enables us to transition our customers to more accurate pricing models based on usage, which otherwise would not have been possible without technological advancement. We estimate that approximately 1.6% of our industrial customers utilized our Water One technology in fiscal 2016. Our technology solutions provide
140
customers with increased stability and predictability in water-related costs, while enabling us to optimize our service route network and on demand offerings through predictive analytics, which we believe will result in market share gains, improved service levels, increased barriers to entry and reduced costs. Our future growth depends, in part, on our ability to develop or acquire new products, services and solutions, identify emerging technological trends in our target end markets and maintain the integrity of our information technology systems.
Drive margin expansion and cash flow improvements through continued focus on operational excellence and execution. Since fiscal 2014, we have realigned our organizational structure, achieved significant cost savings through operational efficiencies and revitalized our culture, which has energized our workforce and reduced employee turnover. This organizational realignment transformed our business into a streamlined organization focused on improved accountability, responsiveness and resulted in an overall lower cost structure. We have identified and are pursuing a number of discrete initiatives which, if successful, we expect could result in additional cost savings over the next three years. These initiatives include our ePro and supply chain improvement program to consolidate and manage global spending, our improved logistics and transportation management program, further optimizing our engineering cost structure, capturing benefits of our Water One remote system monitoring and data analytics offerings. Furthermore, as a result of significant investments we have made in our footprint and facilities, we believe have capacity to support our planned growth without commensurate increases in fixed costs.
Commercialize and drive adoption of nascent and newly acquired technologies by leveraging our sales channels and application expertise. We offer a full range of services, systems and technologies that we continually develop to meet our customers' evolving water lifecycle needs. We develop our technologies through in-house research, development and engineering and targeted tuck-in, technology-enhancing and geography-expanding acquisitions and have a reservoir of recently launched technologies and a pipeline of new offerings designed to provide customers with innovative, value-enhancing solutions. Furthermore, we have successfully completed eight technology-enhancing and geography-expanding acquisitions since April 2016 to add new capabilities and cross-selling opportunities in areas such as electrochemical and electrochlorination cells, regenerative media filtration, anodes, UV disinfection and aerobic and anaerobic biological treatment technologies. We must continue to develop and acquire new products, services and solutions to successfully compete in our markets.
We believe a key differentiator for our technology development program is our strong record of incorporating new technologies into the comprehensive solutions we provide to our customers across our platform. We are able to rapidly scale new technologies using our leading direct and third-party sales channels and our relationships with key influencers, including municipal representatives, engineering firms, designers and other system specifiers. Through our service network, we have a direct view of our customers' water needs which allows us to focus on developing and acquiring the most relevant and sought-after solutions.
We believe our continued investment in driving penetration of our recently launched technologies, robust pipeline of new capabilities and best-in-class channels to market will allow us to continue to address our customer needs across the water lifecycle.
Continue to evaluate and pursue accretive tuck-in acquisitions to add new technologies, attractive geographic regions and end-markets. As a complement to our organic growth initiatives, we view tuck-in acquisitions as a key element of our overall growth strategy which will enable us to accelerate our growth in our current addressable market, new geographies and new end market verticals. Our existing customer relationships, channels to market and ability to rapidly commercialize technologies provide a strong platform to drive growth in the businesses we acquire. To capitalize on these opportunities we have built an experienced team dedicated to mergers and acquisitions that has successfully completed eight technology-enhancing and geography-expanding acquisitions since April 2016, including the addition of capabilities in the attractive aquatics market, which we have typically financed through
141
borrowings under our revolving credit facility and cash on hand. Although we may not continue to identify suitable acquisition targets and implement our growth strategy, we currently have a pipeline which includes more than 60 potential targets, which has been developed proactively by our team as well as informed by our customer base.
Our Industrial Segment
Our Industrial Segment provides application-specific solutions and full lifecycle services for critical water applications. We focus on treating industrial process water, utility water and wastewater. Industrial process water requires specific purity standards, which are used in making goods in industries such as microelectronics, pharmaceuticals and health sciences and food and beverage, including ingredient water. Industrial utility water is used for critical industrial applications, including as boiler feed and cooling water. Industrial wastewater is effluent water discharged from plants or facilities which is treated before it is returned to the environment or recycled or reused within the water cycle. Our operations across the water cycle are complex and, if conducted improperly, may result in potential costs and liabilities, including as a result of environmental damage. Our comprehensive solutions are comprised of capital systems and related recurring aftermarket services, parts and consumables, along with long-term and short-term service contracts and emergency services. Our comprehensive capabilities range from discrete offerings to the provision of highly complex, fully integrated solutions. We are able to leverage our broad range of products and technologies to deliver a tailored solution that best addresses a specific customer's needs, including a growing portfolio of smart water technologies encompassed in our Water One platform. Key capital and related aftermarket service and product offerings include filtration, reverse osmosis, ion exchange and continuous deionization. As a result of our speed, capabilities and experience, we are a trusted partner to 25,000 industrial customers, including a substantial majority of Fortune 500 industrial companies. As water is a critical component in many industrial production processes, unavailability of proper water purity, specification or quality can lead to significant constraints, downtime and increased operating costs.
The cost of an installation can range from a few thousand dollars to a few million dollars and typically provides an ongoing service and aftermarket revenue opportunity that itself reaches or exceeds the original project cost. The service and aftermarket sales component is supported by our broad application and process expertise and what we believe to be the largest integrated industrial service network in North America. Our network is comprised of certified technicians and the largest fleet of mobile reverse osmosis and deionization water treatment systems in North America, based on management's estimate, and enables us to provide a complete range of services spanning from regular maintenance and emergency support to our unique Water One platform. Water One provides remote monitoring capabilities which enable us to optimize our routine service calls through predictive analytics and provide customers a more predictable, cost-efficient water solution. We offer services which include water on-demand, mobile solutions and smart water systems that leverage our extensive branch network, technical personnel and technology portfolio.
We partner with our industrial customers through our direct sales and service team, which is organized geographically and by market vertical and is complemented by an inside sales force, field sales engineers and a growing e-commerce platform. We primarily target three broad categories of customers in our Industrial Segment, principally based on their end markets and primary applications: Light Industries, Heavy Industries and Environmental Solutions.
142
Light Industries
Our light industries offerings include our usage-based, Water One deionized water service, preventative maintenance service contracts, integrated process and wastewater systems and aftermarket consumables and spare parts. We generally provide light industries services to general manufacturing, light industrial, pharmaceutical, food and beverage, microelectronics and health sciences customers.
Heavy Industries
Our heavy industries offerings include mobile, rapidly deployable services based on short-term operating contracts, "build-own-operate" outsourcing services and accompanying technological support, integrated process and wastewater systems and aftermarket consumables and spare parts. We generally provide heavy industries services to power generation, chemical processing, hydrocarbon processing and mining and pulp and paper customers.
Environmental Solutions
Our environmental solutions offerings include activated carbon, wastewater ion exchange and groundwater remediation solutions. We generally provide environmental solutions to hydrocarbon processing, chemical processing, food and beverage and municipal water customers.
Our Municipal Segment
Our Municipal Segment leverages its proven application expertise to provide engineered solutions and equipment for the treatment of wastewater, purification of drinking water and odor and corrosion control for municipalities. Our portfolio of solutions includes ultrafiltration systems, advanced biological treatment, clarifiers, aerators, odor and corrosion control services, equipment for new municipal plant builds and retrofit, rehabilitation and aftermarket parts and services for our extensive installed base. We have provided solutions across a large municipal installed base with capacities ranging from 25,000 gallons per day to over 100 million gallons per day. Our operations are focused within the U.S. market, with a presence in the United Kingdom, Australia, Canada and Singapore.
We maintain a comprehensive municipal representative network that broadly covers the U.S., providing us with a differentiated ability to influence specifications and the basis of design for new treatment facilities. We also maintain relationships with engineering firms, operators and other key influencers through our direct technical sales force to drive adoption of our offerings. We primarily target three broad categories of customers in our Municipal Segment, principally based on their end markets and primary application: Wastewater Treatment, Municipal Services and MEMCOR.
Wastewater Treatment
Our wastewater treatment offerings include advanced biological treatment, clarification, filtration, nutrient removal, odor and corrosion control, biosolid and field-erected biological wastewater treatment plant solutions. We generally provide wastewater treatment solutions to both municipal and industrial wastewater treatment facilities. We provide aftermarket and retrofit solutions to our extensive installed base.
Municipal Services
Our municipal service offerings include odor and corrosion control and disinfection capabilities, including advanced remote-monitoring and automated control solutions and multi-product liquid and vapor phase product combinations for wastewater collection. We also provide municipal service solutions for drinking water treatment and distribution.
143
MEMCOR
Our MEMCOR membrane technology offerings include CPII membrane systems, membrane bioreactor systems and XP and XP-E technologies. These include custom solutions built from standard components, modular designs for flexibility and fast installation and membrane modules for aftermarket replacement. We generally provide MEMCOR solutions to municipal drinking water treatment facilities, municipal and industrial wastewater treatment facilities and industrial utility and process water facilities.
Our Products Segment
Our Products Segment sells differentiated technologies to a diverse set of water treatment system specifiers, integrators and end users globally. Our offerings are highlighted by our filtration and disinfection, electrodeionization and electrochlorination technologies, separation technologies and anodes offerings. Our filtration and disinfection offerings include our Defender line of products, which is a regenerative media filtration leader in the commercial aquatics market. Our IONPURE electrodeionization solutions allow customers to achieve ultrahigh purity water without the use of chemicals in the treatment process. Our electrochlorination products provide extensive water treatment solutions for the maritime, oil and gas and power markets. We also have extensive capabilities in anode technologies, cathodic protection, solid and liquid separation technologies and various aftermarket parts, consumables and accessories. All of our offerings are highly scalable and designed to meet current and future water treatment needs, with a focus on generating repeat business from our customers. We generally service the equipment we provide our customers; however, their failure to properly use, safeguard or maintain their equipment or product defects or unanticipated use of our products could result in liability to us.
Our portfolio of technologies and products are sold either as discrete offerings or as components of broader solutions through our Industrial and Municipal Segments. Our Products Segment also sells externally to a customer base comprised of globally located OEMs, integrators, regional distributors, customers, regional engineering firms and various other end users that we reach through multiple established sales and aftermarket channels. We target customers in our Products Segment principally based on their end markets and primary application: Aquatics and Disinfection, Process and Drinking Water, Electrochlorination, Separation Technology and Anodes.
Aquatics and Disinfection
Our aquatics and disinfection products include a wide range of filtration (regenerative media filters, high rate sand filters, microsand filters and screen filters), chlorination and UV disinfection systems, analyzers, controllers and related accessories. We sell to commercial aquatics, municipal drinking water, industrial and light manufacturing and commercial customers worldwide. Primary applications include filtration and disinfection of municipal and recreational pools and leisure facilities, fountains and water features and recreational water and waterparks, gas chlorination, UV and on-site chlorination and disinfection and water chemistry measurement and control for municipal drinking water, as well as pre-treatment and purification systems where ultrapure water polishing is required.
Process and Drinking Water
Our process and drinking water products include chemical-free ultrafiltration, microelectronic processing technologies and desalination solutions. We generally provide these products to municipal, power, microelectronic processing, solar, hydrocarbon and chemical processing and pharmaceutical customers. Primary applications include high purity process water for use in pharmaceutical, laboratory and microelectronic processing plants and the removal of dissolved salts from seawater, brackish water and municipal wastewater.
144
Electrochlorination
Our electrochlorination products are used with seawater for on-site sodium hypochlorite generating systems for maritime, oil and gas, power, military and ballast water customers. Our maritime growth prevention systems are used on military and commercial ships and in offshore oil and gas applications, and our ballast water management systems enable ships' owners and operators in all global waters to safely comply with stringent U.S. Coast Guard and future International Maritime Organization regulations.
Separation Technology
Our products separate solids from liquids in a variety of slurries, for either disposal or reuse. We generally provide separation technology products and solutions to power, mining, microelectronics, solar, heavy and light industrial and municipal customers, for applications including the separation of solids from liquids in mining companies' tailings ponds and the separation and recovery of minerals from slurry for further processing within mineral companies' manufacturing processes.
Anodes
We produce custom-designed, state-of-the-art mixed-metal oxide anodes, provide recoating and repair services to our external customers and supply the anodes used across our own internal processing capabilities. We provide anode products and solutions to mining, chemical processing, light industrial and microelectronics customers for primary applications including biotechnology, water treatment, cathodic protection, seawater electrolysis, metal finishing and electroplating and swimming pool chlorination.
For financial information regarding our reportable segments, see Note 21 to our audited financial statements included elsewhere in this prospectus.
Customers and Suppliers
Customers
We serve three primary market verticals: (i) industrial, (ii) commercial and (iii) municipal. Industrial and commercial customers vary in size, scope and the complexity of their water treatment needs and include small manufacturing clients with a single facility, large commercial waterparks and multinational corporations with a significant global footprint. The municipal market consists of potable water and wastewater treatment solutions that are sold to municipalities and private companies operating under a concession agreement to own and operate a treatment facility on behalf of a municipality. We serve each market with a full range of solutions, services, technologies and aftermarket offerings.
The industrial market is comprised of direct end market distribution channels. The commercial market includes a variety of routes to market including direct and third-party channel relationships. The municipal market is comprised of a wide range of drinking and wastewater treatment facilities.
As of June 30, 2017, we had over 38,000 customers spanning a diverse range of industries and include the twenty largest U.S. companies in each of the pharmaceutical, hydrocarbon processing, power, chemical and food and beverage industries as well as U.S. wastewater sites and global drinking water treatment sites. We also have customers in the health science, microelectronics, drinking water, wastewater, general manufacturing, commercial aquatics, maritime and other industries. We provide products, services and solutions to federal, state and local government customers both directly and indirectly as a supplier to general contractors. In the fiscal year ended September 30, 2016, our government contracts and subcontracts (i.e., sales to third parties who are prime contractors to federal, state or municipal governments) accounted for no more than 24% of our revenue. Many of our
145
government contracts contain a termination for convenience clause, regardless of whether we are the prime contractor or a subcontractor. Upon a termination for convenience, we are generally able to recover the purchase price for delivered items and reimbursement of allowable work-in-process costs. See "Risk Factors—Risks Relating to Our Business—Our contracts with federal, state and local governments may be terminated or adversely modified prior to completion, which could adversely affect our business". In the industrial market we served over 25,000 customers as of June 30, 2017, including a substantial majority of the industrial companies within the Fortune 500. In the municipal market, we had equipment installed in over 40% of the U.S. municipal wastewater sites as of June 30, 2017.
We strengthen our customer relationships through our large service branch network and strong brand value, and we focus on maintaining relationships with influencers such as municipal representatives, engineering firms, designers and other system specifiers, and many of our customer relationships span over twenty years. As of June 30, 2017, we had over 25,000 industrial contracts, which include both long-term and short-term service contracts and have an average length of 1.7 years and a 98% rate of renewal. During fiscal 2016, no single customer accounted for more than 1% of our revenues, and our top ten customers accounted for approximately 7% of our revenues.
Suppliers
We maintain a cost-effective, diversified procurement program through strong relationships with strategic suppliers across key inputs. We have implemented ePro, our supply chain excellence initiative that centralizes and standardizes purchasing across the organization. The top materials in our supply chain include metal, calcium nitrate, membranes and ion exchange resin. Further, we seek to insource certain products that align with our existing core competencies, including our manufacturing capabilities, and further enable us to provide our customers with a complete lifecycle solution. We seek sources of supply from multiple suppliers and often from multiple geographies, and we believe that our supply chain is well positioned to remain stable and cost-effective.
Sales and Marketing
Our sales organization is positioned across our segments to drive top-line growth and increase market share for our Company. Our network includes third-party representatives, internal general managers, sales directors, sales engineers, third-party distributors and other personnel who support our day-to-day sales and marketing operations.
Industrial Segment
We market our offerings through our direct sales and service team, which is organized geographically and by end market and is complemented by an inside sales force, field sales engineers and a growing e-commerce platform. Our Industrial Segment sales organization focuses on direct sales with a market-vertical focus across geographic, strategic and e-commerce channels to market. As of June 30, 2017, our Industrial Segment services network consisted of 80 industrial service branches across North America, with 624 field service and 149 engineering employees, and over 90% of our customers are within two hours' travel of one of our branches.
Municipal Segment
We maintain a comprehensive municipal representative network in the United States, providing us with a unique ability to influence specifications and the basis of design for new treatment facilities. We also maintain relationships with engineering firms, operators and other key influencers through our direct technical sales force to drive adoption of our offerings. As of June 30, 2017, our Municipal Segment sales organization consisted of an independent representative network supported by our
146
approximately 110 field service technicians and approximately 130 sales personnel, organized across wastewater treatment, municipal services and MEMCOR structures.
Products Segment
Our Products Segment customer base includes water treatment designers, OEMs, engineering firms, integrators and our own Industrial and Municipal Segments. Our Products Segment sales organization consists of five direct and indirect sales and aftermarket channels: (i) our direct and third-party aquatics and disinfection sales representatives target commercial aquatics, municipal and industrial water treatment in Americas, Europe, Middle East and Africa and Asia Pacific geographies, (ii) our process and drinking water sales channels work with non-exclusive OEMs and with our Industrial Segment to build small, "skidded" solutions for global industrial customers, to get our modular solutions specified into larger units and projects, (iii) our electrochlorination sales managers typically work with representatives of ship builders, shipyards, ship owners, service providers and manufacturers to have our products, services and solutions specified into commercial and military ships and offshore oil and gas rigs, (iv) our separation technology channel managers and sales representatives work with a large network of third-party manufacturers' representatives that are exclusive to specific territories or industries and leverage direct sales in industries not covered by third-party representatives and (v) our direct sales force sell our anodes into Americas, Europe and China geographies, and opportunistically cross-sell electrocatalytic products to our anode customers. As of June 30, 2017, we had active relationships with more than 200 OEM partnerships and managed over 300 channel partners.
Research, Development and Engineering
We utilize a disciplined, stage-gate process—consisting of development, field test, commercialization, supply chain and sourcing decisions—to identify and develop new technologies to commercialize, focus our efforts on and engage early with supply-chain management to promote profitability. We focus on tuck-in acquisitions as additional resources for new product innovation and development.
Our global research, development and engineering footprint includes six facilities located in the United States, the Netherlands, Germany, Singapore and Australia, staffed with managers, scientists, researchers, engineers and technicians, along with partnerships spanning leading universities research centers and other outside agencies. We spent approximately $22.9 million in fiscal 2016 on research, development and engineering, primarily related to employee costs. In fiscal 2016, excluding parts and service, approximately 47% of our revenue was directly or indirectly covered by our granted or pending patents.
Information Technology
Our information technology systems consist of enterprise management, e-commerce, customer relationship and field service management, customer quoting and billing, environmental compliance, business and operational support, procurement and sales force management systems. We utilize an e-commerce platform that makes our products available to customers at all times, and we provide our e-commerce customers with both general and customer-specific portals, which provide customized pricing for strategic customer accounts. Further, in connection with our ePro initiative, we have adopted SAP Ariba to assist in automating and centralizing our procurement process. We update and build our information technology infrastructure through further investments focused on cost efficiencies, reliability, functionality and scalability.
147
Intellectual Property
Our intellectual property and proprietary rights are important to our business. We currently have over 1,250 granted or pending patents, which in total directly or indirectly covered approximately 47% of our revenue for fiscal 2016, excluding parts and service. We undertake to strategically and proactively develop our intellectual property portfolio by pursuing patent protection, obtaining copyrights and registering our trademarks in the United States and in foreign countries. We currently rely primarily on patent, trademark, copyright and trade secret laws, and control access to our intellectual property through license agreements, confidentiality procedures, non-disclosure agreements with third parties, employment agreements and other contractual rights, to protect our intellectual property rights.
Competition
Our industry is highly fragmented, and includes a number of regional and niche-offering focused competitors. Competition is largely based on product performance, reliability and innovativeness of products, services and solutions, application expertise and process knowledge, brand reputation, energy and water efficiency, product compliance with regulatory and environmental requirements, product lifecycle cost, scalability, timeliness of delivery, proximity of service centers to our customers, effectiveness of our distribution channels and price. We believe that we are well-positioned in our industry due to our application expertise and process knowledge, our trusted brands, our broad product lines and the high quality of our products, services and solutions, our advanced technologies, our large service network and strong support capabilities, our manufacturing capabilities and our extensive multi-channel distribution. Within each of our segments and the various businesses that comprise them, we compete with a fragmented range of companies, but do not have any individually key competitors.
Backlog
Backlog represents the total amount of revenue we expect to receive as a result of contracts and orders awarded to us. However, because many of our contracts and orders are subject to reduction, cancellation or termination at the option of our customer, backlog is not an indication of our future performance. In 2017 we implemented a new methodology to record service orders to improve visibility of backlog and revenues associated with service contracts. Under this new methodology a service contract is recorded as an order when both parties have agreed to the terms and conditions, including contract value and length. The value assigned to the order is based on the fixed portion of the contract for the entire contract term. Utilizing our new methodology, as of June 30, 2017, our backlog was approximately $664 million.
Employees
As of June 30, 2017, we had approximately 4,000 employees. Of these employees, 58% were full-time salaried level staff and the remaining employees consisted of a mix of full-time and part-time hourly workers. Approximately 74% of our employees work in our U.S. operations and approximately 26% work in foreign operations. None of our facilities in the United States or Canada are covered by collective bargaining agreements. As is common in Germany and the Netherlands, our employee populations there are represented by works councils. We are not involved in any material disputes with our employees and believe that relations with our employees and, to the extent applicable, with our organized labor unions, are good.
Properties
We operate 160 locations located in the United States, Canada, the United Kingdom, the Netherlands, Germany, Australia, China and Singapore, including 18 manufacturing facilities, six
148
research and development facilities and 87 service branches. Of our facilities, we own 23 properties and lease 137 properties. Our North American presence includes 11 resin regeneration plants, three carbon reactivation plants and a wastewater ion exchange facility. As of June 30, 2017, the covered square footage of our facilities is equal to an aggregate of approximately 3.3 million square feet.
Geographic Regions
For financial information regarding our geographic regions, see Note 17 to our audited financial statements included elsewhere in this prospectus.
Insurance
We maintain insurance policies to cover directors' and officers' liability, fiduciary, crime, special accident, property, business interruption, cargo, workers' compensation, automobile, general liability, environmental, umbrella and excess liability insurance.
All of our insurance policies are with third-party carriers and syndicates with financial ratings of an A or better. We and our global insurance broker regularly review our insurance policies and believe the premiums, deductibles, coverage limits and scope of coverage under such policies are reasonable and appropriate for our business. The continued availability of appropriate insurance policies on commercially reasonable terms is important to our ability to operate our business and to maintain our reputation. See "Risk Factors—Risks Relating to Our Business—Our operations are subject to various hazards that may cause personal injury or property damage and increase our operating costs, and which may exceed the coverage of our insurance or for which we are not insured."
Government Regulation
We are subject to extensive and varied laws and regulations in the jurisdictions in which we operate, including those relating to anti-corruption and trade, data security and privacy, employment, workplace safety, public health and safety, product safety, intellectual property, transportation, zoning and fire codes. We operate our business in accordance with standards and procedures designed to comply with applicable laws and regulations.
In particular, our international operations subject us to laws and regulations related to anti-corruption and trade, including those related to export and import compliance, anti-trust and money laundering. Our policies mandate compliance with these laws and regulations, and we have established policies and procedures designed to assist us and our personnel in compliance with applicable United States and international laws and regulations. However, any violation of such laws, regulations or policies could result in substantial fines, sanctions, civil and/or criminal penalties, imprisonment, disgorgement of profits, debarment from government contracts and curtailment of operations in certain jurisdictions, and might materially adversely affect our business, financial condition, results of operations or prospects. See "Risk Factors—Risks Relating to Our Business—Failure to comply with applicable anti-corruption and trade laws, regulations and policies, including the U.S. Foreign Corrupt Practices Act, could result in fines and criminal penalties, causing a material adverse effect on our business, financial condition, results of operations or prospects."
In certain countries where we operate, our employees are represented by a works council, as required by local law. In such countries, we are required to consult and seek the consent or advice of these works councils in connection with certain corporate decisions, such as a major restructuring, a change of control or changes to local management. Certain other decisions that directly involve employment matters applicable either to all employees or certain groups of employees may also require works council approval. Further, certain of our international operations offer employees defined-benefit plans in compliance with applicable local legal provisions requiring payments of, among other things, mandatory pension payments or allocations for severance pay. None of our U.S. employees are
149
represented by unions or works councils, and our U.S. operations do not maintain defined-benefit plans.
In addition, there are numerous U.S. federal, state and local laws and regulations and foreign laws and regulations regarding data security, privacy and the collection, sharing, use, processing, disclosure and protection of personal information and other user data, the scope of which is changing, subject to differing interpretations, and may be inconsistent among different jurisdictions. If our efforts to protect the security of information about our customers, suppliers and employees are unsuccessful, a significant data security breach may result in costly government enforcement actions, private litigation and negative publicity resulting in reputation or brand damage with customers, and our business, financial condition, results of operations or prospects could suffer. See "Risk Factors—Risks Relating to Our Business—If we experience a significant data security breach or fail to detect and appropriately respond to a significant data security breach, our business and reputation could suffer." Further, governments are continuing to focus on privacy and data security and it is possible that new privacy or data security laws will be passed or existing laws will be amended in a way that is material to our business.
Environmental Matters
The geographic breadth of our facilities and the nature of our operations subject us to extensive environmental, health and safety laws and regulations in jurisdictions throughout the world. Such laws and regulations relate to, among other things, emissions to air, the treatment and discharge of drinking water and wastewater, the discharge of hazardous materials into the environment, the handling, storage, use, transport, treatment and disposal of hazardous materials and solid, hazardous and other wastes, product safety and workplace health and safety. These laws and regulations impose a variety of requirements and restrictions on our operations and the products we distribute. The failure by us to comply with these laws and regulations could result in fines, penalties, enforcement actions, third-party claims, damage to property or natural resources and personal injury claims, requirements to investigate or cleanup property or to pay for the costs of investigation or cleanup or regulatory or judicial orders requiring corrective measures, including the installation of pollution control equipment, remedial actions or the pulling of products from the market, and could negatively impact our reputation with customers. We are not aware of any pending environmental compliance or remediation matters that, in the opinion of management, are reasonably likely to have a material effect on our business, financial condition, results of operations or prospects. However, environmental, health and safety laws and regulations applicable to our business, the products we distribute, the services we provide and the business of our customers, and the interpretation or enforcement of these laws and regulations, are constantly evolving and it is impossible to predict accurately the effect that changes in these laws and regulations, or their interpretation or enforcement, may have upon our business, financial condition, results of operations or prospects. Should environmental, health and safety laws and regulations, or their interpretation or enforcement, become more stringent, our costs could increase and significant capital expenditures or operational restrictions could be required, which may have an adverse effect on our business, financial condition, results of operations or prospects. However, such increased stringency could also increase demand for our products, services and solutions, which assist various industries and municipalities in meeting environmental and safety requirements for the treatment and discharge of drinking water and wastewater. In addition, increased public awareness of the presence and human health impacts of man-made chemicals and naturally occurring contaminants in drinking water may increase demand for our municipal service offerings. Correspondingly, if stringent laws or regulations are delayed or are not enacted, or repealed or amended to be less stringent, or enacted with prolonged phase-in periods, or not enforced, then demand for our products and services may also be reduced.
The nature of our operations, which involve the handling, storage, use, transport, treatment and disposal of hazardous materials and solid, hazardous and other wastes, exposes us to the risk of liability and claims associated with contamination at our current and former facilities or sites where we have
150
disposed of or arranged for the disposal of waste, or with the impact of our products and services on human health and safety and the environment. Laws and regulations with respect to the investigation and remediation of contaminated sites can impose joint and several liability for releases or threatened releases of hazardous materials upon statutorily defined parties, including us, regardless of fault or the lawfulness of the original activity or disposal. We have been subject to claims and remediation obligations, including having been named as a potentially responsible party, in certain proceedings initiated pursuant to the Comprehensive Environmental Response, Compensation, and Liability Act, or CERCLA, and similar state and foreign laws, regulations and statutes, and may be named a potentially responsible party in other similar proceedings in the future. Unforeseen expenditures or liabilities may arise in connection with such matters.
Legal Proceedings
From time to time, we are subject to various claims, charges and litigation matters that arise in the ordinary course of business. We believe these actions are a normal incident of the nature and kind of business in which we are engaged. While it is not feasible to predict the outcome of these matters with certainty, we do not believe that any asserted or unasserted legal claims or proceedings, individually or in the aggregate, will have a material adverse effect on our business, financial condition, results of operations or prospects.
151
Executive Officers and Directors
The following table sets forth information about our executive officers and directors, including their ages as of June 30, 2017. With respect to our directors, each biography contains information regarding the person's service as a director, business experience, director positions held currently or at any time during the past five years, information regarding involvement in certain legal or administrative proceedings, and the experience, qualifications, attributes or skills that caused our board of directors to determine that the person should serve as a director of our company.
Name
|
Age | Position | |||
|---|---|---|---|---|---|
Ronald C. Keating |
49 | President, Chief Executive Officer and Director | |||
Benedict J. Stas |
49 | Executive Vice President, Chief Financial Officer & Treasurer | |||
Rodney Aulick |
50 | Executive Vice President, Industrial Segment President | |||
Malcolm Kinnaird |
51 | Executive Vice President, Municipal Segment President | |||
Kenneth Rodi |
47 | Executive Vice President, Products Segment President | |||
Vincent Grieco |
48 | Executive Vice President, Secretary and General Counsel | |||
James Irwin |
45 | Executive Vice President, Corporate Development and Mergers & Acquisitions | |||
James Kohosek |
58 | Executive Vice President, Corporate Strategy & Business Operations | |||
Edward May |
49 | Executive Vice President, Chief Supply Chain Officer | |||
Anthony J. Webster |
48 | Executive Vice President, Chief Human Resources Officer | |||
Martin Lamb |
57 | Chairman of the Board and Director | |||
Nick Bhambri |
53 | Director | |||
Gary Cappeline |
68 | Director | |||
Judd Gregg |
70 | Director | |||
Brian R. Hoesterey |
49 | Director | |||
Vinay Kumar |
39 | Director | |||
Ronald C. Keating
Mr. Keating has served on our board of directors and as our President and Chief Executive Officer since December 2014. Prior to joining Evoqua, Mr. Keating served as President and Chief Executive Officer of Contech Engineered Solutions, an infrastructure site solutions provider, from 2007 to 2014. Before heading Contech, Mr. Keating served as President of the Metalworking Solutions and Services Group of Kennametal Inc., a supplier of tooling and industrial materials. He had also held previous roles at Kennametal as the Vice President and General Manager of the Energy, Mining and Construction Group and for the Electronics Products Group from 2001 to 2007. Mr. Keating started his career at Ingersoll-Rand Inc. in 1992 where he held various roles of increasing responsibility until departing in 2001. Mr. Keating is presently on the board of directors of US Ecology Inc., a publicly traded company. Mr. Keating received an M.B.A. from the Kellogg School of Management at Northwestern University and received a B.S. in Industrial Distribution from Texas A&M University. Mr. Keating was selected to serve on our board of directors because of the perspective, management, leadership experience and operational expertise in our business that he has developed as our President and Chief Executive Officer.
Benedict J. Stas
Mr. Stas has served as our Executive Vice President, Chief Financial Officer and Treasurer since March 2015. Prior to joining Evoqua, Mr. Stas held a variety of senior financial and business roles at Kennametal Inc., a supplier of tooling and industrial materials, from 1997 to 2015, including roles as Vice President Finance of Business Groups from 2010 to 2013 and as Vice President of Manufacturing
152
for the Industrial Segment from 2014 to 2015. While at Kennametal Inc., Mr. Stas also served as Chief Financial Officer of the Industrial Business Group, Chief Financial Officer of Kennametal Europe GmbH, Director of Global Manufacturing Finance, Controller of Metalworking Americas, and Senior Financial Analyst for Global Financial Sales and Marketing from 1997 to 1999. Prior to joining Kennametal Inc., Mr. Stas worked for DuPont Co., as a Plant Controller, Accountant and Team Leader, from 1991 to 1997. Mr. Stas received an M.B.A. from Duquesne University and received a B.S. in Business Administration from Drexel University.
Rodney Aulick
Mr. Aulick has served as our Executive Vice President, Industrial Segment President since October 2015. Prior to joining Evoqua in October 2001, Mr. Aulick served as a Regional Manager of Chem-Aqua, a specialty chemical company in water treatment, from 1997 to 2001. Mr. Aulick attended Northwestern University, Kellogg School of Management's Executive Management Program from 2001 to 2003.
Malcolm Kinnaird
Mr. Kinnaird has served as our Executive Vice President, Municipal Segment President since March 2014. Prior to joining Evoqua in 2012, Mr. Kinnaird served as Senior Vice President of Marketing, Sales and Corporate Development at Watts Water Technology from 2010 to 2012. Mr. Kinnaird has held leadership roles at multiple companies, including as General Manager of Pentair plc Residential and Commercial Water Business from 2006 to 2009, as Vice President of Water Treatment for Cytec Industries Inc. from 2000 to 2005, and in various industrial water Sales, Marketing and Management roles at Nalco from 1989 to 1999. Mr. Kinnaird received a B.S. in Chemistry and an Executive M.B.A., both from the University of Pittsburgh.
Kenneth Rodi
Mr. Rodi has served as our Executive Vice President, Products Segment President since October 2016. Prior to joining Evoqua in May 2016, Mr. Rodi served as Chief Executive Officer of Neptune-Benson LLC from 2013 to 2016. Prior to joining Neptune-Benson, Mr. Rodi held leadership roles at multiple companies, including as President, Food and Beverage Systems at SPX Corporation from 2011 to 2013, President of SPX Flow Technology Europe, Middle East and Africa from 2009 to 2011 based out of the UK and President of SPX Process Equipment from 2007 to 2009. Mr. Rodi also served as Vice President of Business Development for SPX Flow Technology from 2005 to 2007. Mr. Rodi received a B.S. in Accounting from Marquette University.
Vincent Grieco
Mr. Grieco has served as our Executive Vice President, Secretary and General Counsel since January 2015, and as acting General Counsel since we became an independent company in January 2014. Mr. Grieco joined our Company in January 2003 and served as a senior counsel prior to being named acting General Counsel. Prior to joining Evoqua, Mr. Grieco was a member of the corporate practice of Morgan Lewis & Bockius LLP from 1997 to 2002 and at Dickie, McCamey & Chilcote from 1993 to 1997. Mr. Grieco received a J.D. from the University of Virginia and received a B.S. in Economics from St. Vincent College.
James Irwin
Mr. Irwin has served as our Executive Vice President, Corporate Development and Mergers & Acquisitions since May 2016. Prior to joining Evoqua, Mr. Irwin worked for A. Schulman, Inc., an international supplier of high-performance plastic compounds and resins, where he served as Vice
153
President Corporate Business Development from 2014 to 2016. Mr. Irwin also spent four years with Cliffs Natural Resources Inc., from 2009 to 2013, where he served in various mergers and acquisitions, business development and strategy roles including Senior Director—M&A and Business Development. Mr. Irwin started his career in 1995 with KeyBanc Capital Markets where he held various roles of increasing responsibility related to mergers and acquisitions and private equity. Mr. Irwin received a M.B.A. from the Weatherhead School of Management at Case Western Reserve University and a B.B.A. from the University of Toledo.
James Kohosek
Mr. Kohosek has served as our Executive Vice President, Corporate Strategy & Business Operations since January 2017. Prior to joining Evoqua in January 2016, Mr. Kohosek held senior management positions at a number of companies, including as President, Infrastructure Division of Kennametal Inc. from 2014 to 2015, as Vice President and Chief Financial Officer, Industrial Technologies Sector of Ingersoll Rand plc from 2002 to 2007 and as President of Westinghouse Communications from 1998 to 2001. Mr. Kohosek received a B.S.B.A. in Accounting and a B.S.B.A. in Finance, both from Shippensburg University.
Edward May
Mr. May has served as our Executive Vice President, Chief Supply Chain Officer since October 2014. Prior to joining Evoqua, Mr. May led the Global Supply Chain organization for the Gilbarco Veeder-Root operating company at Danaher Corporation from 2012 to 2014. Prior to joining Danaher, Mr. May served as Vice President of Global Supply Chain at Pall Corporation from 2006 to 2011. Mr. May received a B.S. in Operations Management from the Quinlan School of Business, Loyola University Chicago. He also received an M.B.A. in Corporate Strategy from the Kellstadt Graduate School of Business, DePaul University.
Anthony J. Webster
Mr. Webster has served as our Executive Vice President, Chief Human Resource Officer since March 2016. Prior to joining Evoqua, Mr. Webster served as Vice President of Human Resources, Europe & Americas, for Glaxo Smith Kline Consumer Health, a joint venture between Novartis and Glaxo Smith Kline plc, from 2015 to 2016 and as Senior Vice President and Global Head of Human Resources for Novartis Consumer Health from 2011 to 2015. Mr. Webster has held senior human resources roles with numerous companies, including as Regional Vice President, Human Resources, EMEA for Bristol-Myers Squibb from 2008 to 2011; as Senior Director, Research & Development for Bristol-Myers Squibb from 2006 to 2008; as Director, Human Resources, Latin America & Canada for Bristol-Myers Squibb from 2004 to 2006; as Director, Global Business Support Functions for Mead Johnson Nutritionals from 2001 to 2004; in senior human resources and labor relations management capacities for Phelps Dodge Corporation from 1994 to 2001; and as Manager, Human Resources for Consolidation Coal Co. from 1992 to 1994. Mr. Webster received a B.S. in Business Administration and received an M.S. in Industrial and Labor Relations from West Virginia University.
Martin Lamb
Mr. Lamb has served as Chairman of our Board since March 2014. Mr. Lamb retired as Chief Executive of IMI plc in December 2013, after 13 years in this position and 33 years with IMI plc, a publicly traded company on the London Stock Exchange ("LSE"). He is presently Chairman and interim Chief Executive of Rotork plc, a publicly traded company on the LSE. He also serves on the European Advisory Board of AEA. Previously, Mr. Lamb has served as a Non Executive Director on the board of Severn Trent plc, from 2008 to 2016; and as a Non Executive Director of Spectris plc, from 1999 to 2006; both publicly traded companies on the LSE. Mr. Lamb received a B.S. in
154
Mechanical Engineering from Imperial College, London and an M.B.A. from Cranfield Business School. Mr. Lamb was selected to serve as Chairman of our board of directors because of his experience managing and developing large businesses and complex projects in all parts of the world and his engineering and industrial expertise.
Nick Bhambri
Mr. Bhambri has served on our board of directors since 2014. From 2007 to 2011, Mr. Bhambri was President and Chief Executive Officer of MECS Inc., a process technology provider to the sulfuric acid industry serving the refining, metallurgical, uranium and fertilizer industries. Mr. Bhambri is a member of the American Securities Executive Council, a group of business executives and industry experts. Mr. Bhambri served on the board of MPG Performance Group, prior to the company being acquired by American Axle & Manufacturing Inc., in 2017. He is also a past president of the Olin EMBA alumni board and member of the Olin National Council at Washington University in St. Louis. Mr. Bhambri received a B.S. in Mechanical Engineering and an M.B.A., both from Washington University in St. Louis. Mr. Bhambri was selected to serve on our board of directors because of his management and leadership experience and his technology and industrial expertise.
Gary Cappeline
Mr. Cappeline has served on our board of directors since 2014. Mr. Cappeline currently serves as an Operating Partner of AEA. Prior to joining AEA in 2007, Mr. Cappeline was President and Chief Operating Officer of Ashland Inc., a diversified company, to which he returned in 2002 after service as Group VP of Engelhard Corporation from 1997 to 1999 and as President, Chemicals of Honeywell International from 1998 to 2000. He also served as chemical industry partner at Bear Stearns Merchant Bank from 2000 to 2001. Mr. Cappeline currently serves as Lead Director on the board of directors of Innophos Holdings, Inc., a publicly traded company, where he has been a member of the Compensation Committee for the last ten years. He previously served as a board and executive committee member of the American Chemistry Council, a chemical industry trade association, a director of Unifrax Corporation, a manufacturer of high temperature insulation products, chairman and a director of Houghton International Inc., a manufacturer of metal working fluids, a director of Shoes for Crews, LLC, a manufacturer of slip resistant footwear, a director of RelaDyne Inc., a distributor of lubricants and fuels and a director of Tampico Beverages Inc., a manufacturer of fruit drinks. Mr. Cappeline received B.S. and M.S. degrees in Chemical Engineering from the City College of New York and attended Harvard Business School's Executive Management Program in 1993. Mr. Cappeline was selected to serve on our board of directors because he possesses particular knowledge and experience in corporate finance, strategic planning and investments.
Judd Gregg
Senator Gregg has served on our board of directors since 2014. He has spent over three decades in public office, most recently serving as the United States Senator from the State of New Hampshire from January 1993 until January 2011. During his tenure in the Senate, Senator Gregg served on a number of key Senate Committees including Budget, Appropriations, Government Affairs, Banking, Housing and Urban Affairs, Commerce, Science and Transportation, Foreign Relations and Health, Education, Labor and Pensions. He has served as the Chairman and Ranking Member of the Health, Education, Labor and Pensions Committee and the Chairman and Ranking Member of the Senate Budget Committee as well as chairman of various sub-committees. Senator Gregg served as a chief negotiator of the Emergency Economic Stabilization Act of 2008 and was the lead sponsor of the Deficit Reduction Act of 2005, and, along with the late Senator Ted Kennedy, co-authored the No Child Left Behind Act of 2001. In March 2010, Senator Gregg was appointed to President Obama's bipartisan National Commission on Fiscal Responsibility and Reform. From 1989 to 1993, Senator
155
Gregg was the Governor of New Hampshire and prior to that was a U.S. Representative from 1981 to 1989. Senator Gregg was named as Dartmouth College's first distinguished fellow and he teaches at the college and its graduate schools. He serves as a director of Honeywell International Inc., a publicly traded company, and previously served as a director of Intercontinental Exchange, Inc. from 2011 to 2013. Senator Gregg received an A.B. from Columbia University and a J.D. and an L.L.M. from Boston University. Senator Gregg was selected to serve on our board of directors because of his experience in local, state, national and international issues and in government, public policy, financial regulation, tax, capital markets, science, renewable technology and research, environmental protection and conservation and foreign policy and his insight into fiscal affairs, governmental relations, legislative and regulatory issues.
Brian R. Hoesterey
Mr. Hoesterey has served on our board of directors since 2014. Mr. Hoesterey is a Partner with AEA, which he joined in 1999, where he focuses on investments in the specialty chemicals and value-added industrial products sectors. Prior to joining AEA, Mr. Hoesterey was with BT Capital Partners, the private equity investment vehicle of Bankers Trust from 1998 to 1999. Mr. Hoesterey has also previously worked for McKinsey & Co. from 1994 to 1997 and the investment banking division of Morgan Stanley from 1989 to 1993. Mr. Hoesterey is currently a director of At Home Group Inc., GMS, Inc., Swanson Industries and VC GB Holdings. He also serves on the Board of Trustees for Madison Square Boys and Girls Club. Mr. Hoesterey was previously on the board of CPG International, Houghton, SRS, Henry Company, Unifrax, Pregis and Noveon. Mr. Hoesterey currently serves on the Oversight Committee for Patagonia Sur, a for-profit venture that invests in, protects and enhances scenically remarkable and ecologically valuable properties in Chilean Patagonia. Mr. Hoesterey received a B.B.A. in Accounting, summa cum laude, from Texas Christian University and received an M.B.A. with honors from Harvard Business School. Mr. Hoesterey was selected to serve on our board of directors because he possesses particular knowledge and experience in corporate finance, strategic planning and investments.
Vinay Kumar
Mr. Kumar has served on our board of directors since 2014. He is a Partner with AEA, which he joined in 2004, where he has focused on investments in the value-added industrial, specialty chemical and business services sectors. Mr. Kumar was previously on the board of Dematic and involved in AEA's investments in CPG International, Cogent Healthcare and Pregis. Prior to joining AEA, Mr. Kumar was a strategy consultant with Bain & Company in San Francisco and London from 2001 to 2004. Mr. Kumar received an A.B. in History and Science with honors from Harvard University. Mr. Kumar was selected to serve on our board of directors because he possesses particular knowledge and experience in corporate finance, strategic planning and investments.
Board Composition
Our board of directors consists of seven directors. Each director will serve until a successor is duly elected and qualified or until his or her death, resignation or removal. There are no family relationships between any of our directors or executive officers. Our executive officers are elected by and serve at the discretion of the board of directors.
Our amended and restated certificate of incorporation and amended and restated bylaws provide that the authorized number of directors may be changed only by resolution of the board of directors. Our amended and restated certificate of incorporation and amended and restated bylaws also provide that our directors may be removed only for cause, and that any vacancy on our board of directors, including a vacancy resulting from an enlargement of our board of directors, may be filled only by vote of a majority of our directors then in office.
156
In accordance with the terms of our amended and restated certificate of incorporation and amended and restated bylaws, our board of directors will be divided into three classes, Class I, Class II and Class III, with members of each class serving staggered three-year terms. The members of the classes will be divided as follows:
- •
- the Class I directors will be Judd Gregg and Nick Bhambri, and their terms will expire at the annual meeting of stockholders for fiscal
2018;
- •
- the Class II directors will be Ronald C. Keating and Martin Lamb, and their terms will expire at the annual meeting of
stockholders for fiscal 2019; and
- •
- the Class III directors will be Vinay Kumar, Brian R. Hoesterey and Gary Cappeline, and their terms will expire at the annual meeting of stockholders for fiscal 2020.
The classification of the board of directors may have the effect of delaying or preventing changes in control of our company. We expect that additional directorships resulting from an increase in the number of directors, if any, will be distributed among the three classes so that, as nearly as possible, each class will consist of one-third of the directors.
Leadership Structure of the Board of Directors
Our board of directors currently separates the roles of Chief Executive Officer and Chairman. These positions are currently held by Ronald C. Keating, as our Chief Executive Officer, and Martin Lamb, as the Chairman. We believe this leadership structure is appropriate for our company due to the differences between the two roles. The Chief Executive Officer is responsible for setting our strategic direction, providing day-to-day leadership and managing our business, while the Chairman provides guidance to the Chief Executive Officer, chairs meetings of the board of directors, sets the agendas for meetings of our board of directors as well as provides information to the members of our board of directors in advance of such meetings. In addition, separating the roles of Chief Executive Officer and Chairman allows the Chairman to provide oversight of our management.
Director Independence and Controlled Company Exception
Our board of directors has affirmatively determined that Judd Gregg, Nick Bhambri and Martin Lamb are independent directors under the rules of the NYSE and independent directors as such term is defined in Rule 10A-3(b)(1) under the Exchange Act. Our remaining directors are not independent because of their affiliations with AEA, which, together with its affiliates, indirectly holds more than 50% of our common stock.
After completion of this offering, we expect to be a "controlled company" within the meaning of the corporate governance standards of the NYSE. Under these rules, a "controlled company" may elect not to comply with certain corporate governance requirements, including:
- •
- the requirement that a majority of our board of directors consist of independent directors;
- •
- the requirement that we have a nominating and corporate governance committee that is composed entirely of independent directors with a written
charter addressing the committee's purpose and responsibilities;
- •
- the requirement that we have a compensation committee that is composed entirely of independent directors with a written charter addressing the
committee's purpose and responsibilities; and
- •
- the requirement for an annual performance evaluation of the nominating and corporate governance committee and compensation committee.
157
Following this offering, we intend to utilize certain of these exemptions. As a result, we will not have a majority of independent directors, our nominating and corporate governance committee and compensation committee will not consist entirely of independent directors and such committees will not be subject to annual performance evaluations. Accordingly, you will not have the same protections afforded to stockholders of companies that are subject to all of the applicable stock exchange rules. See "Risk Factors—Risks Relating to Our Common Stock and this Offering—We are a 'controlled company' within the meaning of the corporate governance standards of the NYSE and, as a result, will qualify for, and may rely on, exemptions from certain corporate governance requirements."
Committees of the Board of Directors
Our board of directors has three committees: the audit committee, the compensation committee and the nominating and corporate governance committee. Our board of directors may establish other committees to facilitate the management of our business. The expected composition and functions of the audit committee, compensation committee and nominating and corporate governance committee are described below.
Audit Committee
The members of the audit committee are Gary Cappeline, as Chairman, Nick Bhambri and Vinay Kumar. Gary Cappeline qualifies as our "audit committee financial expert" within the meaning of regulations adopted by the SEC. Our board of directors has also determined that Nick Bhambri is "independent" as defined under the NYSE rules and the Exchange Act and rules and regulations promulgated thereunder. The audit committee recommends the annual appointment and reviews independence of auditors and reviews the scope of audit and non-audit assignments and related fees, the results of the annual audit, accounting principles used in financial reporting, internal auditing procedures, the adequacy of our internal control procedures, related party transactions and investigations into matters related to audit functions. The audit committee is also responsible for overseeing risk management on behalf of our board of directors. See "—Risk Oversight."
Compensation Committee
The members of the compensation committee are Brian R. Hoesterey, as Chairman, Gary Cappeline, Vinay Kumar and Martin Lamb. The principal responsibilities of the compensation committee are to review and approve matters involving executive and director compensation, recommend changes in employee benefit programs, authorize equity and other incentive arrangements and authorize our company to enter into employment and other employee-related agreements.
Nominating and Corporate Governance Committee
The members of the nominating and corporate governance committee will be Vinay Kumar, as Chairman, Gary Cappeline and Brian R. Hoesterey. The nominating and corporate governance committee assists our board of directors in identifying individuals qualified to become board members, makes recommendations for nominees for committees and develops, recommends to the board of directors and reviews our corporate governance principles.
Compensation Committee Interlocks and Insider Participation
None of our executive officers serves, or in the past year has served, as a member of the board of directors or compensation committee (or other committee performing equivalent functions) of any entity that has one or more executive officers serving on our board of directors or compensation committee. No interlocking relationship exists between any member of the compensation committee (or other committee performing equivalent functions) and any executive, member of the board of directors
158
or member of the compensation committee (or other committee performing equivalent functions) of any other company.
Risk Oversight
Our board of directors administers its risk oversight function primarily through the audit committee. To that end, our audit committee meets semi-annually with our Chief Financial Officer and our independent registered public accounting firm, who provide regular updates regarding our management's assessment of risk exposures including liquidity, credit and operational risks and the process in place to monitor such risks and review results of operations, financial reporting and assessments of internal controls over financial reporting. Our board of directors believes that its administration of risk management has not affected its leadership structure, as described above.
Code of Ethics
We have adopted a Code of Ethics and Business Conduct applicable to all of our directors, officers (including our principal executive officer, principal financial officer and principal accounting officer) and all global employees. Our Code of Ethics and Business Conduct is available on our website at www.evoqua.com under About Us—Ethics and Compliance. In the event that we amend or waive certain provisions of our Code of Ethics and Business Conduct applicable to our principal executive officer, principal financial officer or principal accounting officer that requires disclosure under applicable SEC rules, we intend to disclose the same on our website. Our website is not part of this prospectus.
159
COMPENSATION DISCUSSION AND ANALYSIS
The discussion that follows describes the fiscal 2017 executive compensation program for the executive officers listed below (our "NEOs"):
Name
|
Title | |
|---|---|---|
| Ronald Keating | President, Chief Executive Officer and Director | |
| Benedict J. Stas | Executive Vice President, Chief Financial Officer & Treasurer | |
| Anthony J. Webster | Executive Vice President, Chief Human Resources Officer | |
| Vincent Grieco | Executive Vice President, Secretary and General Counsel | |
| James Kohosek | Executive Vice President, Corporate Strategy & Business Operations |
Background
Prior to the AEA Acquisition, we operated as the Water Technologies Business Unit of Siemens. All compensation programs implemented since the AEA Acquisition through fiscal 2017 in which our NEOs participated, and all decisions made with regard to the compensation of our NEOs, were programs of, or decisions made by, the Compensation Committee. As part of its overall review the Company's compensation program in light of the anticipated initial public offering, the Compensation Committee determined it was appropriate to provide all members of our executive leadership team generally comparable employment terms. In connection therewith, effective as of September 2017, the Compensation Committee amended the employment agreements for each of the Company's executive officers, including those NEOs who had entered into an employment agreement in connection with his commencement of employment with the Company, and entered into a new employment agreement with each of Messrs. Grieco and Kohosek, who were not previously party to an employment agreement (the employment agreements (as amended) collectively, the "Employment Agreements" and each, an "Employment Agreement"). The Employment Agreements generally set forth the material terms of the NEOs' respective compensation packages and are described in greater detail below in the section entitled "Employment Agreements." AEA also adopted the Evoqua Water Technologies Corp. Stock Option Plan (the "Option Plan") for purposes of providing management team members equity compensation following the AEA Acquisition.
Since the AEA Acquisition, the Compensation Committee has had the responsibility for reviewing the executive compensation arrangements in place for NEOs and it will continue to exercise these duties with the overall intent of structuring future compensation in a way that maximizes long-term Company growth and aligns the interests of our management team members, including the NEOs, with the interests of our stockholders.
2017 Compensation Goals and Philosophy
The appropriate mix and amount of compensation for each NEO vary based on the level of the executive's responsibilities and, as discussed above, were generally individually negotiated and initially established at the time of the executive's commencement of employment with the Company, with the material terms relating to cash compensation and short-term incentive compensation being set forth in the Employment Agreements (subject to adjustment by the Compensation Committee as part of its periodic review of the NEOs' executive compensation arrangements) and long-term equity compensation taking the form of options granted under the Option Plan.
For fiscal 2017, general objectives of the executive compensation program included the following:
- •
- balancing an entrepreneurial focus with the need to set and achieve pre-determined goals;
- •
- aligning with best practices and standards as determined by institutional shareholders and shareholder advisors;
160
- •
- basing annual reward opportunities on performance measures linked to shareholder value creation;
- •
- providing substantial upside opportunity that is linked to superior performance; and
- •
- requiring a threshold level of performance in order for any award to be earned.
Beginning in fiscal 2016 management has retained the Hay Group to review and advise on our company-wide compensation structure, including as the structure applied to the named executive officer roles. At the request of management, the Hay Group evaluated corporate profiles and referenced its US Industrial Compensation Report, which report includes information for over 450 companies in the United States. For purposes of its analysis, the Hay Group utilized information from the report, specifically focusing on industrial companies of a size range similar to us (with an annual revenue of $1 billion-$2 billion) for the purpose of reviewing the internal and external competitiveness of compensation levels. Their initial report was presented to the Compensation Committee in June 2016, and the analysis was used as a comparative tool by the Compensation Committee to understand the Company's executive compensation program in context of the current practices and compensation levels in the industrial sector. Based in part on the information learned from the industrial sector study provided by the Hay Group as well as informal market surveys, other publicly available information as well as the Chief Executive Officer's and Chief Human Resource Officer's input, the Compensation Committee implemented certain changes to our executive compensation program for fiscal 2017. The Compensation Committee believes, as compared to the industry sector data, the Company's cash compensation levels are positioned at approximately the 50th percentile as compared to total cash compensation levels provided for similar positions in our industry generally with certain individuals potentially earning higher amounts based on performance. The Compensation Committee has not, to date, utilized a specific, more narrowly-tailored peer group, however, in the third quarter of fiscal 2017, the Board retained Pearl Meyer & Partners ("Pearl Meyer") as a compensation consultant for the purpose of aiding in the evaluation of the Company's compensation program for fiscal 2018, and in connection therewith, Pearl Meyer has commenced the process of identifying a peer group which the Compensation Committee may refer to for the purpose of making compensation decisions in fiscal 2018.
It is expected that in future years, the Compensation Committee will continue to review base salaries, awards of cash bonuses and equity grants on an annual basis in order to determine whether the levels and allocation of the various elements of our NEOs' compensation packages are appropriate. The Compensation Committee will conduct its review after the Chief Executive Officer and the Chief Human Resources Officer have presented recommendations regarding the level and mix of compensation for our NEOs (other than for the Chief Executive Officer), including with respect to base salary, short-term incentive compensation and long-term incentive compensation. The Chief Executive Officer's recommendations will be developed in consultation with our Chief Human Resources Officer and other Company representatives. In the future, the Compensation Committee may commission specific peer group data as part of its analysis.
The Compensation Committee does not maintain any formal policy or formula for allocating the appropriate mix of compensation as it believes it is more important to remain flexible to respond to shifts in the marketplace in which the Company must compete to recruit and retain executive talent. Therefore, the Compensation Committee retains the authority to review our NEOs' compensation periodically and to use its discretion to adjust the mix of compensation and the amount of any element of compensation as it deems appropriate for each NEO.
Base Salary
We believe that the provision of base salary plays an important role in attracting and retaining top executive talent by providing executives with a predictable level of income. Base salaries represent a fixed portion of our NEOs' compensation and vary, principally based on job responsibility. It is
161
expected that the Compensation Committee will review our NEOs' base salaries annually, though it may make periodic base salary adjustments in connection with an NEO's promotion or change in job responsibility or when otherwise necessary for equitable reasons. In connection with its review and determination of base salaries, the Compensation Committee will consider, among other factors it considers relevant, market data, the level of the executive's compensation (individually and relative to the other executives), the length of the executive's tenure, the level of the executive's performance and, for the base salaries for executives other than the Chief Executive Officer, the recommendations of the Chief Executive Officer and the Chief Human Resources Officer.
The following table sets forth our NEOs' annual base salaries as of October 1, 2016. The Compensation Committee reviews compensation on a calendar year cycle and, in December 2016, approved increases to base salary for Messrs. Keating, Stas, Webster and Grieco of 2.5%, 8%, 2.5% and 10%, respectively, which increases took effect on December 26, 2016.
Named Executive Officer
|
Base Salary as of October 1, 2016 ($) |
|||
|---|---|---|---|---|
Ronald Keating |
768,750 | |||
Benedict J. Stas |
360,500 | |||
Anthony J. Webster |
350,000 | |||
Vincent Grieco |
226,600 | |||
James Kohosek |
275,000 | |||
Annual Bonuses
The Company maintains the Evoqua Management Incentive Plan (the "MIP") to provide incentive compensation aimed at driving the Company's annual performance by linking variable compensation payments to Company performance, with achievement measured against Company-wide Adjusted EBITDA goals ("Evoqua Global EBITDA"), Company-wide Sales goals ("Evoqua Global Sales") and Segment EBITDA goals as appropriate based on responsibility. Cash bonuses under the MIP are designed to support our strategic business, promote the maximization of Company profitability and encourage teamwork. In fiscal 2017, each of our NEOs was eligible to earn an annual cash bonus under the MIP, subject to the conditions described below.
Under the MIP, an annual bonus pool is established and funded based solely on the Compensation Committee's determination as to the Company's performance as measured based upon achievement of at least 85% of the Evoqua Global EBITDA goal. For each of our NEOs other than Mr. Kohosek, the annual bonus payment for fiscal 2017 was calculated based on achievement of Evoqua Global EBITDA goal (70%) the Evoqua Global Sales goal (30%), and for Mr. Kohosek, based on achievement of Evoqua Global EBITDA goal (20%), the Evoqua Global Sales goal (30%) and Products & Technologies EBITDA (50%).
The MIP provides that (i) achievement of the Evoqua Global EBITDA goal (x) as to 85% will yield a payment equal to 25% of the portion of the target bonus attributable to that goal and (y) as to 100% will yield a payment equal to 100%, with linear interpolation being applied for achievement between 85% and 100% and (ii) achievement of the Evoqua Global Sales EBITDA goal (x) as to 96% will yield a payment equal to 25% of the portion of the target bonus attributable to that goal and (y) as to 100% will yield a maximum payment of 100% of the target bonus attributable to the at goal, with linear interpolation being applied for achievement between 96% and 100%. Payments in respect of achievement of Evoqua Global EBITDA in excess of 100% of target are "unlocked" only upon achievement of Evoqua Global Sales of at least 100% of target. If and only if the Evoqua Global Sales target is achieved as to at least 100%, then achievement of above 100% of target performance of the Evoqua Global EBITDA target will yield a payment above target equal to an additional 3% of target payout for every 1% of above-target performance, with payout attributable to achievement of the
162
Evoqua Global EBITDA not being capped. Payouts attributable to achievement of Evoqua Global Sales and Segment EBITDA are capped at 100% and 200% of target payout, respectively.
The relevant threshold and target goals for fiscal 2017 were as follows:
| |
Threshold | Target | Maximum | |||||||
|---|---|---|---|---|---|---|---|---|---|---|
Evoqua Global EBITDA (1) (in millions) |
$ | 184.7 | $ | 217.3 | — | |||||
Evoqua Global Sales (1) (in millions) |
$ | 1,234.4 | $ | 1,285.8 | $ | 1,285.8 | ||||
Products & Technologies EBITDA (1) (in millions) |
$ | 27.5 | $ | 32.3 | $ | 43.1 | ||||
- (1)
- None of Evoqua Global EBITDA, Evoqua Global Sales or Products & Technologies EBITDA are a presentation made in accordance with GAAP, and none are intended to present a measure of financial condition superior to those determined under GAAP. The Evoqua Global EBITDA metric and goals correlate to Adjusted EBITDA used for financial reporting purposes, and the most directly comparable GAAP measure is Net Income, as referenced in "Summary Consolidated Financial and Operating Data" included elsewhere in this prospectus. The Evoqua Global Sales metric and goals correlate to the Revenue from product sales and services line item used for financial reporting purposes (after being adjusted, for purposes of the MIP, on a pro forma basis for revenue attributable to acquisitions). The Products & Technologies EBITDA metric and goals are an approximately 40% component of the EBITDA (Products) segment used for financial reporting purposes (after being adjusted, for purposes of the MIP, on a pro forma basis for EBITDA attributable to acquisitions).
Each of our NEOs is entitled to a target bonus equal to a percentage of his base salary, as set forth in the table below. The annual bonuses under the MIP for fiscal 2017 for our NEOs (subject to funding of the annual bonus pool based on achievement of at least 85% the Evoqua Global EBITDA target) were subject to adjustment by the Compensation Committee, at its discretion, based on the executive's individual performance and contribution to the Company during the year.
The following table sets forth the fiscal 2017 annual bonus target for each of our NEOs, expressed as a percentage of base salary.
Name
|
Target | |||
|---|---|---|---|---|
Ronald Keating |
100 | % | ||
Benedict J. Stas |
70 | % | ||
Anthony J. Webster |
50 | % | ||
Vincent Grieco |
50 | % | ||
James Kohosek(1) |
60 | % | ||
- (1)
- Effective January 1, 2017, Mr. Kohosek's annual target bonus was increased from 50% to 60%.
In connection with this offering, the Company expects to adopt and submit for shareholder approval the Evoqua Water Technologies Corp. 2017 Annual Incentive Plan (the "Bonus Plan"), which sets forth other performance criteria and performance goals which may be used by the Compensation Committee in future fiscal years in determining the appropriate annual cash incentive packages for our NEOs. The material terms of the Bonus Plan are described under the heading "—Material Terms of the Evoqua Water Technologies Corp. 2017 Annual Incentive Plan".
Long-Term Incentive Plan
As discussed above, the Company maintains the Option Plan, a long-term incentive plan under which we may make grants of options from time to time. The main objectives of the Option Plan are to (1) directly link our executives to increasing shareholder value, (2) incentivize our executives to work
163
towards the achievement of our long-term performance goals, (3) provide the Company a competitive means through which we may better attract able individuals to become executives and (4) retain executives for multiple-year periods by providing them with stock ownership opportunities.
For the foregoing reasons, we believe providing our NEOs long-term equity compensation in the form of options further advances and aligns the interests of the Company and its stockholders. The Compensation Committee has the authority to make grants under the Option Plan as it deems appropriate, and generally does so in connection with new hires or promotions within the Company.
For a description of the effect of a Change in Control (as defined in the Option Plan) on these options, please see the section entitled "Payments upon Certain Events of Termination or Change in Control" below.
In connection with this offering, the Company expects to adopt and submit for shareholder approval the Evoqua Water Technologies Corp. 2017 Equity Incentive Plan (the "Equity Incentive Plan"). The material terms of the Equity Incentive Plan are described under the heading "—Material Terms of the Evoqua Water Technologies Corp. 2017 Equity Incentive Plan."
Retirement Plans
The Company provides retirement benefits to the NEOs, including matching contributions, under the terms of its tax-qualified defined contribution plan (the "401(k) Plan"). The NEOs participate in the 401(k) Plan on the same terms as our other participating employees.
The Company also maintains a nonqualified deferred compensation plan (the "Deferred Compensation Plan") in which the NEOs participate and under which they are eligible to receive matching contributions. Under the Deferred Compensation Plan, the NEOs may elect to defer portions of their compensation that are not otherwise available due to limitations on contributions to the 401(k) Plan under the Code. For a further description of the Deferred Compensation Plan and the payments that were made in fiscal 2017, please see the section entitled "Nonqualified Deferred Compensation as of September 30, 2017" below.
We believe that the retirement benefits provided under the 401(k) Plan and the Deferred Compensation Plan are comparable to those provided by comparable companies. The Company does not maintain any defined benefit plans for any of its executive officers.
Perquisites and Other Personal Benefits
The Company provides the NEOs with perquisites and other personal benefits, or an allowance for certain perquisites, that it believes are reasonable and consistent with its overall compensation program to better enable the Company to attract and retain superior employees for key positions. For fiscal 2017, the Company paid stipends to each of the NEOs for the purpose of covering, in the NEO's sole discretion, costs associated with services such as an executive physical examination, lease of an automobile and/or financial planning services. In fiscal 2017, Mr. Keating was also reimbursed for certain relocation expenses and a portion of his country club membership.
We believe that these benefits enable our executives to focus on our business and enhance their commitment to us. In addition, each of our NEOs received Company matching contributions under the 401(k) Plan and Messrs. Keating, Stas and Kohosek received Company matching contributions under the Deferred Compensation Plan.
The Compensation Committee periodically reviews the levels of perquisites and other personal benefits that may be made available to our NEOs through the stipend to confirm that such levels are reasonable and continue to serve their intended retentive purposes.
164
IPO Awards—Restricted Stock Units
Prior to the consummation of this offering, the Company expects to enter into restricted stock unit award agreements (the "IPO RSU Agreements") with each of our NEOs and certain other key members of management pursuant to which recipients will be entitled to receive an award of stock-settled restricted stock units (the "IPO RSUs"), the aggregate value of which equals $25 million. The IPO RSU Agreements provide that each grantee will be entitled to receive a number of IPO RSUs equal to the quotient of (a) each such grantee's "Aggregate Grant Amount" (set forth in each grantee's IPO RSU Agreement), divided by (b) the closing price of one share of Company common stock as reported on the principal nationally recognized stock exchange on which such shares are traded on the first day of trading following the effectiveness of this registration statement. Pursuant to the IPO RSU Agreements, the IPO RSUs will vest and settle in full upon the second anniversary of the IPO Date (as defined in the IPO RSU Agreement, the "Vesting Date"), subject to the grantee's continued employment with the Company or any of its subsidiaries through the Vesting Date; provided, however, that in the event that a Change in Control (as defined in the Option Plan) occurs prior to the Vesting Date, the IPO RSUs will vest and settle in full upon the date of such Change in Control, subject to the grantee's continued employment with the Company or any of its subsidiaries through the Change in Control date. In the event that the grantee is terminated for any reason prior to the Vesting Date, the grantee will forfeit each of his or her IPO RSUs for no consideration as of the date of such termination of employment; provided, that, if the grantee is terminated without Cause (as defined in the IPO RSU Agreement) prior to the Vesting Date, the IPO RSUs will vest and settle in full upon the Vesting Date as though the grantee had remained employed through such date.
We expect the non-cash stock-based compensation expense associated with the one-time grant of the IPO RSUs to each of our NEOs and other key members of management in connection with the consummation of this offering to be approximately $25 million, which will be incremental to our ongoing stock-based compensation expense. This stock-based compensation expense will be finalized following the pricing of this offering and is expected to be expensed beginning in the fiscal quarter in which this offering closes and continuing over the following eight fiscal quarters.
Risk Analysis of Compensation Program
The Compensation Committee has reviewed our compensation program to determine if the elements encourage excessive or unnecessary risk-taking that is reasonably likely to have a material adverse effect on the Company. The Compensation Committee believes that the Company's compensation program offers an appropriate mix of fixed compensation and short- and long-term variable compensation so as to mitigate the motivation to take high levels of business risk. As a result, the Compensation Committee believes that our compensation program does not encourage unreasonable risk-taking that is reasonably likely to have a material adverse effect on the Company.
Internal Revenue Code Section 162(m)
As a private company, in fiscal 2017 the Company was not subject to Section 162(m) of the Internal Revenue Code of 1986, as amended ("Section 162(m)"). In making future compensation decisions, the Compensation Committee will consider the potential impact of Section 162(m), which disallows a tax deduction for any publicly held corporation for individual compensation exceeding $1 million in any taxable year for the Chief Executive Officer and the next three mostly highly compensated officers (other than the Chief Financial Officer), other than compensation that is performance-based under a plan that is approved by the stockholders of the Company and meets other technical requirements. However, the Compensation Committee reserves the right to provide for compensation to executive officers that may not be deductible if it believes such compensation is in the best interests of the Company and its stockholders. Transition provisions under Section 162(m) may apply for a period of approximately three years following the consummation of an initial public offering of the Company (which is not guaranteed to occur) to certain compensation arrangements that were entered into before such initial public offering, including, without limitation, awards under the Bonus Plan and the Option Plan and any future awards under the MIP and the Equity Incentive Plan.
165
COMPENSATION OF NAMED EXECUTIVE OFFICERS
SUMMARY COMPENSATION TABLE
The following table sets forth the cash and non-cash compensation paid to our NEOs for the fiscal years ended September 30, 2017 and September 30, 2016.
Name & Principal Position
|
Fiscal Year |
Salary ($) |
Bonus ($) |
Option Awards ($)(1) |
Non-Equity Incentive Plan Compensation ($) |
All Other Compensation ($)(2) |
Total ($) |
|||||||||||||||
|---|---|---|---|---|---|---|---|---|---|---|---|---|---|---|---|---|---|---|---|---|---|---|
Ronald Keating |
2017 | 783,534 | — | 67,277 | 787,969 | 267,540 | 1,906,320 | |||||||||||||||
President, Chief Executive Officer and Director(3) |
2016 | 764,423 | — | — | 526,594 | 156,717 | 1,447,734 | |||||||||||||||
Benedict J. Stas |
2017 | 383,192 | — | 19,205 | 273,000 | 53,945 | 729,342 | |||||||||||||||
Executive Vice President, Chief Financial Officer & Treasurer(4) |
2016 | 358,077 | — | — | 148,166 | 55,537 | 561,780 | |||||||||||||||
Anthony J. Webster |
2017 | 356,731 | — | — | 179,375 | 40,391 | 576,497 | |||||||||||||||
Executive Vice President, Chief Human Resources Officer(5) |
2016 | 196,189 | — | 652,120 | 170,625 | 135,082 | 1,154,016 | |||||||||||||||
Vincent Grieco |
2017 | 244,600 | — | 227,641 | 125,000 | 32,007 | 629,248 | |||||||||||||||
Executive Vice President, Secretary and General Counsel (6) |
||||||||||||||||||||||
James Kohosek |
2017 | 275,000 | — | 590,754 | 159,084 | 34,596 | 1,059,434 | |||||||||||||||
Executive Vice President, Corporate Strategy & Business Operations (7) |
||||||||||||||||||||||
- (1)
- The
amounts in this column were calculated based on the grant date fair value of our common stock, in accordance with FASB ASC Topic 718. Assumptions used to
determine the grant date fair value are set forth in Note 15 to our audited consolidated financial statements for the fiscal year ended September 30, 2016 included elsewhere in this
prospectus.
- (2)
- As
described above in the section entitled "Perquisites and Other Personal Benefits, the amounts set forth under the "All Other Compensation" include stipends paid
to each of our NEOs for the purpose of covering the NEO's costs associated with services such as an executive physical examination, lease of an automobile and / or financial planning services in the
following amounts: $30,000 for Mr. Keating and $25,000 for each of Messrs. Webster, Grieco and Kohosek.
- (3)
- The
amount set forth under "All Other Compensation" includes: (i) matching contributions made to the 401(k) Plan of approximately $17,948,
(ii) matching contributions made to the Deferred Compensation Plan of approximately $61,913, (iii) $132,384 of costs incurred in connection with Mr. Keating's relocation to the
location of the Company's principal offices and (iv) reimbursements for expenses associated with Mr. Keating country club membership of approximately $25,295.
- (4)
- The
amount set forth under "All Other Compensation" includes: (i) matching contributions made to the 401(k) Plan of approximately $13,536 and
(ii) matching contributions made to the Deferred Compensation Plan of approximately $15,409.
- (5)
- The
amount set forth under "All Other Compensation" includes matching contributions made to the 401(k) Plan of approximately $20,391.
- (6)
- The
amount set forth under "All Other Compensation" includes matching contributions made to the 401(k) Plan of approximately $12,007.
- (7)
- The amount set forth under "All Other Compensation" includes: (i) matching contributions made to the 401(k) Plan of approximately $13,720 and (ii) matching contributions made to the Deferred Compensation Plan of approximately $876.
166
The table below sets forth information regarding all grants of awards made to the NEOs during the fiscal year ended September 30, 2017. For further information regarding the terms of certain of these grants, see "Compensation Discussion and Analysis" above.
| |
|
Estimated Future Payouts Under Non-Equity Incentive Plan Awards(1) |
|
|
|
|||||||||||||||||
|---|---|---|---|---|---|---|---|---|---|---|---|---|---|---|---|---|---|---|---|---|---|---|
| |
|
|
Exercise Price of Option Awards ($) |
|
||||||||||||||||||
| |
|
All Other Option Awards (#) |
Grant Date Fair Value of Option Awards ($) |
|||||||||||||||||||
Name
|
Date of Grant |
Threshold ($) |
Target ($) |
Max ($) |
||||||||||||||||||
Ronald Keating |
— | 0 | 787,969 | — | — | — | — | |||||||||||||||
|
10/28/16 | — | — | — | 29,653 | 7.42 | 67,277 | |||||||||||||||
Benedict J. Stas |
— | 0 | 273,000 | — | — | — | — | |||||||||||||||
|
10/28/16 | — | — | — | 8,465 | 7.42 | 19,205 | |||||||||||||||
Anthony J. Webster |
— | 0 | 179,375 | — | — | — | — | |||||||||||||||
Vincent Grieco |
— | 0 | 125,000 | — | — | — | — | |||||||||||||||
|
12/19/16 | — | — | — | 100,336 | 7.42 | 227,641 | |||||||||||||||
James Kohosek |
— | 0 | 165,000 | — | — | — | — | |||||||||||||||
|
11/29/16 | — | — | — | 121,309 | 7.42 | 275,224 | |||||||||||||||
|
12/19/16 | — | — | — | 148,266 | 7.42 | 315,530 | |||||||||||||||
- (1)
- These columns, where applicable, show the range of possible payouts which were targeted for fiscal 2017 performance under the MIP as described above under "—Annual Bonuses".
Employment Agreements
We currently use employment agreements to attract and/or retain our NEOs, the materials terms of which are described below.
President, Chief Executive Officer and Director (Ronald Keating)
On September 8, 2014 the Company entered into an employment agreement with Mr. Keating, which agreement was amended on September 6, 2017. Mr. Keating's Employment Agreement provides that his initial employment term commenced on December 1, 2014 and will expire on December 1, 2017, subject thereafter to automatic one-year extensions unless either the Company or Mr. Keating provides at least 30 days' written notice to the other of intent not to renew the term. The Employment Agreement provides that Mr. Keating would receive an initial base salary of $750,000 per year, subject to increase at the discretion of the Board, and that he would be eligible to participate in all benefit programs for which other senior executives of the Company are generally eligible. Mr. Keating would also be eligible to earn a target annual bonus equal to 100% of his base salary, with the actual bonus paid to be based on the Company's actual performance relative to the performance targets established by the Board or a committee thereof. In addition, Mr. Keating would be entitled to reimbursement for the following items, in each case in accordance with the expense reimbursement policy of the Company in effect from time to time: (a) reasonable out-of-pocket business expenses incurred in performing his duties, (b) commuting and temporary living expenses, on a grossed-up basis for taxes, related to his principal place of employment at the Company's offices in Warrendale, PA (including, without limitation, weekly flights between Cincinnati and Pittsburgh, hotel expenses or rental apartment expenses, and a car) until Mr. Keating determines to relocate his residence to the location of the Company's principal offices, at which time the Company will reimburse Mr. Keating for all reasonable relocation expenses on a grossed-up tax basis. Mr. Keating's Employment Agreement also provides for severance upon certain terminations of employment, as described below under "—Payments upon Certain Events of Termination or Change in Control." The Employment Agreement includes restrictive
167
covenants providing for non-competition, non-solicitation of employees and non-interference with business relationships, in each case during employment and for two years thereafter, mutual non-disparagement, and perpetual nondisclosure of confidential information.
Executive Vice President, Chief Financial Officer & Treasurer (Benedict J. Stas)
On February 26, 2015 the Company entered into an employment agreement with Mr. Stas, which agreement was amended on September 6, 2017. Mr. Stas' Employment Agreement provides that his initial employment term commenced on March 30, 2015 and will expire on March 30, 2018, subject thereafter to automatic one-year extensions unless either the Company or Mr. Stas provides at least 30 days' written notice to the other of intent not to renew the term. The Employment Agreement provided that Mr. Stas would receive an initial annual base salary of $350,000, subject to increase at the discretion of the Board, and shall be eligible to receive an initial target annual bonus equal to 60% of his base salary, with the actual bonus paid to be based on the Company's actual performance relative to the performance targets established by senior management of the Company. In addition, in accordance with the Company's expense reimbursement policy in effect from time to time, Mr. Stas would be entitled to reimbursement for reasonable out-of-pocket business expenses incurred in performing his duties and is eligible to participate in all benefit programs for which other executives of the Company are generally eligible. Mr. Stas' Employment Agreement also provides for severance upon certain terminations of employment, as described below under "—Payments upon Certain Events of Termination or Change in Control." The Employment Agreement includes restrictive covenants providing for non-competition, non-solicitation of employees and non-interference with business relationships, in each case during employment and for one year thereafter, non-disparagement of the Company, and perpetual nondisclosure of confidential information.
Executive Vice President, Chief Human Resources Officer (Anthony J. Webster)
On January 20, 2016 the Company entered into an employment agreement with Mr. Webster, which agreement was amended on September 6, 2017. Mr. Webster's Employment Agreement provides that his initial employment term commenced on February 22, 2016 and will expire on February 22, 2019, subject thereafter to automatic one-year extensions unless either the Company or Mr. Webster provides at least 30 days' written notice to the other of intent not to renew the term. The Employment Agreement provides that Mr. Webster would receive an initial annual base salary of $350,000, subject to increase at the discretion of the Board, and shall be eligible to receive a target annual bonus equal to 50% of his base salary, with the actual bonus paid to be based on the Company's actual performance relative to the performance targets established by senior management of the Company. In addition, Mr. Webster would be entitled to reimbursement for reasonable out-of-pocket business expenses incurred in performing his duties and is eligible to participate in all benefit programs for which other executives of the Company are generally eligible. Mr. Webster's Employment Agreement also provides for severance upon certain terminations of employment, as described below under "—Payments upon Certain Events of Termination or Change in Control." The Employment Agreement includes restrictive covenants providing for non-competition, non-solicitation of employees and non-interference with business relationships, in each case during employment and for one year thereafter, non-disparagement of the Company, and perpetual nondisclosure of confidential information.
On March 1, 2016, the Company entered into a bonus agreement with Mr. Webster (the "Webster Bonus Agreement") which provides that subject to his continued employment with the Company through the first to occur of a Change in Control (as defined in the Option Plan) or an initial public offering of the common stock of the Company, Mr. Webster will be entitled to a bonus payment (the "Special Bonus") equal to the product of 342,362 multiplied by the amount by which the Fair Market Value (as defined below) of a share of common stock of the Company exceeds $4.64, but only to the extent the Fair Market Value does not exceed $6.49. For purposes of the foregoing, "Fair Market
168
Value" shall mean, as calculated by the Company in its reasonable good faith discretion, (i) in the case of a payment upon a Change in Control, the closing cash consideration per share of common stock of the Company or (ii) in the case of a payment upon an initial public offering of the common stock of the Company, the closing price of a share of common stock of the Company as of the first trading day on which shares of common stock of the Company may be traded following any underwriter's lockup entered into in connection with the initial public offering that is binding upon the Company's senior management (the "IPO Valuation Date"). In the case of a Change in Control, the Special Bonus shall be paid in cash within 30 days following a Change in Control. In the case of an initial public offering, the Special Bonus shall be paid in cash, shares or any combination thereof (as determined by the Company in its discretion) on the first payroll date following the IPO Valuation Date. The Company's obligations under the Webster Bonus Agreement shall terminate upon the termination of Mr. Webster's termination of employment with the Company for any reason (regardless of whether a Change in Control or initial public offering has occurred prior to such termination).
Executive Vice President, Executive Vice President, Secretary and General Counsel (Vincent Grieco)
On September 6, 2017, the Company entered into an employment agreement with Mr. Grieco, which agreement provides that his initial employment term commenced on September 6, 2017 and will expire on September 6, 2020, subject thereafter to automatic one-year extensions unless either the Company or Mr. Grieco provides at least 30 days' written notice to the other of intent not to renew the term. The Employment Agreement provides that Mr. Grieco would receive an initial annual base salary of $250,000, subject to increase at the discretion of the Board, and shall be eligible to receive a target annual bonus equal to 50% of his base salary, with the actual bonus paid to be based on the Company's actual performance relative to the performance targets established by senior management of the Company. In addition, Mr. Grieco would be entitled to reimbursement for reasonable out-of-pocket business expenses incurred in performing his duties and is eligible to participate in all benefit programs for which other executives of the Company are generally eligible. Mr. Grieco's Employment Agreement also provides for severance upon certain terminations of employment, as described below under "—Payments upon Certain Events of Termination or Change in Control." The Employment Agreement includes restrictive covenants providing for non-competition, non-solicitation of employees and non-interference with business relationships, in each case during employment and for one year thereafter, non-disparagement of the Company, and perpetual nondisclosure of confidential information.
Executive Vice President, Corporate Strategy & Business Operations (James Kohosek)
On September 6, 2017, the Company entered into an employment agreement with Mr. Kohosek, which agreement provides that his initial employment term commenced on September 6, 2017 and will expire on September 6, 2020, subject thereafter to automatic one-year extensions unless either the Company or Mr. Kohosek provides at least 30 days' written notice to the other of intent not to renew the term. The Employment Agreement provides that Mr. Kohosek would receive an initial annual base salary of $275,000, subject to increase at the discretion of the Board, and shall be eligible to receive a target annual bonus equal to 60% of his base salary, with the actual bonus paid to be based on the Company's actual performance relative to the performance targets established by senior management of the Company. In addition, Mr. Kohosek would be entitled to reimbursement for reasonable out-of-pocket business expenses incurred in performing his duties and is eligible to participate in all benefit programs for which other executives of the Company are generally eligible. Mr. Kohosek's Employment Agreement also provides for severance upon certain terminations of employment, as described below under "—Payments upon Certain Events of Termination or Change in Control." The Employment Agreement includes restrictive covenants providing for non-competition, non-solicitation of employees and non-interference with business relationships, in each case during employment and for one year thereafter, non-disparagement of the Company, and perpetual nondisclosure of confidential information.
169
OUTSTANDING EQUITY AWARDS AT FISCAL 2017 YEAR END
The following table sets forth certain information with respect to outstanding options held by each of our NEOs on September 30, 2017.
| |
Option Awards | ||||||||||||
|---|---|---|---|---|---|---|---|---|---|---|---|---|---|
Name
|
Number of Securities Underlying Unexercised Options Exercisable |
Number of Securities Underlying Unexercised Options Un-exercisable |
Option Exercise Price ($) |
Option Expiration Date |
|||||||||
Ronald Keating |
1,246,791 | 1,246,791 | (1) | 4.64 | 12/15/2024 | ||||||||
|
29,653 | 0 | 7.42 | 10/28/2026 | |||||||||
Benedict J. Stas |
415,606 | 415,579 | (2) | 4.64 | 04/06/2025 | ||||||||
|
8,465 | 0 | 7.42 | 10/28/2026 | |||||||||
Anthony J. Webster |
85,590 | 256,771 | (3) | 6.49 | 03/03/2026 | ||||||||
Vincent Grieco |
13,856 | 13,856 | (4) | 4.64 | 10/27/2024 | ||||||||
|
46,798 | 46,798 | (5) | 4.64 | 01/19/2025 | ||||||||
|
0 | 100,336 | (6) | 7.42 | 12/19/2026 | ||||||||
James Kohosek |
0 | 121,309 | (7) | 7.42 | 11/29/2026 | ||||||||
|
0 | 148,267 | (8) | 7.42 | 12/19/2026 | ||||||||
- (1)
- These
options will vest in two remaining equal installments on December 15, 2017 and December 15, 2018.
- (2)
- These
options will vest in two remaining equal installments on April 6, 2018 and April 6, 2019.
- (3)
- These
options will vest in three remaining equal installments on March 1, 2018, March 1, 2019 and March 1, 2020.
- (4)
- These
options will vest in two remaining equal installments on October 27, 2017 and October 27, 2018.
- (5)
- These
options will vest in two remaining equal installments on January 19, 2018 and January 19, 2019.
- (6)
- These
options will vest in four remaining equal installments on December 19, 2017, December 19, 2018, December 19, 2019 and December 19,
2020.
- (7)
- These
options will vest in four remaining equal installments on November 29, 2017, November 29, 2018, November 29, 2019 and November 29,
2020.
- (8)
- These options will vest in four remaining equal installments on December 19, 2017, December 19, 2018, December 19, 2019 and December 2020.
Option Exercises
None of our NEOs exercised any options during the fiscal year ended September 30, 2017.
170
Nonqualified Deferred Compensation as of September 30, 2017
The following table provides information with respect to the Deferred Compensation Plan.
Name
|
Executive Contributions in Last FY ($)(1) |
Registrant Contributions in Last FY ($)(2) |
Aggregate Earnings in Last FY ($) |
Aggregate Withdrawals/ Distributions ($) |
Aggregate Balance at Last FYE ($) |
|||||||||||
|---|---|---|---|---|---|---|---|---|---|---|---|---|---|---|---|---|
Ronald Keating |
140,476 | 61,913 | 68,539 | 0 | 427,046 | |||||||||||
Benedict J. Stas |
58,023 | 15,409 | 9,320 | 0 | 94,838 | |||||||||||
Anthony J. Webster |
— | — | — | — | — | |||||||||||
Vincent Grieco |
— | — | — | — | — | |||||||||||
James Kohosek |
15,472 | 876 | 1,147 | 0 | 16,619 | |||||||||||
- (1)
- This
amount reflects a portion of salary that the indicated executive elected to defer during fiscal 2017. This amount is included in the "Salary" column of the
Summary Compensation Table above.
- (2)
- The full amounts reported as Company contributions have been reported in the "All Other Compensation" column in the Summary Compensation Table above.
Our NEOs based in the United States are eligible to participate in the Deferred Compensation Plan, which benefits only a select group of United States management employees. The Deferred Compensation Plan uses a hypothetical account for each participant who elects to defer income. The participant selects investment funds from a broad range of options. Earnings and losses on each account are determined based on the performance of the investment funds selected by the participant. A participant may elect to defer up to 50% of his annual base compensation and up to 90% of his bonus awarded pursuant to the MIP as compensation deferrals. The NEOs are 100% vested with respect to both employee contributions and their employer contributions. Distributions under the Deferred Compensation Plan may be made as a single lump sum, on a fixed date or schedule, or in equal installments over periods of (x) five, ten or fifteen years or (y) two, three, four or five years, depending on distribution's triggering event and the participant's elections, in compliance with the election and timing rules of Code Section 409A.
Payments upon Certain Events of Termination or Change in Control
In the event any NEO is terminated other than for Cause, Death or Disability (including due to non-extension of the employment term) or resigns for Good Reason (as defined in the Employment Agreements), he is entitled to the following: (i) base salary continuation for 12 months; (ii) a pro-rata portion of his actual annual bonus for the year in which termination occurs (except for Mr. Keating, who is entitled to a pro-rata portion of his target annual bonus opportunity for the year in which termination occurs); (iii) medical and dental benefits continuation for 12 months; and (iv) reimbursement for outplacement assistance for six months up to a maximum of $15,000.
In the event any NEO's employment is terminated by the Company for cause or on account of the NEO's death, disability or voluntary termination without good reason, the Company is obligated to pay the NEO any accrued benefits through the date of termination, which accrued benefits are quantified in the table below in the "Accrued Benefits" column.
171
The following table describes the estimated value of payments that would have been due to the NEOs in the event that their employment was terminated by the Company due to a termination other than for cause, death or disability of the NEO or by the NEO for good reason on September 30, 2017.
Name
|
Accrued Benefits ($) |
Base Salary ($) |
Pro Rata Bonus ($)(1) |
Medical Coverage ($) |
Outplacement(2) ($) |
Total ($) |
|||||||||||||
|---|---|---|---|---|---|---|---|---|---|---|---|---|---|---|---|---|---|---|---|
Ronald Keating |
— | 787,969 | 787,969 | 19,833 | 15,000 | 1,610,771 | |||||||||||||
Benedict J. Stas |
— | 390,000 | 273,000 | 18,994 | 15,000 | 696,994 | |||||||||||||
Anthony J. Webster |
— | 358,750 | 179,375 | 19,834 | 15,000 | 572,959 | |||||||||||||
Vincent Grieco |
— | 250,000 | 125,000 | 21,783 | 15,000 | 411,783 | |||||||||||||
James Kohosek |
— | 275,000 | 159,084 | 13,556 | 15,000 | 462,640 | |||||||||||||
- (1)
- For
Mr. Keating, this amount represents the pro-rata portion of his target bonus under the MIP for fiscal 2017 and for each of Messrs. Stas, Webster,
Grieco and Kohosek represents the pro-rata portion of his actual bonus payment under the MIP.
- (2)
- This amount represents the maximum reimbursement for outplacement services the NEO is entitled to under his Employment Agreement.
Additionally, our NEOs hold options issued pursuant to the Option Plan, which options become fully vested and exercisable upon a Change in Control (as defined below). The following table describes the estimated present value of payments for unvested options to purchase shares that would have become vested upon a Change in Control, assuming that such Change in Control occurred on September 30, 2017. In addition, pursuant to the terms of the Webster Bonus Agreement, upon a Change in Control subject to his continued employment through such Change in Control, Mr. Webster would be entitled to an additional cash payment equal to $635,000.
Name
|
Unvested Stock Options (#)(1) |
Total ($) |
|||||
|---|---|---|---|---|---|---|---|
Ronald Keating |
1,246,791 | 10,406,250 | |||||
Benedict J. Stas |
415,579 | 3,468,600 | |||||
Anthony J. Webster |
256,771 | 1,666,875 | |||||
Vincent Grieco |
160,991 | 1,064,550 | |||||
James Kohosek |
269,576 | 1,500,000 | |||||
- (1)
- Represents unvested options as of the fiscal year ended September 30, 2017. Calculations with regard to stock options are based upon the most recent appraisal price of the Company's common stock ($12.98 as of September 30, 2017), less exercise price.
172
The Company does not currently pay cash compensation to its directors who are employed by either the Company or AEA for their services as directors. Each non-employee, non-AEA director received options to purchase shares of the Company's common stock under the Option Plan, which generally vest as to 25% on the each anniversary of the date of grant such that the options will be fully vested on the fourth anniversary of the date of grant. Pursuant to a consulting agreement with the Company dated as of March 1, 2014, in respect of his services provided to the Company as a member of the Board, Mr. Lamb receives an annual cash retainer equal to $100,000, payable in substantially equal monthly installments at the end of each calendar month.
Shown below is information regarding the fiscal 2017 compensation for each member of the Board other than Mr. Keating, whose compensation is reported above in the Summary Compensation Table.
Name
|
Fees Earned or Paid in Cash ($) |
Option Awards(1) ($) |
All Other Compensation ($) |
Total ($) |
|||||||||
|---|---|---|---|---|---|---|---|---|---|---|---|---|---|
Nick Bhambri |
— | — | (1) | — | — | ||||||||
Gary Cappeline |
— | — | — | — | |||||||||
Judd Gregg |
— | — | (1) | — | — | ||||||||
Brian R. Hoesterey |
— | — | — | — | |||||||||
Ronald C. Keating |
— | — | — | — | |||||||||
Vinay Kumar |
— | — | — | — | |||||||||
Martin Lamb |
100,000 | — | (1) | — | 100,000 | ||||||||
- (1)
- Each of Messrs. Bhambri and Gregg held 179,807 options, which were vested as to 75%. Mr. Lamb was originally granted 359,614 options, of which 89,904 remaining outstanding and subject to vesting.
Material Terms of the Evoqua Water Technologies Corp. Stock Option Plan
The Evoqua Water Technologies Corp. Stock Option Plan (the "Option Plan") was established to attract, retain, incentivize and motivate officers and employees of, consultants to, and non-employee directors providing services to the Company and its subsidiaries and affiliates and to promote the success of the Company by providing such participating individuals with a proprietary interest in the performance of the Company. On March 6, 2014, the Board adopted the Option Plan under which 11,082,581 shares of common stock of the Company ("Shares") are reserved for the issuance of options to purchase Shares ("Options").
Administration. The Option Plan shall be administered by the Compensation Committee, which shall have all of the powers necessary to enable it to carry out its duties under the Option Plan properly, including the power and duty to construe and interpret the Option Plan and to determine all questions arising under it. The Compensation Committee may correct any defect, supply any omission, or reconcile any inconsistency in the Option Plan or in any Option in the manner and to the extent it deems necessary to carry out the intent of the Option Plan. The Compensation Committee's interpretations and determinations shall be final, binding and conclusive upon all persons.
Plan Term. The Option Plan became effective on March 6, 2014 and will terminate on the tenth (10th) anniversary thereof, unless earlier terminated by the Board.
Eligibility. Under the Option Plan, "Eligible Individuals" includes officers, employees, consultants, advisors and non-employee directors providing services to the Company and its subsidiaries and affiliates. The Compensation Committee will determine which Eligible Individuals will receive grants of options.
173
Option Price. The manner in which the exercise price is to be determined for Shares under each Option shall be determined by the Compensation Committee and set forth in the option agreement; provided, however, that the exercise price per Share under each Option shall not be less than the greater of (i) the par value of a Share and (ii) 100% of the fair market value of a Share on the date the Option is granted.
Maximum Duration. Options granted under the Option Plan shall be for such term as the Compensation Committee shall determine; provided that an Option shall not be exercisable after the expiration of 10 years from the date it is granted; provided, further, however, that unless the Compensation Committee provides otherwise, an Option may, upon the death of the participant prior to the expiration of the Option, be exercised for up to one year following the date of the participant's death, even if such period extends beyond 10 years from the date the Option is granted. The Compensation Committee may, subsequent to the granting of any Option, extend the period within which the Option may be exercised (including following a participant's termination), but in no event shall the period be extended to a date that is later than the earlier of the latest date on which the Option could have been exercised and the 10th anniversary of the date of grant of the Option.
Vesting. The Compensation Committee shall determine and set forth in the applicable option agreement the time or times at which an Option shall become vested and exercisable. To the extent not exercised, vested installments shall accumulate and be exercisable, in whole or in part, at any time after becoming exercisable, but not later than the date the Option expires. The Compensation Committee may accelerate the exercisability of any Option or portion thereof at any time.
Method of Exercise. The exercise of an Option shall be made only by giving notice in the form and to the person designated by the Company, specifying the number of Shares to be exercised and, to the extent applicable, accompanied by payment therefor and otherwise in accordance with the option agreement pursuant to which the Option was granted. The Option Price shall be paid in any or any combination of the following forms: (a) cash or its equivalent or (b) other property as determined by the Compensation Committee. Any Shares transferred to or withheld by the Company as payment of the exercise price under an Option (to the extent permitted by the Compensation Committee) shall be valued at their fair market value on the last business day preceding the date of exercise of such Option.
Adjustments. In the event of a Change in Capitalization (as defined in the Option Plan), the Compensation Committee shall conclusively determine the appropriate adjustments, if any, to (a) the maximum number and class of Shares with respect to which Options may be granted under the Option Plan, (b) the number and class of Shares or other stock or securities (of the Company or any other corporation or entity), cash or other property which are subject to outstanding Options granted under the Option Plan and the exercise price therefor, if applicable, and (c) any other adjustments the Compensation Committee determines to be equitable. If, by reason of a Change in Capitalization, pursuant to an option agreement, a participant shall be entitled to, or shall be entitled to exercise an Option with respect to, new, additional or different shares of stock or securities of the Company or any other entity, such new, additional or different shares shall thereupon be subject to all of the conditions and restrictions which were applicable to the Shares subject to the Option prior to such Change in Capitalization.
Effect of Change in Control or Certain Other Transactions. Unless otherwise provided in an award agreement, in connection with a merger, consolidation, reorganization, recapitalization or other similar change in the capital stock of the Company, or a liquidation or dissolution of the Company or a Change in Control (each, a "Corporate Transaction"), all outstanding Options shall terminate upon the consummation of the Corporate Transaction, unless provision is made in connection with such transaction, in the sole discretion of the Compensation Committee or the parties to the Corporate Transaction, for the assumption or continuation of such Options by, or the substitution for such Options with new awards of, the surviving, successor or resulting entity, or a parent or subsidiary
174
thereof, with such adjustments as to the number and kind of shares or other securities or property subject to such new awards, option and stock appreciation right exercise or base prices, and other terms of such new awards as the Compensation Committee or the parties to the Corporate Transaction shall agree. In the event that provision is made in writing as aforesaid in connection with a Corporate Transaction, the Option Plan and the unexercised Options theretofore granted or the new awards substituted therefor shall continue in the manner and under the terms provided in such writing. Notwithstanding the foregoing, except as otherwise provided in the applicable option agreement, vested Options (including those Options that would become vested upon the consummation of the Corporate Transaction) shall not be terminated upon the consummation of the Corporate Transaction unless holders of affected Options are provided either (a) a period of at least fifteen (15) calendar days prior to the date of the consummation of the Corporate Transaction to exercise the Options or (b) payment in respect of each Share covered by the Option being cancelled in an amount equal to the excess, if any, of the per Share price to be paid or distributed to stockholders in the Corporate Transaction over the option price of the Option.
Without limiting the generality of the foregoing or being construed as requiring any such action, in connection with a Corporate Transaction the Compensation Committee may, in its sole and absolute discretion, without the consent of any participant, cause any of the following actions to be taken effective upon or at any time prior to such Corporate Transaction: (a) cause any or all unvested Options to become fully vested and immediately exercisable (as applicable) and/or provide the holders of such Options a reasonable period of time prior to the date of the consummation of the Corporate Transaction to exercise the Options or (b) with respect to unvested Options that are terminated in connection with the Corporation Transaction, provide the holders thereof a payment in respect of each Share covered by the Option being terminated in an amount equal to all or a portion of the excess, if any, of the per Share price to be paid or distributed to stockholders in the Corporate Transaction over the option price of the Option.
For purposes of the Option Plan, "Change in Control" generally means (i) the approval by stockholders of the liquidation or dissolution of the Company, (ii) a transaction or series of related transactions resulting in the sale or other disposition of 51% or more of the outstanding voting stock of the Company, (iii) the merger or consolidation of the Company with or into any entity, or (iv) a sale or other disposition of substantially all of the assets of the Company; provided, however, that the term "Change in Control" shall exclude each transaction which is a "Non-Control Transaction." Unless otherwise provided in an option agreement, "Non-Control Transaction" means (i) any transaction following which AEA and/or its affiliates, participants, investors and/or employees own directly or indirectly a majority of the outstanding shares of voting stock of the Company or any purchasing or surviving entity, as applicable, (ii) a merger or consolidation following which those persons who owned directly or indirectly a majority of the outstanding shares of voting stock of the Company immediately prior to such merger or consolidation will own directly or indirectly a majority of the outstanding shares of voting stock of the surviving or resulting entity, as applicable, (iii) a sale or other disposition of capital stock of the Company following which those persons who owned directly or indirectly a majority of the outstanding shares of voting stock immediately prior to such sale will own directly or indirectly a majority of the outstanding interests or shares of voting stock of the Company or the purchasing entity, as applicable, (iv) a sale or other disposition of substantially all of the assets of the Company to an affiliate of the Company, (v) an initial public offering of the Company, or (vi) any transaction following which AEA, any person controlling or controlled by AEA, or any officers, directors, employees, participants or shareholders of AEA constitute a majority of the directors of the Board or have a right to elect a majority of the Board.
Transferability. Notwithstanding anything contained in the Option Plan or any option agreement to the contrary, in the event that the disposition of Shares acquired pursuant to the Option Plan is not covered by a then current registration statement under the Securities Act and is not otherwise exempt from such registration, such Shares shall be restricted against transfer to the extent required by the
175
Securities Act and Rule 144 or other regulations promulgated thereunder. The Compensation Committee may require any individual receiving Shares pursuant to an Option granted under the Option Plan, as a condition precedent to receipt of such Shares, to represent and warrant to the Company in writing that the Shares acquired by such individual are acquired without a view to any distribution thereof and will not be sold or transferred other than pursuant to an effective registration thereof under the Securities Act or pursuant to an exemption applicable under the Securities Act or the rules and regulations promulgated thereunder.
Amendment or Termination of the Option Plan. The Board may earlier terminate the Option Plan and the Board may at any time and from time to time amend, modify or suspend the Option Plan; provided, however, that (a) no such amendment, modification, suspension or termination shall impair or adversely alter any Options theretofore granted under the Option Plan, except with the consent of the participant, nor shall any such amendment, modification, suspension or termination deprive any participant of any Shares which he or she may have acquired through or as a result of the Option Plan and (b) to the extent necessary under any applicable law, regulation or exchange requirement, no other amendment shall be effective unless approved by the stockholders of the Company in accordance with applicable law, regulation or exchange requirement.
Material Terms of the Evoqua Water Technologies Corp. 2017 Equity Incentive Plan
Prior to the consummation of this offering, the Board is expected to adopt and recommend that our stockholders approve the Evoqua Water Technologies Corp. 2017 Equity Incentive Plan (or the "Equity Incentive Plan"), under which equity awards may be made in respect of 5,100,000 shares of common stock of the Company ("Shares"), as described further below in the section titled "—Shares Available." Under the Equity Incentive Plan, awards may be granted in the form of options, restricted stock, restricted stock units, stock appreciation rights, dividend equivalent rights, share awards and performance-based awards (including performance share units and performance-based restricted stock). The following is a summary of the material terms of the Equity Incentive Plan. This summary is qualified in its entirety by reference to the full text of the Equity Incentive Plan which will be filed as an exhibit to this registration statement.
Administration. The Equity Incentive Plan will be administered by a committee appointed by the board (the "Compensation Committee"). The Compensation Committee shall consist of at least two directors of the board and may consist of the entire board. The Compensation Committee will generally consist of directors considered to be non-employee directors for purposes of Section 16 of the Exchange Act, and to the extent that an award is intended to qualify as "performance-based compensation" within the meaning of Section 162(m) of the Internal Revenue Code of 1986, as amended (the "Code"), the Compensation Committee will consist of directors, each of whom shall be an "outside director" as defined within the meaning of Section 162(m) of the Code.
Plan Term. The Equity Incentive Plan will become effective as of the date it is approved by the Company's stockholders, and will terminate on the tenth (10th) anniversary thereof, unless earlier terminated by the board.
Eligibility. Under the Equity Incentive Plan, "Eligible Individuals" include officers, employees, consultants and non-employee directors providing services to the Company and its subsidiaries. The Compensation Committee will determine which Eligible Individuals will receive grants of awards.
Incentives Available. Under the Equity Incentive Plan, the Compensation Committee may grant any of the following types of awards to an Eligible Individual: incentive stock options ("ISOs"); nonqualified stock options ("Nonqualified Stock Options" and, together with ISOs, "Options"); stock appreciation rights ("SARs"); restricted stock grants ("Restricted Stock Grants"); restricted stock units ("RSUs"); Performance Awards; Dividend Equivalent Rights; and Share Awards, each as defined below (each type of grant is considered an "Award").
176
Shares Available. Subject to any adjustment as provided in the Equity Incentive Plan, up to 5,100,000 Shares may be issued pursuant to Awards granted under the Equity Incentive Plan, all of which may be granted as ISOs. In the case of an Eligible Individual who is an employee or consultant, the aggregate number of Shares that may be the subject of Options or SARs granted in any calendar year may not exceed 1,100,000 Shares, the aggregate number of Shares that may be the subject of Performance-Based Restricted Stock and Performance Share Units granted in any calendar year may not exceed 1,100,000 Shares, and the maximum dollar amount of cash or the fair market value of Shares that any individual may receive in any calendar year in respect of Performance Units may not exceed $5,000,000. In the case of an Eligible Individual who is a director, the aggregate number of Shares that may be the subject of Options or SARs granted in any calendar year may not exceed that number of Shares representing a fair market value equal to the positive difference, if any, between $700,000 and the aggregate value of any annual cash retainer paid to the director (excluding the value of any chairperson retainer or fee and meeting fees received by a director in respect of such calendar year).
If an Award or any portion thereof that is granted under the Equity Incentive Plan (i) expires or otherwise terminates without all of the Shares covered by such Award having been issued or (ii) is settled in cash (i.e., the participant receives cash rather than Shares), such expiration, termination or settlement will not reduce (or otherwise offset) the number of Shares that may be available for issuance under the Equity Incentive Plan. If any Shares issued pursuant to an Award are forfeited and returned back to or reacquired by the Company because of the failure to meet a contingency or condition required to vest such Shares in the participant, then the Shares that are forfeited or reacquired will again become available for issuance under the Equity Incentive Plan. Any Shares tendered or withheld (i) to pay the exercise price of an Option or (ii) to satisfy tax withholding obligations associated with an Award granted under the Equity Incentive Plan shall not become available again for issuance under the Equity Incentive Plan.
Stock Options. The Compensation Committee may grant Options (which may be ISOs or Nonqualified Stock Options) to Eligible Individuals. An ISO is an Option intended to qualify for tax treatment applicable to ISOs under Section 422 of the Code. An ISO may be granted only to Eligible Individuals that are employees of the Company or any of its subsidiaries. A Nonqualified Stock Option is an Option that is not subject to statutory requirements and limitations required for certain tax advantages allowed under Section 422 of the Code.
Vesting and Exercise Periods for Options. Each Option granted under the Equity Incentive Plan may be subject to certain vesting requirements and will become exercisable in accordance with the specific terms and conditions of the Option, as determined by the Compensation Committee at the time of grant and set forth in an Award agreement. The term of an Option generally may not exceed ten years from the date it is granted (five years in the case of an ISO granted to a ten-percent stockholder). Each Option, to the extent it becomes exercisable, may be exercised at any time in whole or in part until its expiration or termination, unless otherwise provided in applicable Award agreement.
Exercise Price for Options. The purchase price per Share with respect to any Option granted under the Equity Incentive Plan may be not less than 100% of the fair market value of a share of common stock on the date the Option is granted (110% in the case of an ISO granted to a ten-percent stockholder). Limits on Incentive Stock Options. In order to comply with the requirements for ISOs in the Code, no person may receive a grant of an ISO for stock that would have an aggregate fair market value in excess of $100,000, determined when the ISO is granted, that would be exercisable for the first time during any calendar year. If any grant of an ISO is made in excess of such limit, the portion that is over the $100,000 limit would be a Nonqualified Stock Option.
Stock Appreciation Rights. The Compensation Committee may grant SARs to Eligible Individuals on terms and conditions determined by the Compensation Committee at the time of grant and set forth
177
in an Award agreement. A SAR may be granted (a) at any time if unrelated to an Option or (b) if related to an Option, either at the time of grant or at any time thereafter during the term of the Option.
Amount Payable. A SAR is a right granted to a participant to receive an amount equal to the excess of the fair market value of a Share on the last business day preceding the date of exercise of such SAR over the fair market value of a Share on the date the SAR was granted. A SAR may be settled or paid in cash, Shares or a combination of each, in accordance with its terms.
Duration. Each SAR will be exercisable or be forfeited or expire on such terms as the Compensation Committee determines. Except in limited circumstances, an SAR shall have a term of no greater than ten years.
Prohibition on Repricings. The Compensation Committee will have no authority to make any adjustment or amendment (other than in connection with certain changes in capitalization or certain corporate transactions in accordance with the terms of the Equity Incentive Plan, as generally described below) that reduces, or would have the effect of reducing, the exercise price of an Option or SAR previously granted under the Equity Incentive Plan, unless the Company's stockholders approve such adjustment or amendment.
Dividend Equivalent Rights. The Compensation Committee may grant dividend equivalent rights ("Dividend Equivalent Rights"), either in tandem with an Award or as a separate Award, to Eligible Individuals on terms and conditions determined by the Compensation Committee at the time of grant and set forth in an Award agreement. A Dividend Equivalent Right is a right to receive cash or Shares based on the value of dividends that are paid with respect to the Shares. Amounts payable in respect of Dividend Equivalent Rights may be payable currently or, if applicable, deferred until the lapsing of restrictions on such dividend equivalent rights or until the vesting, exercise, payment, settlement or other lapse of restrictions on the Award to which the Dividend Equivalent Rights relate, subject to compliance with Section 409A of the Code. Dividend Equivalent Rights may be settled in cash or shares of common stock or a combination thereof, in a single installment or multiple installments, as determined by the Compensation Committee.
Restricted Stock; Restricted Stock Units. The Compensation Committee may grant either Shares (Restricted Stock) or phantom Shares (RSUs), in each case subject to certain vesting requirements, on terms and conditions determined by the Compensation Committee at the time of grant and set forth in an Award agreement.
Restricted Stock. Unless the Compensation Committee determines otherwise, upon the issuance of shares of Restricted Stock, the participant shall have all of the rights of a shareholder with respect to such Shares, including the right to vote the Shares and to receive all dividends or other distributions made with respect to the Shares. The Compensation Committee may determine that the payment to the participant of dividends, or a specified portion thereof, declared or paid on such Shares shall be deferred until the lapsing of the restrictions imposed upon such Shares and held by the Company for the account of the participant until such time. Payment of deferred dividends in respect of shares of Restricted Stock shall be made upon the lapsing of restrictions imposed on the shares of Restricted Stock in respect of which the deferred dividends were paid, and any dividends deferred in respect of any shares of Restricted Stock shall be forfeited upon the forfeiture of such shares of Restricted Stock.
Period for Lapsing of Restrictions on Restricted Stock. During such period as may be set by the Compensation Committee in the Award agreement (the "Vesting Period"), the Participant shall not be permitted to sell, transfer, pledge, hypothecate or assign shares of Restricted Stock awarded under the Equity Incentive Plan except by will or the laws of descent and distribution. The Compensation Committee may also impose such other restrictions and conditions, including the attainment of
178
pre-established Performance Objectives (as defined below) or other corporate or individual performance goals, on Restricted Stock as it determines in its sole discretion.
Restricted Stock Units. Each RSU shall represent the right of the participant to receive a payment upon vesting of the RSU, or on any later date specified by the Compensation Committee, of an amount equal to the fair market value of a Share as of the date the RSU becomes vested (together with such dividends as may have accrued with respect to such Share from the time of the grant of the Award until the time of vesting), or such later date as determined by the Compensation Committee at the time the RSU is granted (and which will be set forth in the applicable grant agreement). An RSU may be settled or paid in cash, Shares or a combination of each, as determined by the Compensation Committee.
Performance Awards. Performance awards (("Performance Awards") (including performance units ("Performance Units") and performance share units ("Performance Share Units")) and performance-based restricted stock ("Performance-Based Restricted Stock") may be granted to Eligible Individuals on terms and conditions determined by the Compensation Committee and set forth in an Award agreement.
Performance Units. Performance Units shall be denominated in a specified dollar amount and, contingent upon the attainment of specified performance objectives within a performance cycle and such other vesting conditions as may be determined by the Compensation Committee (including without limitation, a continued employment requirement following the end of the applicable performance period), represent the right to receive payment of the specified dollar amount or a percentage of the specified dollar amount depending on the level of performance objective attained; provided, however, that the Compensation Committee may at the time a Performance Unit is granted specify a maximum amount payable in respect of a vested Performance Unit. The award agreement for each Performance Unit shall specify the number of Performance Units to which it relates, the Performance Objectives and other conditions which must be satisfied in order for the Performance Unit to vest and the performance cycle within which such Performance Objectives must be satisfied and the circumstances under which the award will be forfeited.
Performance Share Units. Performance Share Units shall be denominated in Shares and, contingent upon the attainment of specified Performance Objectives within a performance cycle and such other vesting conditions as may be determined by the Compensation Committee (including, without limitation, a continued employment requirement following the end of the applicable performance period), represent the right to receive an amount of the fair market value of a Share on the date the Performance Share Unit becomes vested or any other date specified by the Compensation Committee or a percentage of such amount depending on the level of Performance Objective attained; provided, however, that the Compensation Committee may at the time a Performance Share Unit is granted specify a maximum amount payable in respect of a vested Performance Share Unit. A Performance Share Unit may be settled in cash, shares, or a combination of each. The Award agreement for each Performance Share Unit shall specify the number of Performance Share Units to which it relates, the Performance Objectives and other conditions which must be satisfied in order for the Performance Share Unit to vest and the performance cycle within which such Performance Objectives must be satisfied and the circumstances under which the Award will be forfeited.
Performance-Based Restricted Stock. Performance-Based Restricted Stock shall consist of an Award of shares of Restricted Stock, issued in the participant's name and subject to appropriate restrictions and transfer limitations. Unless the Compensation Committee determines otherwise and as set forth in the applicable Award agreement, upon issuance of Shares of Performance-Based Restricted Stock, the participant shall have all of the rights of a stockholder with respect to such Shares, including the right to vote the Shares and to receive all dividends or other distributions paid or made with respect to Shares. The Award agreement for each Award of Performance-Based Restricted Stock will specify the
179
number of shares of Performance-Based Restricted Stock to which it relates, the Performance Objectives and other conditions that must be satisfied in order for the Performance-Based Restricted Stock to vest, the performance cycle within which the Performance Objectives must be satisfied (which will not be less than one (1) year) and the circumstances under which the Award will be forfeited. At the time the Award of Performance-Based Restricted Stock is granted, the Compensation Committee may determine that the payment to the participant of dividends, or a specified portion thereof, declared or paid on Shares represented by such Award which have been issued by the Company to the participant shall be deferred until the lapsing of the restrictions imposed upon such Performance-Based Restricted Stock and held by the Company for the account of the participant until such time. Payment of deferred dividends in respect of Shares of Performance-Based Restricted Stock shall be made upon the lapsing of restrictions imposed on the Performance-Based Restricted Stock in respect of which the deferred dividends were paid, and any dividends deferred in respect of any Performance-Based Restricted Stock shall be forfeited upon the forfeiture of such Performance-Based Restricted Stock.
Performance Objectives. With respect to any Performance Awards intended to constitute "performance-based compensation" under Section 162(m) of the Code, performance objectives ("Performance Objectives") may be expressed in terms of (i) net earnings; (ii) earnings per share; (iii) net debt; (iv) revenue or sales growth; (v) net or operating income; (vi) net operating profit; (vii) return measures (including, but not limited to, return on assets, capital, equity or sales); (viii) cash flow (including, but not limited to, operating cash flow, distributable cash flow and free cash flow); (ix) earnings before or after taxes, interest, depreciation, amortization and/or rent; (x) share price (including, but not limited to growth measures and total stockholder return); (xi) expense control or loss management; (xii) customer satisfaction; (xiii) market share; (xiv) economic value added; (xv) working capital; (xvi) the formation of joint ventures or the completion of other corporate transactions; (xvii) gross or net profit margins; (xviii) revenue mix; (xix) operating efficiency; (xx) product diversification; (xxi) market penetration; (xxii) measurable achievement in quality, operation or compliance initiatives; (xxiii) quarterly dividends or distributions; (xxiv) employee retention or turnover; (xxv) sales or (xxvi) any combination of or a specified increase in any of the foregoing. Performance Objectives may be in respect of the performance of the Company, any of its Subsidiaries or Divisions (as defined in the Equity Incentive Plan) or any combination thereof. Performance Objectives may be absolute or relative (to prior performance of the Company or to the performance of one or more other entities or external indices) and may be expressed in terms of a progression within a specified range. The Compensation Committee may, at the time the Performance Objectives in respect of a Performance Award are established, provide for the manner in which performance will be measured against the Performance Objectives to reflect the impact of specified events, including any one or more of the following with respect to the applicable performance period: (i) the gain, loss, income or expense resulting from changes in accounting principles or tax laws that become effective during the performance period; (ii) the gain, loss, income or expense reported publicly by the Company with respect to the performance period that are extraordinary or unusual in nature or infrequent in occurrence; (iii) the gains or losses resulting from, and the direct expenses incurred in connection with, the disposition of a business or the sale of investments or non-core assets; (iv) the gain or loss from all or certain claims and/or litigation and all or certain insurance recoveries relating to claims or litigation; or (v) the impact of investments or acquisitions made during the year or, to the extent provided by the Compensation Committee, any prior year. The events may relate to the Company as a whole or to any part of the Company's business or operations, as determined by the Compensation Committee at the time the Performance Objectives are established. Any adjustments based on the effect of certain events are to be determined in accordance with generally accepted accounting principles and standards, unless another objective method of measurement is designated by the Compensation Committee.
Prior to the vesting, payment, settlement or lapsing of any restrictions with respect to any Performance Award intended to qualify as "performance-based compensation" under Section 162(m) of the Code, the Compensation Committee shall certify in writing that the applicable Performance
180
Objectives have been satisfied. In respect of a Performance Award, the Compensation Committee may, in its sole discretion, (i) reduce the amount of cash paid or number of Shares to be issued or that have been issued and that become vested or on which restrictions lapse, and/or (ii) establish rules and procedures that have the effect of limiting the amount payable to any Participant to an amount that is less than the amount that otherwise would be payable under such Award. The Compensation Committee may exercise such discretion in a non-uniform manner among Participants.
Share Awards. The Compensation Committee may grant an Award of Shares ("Share Awards") to an Eligible Individual on such terms and conditions as the Compensation Committee may determine at the time of grant. A Share Award may be made as additional compensation for services rendered by the Eligible Individual or may be in lieu of cash or other compensation to which the Eligible Individual is entitled from the Company.
Adjustments upon Changes in Capitalization. In the event that the outstanding Shares are changed into or exchanged for a different number or kind of Shares or other stock or securities or other equity interests of the Company or another corporation or entity, whether through merger, consolidation, reorganizations, recapitalization, reclassification, stock dividend, stock split, reverse stock split, substitution or other similar corporate event or transaction, or an extraordinary dividend or distribution by the Company in respect of its Shares or other capital stock or securities convertible into capital stock in cash, securities or other property, the Compensation Committee shall determine the appropriate adjustments, if any, to (a) the maximum number and kind of shares of stock or other securities or other equity interests as to which Awards may be granted under the Equity Incentive Plan, (b) the maximum number and class of Shares or other stock or securities that may be issued upon exercise of ISOs, (c) the number and kind of Shares or other securities covered by any or all outstanding Awards that have been granted under the Equity Incentive Plan, (d) the option price of outstanding Options and the base price of outstanding SARs, and (e) the Performance Objectives applicable to outstanding Performance Awards.
Effect of Change in Control or Certain Other Transactions. Generally, the Award agreement evidencing each Award will provide any specific terms applicable to that Award in the event of a Change in Control of the Company (as defined below). Unless otherwise provided in an Award agreement, in connection with a merger, consolidation, reorganization, recapitalization or other similar change in the capital stock of the Company, or a liquidation or dissolution of the Company or a Change in Control (each a "Corporate Transaction"), Awards shall either: (a) continue following such Corporate Transaction, which may include, in the discretion of the Compensation Committee or the parties to the Corporate Transaction, the assumption, continuation or substitution of the Awards, in each case with appropriate adjustments to the number, kind of shares, and exercise prices of the Awards; or (b) terminate.
For purposes of the Equity Incentive Plan, "Change in Control" generally means the occurrence of any of the following events with respect to the Company: (a) any person (other than directly from the Company) first acquires securities of the Company representing fifty percent or more of the combined voting power of the Company's then outstanding voting securities, other than an acquisition by certain employee benefit plans, the Company or a related entity, or any person in connection with a non-control transaction; (b) a majority of the members of the board of directors is replaced by directors whose appointment or election is not endorsed by a majority of the members of the board of directors serving immediately prior to such appointment or election; (c) any merger, consolidation or reorganization, other than in a non-control transaction; (d) a complete liquidation or dissolution or (e) sale or disposition of all or substantially all of the assets. A "non-control transaction" generally includes any transaction in which (i) stockholders immediately before such transaction continue to own at least a majority of the combined voting power of such resulting entity following the transaction; (ii) a majority of the members of the board of directors immediately before such transaction continue to constitute at least a majority of the board of the surviving entity following such transaction or (iii) with
181
certain exceptions, no person other than any person who had beneficial ownership of more than fifty percent of the combined voting power of the Company's then outstanding voting securities immediately prior to such transaction has beneficial ownership of more than fifty percent of the combined voting power of the surviving entity's outstanding voting securities immediately after such transaction.
Options and SARs Terminated in Corporate Transaction. If Options or SARs are to terminate in the event of a corporate transaction, the holders of vested Options or SARs must be provided either (a) fifteen days to exercise their Options or SARs or (b) payment (in cash or other consideration) in respect of each Share covered by the Option of SAR being cancelled in an amount equal to the excess, if any, of the per Share consideration to be paid to stockholders in the Corporate Transaction over the price of the Option or the SAR. If the per Share consideration to be paid to stockholders in the Corporate Transaction is less than the exercise price of the Option or SAR, the Option or SAR may be terminated without payment of any kind. The holders of unvested Options or SARs may also receive payment, at the discretion of the Compensation Committee, in the same manner as described above for vested Options and SARs. The Compensation Committee may also accelerate the vesting on any unvested Option or SAR and provide holders of such Options or SARS a reasonable opportunity to exercise the Award.
Other Awards Terminated in Corporate Transaction. If Awards other than Options and SARs are to terminate in connection with a corporate transaction, the holders of vested Awards will be provided, and holders of unvested Awards may be provided, at the discretion of the Compensation Committee, payment (in cash or other consideration upon or immediately following the Corporate Transaction, or, to the extent permitted by Section 409A of the Code, on a deferred basis) in respect of each Share covered by the Award being cancelled in an amount equal to the per Share price to be paid to stockholders in the Corporate Transaction, where the value of any non-cash consideration will be determined by the Compensation Committee in good faith.
The Compensation Committee may, in its sole discretion, provide for different treatment for different Awards or Awards held by different parties, and where alternative treatment is available for a participant's Awards, may allow the participant to choose which treatment will apply to his or her Awards.
Transferability. The Equity Incentive Plan generally restricts the transfer of any Awards, except (a) transfers by will or the laws of descent and distribution or (b) to a beneficiary designated by the participant, to whom any benefit under the Equity Incentive Plan is to be paid or who may exercise any rights of the participant in the event of the participant's death before he or she receives any or all of such benefit or exercises an Award.
Amendment or Termination of the Equity Incentive Plan. The Equity Incentive Plan may be amended or terminated by the board of directors without shareholder approval unless shareholder approval of the amendment or termination is required under applicable law, regulation or New York Stock Exchange requirement. No amendment may materially and adversely alter or impair any Awards that had been granted under the Equity Incentive Plan prior to the amendment without the impacted participant's consent. The Equity Incentive Plan will terminate on the tenth anniversary of its effective date; however, when the Equity Incentive Plan terminates, any applicable terms will remain in effect for administration of any Awards outstanding at the time of the Equity Incentive Plan's termination.
Forfeiture Events; Clawback. The Compensation Committee may specify in an Award agreement that the participant's rights, payments and benefits with respect to an Award shall be subject to reduction, cancellation, forfeiture, clawback or recoupment upon the occurrence of certain specified events or as required by law, in addition to any otherwise applicable forfeiture provisions that apply to the Award. Without limiting the generality of the foregoing, any Award under the Equity Incentive Plan shall be subject to the terms of any clawback policy maintained by the Company, as it may be amended from time to time.
182
Material Terms of the Evoqua Water Technologies Corp. 2017 Annual Incentive Plan
In connection with this offering, the Board is expected to adopt the Evoqua Water Technologies Corp. 2017 Annual Incentive Plan, or the "Bonus Plan", which sets forth performance criteria and performance goals which may be used by the Compensation Committee for the grant of annual bonus awards to our executive officers and key employees. The following is a summary of the material terms of the Bonus Plan. This summary is qualified in its entirety by reference to the full text of the Bonus Plan which will be filed as an exhibit to this registration statement.
The Bonus Plan will be administered by the Compensation Committee. Subject to the limitations set forth in the Bonus Plan, the Compensation Committee shall have the authority to determine, for each plan year, the time or times at which awards may be granted, the recipients of awards, the performance criteria, the performance goals and all other terms of an award, to interpret the Bonus Plan, to make all determinations under the Bonus Plan and necessary or advisable for the administration of the Bonus Plan, and to prescribe, amend and rescind rules and regulations relating to the Bonus Plan. The Compensation Committee may delegate responsibility for performing certain ministerial functions under the Bonus Plan to any officer or employee of the Company.
The performance criteria for us or any identified subsidiary or business unit, as selected by the Compensation Committee in its sole discretion at the time of the award, will be one or any combination of the following: (i) net earnings; (ii) earnings per share; (iii) net debt; (iv) revenue or sales growth; (v) net or operating income; (vi) net operating profit; (vii) return measures (including, but not limited to, return on assets, capital, equity or sales); (viii) cash flow (including, but not limited to, operating cash flow, distributable cash flow and free cash flow); (ix) earnings before or after taxes, interest, depreciation, amortization and/or rent; (x) share price (including, but not limited to growth measures and total stockholder return); (xi) expense control or loss management; (xii) customer satisfaction; (xiii) market share; (xiv) economic value added; (xv) working capital; (xvi) the formation of joint ventures or the completion of other corporate transactions; (xvii) gross or net profit margins; (xviii) revenue mix; (xix) operating efficiency; (xx) product diversification; (xxi) market penetration; (xxii) measurable achievement in quality, operation or compliance initiatives; (xxiii) quarterly dividends or distributions; (xxiv) employee retention or turnover; (xxv) sales or (xxvi) any combination of or a specified increase in any of the foregoing, or such other performance criteria determined to be appropriate by the Compensation Committee in its sole discretion.
The performance goals shall be the levels of achievement relating to the performance criteria as selected by the Compensation Committee for an award. The Compensation Committee shall be able to establish such performance goals relative to the applicable performance criteria in its sole discretion at the time of an award. The performance goals may be applied on an absolute basis or relative to an identified index or peer group, as specified by the Compensation Committee. The performance goals may be applied by the Compensation Committee after excluding charges for restructurings, discontinued operations, extraordinary items and other unusual or nonrecurring items and the cumulative effects of accounting changes, and without regard to realized capital gains.
Because the Bonus Plan will be adopted prior to our becoming a publicly held company, it is intended to satisfy the requirements for transition relief under Section 162(m) of the Code, such that the $1,000,000 annual deduction limit under Section 162(m) of the Code does not apply to any remuneration paid pursuant to this Bonus Plan until the first meeting of our stockholders at which our directors are to be elected that occurs after the close of the third calendar year following the calendar year in which the initial public offering of our common stock occurs.
The Bonus Plan shall be effective as of the date of its approval by the Board.
183
PRINCIPAL AND SELLING STOCKHOLDERS
The following table sets forth information regarding the beneficial ownership of our common stock as of October 16, 2017, and as adjusted to reflect the sale of the shares of common stock offered in this offering for:
- •
- each person or entity who is known by us to beneficially own more than 5% of our common stock;
- •
- each of our directors and named executive officers;
- •
- all of our directors and executive officers as a group; and
- •
- each selling stockholder.
Each stockholder's percentage ownership before and after the completion of this offering is based on 104,948,924 shares of common stock outstanding as of October 16, 2017, and each stockholder's percentage ownership after the offering is based on 113,282,257 shares of common stock outstanding immediately after the completion of this offering plus, in each case, the number of shares of common stock such stockholder has the right to acquire, including through the exercise of options, within 60 days of October 16, 2017. For a discussion of our stock split, see "Prospectus Summary—The Offering" and "Description of Capital Stock."
Information with respect to beneficial ownership has been furnished to us by each director, executive officer or stockholder listed in the table below, as the case may be. The amounts and percentages of our common stock beneficially owned are reported on the basis of rules of the SEC governing the determination of beneficial ownership of securities. Under these rules, a person is deemed to be a "beneficial owner" of a security if that person has or shares "voting power," which includes the power to vote or direct the voting of such security, or "investment power," which includes the power to dispose of or to direct the disposition of such security. A person is also deemed to be a beneficial owner of any securities of which that person has a right to acquire beneficial ownership within 60 days after October 16, 2017, including any shares of our common stock subject to an option that has vested or will vest within 60 days after October 16, 2017. More than one person may be deemed to be a beneficial owner of the same securities.
Unless otherwise indicated below, to our knowledge, all persons listed below have sole voting and investment power with respect to their shares of common stock, except to the extent authority is shared by spouses under applicable law. Unless otherwise indicated below, the address for each person or entity listed below is c/o Evoqua Water Technologies Corp., 210 Sixth Avenue, Pittsburgh, Pennsylvania 15222.
184
| |
|
|
|
|
After this Offering | ||||||||||||||||||||
|---|---|---|---|---|---|---|---|---|---|---|---|---|---|---|---|---|---|---|---|---|---|---|---|---|---|
| |
Prior to this Offering | Shares to be Sold in this Offering | |||||||||||||||||||||||
| |
|
|
Common Stock Beneficially Owned Assuming Underwriters' Option to Purchase Additional Shares is Exercised in Full |
||||||||||||||||||||||
| |
Common Stock Beneficially Owned |
Assuming Underwriters' Option to Purchase Additional Shares is not Exercised |
Assuming Underwriters' Option to Purchase Additional Shares is Exercised in Full |
Common Stock Beneficially Owned Assuming Underwriters' Option to Purchase Additional Shares is not Exercised |
|||||||||||||||||||||
Name of Beneficial Owner
|
Number | Percentage | Number | Number | Number | Percentage | Number | Percentage | |||||||||||||||||
5% Stockholders |
|||||||||||||||||||||||||
AEA(1) |
61,357,648 | 58.5 | % | 12,670,039 | 15,385,048 | 48,687,608 | 43.0 | % | 45,972,599 | 40.6 | % | ||||||||||||||
bcIMC Private Placement (2013) Investment Corporation(2) |
11,780,668 | 11.2 | % | 2,432,648 | 2,953,929 | 9,348,021 | 8.3 | % | 8,826,739 | 7.8 | % | ||||||||||||||
Havelock Fund Investments Pte Ltd(3) |
8,087,290 | 7.7 | % | — | — | 8,087,290 | 7.1 | % | 8,087,290 | 7.1 | % | ||||||||||||||
Pictet Private Equity Investors SA(4) |
9,817,223 | 9.4 | % | 2,027,206 | 2,461,608 | 7,790,017 | 6.9 | % | 7,355,615 | 6.5 | % | ||||||||||||||
Directors and Named Executive Officers |
|||||||||||||||||||||||||
Ronald C. Keating |
1,414,470 | 1.3 | % | — | — | 1,414,470 | 1.2 | % | 1,414,470 | 1.2 | % | ||||||||||||||
Benedict J. Stas |
437,536 | * | — | — | 437,536 | * | 437,536 | * | |||||||||||||||||
Anthony J. Webster |
88,960 | * | — | — | 88,960 | * | 88,960 | * | |||||||||||||||||
Vincent Grieco |
90,561 | * | — | — | 90,561 | * | 90,561 | * | |||||||||||||||||
James Kohosek |
64,024 | * | — | — | 64,024 | * | 64,024 | * | |||||||||||||||||
Martin Lamb |
444,969 | * | — | — | 444,969 | * | 444,969 | * | |||||||||||||||||
Nick Bhambri |
134,856 | * | — | — | 134,856 | * | 134,856 | * | |||||||||||||||||
Gary Cappeline(5) |
— | — | — | — | — | — | — | — | |||||||||||||||||
Judd Gregg |
134,856 | * | — | — | 134,856 | * | 134,856 | * | |||||||||||||||||
Brian R. Hoesterey(5) |
— | — | — | — | — | — | — | — | |||||||||||||||||
Vinay Kumar(5) |
— | — | — | — | — | — | — | — | |||||||||||||||||
All executive officers and directors as a group (16 persons) |
4,138,815 | 3.8 | % | 22,266 | 27,038 | 4,116,549 | 3.6 | % | 4,111,777 | 3.6 | % | ||||||||||||||
Other Selling Stockholders |
|||||||||||||||||||||||||
bcIMC (WCBAF) Private Placement (2013) Investment Corporation(6) |
1,854,364 | 1.8 | % | 382,917 | 464,970 | 1,471,447 | 1.3 | % | 1,389,394 | 1.2 | % | ||||||||||||||
FW RMB Nansemond Investors, LLC(7) |
1,227,153 | 1.2 | % | 253,401 | 307,701 | 973,752 | * | 919,452 | 0.8 | % | |||||||||||||||
Jungfrau SICAV-SIF(8) |
2,045,255 | 1.9 | % | 422,334 | 512,835 | 1,622,921 | 1.4 | % | 1,532,420 | 1.4 | % | ||||||||||||||
LCY Investments Corp. |
272,701 | * | 56,311 | 68,378 | 216,390 | * | 204,323 | * | |||||||||||||||||
Monte Rosa Opportunities SICAV-SIF(9) |
1,636,204 | 1.6 | % | 337,868 | 410,267 | 1,298,335 | 1.4 | % | 1,225,937 | 1.1 | % | ||||||||||||||
NB PEP Holdings Limited(10) |
818,102 | * | 168,934 | 205,134 | 649,168 | * | 612,968 | * | |||||||||||||||||
Neuman, Charles M.(11) |
308,087 | * | 63,618 | 77,251 | 244,469 | * | 230,836 | * | |||||||||||||||||
Neuman, Randal S.(12) |
539,152 | * | 111,332 | 135,189 | 427,820 | * | 403,963 | * | |||||||||||||||||
Partners Group U.S. Private Equity 2011, L.P. Inc.(13) |
1,363,503 | 1.3 | % | 281,556 | 341,890 | 1,081,947 | 1.0 | % | 1,021,613 | * | |||||||||||||||
Xyris Inc. |
272,701 | * | 56,311 | 68,378 | 216,390 | * | 204,323 | * | |||||||||||||||||
All other selling stockholders as a group holding less than 1% of outstanding shares in aggregate(14) |
763,713 | * | 157,703 | 191,496 | 606,217 | * | 572,216 | * | |||||||||||||||||
- *
- Represents
beneficial ownership of less than 1% of our outstanding common stock.
- (1)
- Represents shares of our common stock held of record by AEA EWT Holdings LP ("AEA EWT Holdings"), whose general partner is AEA EWT Holdings GP LLC ("AEA EWT Holdings GP"). The members of AEA EWT Holdings GP are (i) AEA Investors Participant Fund V LP, (ii) AEA Investors QP Participant Fund V LP, (iii) AEA Investors Fund V LP, (iv) AEA Investors Fund V-A LP and (v) AEA Investors Fund V-B LP (the entities named in clauses (i) through (v), collectively, the "AEA Funds"). The AEA Funds are also limited partners of AEA EWT Holdings. The general partner of
185
each of AEA Investors Participant Fund V LP and AEA Investors QP Participant Fund V LP is AEA Investors PF V LLC, whose sole member is AEA Investors LP. The general partner of each of AEA Investors Fund V LP, AEA Investors Fund V-A LP and AEA Investors Fund V-B LP is AEA Investors Partners V LP, whose general partner is AEA Management (Cayman) Ltd. Each of AEA EWT Holdings GP, the AEA Funds, AEA Investors PF V LLC, AEA Investors Partners V LP, AEA Investors LP and AEA Management (Cayman) Ltd. may be deemed to share beneficial ownership of the shares of our common stock held of record by AEA EWT Holdings, but each disclaims beneficial ownership of such shares. John L. Garcia, the Chairman and Chief Executive Officer of AEA Investors LP and the sole stockholder and director of AEA Management (Cayman) Ltd., may also be deemed to share beneficial ownership of the shares of our common stock held of record by AEA EWT Holdings, but Mr. Garcia disclaims beneficial ownership of such shares. The shares of our common stock held of record by AEA EWT Holdings reflected in the table above do not include 43,586,681 shares of our common stock owned by certain of our stockholders prior to this offering that have agreed to vote all of their shares to elect one individual to our board of directors that has been nominated by AEA (so long as AEA holds an aggregate of at least 10% of our outstanding common stock) pursuant to the Stockholders' Agreement or irrevocable voting proxies. AEA EWT Holdings may be deemed to have or share voting control with respect to the shares of our common stock owned by these stockholders, but AEA EWT Holdings disclaims beneficial ownership of such shares. For a description of our relationship with AEA, please see "Certain Relationships and Related Party Transactions—Stockholders' Agreement."
- The
address for each of AEA EWT Holdings, AEA EWT Holdings GP, AEA Investors Participant Fund V LP, AEA Investors QP Participant Fund
V LP, AEA Investors PF V LLC, AEA Investors LP and Mr. Garcia is c/o AEA Investors LP, 666 Fifth Avenue, 36th Floor, New York, New York 10103. The address for
each of AEA Investors Fund V LP, AEA Investors Fund V-A LP, AEA Investors Fund V-B LP, AEA Investors Partners V LP and AEA Management (Cayman) Ltd. is
P.O. Box 309, Ugland House, Grand Cayman KY1-1104, Cayman Islands.
- (2)
- Jim
Pittman is Director, President and chair of bcIMC Private Placement (2013) Investment Corporation. David Woodward and Julian Remedios are Vice Presidents of
bcIMC Private Placement (2013) Investment Corporation. Patricia Bood is Secretary of bcIMC Private Placement (2013) Investment Corporation. Britta Wagner is Assistant Secretary of bcIMC Private
Placement (2013) Investment Corporation. In such capacities, Messrs. Pittman, Woodward and Remedios and Mss. Bood and Wagner may be deemed to have voting and dispositive power over the
shares of our common stock held by bcIMC Private Placement (2013) Investment Corporation. Each of Messrs. Pittman, Woodward and Remedios and Mss. Bood and Wagner disclaim beneficial
ownership of these shares. The address for bcIMC Private Placement (2013) Investment Corporation and Messrs. Pittman, Woodward and Remedios and Mss. Bood and Wagner is 300-2950 Jutland
Rd. Victoria, British Columbia V8T5K2.
- (3)
- Havelock
Fund Investments Pte Ltd. is wholly owned by its ultimate parent, Temasek Holdings (Private) Limited, which possesses voting and investment control over the
shares held by Havelock Fund Investments Pte Ltd. The address of these entities is 60B Orchard Road, #06-18 Tower 2, The Atrium@Orchard, Singapore 238891.
- (4)
- Mr. Carsten
Beyer has voting and investment control over the shares of our common stock held by Pictet Private Equity Investors SA, but disclaims
beneficial ownership of such shares, except to the extent of any pecuniary interest therein.
- (5)
- Does
not include 61,357,647 shares of our common stock held of record by AEA EWT Holdings. Mr. Cappeline is an operating partner of AEA, and
Messrs. Hoesterey and Kumar are partners of AEA. Each of Messrs. Cappeline, Hoesterey and Kumar serves on our board of directors as a representative of AEA, but each disclaims beneficial
ownership of the shares of our common stock held of record by AEA EWT Holdings.
- (6)
- Jim
Pittman is Director, President and chair of bcIMC (WCBAF) Private Placement (2013) Investment Corporation. David Woodward and Julian Remedios are Vice Presidents
of bcIMC (WCBAF) Private Placement (2013) Investment Corporation. Patricia Bood is Secretary of bcIMC (WCBAF) Private Placement (2013) Investment Corporation. Britta Wagner is Assistant Secretary of
bcIMC (WCBAF) Private Placement (2013) Investment Corporation. In such capacities, Messrs. Pittman, Woodward and Remedios and Mss. Bood and Wagner may be deemed to have voting and dispositive
power over the shares of our common stock held by bcIMC (WCBAF) Private Placement (2013) Investment Corporation. Each of Messrs. Pittman, Woodward and Remedios and Mss. Bood and Wagner disclaim
beneficial ownership of these shares. The address for bcIMC (WCBAF) Private Placement (2013) Investment Corporation and Messrs. Pittman, Woodward and Remedios and Mss. Bood and Wagner is
300-2950 Jutland Rd. Victoria, British Columbia V8T5K2.
- (7)
- J.
Taylor Crandall is Manager of FW RMB Nansemond Investors, LLC. In such capacity, Mr. Crandall may be deemed to have voting and dispositive power
over the shares of our common stock held by FW RMB Nansemond Investors, LLC. Mr. Crandall disclaims beneficial ownership of these shares. The address for FW RMB Nansemond
Investors, LLC and Mr. Crandall is 201 Main Street, Suite 3100, Fort Worth, Texas 76102.
- (8)
- Mike
Kara, Pierre-Alain Wavre and Marc Wenda may be deemed to have voting and dispositive power over the shares held by Jungfrau SICAV-SIF. The address for each of
Messrs. Kara, Wavre and Wenda is 15 Avenue J.F. Kennedy, L-1855 Luxembourg.
- (9)
- Jens
Hoellermann, Francesco Ilardi, Mike Kara, Rémy Obermann and Marc Wenda may be deemed to have voting and dispositive power over the shares held by
Monte Rosa Opportunities SICAV-SIF. The address for each of Messrs. Hoellermannm Ilardi, Kara, Obermann and Wenda is 15 Avenue J.F. Kennedy, L-1855 Luxembourg.
- (10)
- Josh Miller, Langston Theis and Blake Rice may be deemed to have voting and dispositive power over the shares held by NB PEP Holdings Limited. Each of Messrs. Miller, Theis and Rice disclaim beneficial ownership of these shares. The address for each of Messrs. Miller, Theis and Rice is 325 N. Saint Paul St., Suite 4900, Dallas, Texas 75201.
186
- (11)
- Charles M.
Neuman is currently a consultant to the Company. He also previously acted as a consultant to Neptune-Benson. His address is c/o Source
Consulting, LLC N10467 Chief Kuno Trail, Fox Lake, Wisconsin 53933.
- (12)
- The
address of Randal S. Neuman is W9684 Beaverland Parkway, Beaver Dam, Wisconsin 53916.
- (13)
- Partners
Group Management X Limited is the General Partner of Partners Group U. S. Private Equity 2011, L.P., Inc. Susan Catherine Peer, Mark David
Rowe, Daniel Francis Stopher and Dr. Michael Studer are the directors of Partners Group Management X Limited. In such capacities, Partners Group Management X Limited and each of
Ms. Peer, Messrs. Rowe and Stopher and Dr. Studer may be deemed to have voting and dispositive power over the shares of our common stock held by Partners Group U. S. Private
Equity 2011, L.P., Inc. The address for each of Partners Group Management X Limited, Ms. Peer, Messrs. Rowe and Stopher and Dr. Studer is Tudor House Le Bordage,
St. Peter Port GY1 6BD, Guernsey.
- (14)
- Represents shares held by all other selling stockholders not listed above who, in the aggregate, beneficially own less than 1% of our common stock outstanding prior to this offering, and includes 81,250 shares of common stock issuable upon exercise of options held by certain of our employees that have vested or will vest within 60 days after October 16, 2017.
187
CERTAIN RELATIONSHIPS AND RELATED PARTY TRANSACTIONS
The following is a description of transactions since October 1, 2013 to which we were a party in which the amount involved exceeded or will exceed $120,000, and in which any of our executive officers, directors or holders of more than 5% of any class of our voting securities, or an affiliate or immediate family member thereof, had or will have a direct or indirect material interest. We believe the terms obtained or consideration that we paid or received, as applicable, in connection with the transactions described below were comparable to terms available or amounts that would be paid or received, as applicable, in arms'-length transactions with unrelated third parties.
Management Agreement
We have entered into a management agreement with our Sponsor relating to the provision of its advisory and consulting services. The agreement requires us to pay our Sponsor an annual management fee of approximately $4.0 million per year following the AEA Acquisition and continuing for as long as our Sponsor, either directly or indirectly, owns any of our or our subsidiaries' equity. The annual management fee is payable in quarterly installments of approximately $1.0 million, in advance, on the first day of each calendar quarter. The agreement also requires us to reimburse our Sponsor for its reasonable out-of-pocket costs and expenses incurred in connection with the AEA Acquisition, its provision of ongoing advisory and consulting services, monitoring its investment in us and developing, negotiating, performing or enforcing any agreements or documents relating to its investment in us. We incurred expenses, excluding advisory fees, of $0.4 million and $2.0 million for the years ending September 30, 2016 and 2015 and $1.4 million for the period January 16, 2014 through September 30, 2014, respectively. We believe that the agreement and the services mentioned above are or were on terms at least as favorable to us as we would expect to negotiate with unrelated third parties. Immediately following this offering, the agreement will be terminated. While the agreement does not require us to pay our Sponsor a termination fee, we will be required to reimburse our Sponsor for its reasonable out-of-pocket costs and expenses incurred in connection with this offering.
Pursuant to the agreement, we agreed to indemnify our Sponsor against any claims or liabilities relating to or arising out of actions taken by our Sponsor relating to the provision of its advisory and consulting services (under the terms of the agreement) or the operation of our business, except for claims or liabilities that are shown to have resulted from actions taken by our Sponsor in bad faith, or due to our Sponsor's gross negligence or willful misconduct. If for any reason (other than the bad faith, gross negligence or willful misconduct of our Sponsor as provided above) the foregoing indemnity is unavailable to or insufficient to hold our Sponsor harmless, then we will be required to contribute to any amount paid or payable by our Sponsor as a result of such claims or liabilities in such proportion as is appropriate to reflect (i) the relative benefits received by us, on the one hand, and our Sponsor, on the other hand, (ii) the relative fault of us and our Sponsor and (iii) any relevant equitable considerations, subject to the limitation that in any event our Sponsor's aggregate contribution to all claims and liabilities shall not exceed the amount of fees actually received by our Sponsor under the agreement (notwithstanding a finding of bad faith, gross negligence or willful misconduct of our Sponsor). Under the agreement, our Sponsor will not have any liability to us in connection with the services it renders pursuant to the agreement (notwithstanding a finding of bad faith, gross negligence or willful misconduct of our Sponsor). Those indemnification provisions will survive termination of the agreement.
As compensation for services provided by our Sponsor in connection with the AEA Acquisition, we paid our Sponsor a one-time transaction success fee of $10.8 million.
188
Management Equity Participation
Following the completion of this offering, members of our current management team will hold approximately 0.7% of our common stock. See "Principal Stockholders."
Voting Trust Agreement
Certain current and former employees, as well as certain other equity holders have contributed their shares of our common stock to a voting trust (the "Voting Trust") pursuant to an amended and restated voting trust agreement, dated as of December 22, 2014 (the "Voting Trust Agreement"), in exchange for units in the Voting Trust. Units in the voting trust track the value of the shares of our common stock. Pursuant to the Voting Trust Agreement, the trustee agreed to vote the shares of common stock held in trust by it in accordance with how the majority of the other shares of common stock are voted on the same manner. We currently anticipate that the Voting Trust will be dissolved immediately prior to the consummation of our initial public offering and shares held by the trustee will be returned to the holders that contributed them. Such shares will be subject to the provisions of the Stockholders' Agreement and the Registration Rights Agreement described below.
Transactions with Employees
From time to time, we have previously facilitated the transfer of funds between employees and us in connection with employee stock purchases. As a result, we were due $250,000 from one of our executive officers as of September 30, 2016. This amount was repaid in full on January 31, 2017.
Board of Directors
Our board of directors currently consists of seven members, which includes five members who were appointed by AEA.
Stockholders' Agreement
We, AEA, certain members of management and certain of our stockholders entered into the Stockholders' Agreement in connection with the AEA Acquisition. The Stockholders' Agreement contains, among other things, certain restrictions on the ability of the parties thereto to freely transfer shares of our stock. In addition, pursuant to the Stockholders' Agreement, the parties thereto agree to vote their shares of our common stock on certain matters presented to the stockholders in the same manner that the board of directors and a majority of our stockholders vote on such matters. In particular, following the consummation of this offering, and for so long as AEA holds an aggregate of at least 10% of our outstanding common stock, AEA will be entitled to nominate at least one individual for election to our board of directors, and our board of directors and nominating committee thereof will nominate and recommend to our stockholders that such individual be elected to our board of directors, and certain of our stockholders prior to this offering have agreed to vote all of their shares to elect such individual to our board of directors pursuant to the Stockholders' Agreement or voting proxies.
Debt
AEA, through two of its affiliated funds, is one of the lenders in the Incremental First Lien Facility, and held loans thereunder of approximately $14.9 million at September 30, 2016 and $16.3 million at June 30, 2017.
189
Registration Rights Agreement
The parties to the Stockholders' Agreement described above also entered into a registration rights agreement in connection with the AEA Acquisition, which will be amended and restated prior to the completion of this offering (as amended and restated, the "Registration Rights Agreement"). Pursuant to the Registration Rights Agreement, upon the closing of this offering and subject to the terms of the lock-up agreement they have entered into with the representatives of the underwriters, holders of a total of 85,504,480 shares of our common stock as of October 16, 2017, will have the right to require us to register these shares under the Securities Act under specified circumstances or will have incidental registration rights as described below. After registration pursuant to these rights, these shares will become freely tradable without restriction under the Securities Act.
Demand Registration Rights
Subject to certain restrictions, at any time after 180 days following the effective date of the registration statement of which this prospectus forms a part, or 120 days following the effective date of any subsequent registration statement that we file (other than registration statements on Forms S-4 or S-8), AEA may request that we register all or a portion of their common stock for sale under the Securities Act. We will effect the registration as requested in writing by AEA, unless in the good faith judgment of our board of directors, such registration would materially and adversely interfere with certain existing or potential material transactions or events involving the company and should be delayed. We are not obligated to file a registration statement pursuant to these demand provisions on more than five occasions on Form S-1; however, AEA is entitled to make an unlimited number of demands for registration on Form S-3 if and when we become eligible to use such form.
Piggyback Registration Rights
In addition, if at any time we register any shares of our common stock (other than pursuant to registrations on Form S-4 or Form S-8), the holders of all shares having registration rights are entitled, subject to certain exceptions, to receive notice at least five business days prior to the filing of the registration statement, or, in the case of holders who are individuals, no more than five business days after such filing, and to include all or a portion of their common stock in the registration.
In the event that any registration in which the holders of registrable shares participate pursuant to the registration rights agreement is an underwritten public offering, the number of registrable shares to be included may, in specified circumstances, be limited.
Other Provisions
We will pay all registration and offering expenses, including, among other things, reasonable fees and disbursements of a single special counsel for AEA and of a single special counsel for all other selling stockholders, related to any demand or piggyback registration. The Registration Rights Agreement contains customary cross-indemnification provisions, pursuant to which we are obligated to indemnify any selling stockholders in the event of material misstatements or omissions in the registration statement attributable to us, and they are obligated to indemnify us for material misstatements or omissions in the registration statement attributable to them. A particular stockholder's shares shall no longer be considered registrable shares, to which demand and piggyback registration rights apply, (i) when such shares have been disposed of under an effective registration statement or (ii) when such stockholder can sell, or with respect to AEA, has sold, such shares under Rule 144 of the Securities Act. In addition, the parties to the Registration Rights Agreement have agreed to not sell any shares pursuant to Rule 144 of the Securities Act or in another private placement for a period of two years following the closing of this offering, unless consented to by our board of directors or sold to
190
certain permitted transferees. The Registration Rights Agreement does not provide for any cash penalties or other penalties associated with any delays in registering any shares.
Other Transactions with AEA
In April 2016, we received a $6.9 million capital contribution from AEA that we used to fund the Neptune-Benson Acquisition. This contribution, in addition to the net proceeds from the NB Incremental Loans, was used to finance the Neptune-Benson Acquisition, the refinancing of certain then-existing indebtedness of Neptune-Benson and the payment of fees and expenses in connection with such transactions.
Corporate Charges from Siemens and Affiliates
The Predecessor received services and support from various functions performed by Siemens and the Predecessor's operations were dependent upon Siemens' ability to provide these services and support functions. The total amount charged to the Predecessor for corporate services for the period ended January 15, 2014 was $3.0 million.
From time to time, the Predecessor also had sales to, and purchases from, other entities of Siemens. Total sales for the period ending January 15, 2014 to other entities of Siemens were $4.5 million. The amount of purchases from other Siemens entities were not material for the period ended January 15, 2014.
Policies and Procedures for Related Party Transactions
Prior to the completion of this offering, we expect that our board of directors will adopt a policy providing that the audit committee will review and approve or ratify transactions in excess of $120,000 of value in which we participate and in which a director, executive officer or beneficial holder of more than 5% of any class of our voting securities has or will have a direct or indirect material interest. Under this policy, the board of directors is to obtain all information it believes to be relevant to a review and approval or ratification of these transactions. After consideration of the relevant information, the audit committee is to approve only those related party transactions that the audit committee believes are on their terms, taken as a whole, no less favorable to us than could be obtained in an arms'-length transaction with an unrelated third party and that the audit committee determines are not inconsistent with the best interests of the Company. In particular, our policy with respect to related party transactions will require our audit committee to consider the benefits to the Company, the impact on a director's independence in the event the related person is a director, an immediate family member of a director or an entity in which a director has a position or relationship, the availability of other sources for comparable products or services, the terms of the transaction and the terms available to unrelated third-parties or to employees generally. A "related party" is any person who is or was one of our executive officers, directors or director nominees or is a holder of more than 5% of our common stock, or their immediate family members or any entity owned or controlled by any of the foregoing persons. All of the transactions described above were entered into prior to the adoption of this policy.
191
General
Upon the completion of this offering, our authorized capital stock will consist of 1,000,000,000 shares of common stock, par value $0.01 per share, and 100,000,000 shares of preferred stock, par value $0.01 per share, the rights and preferences of which the board of directors may establish from time to time. Upon the completion of this offering, there will be 113,282,257 outstanding shares of common stock (excluding 9,168,049 shares of our common stock issuable upon exercise of outstanding stock options) and no outstanding shares of preferred stock. As of September 25, 2017, we had 329 stockholders of record.
In connection with this offering, we amended and restated our certificate of incorporation and bylaws. The following descriptions of our capital stock, amended and restated certificate of incorporation and amended and restated bylaws are intended as summaries only and are qualified in their entirety by reference to our amended and restated certificate of incorporation and amended and restated bylaws, which are filed as exhibits to the registration statement, of which this prospectus forms a part, and to the applicable provisions of the DGCL.
Common Stock
Following the consummation of this offering, we expect that certain affiliates of AEA, together with certain of our other stockholders, will continue to control a majority of the voting power of our outstanding common stock. Holders of our common stock are entitled to one vote for each share held on all matters submitted to a vote of stockholders and do not have cumulative voting rights. An election of directors by our stockholders shall be determined by a plurality of the votes cast by the stockholders present in person or represented by proxy at the meeting and entitled to vote on the election. There will be no cumulative voting in the election of directors, which means that holders of a majority of the outstanding shares of common stock will be able to elect all of the directors, and holders of less than a majority of such shares will be unable to elect any director. Holders of common stock are entitled to be paid ratably any dividends as may be declared by our board of directors (in its sole discretion), subject to any preferential dividend rights of outstanding preferred stock (if any).
In the event of our liquidation or dissolution, the holders of our common stock are entitled to receive ratably, in proportion to the number of shares held by them, the assets available for distribution to stockholders after the payment of all debts and other liabilities and subject to the prior rights (if any) of any outstanding preferred stock. Holders of our common stock have no preemptive or other rights to subscribe for additional shares. The shares of our outstanding common stock are not subject to further calls or assessments by us. There are no conversion or redemption rights or sinking fund provisions applicable to the shares of our common stock. The rights, preferences and privileges of holders of our common stock are subject to, and may be adversely affected by, the rights of the holders of shares of any series of preferred stock that we may designate and issue in the future.
Preferred Stock
Our preferred stock, if issued, would have priority over our common stock with respect to dividends and other distributions, including the distribution of our assets upon liquidation. To the extent permitted by law or by any stock exchange on which our common stock may be listed, our board of directors will have the authority, without further stockholder authorization, to issue from time to time shares of authorized preferred stock in one or more series and to fix the terms, powers (including voting powers), rights, preferences and variations and the restrictions and limitations thereof of each series. Although we have no present plans to issue any shares of preferred stock, the issuance of shares of preferred stock, or the issuance of rights to purchase such shares, could adversely affect the rights
192
and powers, including voting rights, of the common stock, and could have the effect of delaying, deterring or preventing a change in control of us or an unsolicited acquisition proposal.
Limitations on Directors' Liability
Our amended and restated certificate of incorporation and amended and restated bylaws contain provisions indemnifying our directors and officers to the fullest extent permitted by law. Prior to the completion of this offering, we intend to enter into indemnification agreements with each of our directors which may, in certain cases, be broader than the specific indemnification provisions contained under Delaware law.
In addition, to the fullest extent permitted by Delaware law, our amended and restated certificate of incorporation provides that no director will be personally liable to us or our stockholders for monetary damages for breach of fiduciary duty as a director. The effect of this provision is to restrict our rights and the rights of our stockholders in derivative suits to recover monetary damages against a director for breach of fiduciary duty as a director, except that a director will be personally liable for:
- •
- any breach of his or her duty of loyalty to us or our stockholders;
- •
- acts or omissions not in good faith which involve intentional misconduct or a knowing violation of law;
- •
- the payment of dividends or the redemption or purchase of stock in violation of Delaware law; or
- •
- any transaction from which the director derived an improper personal benefit.
This provision does not affect a director's liability under the federal securities laws.
To the extent that our directors, officers and controlling persons are indemnified under the provisions contained in our amended and restated certificate of incorporation, Delaware law or contractual arrangements against liabilities arising under the Securities Act, we have been advised that in the opinion of the SEC, such indemnification is against public policy as expressed in the Securities Act and is therefore unenforceable.
Provisions of Our Amended and Restated Certificate of Incorporation, Amended and Restated Bylaws and Delaware Law that May Have an Anti-Takeover Effect
Delaware law, our amended and restated certificate of incorporation and our amended and restated bylaws contain provisions that could have the effect of delaying, deferring or discouraging another party from acquiring control of us. These provisions, which are summarized below, are expected to discourage coercive takeover practices and inadequate takeover bids. These provisions are also designed to encourage persons seeking to acquire control of us to first negotiate with our board of directors.
Staggered Board; Removal of Directors
Our amended and restated certificate of incorporation and our amended and restated bylaws divide our board of directors into three classes with staggered three-year terms. In addition, a director will be subject to removal by our stockholders only for cause and only by the affirmative vote of the holders of at least two-thirds in voting power of all of our then outstanding common stock if AEA, together with certain of our other stockholders, ceases to own 50% or more of the voting power of our common stock. Any vacancy on our board of directors, including a vacancy resulting from an increase in the number of directors, will be filled by vote of a majority of our directors then in office (subject to the rights of holders of any series of preferred stock or rights granted pursuant to the stockholders' agreement). Furthermore, our amended and restated certificate of incorporation provides that the total
193
number of directors may be changed only by the resolution of our board of directors (subject to the rights of holders of any series of preferred stock to elect additional directors). The classification of our board of directors and the limitations on the removal of directors, changes to the total number of directors and filling of vacancies could make it more difficult for a third party to acquire, or discourage a third party from seeking to acquire, control of our Company.
Stockholder Action by Written Consent; Special Meetings
Our amended and restated certificate of incorporation provides that any action required or permitted to be taken by our stockholders must be effected at a duly called annual or special meeting of such holders and may not be effected by written consent if AEA, together with certain of our other stockholders, ceases to own 50% or more of the voting power of our common stock. Our amended and restated certificate of incorporation and our amended and restated bylaws also provide that, except as otherwise required by law, special meetings of our stockholders can only be called by our chairman of the board or our board of directors if AEA, together with certain of our other stockholders, ceases to own 50% or more of the voting power of our common stock.
Advance Notice Requirements for Stockholder Proposals
Our amended and restated bylaws establishes an advance notice procedure for stockholder proposals to be brought before an annual meeting of stockholders, including proposed nominations of persons for election to our board of directors. Stockholders at an annual meeting will only be able to consider proposals or nominations specified in the notice of meeting or brought before the meeting by or at the direction of our board of directors or by a stockholder of record on the record date for the meeting who is entitled to vote at the meeting and who has delivered timely written notice in proper form to our secretary of the stockholder's intention to bring such business before the meeting. These provisions could have the effect of delaying stockholder actions that are favored by the holders of a majority of our outstanding voting securities until the next stockholder meeting.
Section 203 of the Delaware General Corporation Law
While we expect to opt out of Section 203 of the DGCL, our amended and restated certificate of incorporation will contain similar provisions providing that we may not engage in certain "business combinations" with any "interested stockholder" for a three-year period following the time that the stockholder became an interested stockholder, unless:
- •
- prior to such time, our board of directors approved either the business combination or the transaction that resulted in the stockholder
becoming an interested stockholder;
- •
- upon consummation of the transaction that resulted in the stockholder becoming an interested stockholder, the interested stockholder owned at
least 85% of our voting stock outstanding at the time the transaction commenced, excluding for purposes of determining the voting stock outstanding (but not the outstanding voting stock owned by the
interested stockholder) those shares owned (a) by persons who are directors and also officers and (b) pursuant to employee stock plans in which employee participants do not have the
right to determine confidentially whether shares held subject to the plan will be tendered in a tender or exchange offer; or
- •
- at or subsequent to that time, the business combination is approved by our board of directors and authorized at an annual of special meeting of our stockholders, and not by written consent, by the affirmative vote of holders of at least two-thirds of our outstanding voting stock that is not owned by the interested stockholder.
Generally, a "business combination" includes a merger, asset or stock sale or other transaction provided for or through our Company resulting in a financial benefit to the interested stockholder.
194
Subject to certain exceptions, an "interested stockholder" is a person who owns 15% or more of our outstanding voting stock and the affiliates and associates of such person. For purposes of this provision, "voting stock" means any class or series of stock entitled to vote generally in the election of directors.
Under certain circumstances, this provision will make it more difficult for a person who qualifies as an "interested stockholder" to effect certain business combinations with our Company for a three-year period. This provision may encourage companies interested in acquiring us to negotiate in advance with our board of directors in order to avoid the stockholder approval requirement if our board of directors approves either the business combination or the transaction that results in the stockholder becoming an interested stockholder. These provisions also may have the effect of preventing changes in our board of directors and may make it more difficult to accomplish transactions that our stockholders may otherwise deem to be in their best interests.
Our amended and restated certificate of incorporation provides that certain affiliates of AEA, their respective affiliates and any of their direct or indirect designated transferees (other than in certain market transfers and gifts) and any group of which such persons are a party do not constitute "interested stockholders" for purposes of this provision.
Amendments to Our Bylaws
The DGCL provides generally that the affirmative vote of a majority of the shares present at any meeting and entitled to vote on a matter is required to amend a corporation's bylaws, unless a corporation's bylaws requires a greater percentage. Effective upon the completion of this offering, our amended and restated bylaws may be amended or repealed by the affirmative vote of the holders of at least two-thirds of the voting power of all outstanding stock entitled to vote thereon, voting together as a single class, if AEA, together with certain of our other stockholders, ceases to own 50% or more of the voting power of our common stock.
Exclusive Forum
Our amended and restated certificate of incorporation provides that the Court of Chancery of the State of Delaware will be the sole and exclusive forum for (i) any derivative action or proceeding brought on our behalf, (ii) any action asserting a claim of breach of a fiduciary duty owed to us or our stockholders by any of our directors, officers or employees, (iii) any action asserting a claim against us arising under the DGCL, our amended and restated certificate of incorporation or our amended and restated bylaws or (iv) any action asserting a claim against us that is governed by the internal affairs doctrine. Although we believe this provision benefits us by providing increased consistency in the application of Delaware law in the types of claims to which it applies, the provision may have the effect of discouraging lawsuits against our directors and officers and may limit our stockholders' ability to obtain a favorable judicial forum for disputes with us.
Corporate Opportunity
Delaware law permits corporations to adopt provisions renouncing any expectancy in or right to be offered an opportunity to participate in certain transactions or matters that may be investment, corporate or business opportunities and that are presented to a corporation or its officers, directors or stockholders. Our amended and restated certificate of incorporation provides that, to the fullest extent permitted by Delaware law, neither (1) AEA, any of its directors, principals, officers, employees or other representatives that may serve as our directors, officers or agents, and each of their affiliates (each, an "Excluded AEA Party") nor (2) any of our directors (other than any Excluded AEA Party) who are not Evoqua officers or employees, and each of their affiliates (each, an "Excluded Director"), shall have any duty refrain from (a) directly or indirectly engaging in any opportunity in which we, directly or indirectly, could have an interest or expectancy or (b) otherwise competing with us. Our
195
amended and restated certificate of incorporation also renounces, to the fullest extent permitted by Delaware law, any interest or expectancy that we have in any opportunity in which any Excluded AEA Party engages, even if the opportunity is one in which we, directly or indirectly, could have had an interest or expectancy. To the fullest extent permitted by Delaware law, in the event that any Excluded AEA Party acquires knowledge of an opportunity that may be an opportunity for itself, himself or herself and for us, such party shall have no duty to communicate or present such opportunity to us and shall not be liable to us or any of our stockholders for breach of any fiduciary duty as our stockholder, director or officer solely for having pursued or acquired such opportunity or for offering or directing such opportunity to another person. Notwithstanding the foregoing, our amended and restated certificate of incorporation does not renounce any interest in any opportunity that is expressly offered to any Excluded Director solely in his or her capacity as one of our directors. To the fullest extent permitted by Delaware law, no business opportunity will be deemed to be a potential corporate opportunity for us unless we would be permitted to undertake the opportunity under our amended and restated certificate of incorporation, we have sufficient financial resources to undertake the opportunity and the opportunity would be in line with our business.
Stock Exchange Listing
We have applied to list our common stock on the NYSE under the symbol "AQUA."
Transfer Agent and Registrar
The transfer agent and registrar for our common stock is American Stock Transfer & Trust Company, LLC.
196
DESCRIPTION OF CERTAIN INDEBTEDNESS
On January 15, 2014, we entered into (i) senior secured first lien credit facilities consisting of a senior secured first lien term loan facility (the "Term Loan Facility") and a senior secured revolving credit facility (the "Revolving Credit Facility" and, together with the Term Loan Facility, the "First Lien Facilities") and (ii) a senior secured second lien term loan facility (the "Second Lien Facility").
Senior Secured Credit Facilities
General
Our subsidiary EWT Holdings III Corp. (formerly known as WTG Holdings III Corp.) ("EWT III"), as the borrower, entered into (i) the First Lien Facilities, pursuant to a First Lien Credit Agreement, with EWT Holdings II Corp. (formerly known as WTG Holdings II Corp.) ("EWT II"), as a parent guarantor, the lenders party thereto, and Credit Suisse AG, as administrative agent and collateral agent (in such capacities, the "Agent"), dated January 15, 2014, and (ii) the Second Lien Facility, pursuant to a Second Lien Credit Agreement, with EWT II, the lenders party thereto, and Credit Suisse AG, as administrative agent and collateral agent, dated January 15, 2014. As discussed below, the Second Lien Facility was no longer outstanding as of October 28, 2016.
The Senior Secured Credit Facilities originally consisted of (i) a term loan facility in an initial aggregate principal amount of $505.0 million (the "Initial First Lien Term Loans") under the First Lien Credit Agreement, (ii) a revolving credit facility in an aggregate principal amount of $75.0 million under the First Lien Credit Agreement and (iii) a term loan facility in an aggregate principal amount of $75.0 million under the Second Lien Facility. The net proceeds of such facilities were used in connection with the AEA Acquisition, to refinance existing indebtedness, to cash collateralize and/or to provide cash collateral in exchange for the cancellation of certain existing and future letters of credit and similar instruments, and related transactions.
On April 15, 2016, we borrowed $185.0 million of incremental term loans (the "NB Incremental Loans") under the Term Loan Facility pursuant to an incremental amendment to the First Lien Credit Agreement. The net proceeds of the NB Incremental Loans were used to finance the Neptune-Benson Acquisition, the refinancing of certain then-existing indebtedness of Neptune-Benson and the payment of fees and expenses in connection with such transactions.
On October 28, 2016, we entered into the October 2016 Refinancing, in which we increased the amount of our existing Term Loan Facility by borrowing $150.0 million of incremental term loans under the Term Loan Facility pursuant to an incremental amendment to the First Lien Credit Agreement. The net proceeds of the October 2016 Incremental Term Loans were used, among other things, to repay all amounts then-outstanding under the Second Lien Credit Agreement (the "Second Lien Repayment") and all revolving credit loans then outstanding under the Revolving Credit Facility (without permanent reduction of commitments thereunder), to pay fees and expenses in connection with the transactions thereunder, and for working capital, capital expenditures and other general corporate purposes. We refer to the First Lien Facilities and, until the Second Lien Repayment, the Second Lien Facility, collectively as the "Senior Secured Credit Facilities." We also upsized commitments under our existing Revolving Credit Facility by $20.0 million to a total of $95.0 million.
On March 6, 2017, we further amended the First Lien Facilities to provide for certain additional basket flexibilities under the covenants.
On August 8, 2017, we entered into the August 2017 Refinancing pursuant to which we (i) borrowed approximately $262.7 million in refinancing term loans, the net proceeds of which were used to refinance in their entirety the NB Incremental Term Loans and (ii) increased the amount of our existing Term Loan Facility by borrowing $80.0 million of incremental term loans under the Term Loan Facility, the net proceeds of which were used to repay $60 million of the revolving credit loans
197
then outstanding under the Revolving Credit Facility (without permanent reduction of commitments thereunder), to pay related fees and expenses, and for other general corporate purposes (including permitted acquisitions and permitted investments pursuant to the First Lien Credit Agreement). Pursuant to the August 2017 Refinancing, a single tranche of term loans is outstanding under the First Lien Credit Agreement, with the same terms, including pricing terms, as the First Lien Term Facility immediately prior to the August 2017 Refinancing. The terms governing the NB Incremental Loans were superseded in their entirety by the terms set forth in the August 2017 Refinancing.
The term loans under the Term Loan Facility amortize in quarterly installments of approximately $2.3 million through December 31, 2020, with the remainder due at term loan maturity on January 15, 2021. The Senior Secured Credit Facilities also permit us to add one or more incremental term loans (excluding revolving commitment increases in an aggregate amount not exceeding $30.0 million) up to $100.0 million plus an unlimited amount, subject to our pro forma compliance with a first lien net leverage ratio (calculated as the ratio of consolidated funded first lien debt for borrowed money (net of unrestricted cash and cash equivalents) to trailing four-quarter Consolidated EBITDA) of 4.50 to 1.00.
As of June 30, 2017, we had $878.7 million outstanding under the Senior Secured Credit Facilities.
Interest
The Term Loans and the Revolving Credit Facility bear interest at a rate per annum equal to, at our option, either (a) adjusted LIBOR (subject to 1% floor in the case of the Term Loans and the NB Incremental Loans) plus the applicable rate or (b) base rate (determined by reference to the greatest of the prime rate published by Credit Suisse AG, the federal funds effective rate plus 0.5% and one-month LIBOR plus 1%) plus the applicable rate. The applicable rates under the Term Loans (excluding the NB Incremental Loans) are 3.75% for LIBOR loans and 2.75% for base rate loans.
The applicable rates under the Revolving Credit Facility are subject to step-ups and step-downs based on first lien net leverage ratio levels in accordance with the following schedule:
Pricing Level
|
First Lien Leverage Ratio |
Eurocurrency Rate |
Base Rate | |||||||
|---|---|---|---|---|---|---|---|---|---|---|
1 |
> 2.50:1.00 | 3.25 | % | 2.25 | % | |||||
2 |
£ 2.50:1.00 | 3.00 | % | 2.00 | % | |||||
Optional and Mandatory Prepayments
At our option, the Term Loans may be prepaid at any time, in whole or in part, with notice to the Agent, without any premium or penalty but subject to customary LIBOR breakage costs; provided that the Term Loan Facility is subject to a 1% prepayment penalty for refinancings in connection with certain repricing transactions through February 8, 2018.
In addition, subject to the satisfaction of certain conditions, we are permitted to offer our lenders to repurchase term loans held by them under the Senior Secured Credit Facilities at a discount.
Under certain circumstances and subject to certain exceptions, the Senior Secured Credit Facilities will be subject to mandatory prepayments in the amount equal to: (x) 100% of the net proceeds of certain assets sales and issuances or incurrence of non-permitted indebtedness and (y) 50% of annual excess cash flow for any fiscal year, such percentage to decrease to 25% and to 0% depending on the attainment of certain total leverage ratio targets.
Guarantee and Collateral
Our obligations in respect of the Senior Secured Credit Facilities are guaranteed by EWT II and each of our material existing and newly acquired or created wholly-owned domestic restricted
198
subsidiaries and are secured by substantially all assets of EWT III and the guarantors, in each case subject to customary exceptions.
Covenants and Other Matters
The Senior Secured Credit Facilities require that we comply with a number of covenants, as well as certain financial tests. The covenants limit, in certain circumstances, our ability to take a variety of actions, including:
- •
- incur indebtedness;
- •
- create or maintain liens on property or assets;
- •
- make investments, loans and advances;
- •
- engage in acquisitions, mergers, consolidations and asset sales;
- •
- redeem debt;
- •
- pay dividends and distributions; and
- •
- enter into transactions with affiliates.
In addition, our Revolving Credit Facility, but not the Term Loans, contains a financial covenant which requires us to comply with the maximum first lien net leverage ratio of 5.55 to 1.00 as of the last day of any quarter on which the aggregate amount of revolving loans and letters of credit outstanding under the Revolving Credit Facility (net of cash collateralized letters of credit and undrawn outstanding letters of credit in an amount of up to 50% of the Revolving Credit Facility) exceeds 25% of the total commitments thereunder.
The Senior Secured Credit Facilities also have various non-financial covenants, both requiring the borrower and guarantors to refrain from taking certain future actions (as described above) and requiring each of the borrower and guarantors to take certain actions, such as keeping in good standing its corporate existence, maintaining insurance, and providing the bank lending group with financial information on a timely basis. The Senior Secured Credit Facilities also contain certain customary representations and warranties and events of default, including among other things payment defaults, breach of representations and warranties, covenant defaults, cross-defaults to certain indebtedness, certain events of bankruptcy, certain events under the Employee Retirement Income Security Act of 1974, as amended ("ERISA"), material judgments, actual or asserted failure of any material guaranty or security document supporting the Senior Secured Credit Facilities to be in force and effect, and a change of control. If such an event of default occurs, the administrative agent under the Senior Secured Credit Facilities would be entitled to take various actions, including the acceleration of amounts due under the Senior Secured Credit Facilities and all actions permitted to be taken by a secured creditor.
This summary describes the material provisions of the Senior Secured Credit Facilities, but may not contain all information that is important to you. We urge you to read the provisions of the First Lien Credit Agreement and the amendments thereto, each of which has been filed as an exhibit to the registration statement of which this prospectus forms a part. See "Where You Can Find More Information."
199
SHARES ELIGIBLE FOR FUTURE SALE
The sale of a substantial amount of our common stock in the public market after this offering could adversely affect the prevailing market price of our common stock. Furthermore, because % of our common stock outstanding prior to the consummation of this offering will be subject to the contractual and legal restrictions on resale described below, the sale of a substantial amount of common stock in the public market after these restrictions lapse could materially adversely affect the prevailing market price of our common stock and our ability to raise equity capital in the future.
Upon completion of this offering, we expect to have outstanding an aggregate of 113,282,257 shares of our common stock, assuming no exercise of outstanding options. All of the shares of common stock sold in this offering will be freely transferable without restriction or further registration under the Securities Act (other than restrictions pursuant to lock-up agreements entered into by any directors or officers purchasing shares in the directed share program) by persons other than "affiliates," as that term is defined in Rule 144 under the Securities Act. Generally, the balance of our outstanding common stock are "restricted securities" within the meaning of Rule 144 under the Securities Act, subject to the limitations and restrictions that are described below. Common stock purchased by our affiliates will be "restricted securities" under Rule 144. Restricted securities may be sold in the public market only if registered or if they qualify for an exemption from registration under Rule 144 or Rule 701 under the Securities Act. These rules are summarized below.
Upon the expiration of the lock-up agreements described below 180 days after the date of this prospectus, and subject to the provisions of Rule 144, an additional 83,544,087 shares will be available for sale in the public market. The sale of these restricted securities is subject, in the case of shares held by affiliates, to the volume restrictions contained in those rules.
Lock-up Agreements
In connection with this offering, we, our directors and executive officers and stockholders currently representing approximately 98% of the shares of our common stock outstanding prior to this offering will agree with the underwriters to enter into lock-up agreements described in "Underwriting," pursuant to which shares of our common stock outstanding after this offering will be restricted from immediate resale in accordance with the terms of such lock-up agreements without the prior written consent of Credit Suisse Securities (USA) LLC and J.P. Morgan Securities LLC. Under these agreements, subject to limited exceptions, neither we nor any of our directors or executive officers or these stockholders may dispose of, hedge or otherwise transfer the economic consequences of ownership of any shares of common stock or securities convertible into or exchangeable or exercisable for shares of common stock. These restrictions will be in effect for a period of 180 days after the date of this prospectus. Certain transfers or dispositions can be made sooner, provided the transferee becomes bound to the terms of the lock-up.
Rule 144
In general, under Rule 144 as in effect on the date of this prospectus, beginning 90 days after the consummation of this offering, a person (or persons whose common stock is required to be aggregated), who is an affiliate, and who has beneficially owned our common stock for at least six months is entitled to sell in any three-month period a number of shares that does not exceed the greater of:
- •
- 1% of the number of shares then outstanding, which will equal approximately 1.13 million shares immediately after consummation of this
offering; or
- •
- the average weekly trading volume in our shares on the NYSE during the four calendar weeks preceding the filing of a notice on Form 144 with respect to such a sale.
200
Sales by our affiliates under Rule 144 are also subject to manner of sale provisions and notice requirements and to the availability of current public information about us. An "affiliate" is a person that directly, or indirectly through one or more intermediaries, controls or is controlled by, or is under common control with an issuer.
Under Rule 144, a person (or persons whose shares are aggregated) who is not deemed to have been an affiliate of ours at any time during the 90 days preceding a sale, and who has beneficially owned the shares proposed to be sold for at least six months (including the holding period of any prior owner other than an affiliate), would be entitled to sell those shares subject only to availability of current public information about us, and after beneficially owning such shares for at least twelve months, would be entitled to sell an unlimited number of shares without restriction. To the extent that our affiliates sell their common stock, other than pursuant to Rule 144 or a registration statement, the purchaser's holding period for the purpose of effecting a sale under Rule 144 commences on the date of transfer from the affiliate.
Rule 701
In general, under Rule 701 as in effect on the date of this prospectus, any of our employees, directors, officers, consultants or advisors who purchased shares from us in reliance on Rule 701 in connection with a compensatory stock or option plan or other written agreement before the effective date of this offering, or who purchased shares from us after that date upon the exercise of options granted before that date, are eligible to resell such shares 90 days after the effective date of this offering in reliance upon Rule 144. If such person is not an affiliate, such sale may be made subject only to the manner of sale provisions of Rule 144. If such a person is an affiliate, such sale may be made under Rule 144 without compliance with the holding period requirement, but subject to the other Rule 144 restrictions described above.
Stock Plans
We intend to file a registration statement or statements on Form S-8 under the Securities Act covering shares of common stock reserved for issuance pursuant to all option grants made prior to this offering under the Stock Option Plan. Subject to lock-up arrangements, these registration statements may be filed any time after the closing date of this offering. Shares issued upon the exercise of stock options after the effective date of the applicable Form S-8 registration statement will be eligible for resale in the public market without restriction, subject to Rule 144 limitations applicable to affiliates and the lock-up agreements described above.
Registration Rights
Following this offering, some of our stockholders will, under some circumstances, have the right to require us to register their shares for future sale. See "Certain Relationships and Related Party Transactions—Registration Rights Agreement."
201
MATERIAL U.S. FEDERAL TAX CONSIDERATIONS FOR
NON-U.S. HOLDERS OF OUR COMMON STOCK
The following is a summary of the material U.S. federal income and estate tax consequences of the ownership and disposition of our common stock that is being issued pursuant to this offering. This summary is limited to Non-U.S. Holders (as defined below) that hold our common stock as a capital asset (generally, property held for investment) for U.S. federal income tax purposes. This summary does not discuss all of the aspects of U.S. federal income and estate taxation that may be relevant to a Non-U.S. Holder in light of the Non-U.S. Holder's particular investment or other circumstances. Accordingly, all prospective Non-U.S. Holders should consult their own tax advisors with respect to the U.S. federal, state, local and non-U.S. tax consequences of the ownership and disposition of our common stock.
This summary is based on provisions of the U.S. Internal Revenue Code of 1986, as amended (which we refer to as the "Code"), applicable U.S. Treasury regulations and administrative and judicial interpretations, all as in effect or in existence on the date of this prospectus. Subsequent developments in U.S. federal income or estate tax law, including changes in law or differing interpretations, which may be applied retroactively, could alter the U.S. federal income and estate tax consequences of owning and disposing of our common stock as described in this summary. There can be no assurance that the Internal Revenue Service (the "IRS") will not take a contrary position with respect to one or more of the tax consequences described herein and we have not obtained, nor do we intend to obtain, a ruling from the IRS with respect to the U.S. federal income or estate tax consequences of the ownership or disposition of our common stock.
As used in this summary, the term "Non-U.S. Holder" means a beneficial owner of our common stock that is not, for U.S. federal income tax purposes:
- •
- an individual who is a citizen or resident of the United States;
- •
- a corporation (or other entity treated as a corporation for U.S. federal income tax purposes) created or organized in or under the laws of the
United States, any state thereof, or the District of Columbia;
- •
- an entity or arrangement treated as a partnership;
- •
- an estate whose income is includible in gross income for U.S. federal income tax purposes regardless of its source; or
- •
- a trust, if (1) a U.S. court is able to exercise primary supervision over the trust's administration and one or more "United States persons" (within the meaning of the Code) has the authority to control all of the trust's substantial decisions, or (2) the trust has a valid election in effect under applicable U.S. Treasury regulations to be treated as a United States person.
If an entity or arrangement treated as a partnership for U.S. federal income tax purposes holds our common stock, the tax treatment of a partner in such a partnership generally will depend upon the status of the partner, the activities of the partnership and certain determinations made at the partner level. Partnerships, and partners in partnerships, that hold our common stock should consult their own tax advisors as to the particular U.S. federal income and estate tax consequences of owning and disposing of our common stock that are applicable to them.
This summary does not address all U.S. federal income or estate tax consequences relevant to a Non-U.S. Holder's particular circumstances, including the impact of the Medicare contribution tax on net investment income. In addition, this summary does not consider any specific facts or circumstances
202
that may apply to a Non-U.S. Holder and does not address any special tax rules that may apply to particular Non-U.S. Holders, such as:
- •
- a Non-U.S. Holder that is a financial institution, insurance company, tax-exempt organization, pension plan, broker, dealer or trader in
stocks, securities or currencies, U.S. expatriate, controlled foreign corporation or passive foreign investment company;
- •
- a Non-U.S. Holder holding our common stock as part of a conversion, constructive sale, wash sale or other integrated transaction or a hedge,
straddle or synthetic security;
- •
- a Non-U.S. Holder that holds or receives our common stock pursuant to the exercise of any employee stock option or otherwise as compensation;
or
- •
- a Non-U.S. Holder that at any time owns, directly, indirectly or constructively, more than 5% of our outstanding common stock.
In addition, this summary does not address any U.S. state or local, or non-U.S. tax consequences, or any U.S. federal income or estate tax consequences for beneficial owners of a Non-U.S. Holder, including stockholders of a controlled foreign corporation or passive foreign investment company that hold our common stock.
Each Non-U.S. Holder should consult its own tax advisor regarding the U.S. federal, state, local and non-U.S. tax consequences of owning and disposing of our common stock.
Distributions on Our Common Stock
As discussed under "Dividend Policy" above, we do not intend to pay cash dividends on our common stock for the foreseeable future. If we make distributions of cash or property (other than certain pro rata distributions of our common stock) with respect to our common stock, any such distributions generally will constitute dividends for U.S. federal income tax purposes to the extent paid from our current or accumulated earnings and profits, as determined under U.S. federal income tax principles. If a distribution exceeds our current and accumulated earnings and profits, the excess will be treated as a nontaxable return of capital to the extent of the Non-U.S. Holder's adjusted tax basis in its common stock and will reduce (but not below zero) such Non-U.S. Holder's adjusted tax basis in its common stock. Any remaining excess will be treated as gain from a disposition of our common stock subject to the tax treatment described below in "Sales or Other Dispositions of Our Common Stock." Distributions on our common stock that are treated as dividends, and that are not effectively connected with a Non-U.S. Holder's conduct of a trade or business in the United States, generally will be subject to withholding of U.S. federal income tax at a rate of 30%. A Non-U.S. Holder may be eligible for a lower rate under an applicable income tax treaty between the United States and such non-U.S. Holder's jurisdiction of tax residence. In order to claim the benefit of an applicable income tax treaty, a Non-U.S. Holder will be required to provide to the applicable withholding agent a properly executed IRS Form W-8BEN or W-8BEN-E (or other applicable form) in accordance with the applicable certification and disclosure requirements. Special rules apply to partnerships and other pass-through entities and these certification and disclosure requirements also may apply to beneficial owners of partnerships and other pass-through entities that hold our common stock.
Dividends that are effectively connected with a Non-U.S. Holder's conduct of a trade or business in the United States (and, if required by an applicable income tax treaty, are attributable to a permanent establishment or fixed base maintained by the Non-U.S. Holder in the United States) will not be subject to the withholding of U.S. federal income tax discussed above if the Non-U.S. Holder provides to the applicable withholding agent a properly executed IRS Form W-8ECI (or other applicable form) in accordance with the applicable certification and disclosure requirements. Instead, any such effectively connected dividends will be subject to U.S. federal income tax on a net income basis at the regular graduated rates and in the manner applicable to United States persons (unless an
203
applicable income tax treaty provides otherwise). A Non-U.S. Holder that is treated as a corporation for U.S. federal income tax purposes may also be subject to a "branch profits" tax at a 30% rate (or a lower rate if the Non-U.S. Holder is eligible for a lower rate under an applicable income tax treaty) on the Non-U.S. Holder's earnings and profits (attributable to dividends on our common stock or otherwise) that are effectively connected with the Non-U.S. Holder's conduct of a trade or business within the United States, subject to certain adjustments.
The certifications described above must be provided to the applicable withholding agent prior to the payment of dividends and must be updated periodically. A Non-U.S. Holder may obtain a refund or credit of any excess amounts withheld by timely filing an appropriate claim for a refund with the IRS. Non-U.S. Holders should consult their own tax advisors regarding their eligibility for benefits under a relevant income tax treaty and the manner of claiming such benefits.
The foregoing discussion is subject to the discussion below under "Backup Withholding and Information Reporting" and "FATCA Withholding."
Sales or Other Dispositions of Our Common Stock
A Non-U.S. Holder generally will not be subject to U.S. federal income tax (including withholding thereof) on any gain recognized on sales or other dispositions of our common stock unless:
- •
- the gain is effectively connected with the Non-U.S. Holder's conduct of a trade or business in the United States (and, if required by an
applicable income tax treaty, is attributable to a permanent establishment or fixed base maintained by the Non-U.S. Holder in the United States); in this case, the gain will be subject to U.S. federal
income tax on a net income basis at the regular graduated rates and in the manner applicable to United States persons (unless an applicable income tax treaty provides otherwise) and, if the Non-U.S.
Holder is treated as a corporation for U.S. federal income tax purposes, the "branch profits tax" described above may also apply;
- •
- the Non-U.S. Holder is an individual who is present in the United States for more than 182 days in the taxable year of the disposition
and meets certain other requirements; in this case, except as otherwise provided by an applicable income tax treaty, the gain, which may be offset by certain U.S. source capital losses, generally will
be subject to a flat 30% U.S. federal income tax, even though the Non-U.S. Holder is not considered a resident of the United States under the Code; or
- •
- we are or have been a "United States real property holding corporation" for U.S. federal income tax purposes at any time during the shorter of (i) the five-year period ending on the date of disposition and (ii) the period that the Non-U.S. Holder held our common stock.
Generally, a corporation is a "United States real property holding corporation" if the fair market value of its "United States real property interests" equals or exceeds 50% of the sum of the fair market value of its worldwide real property interests plus its other assets used or held for use in a trade or business. We believe that we are not currently, and we do not anticipate becoming in the future, a United States real property holding corporation. However, because the determination of whether we are a United States real property holding corporation is made from time to time and depends on the relative fair market values of our assets, there can be no assurance in this regard. If we were a United States real property holding corporation, the tax relating to disposition of stock in a United States real property holding corporation generally will not apply to a Non-U.S. Holder whose holdings, direct, indirect and constructive, constituted 5% or less of our common stock at all times during the applicable period, provided that our common stock is "regularly traded on an established securities market" (as provided in applicable U.S. Treasury regulations) at any time during the calendar year in which the disposition occurs. However, no assurance can be provided that our common stock will be regularly
204
traded on an established securities market for purposes of the rules described above. Non-U.S. Holders should consult their own tax advisors regarding the possible adverse U.S. federal income tax consequences to them if we are, or were to become, a United States real property holding corporation.
The foregoing discussion is subject to the discussion below under "Backup Withholding and Information Reporting" and "FATCA Withholding."
Federal Estate Tax
Our common stock that is owned (or treated as owned) by an individual who is not a U.S. citizen or resident of the United States (as specially defined for U.S. federal estate tax purposes) at the time of death will be included in the individual's gross estate for U.S. federal estate tax purposes, unless an applicable estate tax or other treaty provides otherwise and, therefore, may be subject to U.S. federal estate tax.
Backup Withholding and Information Reporting
Backup withholding (currently at a rate of 28%) will not apply to payments of dividends on our common stock to a Non-U.S. Holder, provided the applicable withholding agent does not have actual knowledge or reason to know the holder is a United States person and the Non-U.S. Holder either provides to the applicable withholding agent a properly executed IRS Form W-8BEN or W-8BEN-E (or other applicable form) certifying under penalties of perjury that the Non-U.S. Holder is not a United States person, or otherwise qualifies for an exemption. However, the applicable withholding agent generally will be required to report to the IRS and to such Non-U.S. Holder payments of dividends on our common stock and the amount of U.S. federal income tax, if any, withheld with respect to those payments. Copies of the information returns reporting such dividends and any withholding may also be made available to the tax authorities in the country in which the Non-U.S. Holder resides under the provisions of a treaty or agreement.
The gross proceeds from sales or other dispositions of our common stock may be subject, in certain circumstances discussed below, to U.S. backup withholding and information reporting. If a Non-U.S. Holder sells or otherwise disposes of our common stock outside the United States through a non-U.S. office of a non-U.S. broker and the sale or disposition proceeds are paid to the Non-U.S. Holder outside the United States, then the U.S. backup withholding and information reporting requirements generally will not apply to that payment. However, U.S. information reporting, but not U.S. backup withholding, will apply to a payment of sale or disposition proceeds, even if that payment is made outside the United States, if a Non-U.S. Holder sells our common stock through a non-U.S. office of a broker that is a United States person or has certain enumerated connections with the United States, unless the broker has documentary evidence in its files that the Non-U.S. Holder is not a United States person and certain other conditions are met or the Non-U.S. Holder otherwise qualifies for an exemption.
If a Non-U.S. Holder receives payments of the proceeds of sales or other dispositions of our common stock to or through a U.S. office of a broker, the payment will be subject to both U.S. backup withholding and information reporting unless the Non-U.S. Holder provides to the applicable withholding agent a properly executed IRS Form W-8BEN or W-8BEN-E (or other applicable form) certifying under penalties of perjury that the Non-U.S. Holder is not a United States person and the applicable withholding agent does not have actual knowledge or reason to know that such holder is a United States person, or otherwise qualifies for an exemption. Backup withholding is not an additional tax. Any amounts withheld under the backup withholding rules may be credited against the Non-U.S. Holder's U.S. federal income tax liability (which may result in the Non-U.S. Holder being entitled to a refund), provided that the required information is timely furnished to the IRS.
205
FATCA Withholding
The Foreign Account Tax Compliance Act and related Treasury guidance (commonly referred to as "FATCA") impose U.S. federal withholding tax at a rate of 30% on payments to certain foreign entities of (i) U.S.-source dividends (including dividends paid on our common stock) and (ii) the gross proceeds from the sale or other disposition after December 31, 2018 of property that produces U.S.-source dividends (including sales or other dispositions of our common stock). This withholding tax applies to a "foreign financial institution" or a "non-financial foreign entity" (each as defined in the Code), whether acting as a beneficial owner or an intermediary, unless such foreign entity complies with (i) certain information reporting requirements regarding its U.S. account holders and its U.S. owners and (ii) certain withholding obligations regarding certain payments to its account holders and certain other persons. Foreign financial institutions located in jurisdictions that have an intergovernmental agreement with the United States governing FATCA may be subject to different rules. Accordingly, the entity through which a Non-U.S. Holder holds its common stock will affect the determination of whether such withholding is required. Non-U.S. Holders are encouraged to consult their tax advisors regarding FATCA.
206
Under the terms and subject to the conditions contained in an underwriting agreement dated , 2017, we and the selling stockholders have agreed, severally and not jointly, to sell to the underwriters named below, for whom Credit Suisse Securities (USA) LLC and J.P. Morgan Securities LLC are acting as representatives, and each of the underwriters has agreed, severally and not jointly, to purchase from us and the selling stockholders, the following respective numbers of shares of common stock:
Underwriter
|
Number of Shares |
|||
|---|---|---|---|---|
Credit Suisse Securities (USA) LLC |
||||
J.P. Morgan Securities LLC |
||||
RBC Capital Markets, LLC |
||||
Citigroup Global Markets Inc. |
||||
Goldman Sachs & Co. LLC |
||||
Morgan Stanley & Co. LLC |
||||
Robert W. Baird & Co. Incorporated |
||||
Raymond James & Associates, Inc. |
||||
Stifel, Nicolaus & Company, Incorporated |
||||
Wells Fargo Securities, LLC |
||||
| | | | | |
Total |
27,777,777 | |||
| | | | | |
| | | | | |
| | | | | |
The underwriting agreement provides that the underwriters are obligated to purchase all the shares of common stock in the offering if any are purchased, other than those shares covered by the over-allotment option described below. The underwriting agreement also provides that if an underwriter defaults on the purchase commitments of non-defaulting underwriters may be increased or the offering may be terminated.
The selling stockholders have granted to the underwriters a 30-day option to purchase on a pro rata basis up to 4,166,166 additional shares from the selling stockholders at the initial public offering price less the underwriting discounts and commissions. The option may be exercised only to cover any over-allotments of common stock.
The underwriters propose to offer the shares of common stock initially at the public offering price on the cover page of this prospectus and to selling group members at that price less a selling concession of $ per share. The underwriters and selling group members may allow a discount of $ per share on sales to other broker/dealers. After the initial public offering the representatives and underwriters may change the public offering price and concession and discount to broker/dealers. The offering of the shares by the underwriters is subject to receipt and acceptance and subject to the underwriters' right to reject any order in whole or in part.
The following table summarizes the compensation and estimated expenses we and the selling stockholders will pay:
| |
Per Share | Total | |||||||||||
|---|---|---|---|---|---|---|---|---|---|---|---|---|---|
| |
Without Over-allotment |
With Over-allotment |
Without Over-allotment |
With Over-allotment |
|||||||||
Underwriting discounts and commissions paid by the Company |
$ | $ | $ | $ | |||||||||
Underwriting discounts and commissions paid by the selling stockholders |
$ | $ | $ | $ | |||||||||
Expenses payable by us |
$ | $ | $ | $ | |||||||||
Expenses payable by the selling stockholders |
$ | $ | $ | $ | |||||||||
207
The expenses of this offering that have been paid or are payable by us are estimated to be approximately $5.6 million (excluding underwriting discounts and commissions). We have agreed to pay expenses incurred by the selling stockholders in connection with this offering, other than the underwriting discounts and commissions. We have also agreed to reimburse the underwriters for certain of their expenses in an amount up to $50,000. In addition, the underwriters have agreed to reimburse us for certain expenses related to the offering.
In connection with this offering, we, our directors and executive officers and stockholders currently representing approximately 98%% of the shares of our common stock outstanding prior to this offering will agree with the underwriters to enter into lock-up agreements, pursuant to which shares of our common stock outstanding after this offering will be restricted from immediate resale in accordance with the terms of such lock-up agreements without the prior written consent of Credit Suisse Securities (USA) LLC and J.P. Morgan Securities LLC. Under these agreements, subject to limited exceptions, neither we nor any of our directors or executive officers or these stockholders may dispose of, hedge or otherwise transfer the economic consequences of ownership of any shares of common stock or securities convertible into or exchangeable or exercisable for shares of common stock. These restrictions will be in effect for a period of 180 days after the date of this prospectus. Certain transfers or dispositions can be made sooner, provided the transferee becomes bound to the terms of the lock-up.
The underwriters have reserved for sale at the initial public offering price up to 694,444 shares of the common stock for directors, officers and certain employees who have expressed an interest in purchasing common stock in the offering. We will offer these shares to the extent permitted under applicable regulations in the United States and in various countries. Pursuant to the underwriting agreement, the sales will be made by Credit Suisse Securities (USA) LLC through a directed share program. The number of shares available for sale to the general public in the offering will be reduced to the extent these persons purchase the reserved shares. Any reserved shares not so purchased will be offered by the underwriters to the general public on the same terms as the other shares. We have agreed to indemnify Credit Suisse Securities (USA) LLC in connection with the directed share program, including for the failure of any participant to pay for its shares. Other than the underwriting discount described on the front cover of this prospectus, the underwriters will not be entitled to any commission with respect to shares of common stock sold pursuant to the directed share program.
We and the selling stockholders have agreed, severally and not jointly, to indemnify the underwriters against liabilities under the Securities Act, or contribute to payments that the underwriters may be required to make in that respect.
We have applied to list the shares of common stock on NYSE, under the symbol "AQUA."
Prior to this offering, there has been no public market for our common stock. The initial public offering price will be determined by negotiations among us and the representatives and will not necessarily reflect the market price of the common stock following this offering. The principal factors that will be considered in determining the initial public offering price include:
- •
- the information presented in this prospectus and otherwise available to the underwriters;
- •
- the history of, and prospects for, the industry in which we compete;
- •
- the ability of our management;
- •
- the prospects for our future earnings;
- •
- the present state of our results of operations and our current financial condition;
- •
- the general condition of the securities markets at the time of this offering; and
208
- •
- the recent market prices of, and the demand for, publicly traded common stock of generally comparable companies.
We cannot assure you that the initial public offering price will correspond to the price at which the common stock will trade in the public market subsequent to this offering or that an active trading market for the common stock will develop and continue after this offering.
In connection with the offering the underwriters may engage in stabilizing transactions, over-allotment transactions, syndicate covering transactions, penalty bids and passive market making in accordance with Regulation M under the Exchange Act.
- •
- Stabilizing transactions permit bids to purchase the underlying security so long as the stabilizing bids do not exceed a specified maximum.
- •
- Over-allotment involves sales by the underwriters of shares in excess of the number of shares the underwriters are obligated to purchase, which
creates a syndicate short position. The short position may be either a covered short position or a naked short position. In a covered short position, the number of shares over-allotted by the
underwriters is not greater than the number of shares that they may purchase in the over-allotment option. In a naked short position, the number of shares involved is greater than the number of shares
in the over-allotment option. The underwriters may close out any covered short position by either exercising their over-allotment option and/or purchasing shares in the open market.
- •
- Syndicate covering transactions involve purchases of the common stock in the open market after the distribution has been completed in order to
cover syndicate short positions. In determining the source of shares to close out the short position, the underwriters will consider, among other things, the price of shares available for purchase in
the open market as compared to the price at which they may purchase shares through the over-allotment option. If the underwriters sell more shares than could be covered by the over-allotment option, a
naked short position, the position can only be closed out by buying shares in the open market. A naked short position is more likely to be created if the underwriters are concerned that there could be
downward pressure on the price of the shares in the open market after pricing that could adversely affect investors who purchase in the offering.
- •
- Penalty bids permit the representatives to reclaim a selling concession from a syndicate member when the common stock originally sold by the
syndicate member is purchased in a stabilizing or syndicate covering transaction to cover syndicate short positions.
- •
- In passive market making, market makers in the common stock who are underwriters or prospective underwriters may, subject to limitations, make bids for or purchases of our common stock until the time, if any, at which a stabilizing bid is made.
These stabilizing transactions, syndicate covering transactions and penalty bids may have the effect of raising or maintaining the market price of our common stock or preventing or retarding a decline in the market price of the common stock. As a result the price of our common stock may be higher than the price that might otherwise exist in the open market. These transactions may be effected on the NYSE or otherwise and, if commenced, may be discontinued at any time.
A prospectus in electronic format will be made available on the web sites maintained by one or more of the underwriters, or selling group members, if any, participating in this offering and one or more of the underwriters participating in this offering may distribute prospectuses electronically. The representatives may agree to allocate a number of shares to underwriters and selling group members for sale to their online brokerage account holders. Internet distributions will be allocated by the underwriters and selling group members that will make internet distributions on the same basis as other allocations.
209
Other Relationships
The underwriters and their respective affiliates are full service financial institutions engaged in various activities, which may include securities trading, commercial and investment banking, financial advisory, investment management, investment research, principal investment, hedging, financing and brokerage activities. Certain of the underwriters and their respective affiliates have, from time to time, performed, and may in the future perform, various financial advisory and investment banking services for us, for which they received or will receive customary fees and expenses. In addition, in the ordinary course of their business activities, the underwriters and their respective affiliates may make or hold a broad array of investments and actively trade debt and equity securities (or related derivative securities) and financial instruments (including bank loans) for their own account and for the accounts of their customers. These investments and securities activities may involve securities and/or instruments of ours or our affiliates. The underwriters and their affiliates may also make investment recommendations and/or publish or express independent research views in respect of such securities or financial instruments and may hold, or recommend to clients that they acquire, long and/or short positions in such securities and instruments. These investment recommendations/and or research and securities activities may involve securities and/or instruments of ours or our affiliates. In addition, under our Senior Secured Credit Facilities, Credit Suisse Securities (USA) LLC, Goldman Sachs & Co. LLC, RBC Capital Markets, LLC and/or certain of their respective affiliates act as agents, lenders and joint lead arrangers and joint bookrunners. Furthermore, Credit Suisse Securities (USA) LLC, and/or certain of its affiliates may receive a portion of the net proceeds received by us in this offering due to the use of proceeds from this offering being used to repay borrowings under the Term Loan Facility.
Notice to Canadian Residents
Resale Restrictions
The distribution of our common stock in Canada is being made only in the provinces of Ontario, Quebec, Alberta and British Columbia on a private placement basis exempt from the requirement that we prepare and file a prospectus with the securities regulatory authorities in each province where trades of these securities are made. Any resale of our common stock in Canada must be made under applicable securities laws which may vary depending on the relevant jurisdiction, and which may require resales to be made under available statutory exemptions or under a discretionary exemption granted by the applicable Canadian securities regulatory authority. Purchasers are advised to seek legal advice prior to any resale of the securities.
Representations of Canadian Purchasers
By purchasing our common stock in Canada and accepting delivery of a purchase confirmation, a purchaser is representing to us and the dealer from whom the purchase confirmation is received that:
- •
- the purchaser is entitled under applicable provincial securities laws to purchase our common stock without the benefit of a prospectus
qualified under those securities laws as it is an "accredited investor" as defined under National Instrument 45-106—Prospectus
Exemptions,
- •
- the purchaser is a "permitted client" as defined in National Instrument 31-103—Registration
Requirements, Exemptions and Ongoing Registrant Obligations,
- •
- where required by law, the purchaser is purchasing as principal and not as agent, and
- •
- the purchaser has reviewed the text above under Resale Restrictions.
210
Conflicts of Interest
Canadian purchasers are hereby notified that the underwriters are relying on the exemption set out in section 3A.3 or 3A.4, if applicable, of National Instrument 33-105—Underwriting Conflicts from having to provide certain conflict of interest disclosure in this document.
Statutory Rights of Action
Securities legislation in certain provinces or territories of Canada may provide a purchaser with remedies for rescission or damages if the offering memorandum (including any amendment thereto) such as this document contains a misrepresentation, provided that the remedies for rescission or damages are exercised by the purchaser within the time limit prescribed by the securities legislation of the purchaser's province or territory. The purchaser of these securities in Canada should refer to any applicable provisions of the securities legislation of the purchaser's province or territory for particulars of these rights or consult with a legal advisor.
Enforcement of Legal Rights
All of our directors and officers as well as the experts named herein may be located outside of Canada and, as a result, it may not be possible for Canadian purchasers to effect service of process within Canada upon us or those persons. All or a substantial portion of our assets and the assets of those persons may be located outside of Canada and, as a result, it may not be possible to satisfy a judgment against us or those persons in Canada or to enforce a judgment obtained in Canadian courts against us or those persons outside of Canada.
Taxation and Eligibility for Investment
Canadian purchasers of our common stock should consult their own legal and tax advisors with respect to the tax consequences of an investment in our common stock in their particular circumstances and about the eligibility of our common stock for investment by the purchaser under relevant Canadian legislation.
Notice to Prospective Investors in the United Kingdom
This document is only being distributed to and is only directed at (i) persons who are outside the United Kingdom or (ii) investment professionals falling within Article 19(5) of the Financial Services and Markets Act 2000 (Financial Promotion) Order 2005 (the "Order") or (iii) high net worth entities, and other persons to whom it may lawfully be communicated, falling with Article 49(2)(a) to (d) of the Order (all such persons together being referred to as "relevant persons"). The securities are only available to, and any invitation, offer or agreement to subscribe, purchase or otherwise acquire such securities will be engaged in only with, relevant persons. Any person who is not a relevant person should not act or rely on this document or any of its contents.
Notice to Prospective Investors in the European Economic Area
In relation to each Member State of the European Economic Area which has implemented the Prospectus Directive (each, a "Relevant Member State"), each underwriter has represented and agreed that with effect from and including the date on which the Prospectus Directive is implemented in that Relevant Member State it has not made and will not make an offer of common stock which are the subject of the offering contemplated by this prospectus to the public in that Relevant Member State other than:
- •
- to any legal entity which is a "qualified investor" as defined in the Prospectus Directive;
211
- •
- to fewer than 150 natural or legal persons (other than "qualified investors" as defined in the Prospectus Directive), per Relevant Member
State, subject to obtaining the prior consent of the underwriters; or
- •
- in any other circumstances falling within Article 3(2) of the Prospectus Directive,
provided that no such offer of common stock shall result in a requirement for us or any underwriter to publish a prospectus pursuant to Article 3 of the Prospectus Directive or a supplemental prospectus pursuant to Article 16 of the Prospectus Directive.
For the purposes of this provision, the expression an "offer of common stock to the public" in relation to any common stock in any Relevant Member State means the communication in any form and by any means of sufficient information on the terms of the offer and the common stock to be offered so as to enable an investor to decide to purchase or subscribe for the common stock, as the same may be varied in that Relevant Member State by any measure implementing the Prospectus Directive in that Relevant Member State. The expression "Prospectus Directive" means Directive 2003/71/EC (as amended, including by Directive 2010/73/EU), and includes any relevant implementing measure in the Relevant Member State.
Notice to Prospective Investors in Hong Kong
The shares have not been offered or sold and will not be offered or sold in Hong Kong, by means of any document, other than (a) to "professional investors" as defined in the Securities and Futures Ordinance (Cap. 571) of Hong Kong and any rules made under that Ordinance; or (b) in other circumstances which do not result in the document being a "prospectus" as defined in the Companies Ordinance (Cap. 32) of Hong Kong or which do not constitute an offer to the public within the meaning of that Ordinance. No advertisement, invitation or document relating to the shares has been or may be issued or has been or may be in the possession of any person for the purposes of issue, whether in Hong Kong or elsewhere, which is directed at, or the contents of which are likely to be accessed or read by, the public of Hong Kong (except if permitted to do so under the securities laws of Hong Kong) other than with respect to shares which are or are intended to be disposed of only to persons outside Hong Kong or only to "professional investors" as defined in the Securities and Futures Ordinance (Cap. 571) of Hong Kong and any rules made under that Ordinance.
Notice to Prospective Investors in Japan
The shares have not been and will not be registered under the Financial Instruments and Exchange Law of Japan (Law No. 25 of 1948, as amended) and, accordingly, will not be offered or sold, directly or indirectly, in Japan, or for the benefit of any Japanese Person or to others for re-offering or resale, directly or indirectly, in Japan or to any Japanese Person, except in compliance with all applicable laws, regulations and ministerial guidelines promulgated by relevant Japanese governmental or regulatory authorities in effect at the relevant time. For the purposes of this paragraph, "Japanese Person" shall mean any person resident in Japan, including any corporation or other entity organized under the laws of Japan.
Notice to Prospective Investors in Singapore
This prospectus has not been registered as a prospectus with the Monetary Authority of Singapore. Accordingly, this prospectus and any other document or material in connection with the offer or sale, or invitation for subscription or purchase, of the shares may not be circulated or distributed, nor may the shares be offered or sold, or be made the subject of an invitation for subscription or purchase, whether directly or indirectly, to persons in Singapore other than (i) to an institutional investor under Section 274 of the Securities and Futures Act, Chapter 289 of Singapore (the "SFA"), (ii) to a relevant person pursuant to Section 275(1), or any person pursuant to Section 275(1A), and in accordance with
212
the conditions specified in Section 275, of the SFA, or (iii) otherwise pursuant to, and in accordance with the conditions of, any other applicable provision of the SFA.
Where the shares are subscribed or purchased under Section 275 of the SFA by a relevant person which is:
- (a)
- a
corporation (which is not an accredited investor (as defined in Section 4A of the SFA)) the sole business of which is to hold investments and the entire
share capital of which is owned by one or more individuals, each of whom is an accredited investor; or
- (b)
- a trust (where the trustee is not an accredited investor) whose sole purpose is to hold investments and each beneficiary of the trust is an individual who is an accredited investor,
securities (as defined in Section 239(1) of the SFA) of that corporation or the beneficiaries' rights and interest (howsoever described) in that trust shall not be transferred within six months after that corporation or that trust has acquired the shares pursuant to an offer made under Section 275 of the SFA except:
- (a)
- to
an institutional investor or to a relevant person defined in Section 275(2) of the SFA, or to any person arising from an offer referred to in
Section 275(1A) or Section 276(4)(i)(B) of the SFA;
- (b)
- where
no consideration is or will be given for the transfer;
- (c)
- where
the transfer is by operation of law;
- (d)
- as
specified in Section 276(7) of the SFA; or
- (e)
- as specified in Regulation 32 of the Securities and Futures (Offers of Investments) (Shares and Debentures) Regulations 2005 of Singapore.
Notice to Prospective Investors in Switzerland
This document is not intended to constitute an offer or solicitation to purchase or invest in the securities described herein. The securities may not be publicly offered, sold or advertised, directly or indirectly, in, into or from Switzerland and will not be listed on the SIX Swiss Exchange or on any other exchange or regulated trading facility in Switzerland. Neither this document nor any other offering or marketing material relating to the securities constitutes a prospectus as such term is understood pursuant to article 652a or article 1156 of the Swiss Code of Obligations or a listing prospectus within the meaning of the listing rules of the SIX Swiss Exchange or any other regulated trading facility in Switzerland, and neither this document nor any other offering or marketing material relating to the securities may be publicly distributed or otherwise made publicly available in Switzerland.
Neither this document nor any other offering or marketing material relating to the offering, nor the Company nor the securities have been or will be filed with or approved by any Swiss regulatory authority. The securities are not subject to the supervision by any Swiss regulatory authority, e.g., the Swiss Financial Markets Supervisory Authority FINMA (FINMA), and investors in the securities will not benefit from protection or supervision by such authority.
213
The validity of the shares of common stock offered hereby will be passed upon for us and the selling stockholders by Fried, Frank, Harris, Shriver & Jacobson LLP, New York, New York. Fried, Frank, Harris, Shriver & Jacobson LLP owns an indirect interest in less than 1% of our common stock through limited partnership interests in funds associated with AEA. Legal matters in connection with this offering will be passed upon for the underwriters by Latham & Watkins LLP, New York, New York.
The consolidated financial statements of Evoqua Water Technologies Corp. at September 30, 2015 and 2016, and for the period from January 15, 2014 through September 30, 2014 and the years ended September 30, 2015 and 2016 and the consolidated financial statements of Siemens Water Technologies for the period October 1, 2013 through January 15, 2014, appearing in this prospectus and registration statement have been audited by Ernst & Young LLP, independent registered public accounting firm, as set forth in their report thereon appearing elsewhere herein, and are included in reliance upon such report given on the authority of such firm as experts in accounting and auditing.
The consolidated financial statements of NB Intermediate Holdings, LLC and Subsidiaries as of December 31, 2015 and for the year ended December 31, 2015 have been audited by RSM US LLP, independent auditor, as stated in their report thereon, and have been included in this prospectus and registration statement in reliance upon such report and upon the authority of such firm as experts in accounting and auditing.
WHERE YOU CAN FIND MORE INFORMATION
We have filed with the SEC a registration statement on Form S-1, including exhibits and schedules, under the Securities Act with respect to the common stock to be sold in this offering. As allowed by SEC rules, this prospectus, which constitutes a part of the registration statement, does not contain all of the information set forth in the registration statement or the exhibits and schedules that are part of the registration statement. For further information about us and our common stock, you should refer to the registration statement, including all amendments, supplements, schedules and exhibits thereto.
Statements contained in this prospectus regarding the contents of any contract or any other document that is filed as an exhibit to the registration statement are not necessarily complete, and each such statement is qualified in all respects by reference to the full text of such contract or other document filed as an exhibit to the registration statement.
You may read, without charge, and copy, at prescribed rates, all or any portion of the registration statement or any reports, statements or other information we file with or furnish to the SEC at the SEC's Public Reference Room at 100 F Street, N.E., Washington, DC 20549. You may also obtain copies of the documents at prescribed rates by writing to the Public Reference Section of the SEC. Please call the SEC at 1-800-SEC-0330 to obtain information on the operation of the Public Reference Room. In addition, the SEC maintains an internet site that contains reports, proxy and information statements and other information regarding issuers that file electronically with the SEC. You can review the registration statement, as well as our future SEC filings, by accessing the SEC's website at www.sec.gov. You may also request copies of those documents, at no cost to you, by contacting us at the following address:
Evoqua
Water Technologies Corp.
210 Sixth Avenue
Pittsburgh, Pennsylvania 15222
(724) 772-0044
As a result of this offering, we will become subject to the information and reporting requirements of the Exchange Act and will file annual, quarterly and current reports, proxy statements and other information with the SEC. You can request copies of these documents, for a copying fee, by writing to the SEC. We intend to furnish our stockholders with annual reports containing financial statements audited by our independent registered public accounting firm.
214
INDEX TO CONSOLIDATED FINANCIAL STATEMENTS
F-1
F-2
Report of Independent Registered Public Accounting Firm
The
Board of Directors and Shareholders of
EWT Holdings I Corp.
We have audited the accompanying consolidated balance sheets of EWT Holdings I Corp. as of September 30, 2015 and 2016, and the related combined statements of operations, comprehensive income (loss), changes in equity and changes in cash flows of Siemens Water Technologies for the period from October 1, 2013 to January 15, 2014 (Predecessor Company) and the consolidated statement of operations, comprehensive income (loss), changes in equity and changes in cash flows for the period from January 16, 2014 to September 30, 2014 (Successor Company) and the years ended September 30, 2015 and 2016. Our audits also included the financial statement schedule listed in the Index to the consolidated financial statements. These financial statements and schedule are the responsibility of the Company's management. Our responsibility is to express an opinion on these financial statements and schedule based on our audits.
We conducted our audits in accordance with the standards of the Public Company Accounting Oversight Board (United States). Those standards require that we plan and perform the audit to obtain reasonable assurance about whether the financial statements are free of material misstatement. We were not engaged to perform an audit of the Company's internal control over financial reporting. Our audits included consideration of internal control over financial reporting as a basis for designing audit procedures that are appropriate in the circumstances, but not for the purpose of expressing an opinion on the effectiveness of the Company's internal control over financial reporting. Accordingly, we express no such opinion. An audit also includes examining, on a test basis, evidence supporting the amounts and disclosures in the consolidated financial statements, assessing the accounting principles used and significant estimates made by management, and evaluating the overall financial statement presentation. We believe that our audits provide a reasonable basis for our opinion.
In our opinion, the financial statements referred to above present fairly, in all material respects, the consolidated financial position of EWT Holdings I Corp. at September 30, 2015 and 2016, and the combined results of Siemens Water Technologies operations and cash flows for the period from October 1, 2013 to January 15, 2014 (Predecessor Company) and the consolidated results of its operations and cash flows for the period from January 16, 2014 to September 30, 2014 (Successor Company) and the years ended September 30, 2015 and 2016 in conformity with U.S. generally accepted accounting principles. Also, in our opinion, the related financial statement schedule, when considered in relation to the basic financial statements taken as a whole, presents fairly in all material respects the information set forth therein.
| /s/ Ernst & Young LLP |
Pittsburgh, Pennsylvania
August 28, 2017, except for note 23
as to which the date is
October 16, 2017
F-3
EWT Holdings I Corp.
Consolidated Balance Sheets
(in thousands)
| |
September 30, 2015 | September 30, 2016 | |||||
|---|---|---|---|---|---|---|---|
ASSETS |
|||||||
Current assets |
$ | 481,473 | $ | 418,336 | |||
| | | | | | | | |
Cash and cash equivalents |
169,027 | 50,362 | |||||
Receivables, net |
160,491 | 184,789 | |||||
Inventories, net |
92,611 | 112,392 | |||||
Cost and earnings in excess of billings on uncompleted contracts |
34,823 | 50,081 | |||||
Prepaid and other current assets |
13,797 | 16,255 | |||||
Deferred income taxes |
1,887 | — | |||||
Income tax receivable |
8,837 | 4,457 | |||||
| | | | | | | | |
Property, plant, and equipment, net |
235,828 | 256,765 | |||||
| | | | | | | | |
Investment in affiliate |
6,873 | — | |||||
| | | | | | | | |
Goodwill |
113,583 | 267,643 | |||||
| | | | | | | | |
Intangible assets, net |
180,137 | 323,478 | |||||
| | | | | | | | |
Deferred income taxes |
7 | — | |||||
| | | | | | | | |
Other non-current assets |
21,970 | 30,009 | |||||
| | | | | | | | |
Total assets |
$ | 1,039,871 | $ | 1,296,231 | |||
| | | | | | | | |
| | | | | | | | |
| | | | | | | | |
LIABILITIES AND EQUITY |
|||||||
Current liabilities |
$ | 249,359 | $ | 284,862 | |||
| | | | | | | | |
Accounts payable |
78,305 | 102,379 | |||||
Current portion of debt |
5,050 | 30,024 | |||||
Billings in excess of costs incurred |
35,616 | 22,175 | |||||
Product warranties |
23,005 | 16,860 | |||||
Accrued expenses and other liabilities |
100,815 | 111,307 | |||||
Income tax payable |
4,833 | 2,117 | |||||
Deferred income taxes |
1,735 | — | |||||
| | | | | | | | |
Non-current liabilities |
616,152 | 807,434 | |||||
| | | | | | | | |
Long-term debt |
547,032 | 728,132 | |||||
Product warranties |
8,753 | 6,449 | |||||
Other non-current liabilities |
56,640 | 64,290 | |||||
Deferred income taxes |
3,727 | 8,563 | |||||
| | | | | | | | |
Total liabilities |
865,511 | 1,092,296 | |||||
| | | | | | | | |
| | | | | | | | |
| | | | | | | | |
Commitments and Contingent Liabilities (Note 19) |
— | — | |||||
Shareholders' equity |
|||||||
Common stock, par value $0.01: authorized 1,000,000 shares; issued 101,849 shares, outstanding 101,742 at September 30, 2015; issued 104,495 shares, outstanding 104,250 shares at September 30, 2016 |
1,018 | 1,045 | |||||
Treasury stock: 107 shares at September 30, 2015 and 245 shares at September 30, 2016 |
(410 | ) | (1,133 | ) | |||
Additional paid-in capital |
362,073 | 381,223 | |||||
Retained deficit |
(183,808 | ) | (172,169 | ) | |||
Accumulated other comprehensive loss, net of tax |
(4,513 | ) | (10,671 | ) | |||
| | | | | | | | |
Total EWT Holdings I Corp. equity |
174,360 | 198,295 | |||||
Non-controlling interest |
— | 5,640 | |||||
| | | | | | | | |
Total shareholders' equity |
174,360 | 203,935 | |||||
| | | | | | | | |
| | | | | | | | |
| | | | | | | | |
Total liabilities and shareholders' equity |
$ | 1,039,871 | $ | 1,296,231 | |||
| | | | | | | | |
| | | | | | | | |
| | | | | | | | |
See accompanying notes to these Consolidated Financial Statements
F-4
EWT Holdings I Corp.
Consolidated Statements of Operations
(in thousands except per share data)
| |
Predecessor | |
Successor | ||||||||||||
|---|---|---|---|---|---|---|---|---|---|---|---|---|---|---|---|
| |
October 1, 2013 through January 15, 2014 |
|
January 16, 2014 through September 30, 2014 |
Year ended September 30, 2015 |
Year ended September 30, 2016 |
||||||||||
Revenue from product sales |
$ | 169,100 | $ | 414,884 | $ | 533,649 | $ | 587,087 | |||||||
Revenue from services |
137,214 | 376,270 | 527,317 | 550,109 | |||||||||||
| | | | | | | | | | | | | | | | |
|
306,314 | 791,154 | 1,060,966 | 1,137,196 | |||||||||||
Cost of product sales |
(124,848 |
) |
(366,107 |
) |
(385,243 |
) |
(407,354 |
) |
|||||||
Cost of services |
(103,379 | ) | (334,138 | ) | (383,306 | ) | (396,777 | ) | |||||||
| | | | | | | | | | | | | | | | |
|
(228,227 | ) | (700,245 | ) | (768,549 | ) | (804,131 | ) | |||||||
Gross Profit |
78,087 |
90,909 |
292,417 |
333,065 |
|||||||||||
Research and development expense |
(6,728 |
) |
(18,829 |
) |
(25,909 |
) |
(22,897 |
) |
|||||||
Sales and marketing expense |
(38,479 | ) | (90,947 | ) | (124,429 | ) | (135,208 | ) | |||||||
General and administrative expense |
(35,652 | ) | (104,122 | ) | (147,663 | ) | (144,771 | ) | |||||||
Other operating income |
124 | 307 | 1,237 | 10,079 | |||||||||||
Other operating expense |
(1,322 | ) | (829 | ) | (1,163 | ) | (3,113 | ) | |||||||
Interest expense |
(23 | ) | (23,994 | ) | (34,060 | ) | (42,518 | ) | |||||||
Equity in income of non-consolidated affiliate |
518 | 1,283 | 1,424 | — | |||||||||||
| | | | | | | | | | | | | | | | |
Loss before income taxes |
(3,475 | ) | (146,222 | ) | (38,146 | ) | (5,363 | ) | |||||||
| | | | | | | | | | | | | | | | |
Income tax benefit (expense) |
1,173 | 48,465 | (47,905 | ) | 18,394 | ||||||||||
| | | | | | | | | | | | | | | | |
Net (loss) income |
(2,302 | ) | (97,757 | ) | (86,051 | ) | 13,031 | ||||||||
| | | | | | | | | | | | | | | | |
Net income attributable to non-controlling interest |
— | — | — | 1,392 | |||||||||||
| | | | | | | | | | | | | | | | |
Net (loss) income attributable to EWT Holdings I Corp. |
$ | (2,302 | ) | $ | (97,757 | ) | $ | (86,051 | ) | $ | 11,639 | ||||
| | | | | | | | | | | | | | | | |
| | | | | | | | | | | | | | | | |
| | | | | | | | | | | | | | | | |
Basic (loss) earnings per common share |
$ | (0.97 | ) | $ | (0.85 | ) | $ | 0.11 | |||||||
Diluted (loss) earnings per common share |
$ | (0.97 | ) | $ | (0.85 | ) | $ | 0.11 | |||||||
See accompanying notes to these Consolidated Financial Statements
F-5
EWT Holdings I Corp.
Consolidated Statements of Comprehensive Income (Loss)
(in thousands)
| |
|
|
Successor | ||||||||||||
|---|---|---|---|---|---|---|---|---|---|---|---|---|---|---|---|
| |
|
|
|
|
|
||||||||||
| |
Predecessor | |
|
|
|
||||||||||
| |
|
|
|
|
|||||||||||
| |
October 1, 2013 through January 15, 2014 |
January 16, 2014 through September 30, 2014 |
Year ended September 30, 2015 |
Year ended September 30, 2016 |
|||||||||||
Net (loss) income |
$ | (2,302 | ) | $ | (97,757 | ) | $ | (86,051 | ) | $ | 13,031 | ||||
Other comprehensive income |
|||||||||||||||
Foreign currency translation adjustments |
(315 | ) | 2,038 | (4,276 | ) | 1,493 | |||||||||
Change in pension liability, net of tax of ($0), ($1,012), ($72) and ($0), respectively |
— | (2,560 | ) | 285 | (7,651 | ) | |||||||||
| | | | | | | | | | | | | | | | |
Total other comprehensive loss |
(315 | ) | (522 | ) | (3,991 | ) | (6,158 | ) | |||||||
Less: Comprehensive income attributable to non-controlling interest |
— | — | — | (1,392 | ) | ||||||||||
| | | | | | | | | | | | | | | | |
Comprehensive (loss) income attributable to EWT Holdings I Corp. |
$ | (2,617 | ) | $ | (98,279 | ) | $ | (90,042 | ) | $ | 5,481 | ||||
| | | | | | | | | | | | | | | | |
| | | | | | | | | | | | | | | | |
| | | | | | | | | | | | | | | | |
See accompanying notes to these Consolidated Financial Statements
F-6
EWT Holdings I Corp.
Consolidated Statements of Changes in Equity
(in thousands)
| |
Common Stock Shares |
Common Stock |
Treasury Stock Shares |
Treasury Stock |
Additional Paid-in Capital |
Retained Deficit |
Accumulated Other Comprehensive Loss |
Non-controlling Interest |
Net Parent Investment |
Total | |||||||||||||||||||||
|---|---|---|---|---|---|---|---|---|---|---|---|---|---|---|---|---|---|---|---|---|---|---|---|---|---|---|---|---|---|---|---|
Predecessor |
|||||||||||||||||||||||||||||||
Balance at October 1, 2013 |
— | $ | — | — | $ | — | $ | — | $ | — | $ | — | $ | — | $ | 712,210 | $ | 712,210 | |||||||||||||
Net loss |
— | — | — | — | — | — | — | — | (2,302 | ) | (2,302 | ) | |||||||||||||||||||
Other comprehensive loss |
— | — | — | — | — | — | — | — | (315 | ) | (315 | ) | |||||||||||||||||||
Distribution from parent |
— | — | — | — | — | — | — | — | 89,901 | 89,901 | |||||||||||||||||||||
| | | | | | | | | | | | | | | | | | | | | | | | | | | | | | | | |
Balance at January 15, 2014 |
— | $ | — | — | $ | — | $ | $ | $ | — | $ | — | $ | 799,494 | $ | 799,494 | |||||||||||||||
Successor |
|||||||||||||||||||||||||||||||
Balance at January 16, 2014 |
— | $ | — | — | $ | — | $ | — | $ | — | $ | — | $ | — | $ | — | $ | — | |||||||||||||
Issuance of common stock, net of $16,650 in fees |
99,743 | 997 | — | — | 352,390 | — | — | — | — | 353,387 | |||||||||||||||||||||
Equity based compensation expense |
— | — | — | — | 342 | — | — | — | — | 342 | |||||||||||||||||||||
Issuance of common stock |
1,878 | 19 | — | — | 6,909 | — | — | — | — | 6,928 | |||||||||||||||||||||
Net loss |
— | — | — | — | — | (97,757 | ) | — | — | — | (97,757 | ) | |||||||||||||||||||
Other comprehensive loss |
— | — | — | — | — | — | (522 | ) | — | — | (522 | ) | |||||||||||||||||||
| | | | | | | | | | | | | | | | | | | | | | | | | | | | | | | | |
Balance at September 30, 2014 |
101,621 | $ | 1,016 | — | $ | — | $ | 359,641 | $ | (97,757 | ) | $ | (522 | ) | $ | — | $ | — | $ | 262,378 | |||||||||||
Equity based compensation expense |
— | — | — | — | 1,587 | — | — | — | — | 1,587 | |||||||||||||||||||||
Issuance of common stock |
228 | 2 | — | — | 845 | — | — | — | — | 847 | |||||||||||||||||||||
Stock repurchases |
— | — | 107 | (410 | ) | — | — | — | — | — | (410 | ) | |||||||||||||||||||
Net loss |
— | — | — | — | — | (86,051 | ) | — | — | — | (86,051 | ) | |||||||||||||||||||
Other comprehensive loss |
— | — | — | — | — | — | (3,991 | ) | — | — | (3,991 | ) | |||||||||||||||||||
| | | | | | | | | | | | | | | | | | | | | | | | | | | | | | | | |
Balance at September 30, 2015 |
101,849 | 1,018 | 107 | (410 | ) | 362,073 | (183,808 | ) | (4,513 | ) | — | — | 174,360 | ||||||||||||||||||
Equity based compensation expense |
— | — | — | — | 1,999 | — | — | — | — | 1,999 | |||||||||||||||||||||
Capital contribution |
— | — | — | — | 6,895 | — | — | — | — | 6,895 | |||||||||||||||||||||
Issuance of common stock |
2,646 | 27 | — | — | 10,256 | — | — | — | — | 10,283 | |||||||||||||||||||||
Stock repurchases |
— | — | 138 | (723 | ) | — | — | — | — | — | (723 | ) | |||||||||||||||||||
Establishment of non-controlling interest |
— | 0 | — | — | — | — | — | 6,873 | — | 6,873 | |||||||||||||||||||||
Dividends paid to non-controlling interest |
— | — | — | — | — | — | (2,625 | ) | — | (2,625 | ) | ||||||||||||||||||||
Net income |
— | — | — | — | — | 11,639 | — | 1,392 | — | 13,031 | |||||||||||||||||||||
Other comprehensive loss |
— | — | — | — | (6,158 | ) | — | — | (6,158 | ) | |||||||||||||||||||||
| | | | | | | | | | | | | | | | | | | | | | | | | | | | | | | | |
Balance at September 30, 2016 |
104,495 | $ | 1,045 | 245 | $ | (1,133 | ) | $ | 381,223 | $ | (172,169 | ) | $ | (10,671 | ) | $ | 5,640 | $ | $ | 203,935 | |||||||||||
| | | | | | | | | | | | | | | | | | | | | | | | | | | | | | | | |
| | | | | | | | | | | | | | | | | | | | | | | | | | | | | | | | |
| | | | | | | | | | | | | | | | | | | | | | | | | | | | | | | | |
See accompanying notes to these Consolidated Financial Statements
F-7
EWT Holdings I Corp.
Consolidated Statements of Changes in Cash Flows
(in thousands)
| |
Predecessor |
|
Successor | ||||||||||||
|---|---|---|---|---|---|---|---|---|---|---|---|---|---|---|---|
| |
October 1, 2013 Through January 15, 2014 |
|
January 16, 2014 Through September 30, 2014 |
Year Ended September 30, 2015 |
Year Ended September 30, 2016 |
||||||||||
Operating activities |
|||||||||||||||
Net (loss) income |
$ | (2,302 | ) | $ | (97,757 | ) | $ | (86,051 | ) | $ | 13,031 | ||||
Reconciliation of net loss to cash flows from operating activities: |
|||||||||||||||
Depreciation and amortization |
14,934 | 139,933 | 58,139 | 69,289 | |||||||||||
Amortization of deferred financing costs |
— | 2,489 | 3,514 | 4,121 | |||||||||||
Deferred income taxes |
(2,610 | ) | (52,416 | ) | 45,254 | (21,215 | ) | ||||||||
Share based compensation |
2,500 | 342 | 1,587 | 1,999 | |||||||||||
Equity in net income (loss) of affiliate, net of cash received |
(268 | ) | (158 | ) | 76 | — | |||||||||
Gain on sale of property, plant and equipment |
(291 | ) | (309 | ) | (20 | ) | (11,120 | ) | |||||||
Foreign currency losses on intracompany loans |
— | 6,794 | 19,288 | 51 | |||||||||||
Changes in assets and liabilities |
|||||||||||||||
Accounts receivable |
22,350 | (1,465 | ) | 9,496 | (3,973 | ) | |||||||||
Inventories |
3,185 | 11,986 | (44 | ) | 2,484 | ||||||||||
Cost and earnings in excess of billings on uncompleted contracts |
(6,689 | ) | 30,188 | 17,848 | (15,258 | ) | |||||||||
Due to affiliates |
36,293 | — | — | — | |||||||||||
Prepaids and other current assets |
18,009 | (761 | ) | 4,287 | 1,326 | ||||||||||
Accounts payable |
(12,272 | ) | 13,781 | (14,941 | ) | 15,682 | |||||||||
Accrued expenses and other liabilities |
(6,526 | ) | (7,305 | ) | (14,568 | ) | (31,446 | ) | |||||||
Billings in excess of costs incurred |
5,728 | (10,978 | ) | 7,497 | (13,389 | ) | |||||||||
Income taxes |
(23,500 | ) | 3,755 | (6,224 | ) | 4,329 | |||||||||
Other non-current assets and liabilities |
(2,964 | ) | (641 | ) | (3,194 | ) | 16,008 | ||||||||
| | | | | | | | | | | | | | | | |
Net cash provided by operating activities |
45,577 | 37,478 | 41,944 | 31,919 | |||||||||||
| | | | | | | | | | | | | | | | |
Investing activities |
|||||||||||||||
Purchase of property, plant and equipment |
(7,965 | ) | (28,625 | ) | (44,079 | ) | (47,728 | ) | |||||||
Purchase of intangibles |
— | (4,477 | ) | (4,705 | ) | (248 | ) | ||||||||
Proceeds from sale of property, plant and equipment |
441 | 1,592 | 1,918 | 5,191 | |||||||||||
Proceeds from sale of business |
— | — | — | 4,547 | |||||||||||
Acquisitions, net of cash acquired of $0, $167,565, $0 and $11,486, respectively |
— | (730,577 | ) | — | (306,372 | ) | |||||||||
| | | | | | | | | | | | | | | | |
Net cash used in investing activities |
(7,524 | ) | (762,087 | ) | (46,866 | ) | (344,610 | ) | |||||||
| | | | | | | | | | | | | | | | |
Financing activities |
|||||||||||||||
Net transfers from parent |
89,901 | — | — | — | |||||||||||
Issuance of debt related to acquisitions, net of deferred issuance costs |
— | 580,000 | — | 178,704 | |||||||||||
Borrowings under credit facility |
— | (25,083 | ) | — | 81,000 | ||||||||||
Repayment of debt |
— | (3,788 | ) | (5,050 | ) | (74,461 | ) | ||||||||
Repayment of capital lease obligation |
— | — | (1,650 | ) | (7,683 | ) | |||||||||
Proceeds from capital contribution |
— | — | — | 6,895 | |||||||||||
Proceeds from issuance of common stock |
— | 376,965 | 847 | 10,282 | |||||||||||
Stock repurchases |
— | — | (410 | ) | (723 | ) | |||||||||
Investor transaction fees |
— | (16,650 | ) | — | — | ||||||||||
Distribution to non-controlling interest |
— | — | — | (2,625 | ) | ||||||||||
| | | | | | | | | | | | | | | | |
Net cash provided by (used in) financing activities |
89,901 | 911,444 | (6,263 | ) | 191,389 | ||||||||||
| | | | | | | | | | | | | | | | |
Effect of exchange rate changes on cash |
(243 | ) | (1,399 | ) | (5,225 | ) | 2,637 | ||||||||
| | | | | | | | | | | | | | | | |
Change in cash and cash equivalents |
127,711 | 185,436 | (16,410 | ) | (118,665 | ) | |||||||||
Cash and cash equivalents |
|||||||||||||||
Beginning of period |
39,857 | — | 185,437 | 169,027 | |||||||||||
| | | | | | | | | | | | | | | | |
End of period |
$ | 167,568 | $ | 185,436 | $ | 169,027 | $ | 50,362 | |||||||
| | | | | | | | | | | | | | | | |
| | | | | | | | | | | | | | | | |
| | | | | | | | | | | | | | | | |
See accompanying notes to these Consolidated Financial Statements
F-8
EWT Holdings I Corp.
Supplemental Disclosure of Cash Flow Information
(in thousands)
| |
|
|
Successor | ||||||||||||
|---|---|---|---|---|---|---|---|---|---|---|---|---|---|---|---|
| |
|
|
|
|
|
||||||||||
| |
Predecessor | |
|
|
|
||||||||||
| |
|
|
|
|
|||||||||||
| |
October 1, 2013 Through January 15, 2014 |
|
January 16, 2014 Through September 30, 2014 |
Year Ended September 30, 2015 |
Year Ended September 30, 2016 |
||||||||||
Supplemental disclosure of cash flow information |
|||||||||||||||
Cash paid for taxes |
$ | — | $ | 918 | $ | 8,685 | $ | 3,964 | |||||||
Cash paid for interest |
$ | — | $ | 21,714 | $ | 30,511 | $ | 36,750 | |||||||
Non-cash investing and financing activities |
|||||||||||||||
Accrued earnout related to acquisition |
$ | — | $ | — | $ | — | $ | 650 | |||||||
Capital lease transactions |
$ | — | $ | — | $ | 22,504 | $ | 8,378 | |||||||
See accompanying notes to these Consolidated Financial Statements
F-9
EWT Holdings I Corp.
Notes to Audited Consolidated Financial Statements
September 30, 2015 and September 30, 2016
(in thousands)
1. Description of the Company and Basis of Presentation
Background
EWT Holdings I Corp. was incorporated on October 7, 2013. On January 15, 2014, EWT Holdings I Corp., acquired through its wholly owned entities, EWT Holdings II Corp. and EWT Holdings III Corp. (a/k/a Evoqua Water Technologies), all of the outstanding shares of Siemens Water Technologies, a group of legal entity businesses formerly owned by Siemens AG (Siemens). The stock purchase closed on January 15, 2014 and was effective January 16, 2014 (the Acquisition). The stock purchase price, net of cash received, was approximately $730,577. From October 7, 2013 to January 15, 2014, the Successor had no activities other than the incurrence of transaction costs related to the AEA Acquisition.
Evoqua Water Technologies and subsidiaries will be referred to herein as "the Successor", "the Company" or "EWT". Siemens Water Technologies will be referred to herein as "Water Technologies Group" or "the Predecessor."
The Business
EWT provides a wide range of product brands and advanced water and wastewater treatment systems and technologies, as well as mobile and emergency water supply solutions and service contract options through its segment's branch network. Headquartered in Warrendale, Pennsylvania, EWT is a multi-national corporation with operations in the United States, Canada, the United Kingdom, the Netherlands, Italy, Germany, Australia, China, and Singapore.
The Company is organizationally structured into three reportable segments for the purpose of making operational decisions and assessing financial performance: (i) Industrial, (ii) Municipal and (iii) Products.
Basis of Presentation
The accompanying consolidated financial statements of the Successor and Predecessor have been prepared in accordance with accounting principles generally accepted in the United States (U.S. GAAP) from the accounting records of the Company, and reflect the consolidated financial position and results of operations for the period from January 16, 2014 to September 30, 2014 and the years ended September 30, 2015 and 2016. The assets and liabilities of the Company reflect the application of purchase accounting at the date of acquisition. All intracompany transactions have been eliminated.
The financial statements of the Predecessor have been prepared on a combined basis from the accounting records of Siemens AG and reflect the historical results of operations and cost basis of assets and liabilities that comprise the Predecessor. As the Predecessor represents a portion of the Siemens' business, the historical statement of operations, balance sheet, and cash flows of the Predecessor may not be indicative of what they would have been had the Predecessor been a separate stand-alone entity.
F-10
EWT Holdings I Corp.
Notes to Audited Consolidated Financial Statements (Continued)
September 30, 2015 and September 30, 2016
(in thousands)
2. Summary of Significant Accounting Policies
Fiscal Year
The Company's fiscal year ends on September 30.
Use of Estimates
The consolidated financial statements have been prepared in conformity with U.S. GAAP and require management to make estimates and assumptions. These assumptions affect the reported amounts of assets and liabilities and disclosure of contingent assets and liabilities at the date of the consolidated financial statements and the reported amounts of revenue and expenses during the reporting period. Estimates and assumptions are used for, but not limited to: (i) revenue recognition; (ii) allowance for doubtful accounts; (iii) inventory valuation, asset valuations, impairment, and recoverability assessments; (iv) depreciable lives of assets; (v) useful lives of intangible assets; (vi) income tax reserves and valuation allowances; and (vii) product warranty and litigation reserves. Estimates are revised as additional information becomes available. Actual results could differ from these estimates.
Cash and Cash Equivalents
Cash and cash equivalents are liquid investments with an original maturity of three or fewer months when purchased.
Accounts Receivable
Receivables are primarily comprised of uncollected amounts owed to us from transactions with customers and are presented net of allowances for doubtful accounts. Allowances are estimated based on historical write-offs and the economic status of customers. The Company considers a receivable delinquent if it is unpaid after the term of the related invoice has expired. Write-offs are recorded at the time all collection efforts have been exhausted.
Inventories
Inventories are stated at the lower of cost or market, where cost is generally determined on the basis of an average or first-in, first-out (FIFO) method. Production costs comprise direct material and labor and applicable manufacturing overheads, including depreciation charges. The Company regularly reviews inventory quantities on hand and writes off excess or obsolete inventory based on estimated forecasts of product demand and production requirements. Manufacturing operations recognize cost of product sales using standard costing rates with overhead absorption which generally approximates actual cost.
Property, Plant, and Equipment
Property, plant, and equipment is valued at cost less accumulated depreciation and impairment losses. If the costs of certain components of an item of property, plant, and equipment are significant in relation to the total cost of the item, they are accounted for and depreciated separately.
F-11
EWT Holdings I Corp.
Notes to Audited Consolidated Financial Statements (Continued)
September 30, 2015 and September 30, 2016
(in thousands)
2. Summary of Significant Accounting Policies (Continued)
Depreciation expense is recognized using the straight-line method. Useful lives are reviewed annually and, if expectations differ from previous estimates, adjusted accordingly. Estimated useful lives for major classes of depreciable assets are as follows:
Asset Class
|
Estimated Useful Life | |
|---|---|---|
Machinery and equipment |
3 to 20 years | |
Buildings and improvements |
10 to 40 years |
Leasehold improvements are depreciated over the shorter of their estimated useful life or the term of the lease. Costs related to maintenance and repairs that do not extend the assets' useful life are expensed as incurred.
Goodwill and Other Intangible Assets
Goodwill represents purchase consideration paid in a business combination that exceeds the value assigned to the net assets of acquired businesses. Other intangible assets consist of customer-related intangibles, proprietary technology, software, trademarks and other intangible assets. The Company amortizes intangible assets with definite useful lives on a straight-line basis over their respective estimated economic lives which range from 1 to 26 years.
The Company reviews goodwill to determine potential impairment annually during the fourth quarter of our fiscal year, or more frequently if events and circumstances indicate that the asset might be impaired. Impairment testing for goodwill is performed at a reporting unit level. We have determined that we have four reporting units. Our quantitative impairment testing utilizes both a market (guideline public company) and income (discounted cash flows) method for determining fair value. In estimating the fair value of the reporting unit utilizing a discounted cash flow ("DCF") valuation technique, we incorporate our judgment and estimates of future cash flows, future revenue and gross profit growth rates, terminal value amount, capital expenditures and applicable weighted-average cost of capital used to discount these estimated cash flows. The estimates and projections used in the estimate of fair value are consistent with our current budget and long-range plans, including anticipated change in market conditions, industry trend, growth rates and planned capital expenditures, among other considerations. If the carrying value of the reporting unit is greater than the fair value, the second step is performed, where the implied fair value of goodwill is compared to its carrying value.
Impairment of Long-Lived Assets
Long-lived assets, such as property, plant, and equipment, and purchased intangibles subject to amortization, are reviewed for impairment whenever events or changes in circumstances indicate that the carrying amount of an asset or asset group may not be recoverable. Recoverability of the asset or asset group is measured by comparison of its carrying amount to undiscounted future net cash flows the asset or asset group is expected to generate. If the carrying amount of an asset or asset group is not recoverable, the Company recognizes an impairment loss based on the excess of the carrying
F-12
EWT Holdings I Corp.
Notes to Audited Consolidated Financial Statements (Continued)
September 30, 2015 and September 30, 2016
(in thousands)
2. Summary of Significant Accounting Policies (Continued)
amount of the asset or asset group over its respective fair value which is generally determined as the present value of estimated future cash flows or as the appraised value.
Debt Issuance Costs and Debt Discounts
Debt issuance costs are capitalized and amortized over the contractual term of the underlying debt using the straight line method which approximates the effective interest method. Debt discounts and lender arrangement fees deducted from the proceeds have been included as a component of the carrying value of debt and are being amortized to interest expense using the effective interest method.
Amortization of debt issuance costs and debt discounts/premiums included in interest expense were $2,489, $3,514 and $4,121 for the year ending September 30, 2014 (Successor Period), 2015 and 2016, respectively.
Revenue Recognition
Sales of goods and services are recognized when persuasive evidence of an arrangement exists, the price is fixed or determinable, collectability is reasonably assured and delivery has occurred or services have been rendered.
For sales of aftermarket parts or products with a low level of customization and engineering time, the Company recognizes revenues at the time title and risks and rewards of ownership pass, which is generally when products are shipped or delivered to the customer as the Company has no obligation for installation. Sales of short-term service arrangements are recognized as the services are performed, and sales of long-term service arrangements are typically recognized on a straight-line basis over the life of the agreement.
For certain arrangements where there is significant customization to the product, the Company recognizes revenue under the provisions of Accounting Standards Codification (ASC) 605-35, Revenue Recognition—Construction-Type and Production-Type Contracts. These products include large capital water treatment projects, systems and solutions for municipal and industrial applications. Revenues from construction-type contracts are generally recognized under the percentage-of-completion method, based on the input of costs incurred to date as a percentage of total estimated contract costs. The nature of the contracts are generally fixed price with milestone billings. Approximately $175,317, $203,083 and $218,605 of revenues from construction-type contracts were recognized on the percentage-of-completion method during the periods ending September 30, 2014 (Successor Period) 2015 and 2016 respectively. Contract revenues and cost estimates are reviewed and revised quarterly at a minimum and the cumulative effect of such adjustments are recognized in current operations. The amount of such adjustments have not been material. Cost and earnings in excess of billings under construction-type arrangements are recorded when contracts have net asset balances where contract costs plus recognized profits less recognized losses exceed progress billings. Billings in excess of costs incurred are recorded when contract progress billings exceed costs and recognized profit less recognized losses.
F-13
EWT Holdings I Corp.
Notes to Audited Consolidated Financial Statements (Continued)
September 30, 2015 and September 30, 2016
(in thousands)
2. Summary of Significant Accounting Policies (Continued)
Approximately $21,638, $29,667 and $33,457 of revenues from construction-type contracts were recognized on a completed contract method, which is typically when the product is delivered and accepted by the customer, during the periods ending September 30, 2014 (Successor Period), 2015 and 2016. The completed contract method is principally used when the contract is short in duration (generally less than twelve months) and where results of operations would not vary materially from those resulting from the use of the percentage-of-completion method.
Product Warranties
Accruals for estimated expenses related to warranties are made at the time products are sold and are recorded as a component of Cost of product sales in the Consolidated Statements of Operations and Comprehensive Loss. The estimated warranty obligation is based on product warranty terms offered to customers, ongoing product failure rates, material usage and service delivery costs expected to be incurred in correcting a product failure, as well as specific obligations for known failures and other currently available evidence. The Company assesses the adequacy of the recorded warranty liabilities on a regular basis and adjusts amounts as necessary.
Shipping and Handling Cost
Shipping and handling costs are included as a component of cost of sales.
Income Taxes
The Company recognizes deferred tax assets and liabilities for the future tax consequences attributable to differences between the financial statement carrying amounts of existing assets and liabilities and their respective tax bases. Deferred tax assets and liabilities are measured using enacted tax rates expected to apply to taxable income in the years in which those temporary differences are expected to be recovered or settled. The effect on deferred tax assets and liabilities of a change in tax rates is recognized in income in the period that included the enactment date. Valuation allowances are provided against deferred tax assets when it is deemed more likely than not that some portion or all of the deferred tax asset will not be realized within a reasonable time period. We assess tax positions using a two-step process. A tax position is recognized if it meets a more-likely-than-not threshold, and is measured at the largest amount of benefit that is greater than 50.0% percent of being realized. Uncertain tax positions are reviewed each balance sheet date.
In November 2015, the Financial Accounting Standards Board ("FASB") issued an Accounting Standard Update ("ASU") 2015-17, Balance Sheet Classification of Deferred Taxes. This update simplifies the presentation of deferred income taxes. The amendments in this update require that deferred tax liabilities and assets be classified as noncurrent for all entities that present a classified statement of financial position. The current requirement that deferred tax liabilities and assets of a tax-paying component of an entity be offset and presented as a single amount is not affected by the amendments in this update. The amendments in this update are effective for non-public entity financial statements issued for annual periods beginning after December 15, 2017, and interim periods with annual periods beginning after December 15, 2018. Earlier application is permitted for all entities as of the beginning
F-14
EWT Holdings I Corp.
Notes to Audited Consolidated Financial Statements (Continued)
September 30, 2015 and September 30, 2016
(in thousands)
2. Summary of Significant Accounting Policies (Continued)
of an interim or annual reporting period. The amendments in this update may be applied either prospectively to all deferred tax liabilities and assets or retrospectively to all periods presented. Management has elected to prospectively adopt this update early as of October 1, 2015. By adopting this update prospectively, prior periods were not retrospectively adjusted.
Sales Taxes
Upon collection of sales tax from revenue, the amount of sales tax is placed into an accrued liability account. This liability is then relieved when the payment is sent to the proper government jurisdiction.
Foreign Currency Translation and Transactions
The functional currency for the international subsidiaries is the local currency. Assets and liabilities are translated into U.S. Dollars using current rates of exchange, while revenues and expenses are translated at the weighted-average exchange rate for the period. The resulting translation adjustments are recorded in other comprehensive income/loss within shareholders equity.
The Predecessor recognized foreign currency transaction losses of $321 for the period from October 1, 2013 to January 15, 2014. Foreign currency transaction losses aggregated $8,363, $19,957 and $666 for the period from January 16, 2014 to September 30, 2014 and for the fiscal years ending September 30, 2015 and 2016, respectively, and are primarily included in General and administrative expenses in the Consolidated Statements of Operations and Comprehensive Loss.
Research and Development Costs
Research and development costs are expensed as incurred. The Predecessor recorded $6,728 of costs for the period from October 1, 2013 to January 15, 2014. The Company recorded $18,829, $25,909, and $22,897 of costs, respectively, for the period from January 16, 2014 to September 30, 2014 and for the fiscal years ending September 30, 2015 and 2016.
Equity-based Compensation
The Company measures the cost of awards of equity instruments to employees based on the grant-date fair value of the award. Given the absence of a public trading market for our common stock, the fair value of the common stock underlying our share-based awards was determined by our board, with input from management, in each case using the income and market valuation approach. Stock options are granted with exercise prices equal to or greater than the estimated fair market value on the date of grant as authorized by our compensation committee. The grant-date fair value is determined using the Black-Scholes model. The fair value, net of estimated forfeitures, is amortized as compensation cost on a straight-line basis over the vesting period primarily as a component of General and administrative expenses.
F-15
EWT Holdings I Corp.
Notes to Audited Consolidated Financial Statements (Continued)
September 30, 2015 and September 30, 2016
(in thousands)
2. Summary of Significant Accounting Policies (Continued)
Earnings per Share
Basic earnings per common share is computed based on the weighted average number of shares of common stock outstanding during the period. Diluted earnings per common share is computed based on the weighted average number of shares of common stock, plus the effect of diluted potential common shares outstanding during the period using the treasury stock method. Diluted potential common shares include outstanding stock options.
Retirement Benefits
The Company applies, ASC Topic 715, Compensation—Retirement Benefits, which requires the recognition in pension obligations and accumulated other comprehensive income of actuarial gains or losses, prior service costs or credits and transition assets or obligations that have previously been deferred. The determination of retirement benefit pension obligations and associated costs requires the use of actuarial computations to estimate participant plan benefits to which the employees will be entitled. The significant assumptions primarily relate to discount rates, expected long-term rates of return on plan assets, rate of future compensation increases, mortality, years of service, and other factors. The Company develops each assumption using relevant experience in conjunction with market-related data for each individual country in which such plans exist. All actuarial assumptions are reviewed annually with third-party consultants and adjusted as necessary. For the recognition of net periodic postretirement cost, the calculation of the expected return on plan assets is generally derived by applying the expected long-term rate of return on the market-related value of plan assets. The fair value of plan assets is determined based on actual market prices or estimated fair value at the measurement date.
Treated Water Outsourcing
Treated Water Outsourcing (TWO) is a joint venture between the Company and the Ondeo Nalco Company (Nalco) to sell water management equipment and services to industrial customers located throughout the United States.
The Company holds a 50% partnership interest and for the years ended September 30, 2014 and 2015, accounted for TWO under the equity method and did not consolidate the joint venture as the Company did not have a controlling financial interest based on the shared powers of both joint venture partners to direct the activities that most significantly impact TWO's financial performance. During the period October 1, 2013 through January 15, 2014 (Predecessor), dividends received were $250. Dividends received during the fiscal year ended 2014 and 2015, respectively, were $1,125 and $1,500. At September 30, 2015, the Company had an investment of $6,873 classified in Investment in affiliate on the Consolidated Balance Sheets. This Investment in affiliate was included within the Industrial segment.
On October 1, 2015, a change occurred in the partnership structure of TWO such that the Company is now obligated to absorb all risk of loss up to 100% of the joint venture partner's equity. As such, the accounting for the Company's 50% interest changed from equity method investment to full consolidation as a variable interest entity (VIE) under ASC 810, Consolidation.
F-16
EWT Holdings I Corp.
Notes to Audited Consolidated Financial Statements (Continued)
September 30, 2015 and September 30, 2016
(in thousands)
2. Summary of Significant Accounting Policies (Continued)
The following provides a summary of the TWO as of September 30, 2016. The Company has not provided additional financial support to this entity which it is not contractually required to provide, and the Company does not have the ability to use the assets of TWO to settle obligations of the Company's other subsidiaries.
Current assets (including cash of $7,370) |
$ | 9,048 | ||
Property, plant and equipment |
8,481 | |||
Goodwill |
2,206 | |||
Other noncurrent assets |
8,229 | |||
Total liabilities |
$ | (16,684 | ) | |
Total revenue |
$ |
16,351 |
||
Total operating expenses |
(13,384 | ) | ||
| | | | | |
Income from operations |
$ | 2,967 | ||
| | | | | |
| | | | | |
| | | | | |
Recent Accounting Pronouncements
Accounting Pronouncements Not Yet Adopted
In May 2014, the FASB issued ASU No. 2014-09, Revenue from Contracts with Customers (Topic 606). ASU No. 2014-09 clarifies the principles for recognizing revenue when an entity either enters into a contract with customers to transfer goods or services or enters into a contract for the transfer of non-financial assets. The original standard was effective retrospectively for the Company for the quarter ending December 31, 2017; however in August 2015, the FASB issued ASU No. 2015-14, Revenue from Contracts with Customers (Topic 606): Deferral of the Effective Date, which defers the effective date of ASU No. 2014-09 by one-year for all entities. The new standard will become effective retrospectively for the Company for the quarter ending December 31, 2018, with early adoption permitted, but not before the original effective date. Additionally, in March 2016, the FASB issued ASU No. 2016-08, Revenue from Contracts with Customers (Topic 606): Principal versus Agent Considerations (Reporting Revenue Gross versus Net), in April 2016, the FASB issued ASU No. 2016-10, Revenue from Contracts with Customers (Topic 606): Identifying Performance Obligations and Licensing, and in May 2016, the FASB issued ASU No. 2016-12, Revenue from Contracts with Customers (Topic 606): Narrow-Scope Improvements and Practical Expedients, all of which provide additional clarification on certain topics addressed in ASU No. 2014-09. ASU No. 2016-08, ASU No. 2016-10 and ASU No. 2016-12 follow the same implementation guidelines as ASU No. 2014-09 and ASU No. 2015-14. The Company is currently assessing the impact adoption of this guidance will have on its consolidated financial statements.
In February 2016, the FASB issued ASU No. 2016-02, Leases (Topic 842). ASU No. 2016-02 requires recognition of operating leases as lease assets and liabilities on the balance sheet, and disclosure of key information about leasing arrangements. ASU No. 2016-02 will be effective retrospectively for the Company for the quarter ending December 31, 2019, with early adoption permitted. The Company is currently assessing the impact adoption of this guidance will have on its consolidated financial statements.
F-17
EWT Holdings I Corp.
Notes to Audited Consolidated Financial Statements (Continued)
September 30, 2015 and September 30, 2016
(in thousands)
2. Summary of Significant Accounting Policies (Continued)
In March 2016, the FASB issued (ASU) 2016-09, Improvements to Employee Share-Based Payment Accounting, which amends ASC Topic 718, Compensation—Stock Compensation. The ASU includes provisions intended to simplify various aspects related to how share-based payments are accounted for and presented in the financial statements. ASU No. 2016-09 will be effective for the Company for the quarter ending December 31, 2017. This update is not expected to have an impact on the Company's consolidated financial statements. The Company is currently assessing the impact adoption of this guidance will have on its consolidated financial statements.
In August 2016, the FASB issued ASU 2016-15, Statement of Cash Flows (Topic 230): Classification of Certain Cash Receipts and Cash Payments (a consensus of the Emerging Issues Task Force). This new guidance is intended to reduce diversity in practice in how certain transactions are classified in the statement of cash flows. ASU No. 2016-15 will be effective for the Company for the quarter ending December 31, 2018, with early adoption permitted. The guidance should be applied retrospectively to all periods presented, unless deem impracticable, in which case prospective application is permitted. The Company is currently evaluating the potential impact of adoption on the Company's Consolidated Financial Statements.
In January 2017, the FASB issued ASU 2017-04, Simplifying the Test for Goodwill Impairment. This ASU simplifies how an entity is required to test goodwill for impairment by eliminating Step 2 from the goodwill impairment test. Step 2 measures goodwill impairment loss by comparing the implied value of a reporting unit's goodwill with the carrying amount of that goodwill. The amendments in this ASU are effective for us for the quarter ending December 31, 2020. We do not expect the adoption of this ASU to have a material impact on our consolidated financial statements.
In May 2017, the FASB issued ASU 2017-09, Scope of Modification Accounting, which amended Accounting Standards Code Topic 718. FASB issued ASU 2017-09 to reduce the cost and complexity when applying Topic 718 and standardize the practice of applying Topic 718 to financial reporting. The ASU was not developed to fundamentally change the definition of a modification, but instead to provide guidance for what changes would qualify as a modification. ASU No. 2017-09 will be effective for us for the quarter ending December 31, 2018. We are currently evaluating the potential impact of adoption on the Company's Consolidated Financial Statements.
3. Acquisitions and Divestitures
As discussed above, EWT acquired the Predecessor on January 15, 2014. The Acquisition was treated as a purchase transaction and the purchase price was allocated to the underlying assets acquired and liabilities assumed based upon their estimated fair values at the date of acquisition. The purchase price totaled $730,577, net of cash received and was funded using the proceeds from a $560,400 debt placement (net of original issue discount and lender arrangement fees) as well as an equity investment. The equity was raised through the sale of 99,743 million shares of stock in the parent holding company, EWT Holdings I Corp, priced at $3.71 per share. The shares were sold at a 4.5% discount for total net proceeds of $353,350.
The excess of the purchase price over the fair value of the identifiable tangible and intangible assets acquired and liabilities assumed was recorded as goodwill. The goodwill is attributable to the assembled workforce and expected synergies among the acquired businesses.
F-18
EWT Holdings I Corp.
Notes to Audited Consolidated Financial Statements (Continued)
September 30, 2015 and September 30, 2016
(in thousands)
3. Acquisitions and Divestitures (Continued)
The following table reflected the allocation of the purchase price as of January 15, 2014 to the tangible and intangible assets acquired and liabilities assumed, with the excess recorded as goodwill within the Industrial, Municipal and Product segments:
Working capital, net of $167,568 cash acquired |
$ | 122,124 | ||
Property, plant and equipment |
238,447 |
|||
Identified intangible assets |
285,716 |
|||
Goodwill |
122,778 |
|||
Other non-current assets |
26,665 |
|||
Other non-current liabilities |
(65,153 |
) |
||
| | | | | |
Total |
$ |
730,577 |
||
| | | | | |
| | | | | |
| | | | | |
During fiscal year 2015, the purchase price was finalized with the recording of certain pension liabilities, net of tax. The goodwill balance was adjusted to reflect this change.
In connection with the Acquisition and the acquisition financing, the Company recognized $10,121 in acquisition costs included in General and administrative expenses from the acquisition and $25,083 in capitalized financing fees.
Acquisitions support the Company's strategy of delivering a broad solutions portfolio with robust technology across multiple geographies and end markets. The following acquisitions were made during the year ended September 30, 2016:
On April 11, 2016, the Company acquired 100% of privately held Magneto, a leader in the development and manufacture of anodes for the electrochemical industry and refurbishment of electro chlorination cells for seawater electrolysis, for €23,400 (approximately $26,528). As a result of the acquisition, approximately $700 of acquisition costs were incurred which are included in General and administrative expenses. The company has approximately 120 employees across its two locations in Schiedam, the Netherlands and Suzhou, China. Magneto is included in the results of the Products segment of the Company.
On April 15, 2016, the Company acquired 100% of privately held Neptune-Benson, a leading manufacturer of high-quality water filtration and disinfection products for the recreational, industrial, and municipal water markets for $283,704, less cash received of $2,357, of which $185,000 was funded through newly acquired debt, $8,950 was contributed capital in the form of equity provided to the sellers, and the remaining was paid with cash. The Company incurred approximately $2,099 of acquisition costs, which are included in General and administrative expenses. The company has approximately 110 employees across its United States and Canadian locations. Neptune-Benson is included in the results of the Products segment of the Company. Our consolidated income statement for fiscal year 2016 included revenue and operating profit of $17,359 and $6,568, respectively, attributable to Neptune-Benson since the acquisition.
F-19
EWT Holdings I Corp.
Notes to Audited Consolidated Financial Statements (Continued)
September 30, 2015 and September 30, 2016
(in thousands)
3. Acquisitions and Divestitures (Continued)
The following table presents the unaudited pro forma results for fiscal years 2015 and 2016. The unaudited pro forma financial information combines the results of operations of EWT and Neptune-Benson as though the Company had been combined as of the beginning of fiscal years 2015 and 2016, and the pro forma information is presented for informational purposes only and is not indicative of the results of operations that would have been achieved if the acquisition had taken place at such time. The unaudited pro forma results presented below include adjustments for increased fair value of acquired intangible assets and related amortization charges, acquisition costs and interest.
| |
Pro forma combined | ||||||
|---|---|---|---|---|---|---|---|
| |
September 30, 2015 | September 30, 2016 | |||||
Total Revenues |
$ | 1,116,701 | $ | 1,171,389 | |||
Net income (loss) attributable to EWT Holdings I Corp. |
(102,365 |
) |
16,568 |
||||
On July 1, 2016, the Company acquired essentially all of the assets of Valve and Filtration Systems, Ltd (VAF) through its recently acquired Neptune-Benson business for approximately $3,317; $2,667 cash at closing, in addition to earn out payments over the next five years. Included in consideration is $650, which represents the fair value of the earn outs at the date of the acquisition, with a maximum earnout payment of $1.0 million. VAF is a leading screen filtration manufacturer based in Arvada, Colorado, and has 12 employees. VAF's results are included within the Products segment.
On August 3, 2016, the Company acquired 100% of Delta Ultraviolet Corporation (Delta UV), a leading manufacturer and marketer of UV-C technology in North America, through the recently acquired Neptune-Benson business for $4,813. The Company incurred approximately $100 of acquisition costs, included in General and administrative expenses. Delta UV is based in Gardena, California and had 17 employees. Delta UV's results are included within the Products segment.
The above acquisitions were done to support the Company's growth plan. The opening balance sheets for the above acquisitions are as follows:
| |
Magneto | Neptune-Benson | VAF | Delta | Total | |||||||||||
|---|---|---|---|---|---|---|---|---|---|---|---|---|---|---|---|---|
Current Assets |
12,240 | 29,521 | 2,287 | 2,268 | 46,316 | |||||||||||
Property, plant and equipment |
2,323 | 2,480 | 37 | 518 | 5,358 | |||||||||||
Goodwill |
8,143 | 143,680 | 400 | 1,667 | 153,890 | |||||||||||
Other intangible assets |
9,401 | 149,127 | 1,190 | 1,970 | 161,688 | |||||||||||
Other noncurrent assets |
— | 3,576 | — | — | 3,576 | |||||||||||
| | | | | | | | | | | | | | | | | |
Total asset acquired |
32,107 | 328,384 | 3,914 | 6,423 | 370,828 | |||||||||||
Total liabilities assumed |
(5,579 | ) | (44,680 | ) | (597 | ) | (1,610 | ) | (52,466 | ) | ||||||
| | | | | | | | | | | | | | | | | |
Net assets acquired |
26,528 | 283,704 | 3,317 | 4,813 | 318,362 | |||||||||||
| | | | | | | | | | | | | | | | | |
| | | | | | | | | | | | | | | | | |
| | | | | | | | | | | | | | | | | |
On September 30, 2016, the Company sold the assets of an Industrial location in Vernon, California. The Company received $4,547 for this sale, and recognized a gain of $3,700 which is
F-20
EWT Holdings I Corp.
Notes to Audited Consolidated Financial Statements (Continued)
September 30, 2015 and September 30, 2016
(in thousands)
3. Acquisitions and Divestitures (Continued)
included as a gain on sale of assets within the Other operating income section of the Consolidated Statements of Operations and Comprehensive Loss. The major classes of assets and liabilities that were included in this sale were Receivables of $989, Property, plant and equipment of $717, Accrued expenses of $496 and Accounts Payable of $386.
4. Fair Value Measurements
As of September 30, 2015 and 2016, the fair values of cash and cash equivalents, accounts receivable and accounts payable approximate carrying values due to the short maturity of these items.
The Company measures the fair value of pension plan assets and liabilities, deferred compensation and plan assets and liabilities on a recurring basis pursuant to ASC Topic 820. ASC Topic 820 establishes a three-tier fair value hierarchy, which prioritizes the inputs used in measuring fair value. These tiers include:
Level 1: Quoted prices for identical instruments in active markets.
Level 2: Quoted prices for similar instruments in active markets; quoted prices for identical or similar instruments in markets that are not active; and model-derived valuations whose inputs are observable or whose significant value driver is observable.
Level 3: Unobservable inputs in which little or no market data is available, therefore requiring an entity to develop its own assumptions.
The following table presents the Company's financial assets and liabilities at fair value. The fair values related to the pension assets are determined using net asset value (NAV) as a practical expedient, or by information categorized in the fair value hierarchy level based on the inputs used to determine fair value.
F-21
EWT Holdings I Corp.
Notes to Audited Consolidated Financial Statements (Continued)
September 30, 2015 and September 30, 2016
(in thousands)
4. Fair Value Measurements (Continued)
| |
Net Asset Value | Quoted Market Prices in Active Markets (Level 1) |
Significant Other Observable Inputs (Level 2) |
Significant Unobservable Inputs (Level 3) |
|||||||||
|---|---|---|---|---|---|---|---|---|---|---|---|---|---|
As of September 30, 2015 |
|||||||||||||
Assets: |
|||||||||||||
Pension plan |
|||||||||||||
Cash |
$ | — | $ | 12,640 | $ | — | $ | — | |||||
Global securities |
8,003 | — | — | — | |||||||||
Global equity fund |
2,401 | — | — | — | |||||||||
Deferred compensation plan assets |
|||||||||||||
Trust Assets |
— | 7,529 | — | — | |||||||||
Insurance |
— | — | 9,924 | — | |||||||||
Liabilities: |
|||||||||||||
Pension plan |
— | — | (27,044 | ) | — | ||||||||
Deferred compensation plan liabilities |
— | — | (19,461 | ) | — | ||||||||
Long-term debt |
— | — | (567,240 | ) | — | ||||||||
As of September 30, 2016 |
|||||||||||||
Assets: |
|||||||||||||
Pension plan |
|||||||||||||
Cash |
$ | — | $ | 15,048 | $ | — | $ | — | |||||
Government Securities |
3,240 | — | — | — | |||||||||
Liability Driven Investment |
3,051 | — | — | — | |||||||||
Guernsey Unit Trust |
819 | — | — | — | |||||||||
Global Absolute Return |
2,028 | — | — | — | |||||||||
Deferred compensation plan assets |
|||||||||||||
Trust Assets |
2,145 | — | — | ||||||||||
Insurance |
— | 15,918 | — | ||||||||||
Liabilities: |
|||||||||||||
Pension plan |
— | — | (36,944 | ) | — | ||||||||
Deferred compensation plan liabilities |
— | — | (20,080 | ) | — | ||||||||
Long-term debt |
— | — | (771,560 | ) | — | ||||||||
Long-term debt is accounted for at book value.
The pension plan assets and liabilities and deferred compensation assets and liabilities are included in Other non-current assets and Other non-current liabilities at September 30, 2015 and 2016.
F-22
EWT Holdings I Corp.
Notes to Audited Consolidated Financial Statements (Continued)
September 30, 2015 and September 30, 2016
(in thousands)
5. Accounts Receivable
Accounts receivable are summarized as follows:
| |
September 30, 2015 | September 30, 2016 | |||||
|---|---|---|---|---|---|---|---|
Accounts Receivable |
$ | 162,063 | $ | 189,573 | |||
Allowance for Doubtful Accounts |
(1,572 | ) | (4,784 | ) | |||
| | | | | | | | |
|
$ | 160,491 | $ | 184,789 | |||
| | | | | | | | |
| | | | | | | | |
| | | | | | | | |
The movement in the allowance for doubtful accounts was as follows:
| |
Predecessor | |
Successor | ||||||||||||
|---|---|---|---|---|---|---|---|---|---|---|---|---|---|---|---|
| |
October 1, 2013 through January 15, 2014 |
|
January 16, 2014 through September 30, 2014 |
September 30, 2015 |
September 30, 2016 |
||||||||||
| |
|
||||||||||||||
| |
|
||||||||||||||
Balance at beginning of period |
$ | (6,882 | ) | $ | — | $ | (869 | ) | $ | (1,572 | ) | ||||
Charged to costs and expenses |
(485 | ) | (573 | ) | (779 | ) | (3,219 | ) | |||||||
Write-offs |
850 | — | 228 | 74 | |||||||||||
Foreign currenty and other |
121 | (296 | ) | (152 | ) | (67 | ) | ||||||||
| | | | | | | | | | | | | | | | |
Balance at end of period |
$ | (6,396 | ) | $ | (869 | ) | $ | (1,572 | ) | $ | (4,784 | ) | |||
| | | | | | | | | | | | | | | | |
| | | | | | | | | | | | | | | | |
| | | | | | | | | | | | | | | | |
6. Inventories
The major classes of inventory, net are as follows:
| |
September 30, 2015 | September 30, 2016 | |||||
|---|---|---|---|---|---|---|---|
Raw materials and supplies |
$ | 47,100 | $ | 60,363 | |||
Work in progress |
12,838 | 17,039 | |||||
Finished goods and products held for resale |
33,834 | 39,961 | |||||
Costs of unbilled projects |
5,861 | 5,825 | |||||
Advance payment from customers |
(1,919 | ) | (655 | ) | |||
Reserves for excess and obsolete |
(5,103 | ) | (10,141 | ) | |||
| | | | | | | | |
|
$ | 92,611 | $ | 112,392 | |||
| | | | | | | | |
| | | | | | | | |
| | | | | | | | |
F-23
EWT Holdings I Corp.
Notes to Audited Consolidated Financial Statements (Continued)
September 30, 2015 and September 30, 2016
(in thousands)
6. Inventories (Continued)
The following is the activity in our reserves for excess and obsolete inventory:
| |
Predecessor | |
Successor | ||||||||||||
|---|---|---|---|---|---|---|---|---|---|---|---|---|---|---|---|
| |
October 1, 2013 through January 15, 2014 |
|
January 16, 2014 through September 30, 2014 |
September 30, 2015 |
September 30, 2016 |
||||||||||
| |
|
||||||||||||||
| |
|
||||||||||||||
Balance at beginning of period |
$ | (16,394 | ) | $ | — | $ | (1,677 | ) | $ | (5,103 | ) | ||||
Additions charged to expense |
(339 | ) | (1,545 | ) | (3,888 | ) | (5,711 | ) | |||||||
Write-offs |
— | — | 1,149 | 739 | |||||||||||
Other |
— | (132 | ) | (687 | ) | (66 | ) | ||||||||
| | | | | | | | | | | | | | | | |
Balance at end of period |
$ | (16,733 | ) | $ | (1,677 | ) | $ | (5,103 | ) | $ | (10,141 | ) | |||
| | | | | | | | | | | | | | | | |
| | | | | | | | | | | | | | | | |
| | | | | | | | | | | | | | | | |
7. Property, Plant, and Equipment
Property, plant, and equipment consists of the following:
| |
September 30, 2015 | September 30, 2016 | |||||
|---|---|---|---|---|---|---|---|
Machinery and equipment |
$ | 216,282 | $ | 264,302 | |||
Land and buildings |
79,637 | 79,423 | |||||
Construction in process |
20,664 | 27,388 | |||||
| | | | | | | | |
|
316,583 | 371,113 | |||||
Less: accumulated depreciation |
(80,755 | ) | (114,348 | ) | |||
| | | | | | | | |
|
$ | 235,828 | $ | 256,765 | |||
| | | | | | | | |
| | | | | | | | |
| | | | | | | | |
Depreciation expense, including depreciation expense for capital leases, was $14,934 in the period from October 1, 2013 to January 15, 2014 (Predecessor). Depreciation expense was $41,722 in the period January 16, 2014 to September 30, 2014 (Successor) and was $43,457 and $51,104 for the fiscal years ended September 30, 2015 and 2016, respectively. Maintenance and repair expense was $4,932 in the period from October 1, 2013 to January 15, 2014 (Predecessor). Maintenance and repair expense was $14,970 in the period January 16, 2014 to September 30, 2014 (Successor) and was $20,761 and $22,504 for the fiscal years ended September 30, 2015 and 2016, respectively.
F-24
EWT Holdings I Corp.
Notes to Audited Consolidated Financial Statements (Continued)
September 30, 2015 and September 30, 2016
(in thousands)
8. Goodwill
Changes in the carrying amount of goodwill are as follows:
| |
Predecessor | |
Successor | ||||||||||||
|---|---|---|---|---|---|---|---|---|---|---|---|---|---|---|---|
| |
October 1, 2013 through January 15, 2014 |
|
January 16, 2014 through September 30, 2014 |
Year ended September 30, 2015 |
Year ended September 30, 2016 |
||||||||||
| |
|
||||||||||||||
| |
|
||||||||||||||
Goodwill |
$ | 321,203 | $ | — | $ | 121,417 | $ | 113,583 | |||||||
Accumulated Impairment Loss |
(50,021 | ) | — | — | — | ||||||||||
| | | | | | | | | | | | | | | | |
Balance at beginning of period |
271,182 | — | 121,417 | 113,583 | |||||||||||
Business combinations |
— | 122,778 | — | 153,890 | |||||||||||
Measurement period adjustment |
— | — | (2,114 | ) | (247 | ) | |||||||||
Foreign currency translation |
(69 | ) | (1,361 | ) | (5,720 | ) | 417 | ||||||||
| | | | | | | | | | | | | | | | |
Balance at end of period |
$ | 271,113 | $ | 121,417 | $ | 113,583 | $ | 267,643 | |||||||
| | | | | | | | | | | | | | | | |
| | | | | | | | | | | | | | | | |
| | | | | | | | | | | | | | | | |
The adjustment for the year ended September 30, 2015 is related to the finalization of the valuation of the United Kingdom (UK) pension plan assets and liabilities, including consideration of deferred taxes in connection with the AEA acquisition.
As of September 30, 2015 and 2016, $36,350 and $129,083, respectively, of goodwill is deductible for tax purposes.
The Company reviewed the recoverability of the carrying value of goodwill at its reporting units. As the fair value of the Company's reporting units was determined to be in excess of the carrying values at July 1, 2015 and 2016 no further analysis was performed.
9. Other Intangible Assets
Intangible assets consist of the following:
| |
|
September 30, 2015 | ||||||||||
|---|---|---|---|---|---|---|---|---|---|---|---|---|
| |
Estimated Life (years) |
Carrying Amount |
Accumulated Amortization |
Net | ||||||||
Amortizing intangible assets |
||||||||||||
Customer related |
5 - 16 | $ | 126,670 | $ | (13,937 | ) | $ | 112,733 | ||||
Proprietary technology |
10 | 25,813 | (4,410 | ) | 21,403 | |||||||
Trademark |
10 | 7,940 | (1,357 | ) | 6,583 | |||||||
Backlog |
1 | 80,863 | (80,863 | ) | — | |||||||
Licenses |
3 | 9,524 | (5,081 | ) | 4,443 | |||||||
Other |
4 | 1,366 | (598 | ) | 768 | |||||||
| | | | | | | | | | | | | |
Total amortizing intangible assets |
252,176 | (106,246 | ) | 145,930 | ||||||||
Indefinite-lived intangible assets |
34,207 | — | 34,207 | |||||||||
| | | | | | | | | | | | | |
Total intangible assets |
$ | 286,383 | $ | (106,246 | ) | $ | 180,137 | |||||
| | | | | | | | | | | | | |
| | | | | | | | | | | | | |
| | | | | | | | | | | | | |
F-25
EWT Holdings I Corp.
Notes to Audited Consolidated Financial Statements (Continued)
September 30, 2015 and September 30, 2016
(in thousands)
9. Other Intangible Assets (Continued)
| |
|
September 30, 2016 | ||||||||||
|---|---|---|---|---|---|---|---|---|---|---|---|---|
| |
Estimated Life (years) |
Carrying Amount |
Accumulated Amortization |
Net | ||||||||
Amortizing intangible assets |
||||||||||||
Customer related |
5 - 26 | $ | 264,415 | $ | (24,570 | ) | $ | 239,845 | ||||
Proprietary technology |
10 | 36,827 | (7,453 | ) | 29,374 | |||||||
Trademark |
10 - 15 | 20,345 | (2,517 | ) | 17,828 | |||||||
Backlog |
1 | 80,084 | (80,084 | ) | — | |||||||
Licenses |
3 | 9,524 | (8,002 | ) | 1,522 | |||||||
Other |
4 | 1,604 | (902 | ) | 702 | |||||||
| | | | | | | | | | | | | |
Total amortizing intangible assets |
412,799 | (123,528 | ) | 289,271 | ||||||||
Indefinite-lived intangible assets |
34,207 | — | 34,207 | |||||||||
| | | | | | | | | | | | | |
Total intangible assets |
$ | 447,006 | $ | (123,528 | ) | $ | 323,478 | |||||
| | | | | | | | | | | | | |
| | | | | | | | | | | | | |
| | | | | | | | | | | | | |
The Company's indefinite-lived intangible asset relate to Federal hazardous waste treatment management permits obtained for locations operated by the Industrial segment. The permits are considered perpetually renewable.
The Company performs an indefinite-lived intangible asset impairment analysis on an annual basis during the fourth quarter of the fiscal year and whenever events or changes in circumstances indicate that the carrying value may not be recoverable. The Company assessed the carrying value of the permits at the Industrial segment using a qualitative analysis outlined in ASU No. 2012-02 to determine whether the existence of events or circumstances would lead to the conclusion that it is more likely than not that the fair values of the permits are less than the carrying amounts. Events and circumstances considered in this review included macroeconomic conditions, new competition, financial performance of the businesses which utilize the permits and other financial and non-financial events. Based on these factors, the Company concluded the fair value of the permits were not more likely than not less than the carrying amounts.
For the amortizing intangible assets, the remaining weighted-average amortization period for aggregate net intangible assets at September 30, 2016 is 13.6 years. The weighted average amortization period for Customer-related intangibles, Proprietary technology, Trademarks, Licenses and Other was 18 years, 9 years, 12 years, 1 year and 2 years, respectively.
Intangible asset amortization was $5,003 for the period from October 1, 2013 to January 15, 2014 (Predecessor) and $98,211 in the period from January 16, 2014 to September 30, 2014 (Successor).
F-26
EWT Holdings I Corp.
Notes to Audited Consolidated Financial Statements (Continued)
September 30, 2015 and September 30, 2016
(in thousands)
9. Other Intangible Assets (Continued)
Intangible asset amortization was $14,682 and $18,185 for the Company for the fiscal years ended September 30, 2015 and 2016, respectively. The estimated future amortization expense is as follows:
| |
Amount | |||
|---|---|---|---|---|
Fiscal Year |
||||
2017 |
$ | 20,261 | ||
2018 |
19,106 | |||
2019 |
18,859 | |||
2020 |
18,534 | |||
2021 |
18,413 | |||
Thereafter |
228,305 | |||
| | | | | |
Total |
$ | 323,478 | ||
| | | | | |
| | | | | |
| | | | | |
10. Debt
Long-term debt consists of the following:
| |
September 30, 2015 |
September 30, 2016 |
|||||
|---|---|---|---|---|---|---|---|
First Lien Term Facility, due January 15, 2021 |
$ | 496,163 | $ | 491,113 | |||
Second Lien Term Facility, due January 15, 2022 |
75,000 | 75,000 | |||||
Incremental First Lien Facility, due January 15, 2021 |
184,075 | ||||||
Revolving Credit Facility, due January 15, 2019 |
18,000 | ||||||
Notes Payable, due June 30, 2018 to July 31, 2023 |
11,223 | ||||||
| | | | | | | | |
Total debt |
571,163 | 779,411 | |||||
Less unamortized discount and lender fees |
(19,081 |
) |
(21,255 |
) |
|||
| | | | | | | | |
Total net debt |
552,082 | 758,156 | |||||
Less current portion |
(5,050 |
) |
(30,024 |
) |
|||
| | | | | | | | |
Total long-term debt |
$ | 547,032 | $ | 728,132 | |||
| | | | | | | | |
| | | | | | | | |
| | | | | | | | |
Term Facilities and Revolving Credit Facility
On January 15, 2014, EWT Holdings III Corp. entered into First and Second Lien Term Loan Agreements (the "Term Loan Agreements") among the Company, the lenders party thereto and Credit Suisse AG as Administrative Agent and Collateral Agent. The Term Loan Agreements provided seven-year term loan facilities, consisting of the First Lien Term Loan and Second Lien Term Loan in aggregate principal amounts of $505,000 and $75,000, respectively. The First Lien Term Loan Agreement also made available to the Company a $75,000 revolving credit facility ("The Revolver"), which contains a Letter of Credit sub-facility up to $35,000. The First and Second Lien borrowings were issued at a discount to face value of .5% aggregating $2,900 and net of lender arrangement fees aggregating $16,700. Additional capitalized financing fees, including lender fees paid for the Revolving
F-27
EWT Holdings I Corp.
Notes to Audited Consolidated Financial Statements (Continued)
September 30, 2015 and September 30, 2016
(in thousands)
10. Debt (Continued)
Credit Facility placement, aggregated $5,483. Both of these amounts are included as a contra liability to debt of $19,081 and $15,556, net of amortization, at September 30, 2015 and 2016, respectively.
The First Lien Term Loan bears interest based on a variable rate subject to a 1% floor + 3.75% spread. As of September 30, 2016, the applicable First Lien Term Loan interest rate was 4.75%. First Lien principal and interest is payable in quarterly installments, with quarterly principal reductions of $1,263, and the balance due at maturity. The Second Lien Term Loan bears interest at 8.5% payable quarterly with the principal balance due at maturity.
In April, 2016 the Company issued an Incremental First Lien Term Loan (the "Incremental First Lien"), in an aggregate principal amount of $185,000, with a 1% discount. The Company also incurred $6,296 of financing fees related to this debt, $1,850 related to the 1% discount and $4,446 related to additional capitalized financing fees. Both of these amounts are included as a contra liability to debt and total $5,689 net of amortization at September 30, 2016.
The proceeds of the Incremental First Lien facility were used to finance the acquisition of Neptune-Benson. The Incremental First Lien bears interest based on a variable rate subject to a 1% floor + 4.5% spread, with quarterly interest payments and principal reductions of $462.5 through maturity. As of September 30, 2016, the applicable Incremental First Lien interest rate was 5.5%. The incremental Term Loan is coterminous with the existing First and Second Lien Term Loan facilities.
As of September 30, 2015 and 2016, the Company had outstanding revolver borrowings of $0 and $18,000, respectively with an unused portion of $75,000 and $57,000, respectively. Borrowings under the facility at September 30, 2015, would have incurred interest at a rate of 3.58% (LIBOR plus 325 basis points). The weighted average interest rate on the outstanding borrowing as of September 30, 2016 was 4.66%. Borrowings under the Revolving Credit Facility bear interest at variable rates plus a margin ranging from 225 to 325 basis points, dependent on the Company's leverage ratio and Variable Rate selected.
The Company has borrowing availability under the Revolving Credit Facility of $75,000, reduced for outstanding letter of credit guarantees. Such letter of credit guarantees are subject to a $35,000 sublimit within the Revolving Credit Facility. The Company's outstanding letter of credit guarantees under this agreement aggregated approximately $20,238 and $9,742 at September 30, 2015 and 2016, respectively. The Company has issued additional letters of credit of $8,386 under a separate arrangement.
The Term Loan Agreements contain limitations on incremental borrowings, are subject to leverage ratios and allow for prepayment. Under certain circumstances beginning with fiscal 2015 results of operations, the Company may be required to remit excess cash flows as defined based upon exceeding certain leverage ratios. The Company did not exceed such ratios during fiscal 2016, does not anticipate exceeding such ratios during 2017, and therefore does not anticipate any additional repayments during 2017.
F-28
EWT Holdings I Corp.
Notes to Audited Consolidated Financial Statements (Continued)
September 30, 2015 and September 30, 2016
(in thousands)
10. Debt (Continued)
Notes Payable
As of September 30, 2016, the Company had notes payable in an aggregate outstanding amount of $11,223, with interest rates ranging from 6.26% to 7.39%, and due dates ranging from June 30, 2018 to July 31, 2023. These notes are related to certain equipment related contracts and are secured by the underlying equipment and assignment of the related contracts.
Repayment Schedule
Aggregate maturities of all long-term debt, including current portion of long-term debt and excluding capital lease obligations as of September 30, 2016, are presented below:
Fiscal Year |
||||
2017 |
30,024 | |||
2018 |
10,893 | |||
2019 |
7,421 | |||
2020 |
7,320 | |||
2021 |
723,035 | |||
Thereafter |
718 | |||
| | | | | |
Total |
779,411 | |||
| | | | | |
| | | | | |
| | | | | |
11. Product Warranties
The Company accrues warranty obligations associated with certain products as revenue is recognized. Provisions for the warranty obligations are based upon historical experience of costs incurred for such obligations, adjusted for site-specific risk factors and as necessary, for current conditions and factors. There are significant uncertainties and judgments involved in estimating warranty obligations, including changing product designs, differences in customer installation processes and future claims experience which may vary from historical claims experience.
A reconciliation of the activity related to the accrued warranty, including both the current and long-term portions, is as follows:
| |
|
|
|
|
|
||||||||||
|---|---|---|---|---|---|---|---|---|---|---|---|---|---|---|---|
| |
Predecessor |
|
Successor | ||||||||||||
| |
|
||||||||||||||
| |
October 1, 2013 through January 15, 2014 |
|
October 16, 2014 through September 30, 2014 |
Year ended September 30, 2015 |
Year ended September 30, 2016 |
||||||||||
| |
|
||||||||||||||
| |
|
||||||||||||||
Balance at beginning of the period |
$ | 44,861 | $ | — | $ | 38,947 | $ | 31,758 | |||||||
Business combination recognition |
— | 45,187 | — | — | |||||||||||
Warranty provision for sales |
5,354 | 6,376 | 6,646 | 8,994 | |||||||||||
Settlement of warranty claims |
(4,764 | ) | (13,119 | ) | (12,199 | ) | (15,785 | ) | |||||||
Foreign currency and other |
(264 | ) | 503 | (1,636 | ) | (1,658 | ) | ||||||||
| | | | | | | | | | | | | | | | |
Balance at end of the period |
$ | 45,187 | $ | 38,947 | $ | 31,758 | $ | 23,309 | |||||||
| | | | | | | | | | | | | | | | |
| | | | | | | | | | | | | | | | |
| | | | | | | | | | | | | | | | |
F-29
EWT Holdings I Corp.
Notes to Audited Consolidated Financial Statements (Continued)
September 30, 2015 and September 30, 2016
(in thousands)
11. Product Warranties (Continued)
The decline in accrued warranty over the periods presented is attributable to improved product quality and better project execution, as well as the expiration of warranty periods for certain specific exposures related to discontinued products.
12. Restructuring and Related Charges
To better align its resources with its growth strategies and reduce the cost structure, the Company commits to restructuring plans as necessary. The Company initiated a Voluntary Separation Plan (VSP) during the year ended September 30, 2016. The VSP plan includes severance payments to employees as a result of streamlining business operations for efficiency, elimination of redundancies, and reorganizing business processes. The table below sets forth the amounts accrued for the restructuring components and related activity:
| |
|
|
|
|
|
||||||||||
|---|---|---|---|---|---|---|---|---|---|---|---|---|---|---|---|
| |
Predecessor |
|
Successor | ||||||||||||
| |
|
||||||||||||||
| |
October 1, 2013 through January 15, 2014 |
|
January 16, 2014 through September 30, 2014 |
Year ended September 30, 2015 |
Year ended September 30, 2016 |
||||||||||
| |
|
||||||||||||||
| |
|
||||||||||||||
Balance at beginning of the period |
$ | 1,536 | $ | — | $ | 3,640 | $ | 1,814 | |||||||
Business combination recognition |
— | 677 | — | — | |||||||||||
Restructuring charges |
137 | 4,422 | 6,526 | 29,959 | |||||||||||
Write off charge and other non-cash activity |
(18 | ) | — | (1,616 | ) | (166 | ) | ||||||||
Cash payments |
(968 | ) | (1,426 | ) | (6,606 | ) | (18,403 | ) | |||||||
Other adjustments |
(10 | ) | (33 | ) | (130 | ) | 13 | ||||||||
| | | | | | | | | | | | | | | | |
Balance at end of the period |
$ | 677 | $ | 3,640 | $ | 1,814 | $ | 13,217 | |||||||
| | | | | | | | | | | | | | | | |
| | | | | | | | | | | | | | | | |
| | | | | | | | | | | | | | | | |
The balances for accrued restructuring liabilities at September 30, 2015 and 2016 are recorded in Accrued expenses and other liabilities. The amount of $677 reflected above as of January 15, 2014 represents the remaining Predecessor restructuring liability assumed by the Company at Acquisition. Restructuring charges primarily represent severance charges. For the period from January 16, 2014 to September 30, 2014, $1,851 are included in Cost of product sales and services, $1,900 are included in General and administrative expenses and $671 are included in Marketing and selling. For the year ending September 30, 2015, $5,874 are included in Cost of product sales and services, $279 are included in General and administrative expenses, $14 are included in Marketing and selling expenses and $359 are included in Other operating expense. For the year ended September 30, 2016, $14,611 are included in Cost of product sales and services, $8,045 are included in General and administrative expenses, $1,712 are included in Research and development, and $5,591 are included in Marketing and selling. The Company expects to pay out the remaining amounts accrued as of September 30, 2016 during the year ending September 30, 2017, in addition to incurring another $10,309 during that same time period related to the VSP. The Company continues to evaluate restructuring activities that may result in additional charges in the future.
F-30
EWT Holdings I Corp.
Notes to Audited Consolidated Financial Statements (Continued)
September 30, 2015 and September 30, 2016
(in thousands)
13. Employee Benefit Plans
The Company maintains multiple employee benefit plans.
The Predecessor's eligible U.S and non-U.S. employees participated in Siemens' defined pension plans and the plan's aggregate assets and liabilities were combined with those related to other Siemens' businesses. Pension expenses were determined on a multiemployer plan basis and were included in Other operating expense in the Consolidated Statements of Operations and Comprehensive Loss. Retirement plan expenses allocated to the Predecessor amounted to $1,123 for the period from October 1, 2013 to January 15, 2014.
Certain of the Company's employees in the UK were participants in a Siemen's defined benefit plan established for employees of a UK-based operation acquired by Siemens in 2004. The plan was frozen with respect to future service credits for active employees, however the benefit formula recognized future compensation increases. The Company agreed to establish a replacement defined benefit plan, with the assets of the Siemens scheme transferring to the new scheme on April 1, 2015. Assets transferred amounted to $10,692 offset by $8,723 of plan liabilities. Siemens has also agreed to retain the pension obligation for inactive vested participants.
The Company's employees in Germany also participate in a defined benefit plan. Assets equaling the plan's accumulated benefit obligation were transferred to a German defined benefit plan sponsored by the Company upon the acquisition of EWT from Siemens. The German entity also sponsors a defined benefit plan for a small group of employees located in France.
F-31
EWT Holdings I Corp.
Notes to Audited Consolidated Financial Statements (Continued)
September 30, 2015 and September 30, 2016
(in thousands)
13. Employee Benefit Plans (Continued)
The changes in projected benefit obligations, plan assets and the funded status of the defined benefit plans as of and for the fiscal year ending September 30, 2015 and 2016, respectively, are as follows:
| |
UK & German Plans |
UK & German Plans |
|||||
|---|---|---|---|---|---|---|---|
| |
2015 | 2016 | |||||
Change in projected benefit obligation |
|||||||
Projected benefit obligation at prior year measurement date |
$ | 19,930 | $ | 27,044 | |||
Service cost |
837 | 829 | |||||
Interest cost |
589 | 728 | |||||
Transfer of benefit obligations from predecessor |
8,723 | — | |||||
Actuarial (gains) losses |
(1,118 | ) | 9,723 | ||||
Benefits paid from company assets |
(54 | ) | (16 | ) | |||
Foreign currency exchange impact |
(1,863 | ) | (1,364 | ) | |||
| | | | | | | | |
Projected benefit obligation at measurement date |
27,044 | 36,944 | |||||
Change in plan assets |
|||||||
Fair value of assets at prior year measurement date |
13,837 | 23,044 | |||||
Actual return on plan assets |
(485 | ) | 2,437 | ||||
Transfer of assets by predecessor |
10,692 | — | |||||
Benefits paid |
— | (13 | ) | ||||
Employer contribution |
250 | 205 | |||||
Foreign currency exchange impact |
(1,250 | ) | (1,487 | ) | |||
| | | | | | | | |
Fair value of assets at measurement date |
23,044 | 24,186 | |||||
| | | | | | | | |
Funded status and amount recognized in assets and liabilities |
$ | (4,000 | ) | $ | (12,758 | ) | |
| | | | | | | | |
| | | | | | | | |
| | | | | | | | |
Amount recognized in assets and liabilities |
|||||||
Other non-current assets |
$ | 2,414 | $ | 1,794 | |||
Other non-current liabilities |
$ | (6,414 | ) | $ | (14,552 | ) | |
Amount recognized in accumulated other comprehensive loss, before taxes |
|||||||
Actuarial loss |
$ | 2,275 | $ | 9,926 | |||
F-32
EWT Holdings I Corp.
Notes to Audited Consolidated Financial Statements (Continued)
September 30, 2015 and September 30, 2016
(in thousands)
13. Employee Benefit Plans (Continued)
The following table provides summary information for the German plan where the projected benefit obligation and accumulated benefit obligation are in excess of plan assets:
| |
2015 | 2016 | |||||
|---|---|---|---|---|---|---|---|
Projected benefit obligation |
$ | 18,975 | $ | 27,361 | |||
Accumulated benefit obligation |
16,625 | 24,117 | |||||
Fair value of plan assets |
12,561 | 12,809 | |||||
The weighted average assumptions in the following table represent the rates used to develop the actuarial present value of the projected benefit obligation for the year indicated as well as net periodic pension cost for the following year. The discount rate is based on settling the obligation with high grade, high yield corporate bonds, and the rate of compensation increase is based upon actual experience. The expected return on assets is based on historical performance as well as expected future rates of return on plan assets considering the current investment portfolio mix and the long-term investment strategy.
| |
2015 | 2016 | ||
|---|---|---|---|---|
Discount rate |
2.50% - 4.15% | 1.20% - 2.60% | ||
Expected long-term rate of return on plan assets |
1.25% - 3.57% | 1.25% - 2.63% | ||
Salary scale |
2.25% - 4.80% | 2.25% - 4.75% | ||
Pension increases |
1.00% - 3.20% | 1.00% - 3.15% |
The Plan trustees for the UK and German pension plans have established investment policies and strategies. In 2016 the UK Pension Committee established and implemented a liability driven investment approach to take advantage of, and seeking to protect, its well-funded status. The German pension fund committee has determined a direction on an investment manager who will provide advice on pension asset allocation as well as implement investment solutions.
The company elected to early adopt ASU 2015-07, Disclosures for investments in certain entities that calculate net asset value per share (or its equivalent), during the year ended September 30, 2016 and applied this retrospectively. ASU 2015-07 permits a reporting entity to measure the fair value of certain investments it owns using the net asset value (NAV) per share of the investment, or the 'practical expedient'. The purpose of this update is to develop a reporting methodology that is consistent across all reporting entities. See footnote four, Fair Value, for disclosure of the plan assets under ASU 2015-07.
Through a trust arrangement, the German plan assets are held in cash at a German bank.
The actual overall asset allocation for the UK pension plan as compared to the investment policy goals as of September 30, 2016 was as follows:
| |
2016 Target | 2016 Actual | |||||
|---|---|---|---|---|---|---|---|
Asset Category |
|||||||
Equity |
23.5 | % | 25 | % | |||
Index-linked gilts |
76.5 | % | 55 | % | |||
Cash |
0 | % | 20 | % | |||
F-33
EWT Holdings I Corp.
Notes to Audited Consolidated Financial Statements (Continued)
September 30, 2015 and September 30, 2016
(in thousands)
13. Employee Benefit Plans (Continued)
Pension expense for the German and UK plans were as follows:
| |
|
Year ended September 30, 2015 |
Year ended September 30, 2016 |
|||||||
|---|---|---|---|---|---|---|---|---|---|---|
| |
January 16, 2014 through September 30, 2014 |
|||||||||
| |
UK & German Plans |
UK & German Plans |
||||||||
| |
German Plan | |||||||||
Service cost |
$ | 619 | $ | 837 | $ | 829 | ||||
Interest cost |
362 | 589 | 728 | |||||||
Expected return on plan assets |
(176 | ) | (407 | ) | (481 | ) | ||||
Amortization of actuarial losses |
— | 137 | 128 | |||||||
| | | | | | | | | | | |
Pension expense for defined benefit plans |
$ | 805 | $ | 1,156 | $ | 1,204 | ||||
| | | | | | | | | | | |
| | | | | | | | | | | |
| | | | | | | | | | | |
Benefits expected to be paid to participants of the plans are:
| |
UK & German Plans |
|||
|---|---|---|---|---|
Fiscal Year |
||||
2017 |
$ | 374 | ||
2018 |
115 | |||
2019 |
156 | |||
2020 |
262 | |||
2021 |
305 | |||
Five years thereafter |
3,451 | |||
The Company maintains a defined contribution 401(k) plan, which covers all U.S.-based employees who meet certain age and length of service requirements. Plan participants can elect to defer pre-tax compensation through payroll deductions. These deferrals are regulated under Section 401(k) of the Internal Revenue Code. The Company matches 100% of eligible participants' deferrals that do not exceed 6% of their pay (subject to limitations imposed by the Internal Revenue Code). The Company's matching contributions were $7,383 for the period January 16, 2014 through September 30, 2014 and $11,141 and $12,382 for the years ending September 30, 2015 and 2016, respectively.
The Predecessor also provided retirement benefits to eligible U.S.-based employees through Siemens' defined contribution retirement plan that included a 401(k) plan and certain non-qualified deferred compensation plans. The defined contribution retirement plan had matching and savings elements. Matching contributions were based on employees' savings with no other funding requirements and were $3,771 for the period from October 1, 2013 to January 15, 2014. The participant's retirement accounts were rolled over into a defined contribution plan sponsored by the Company upon acquisition. Benefits were fully vested upon transfer.
The majority of the UK employees participated in a defined contribution plan maintained by the Company. Contributions made to the Company's plan were $3,771 for the period from October 1, 2013 to January 15, 2014 and were $707 and $821 for the years ending September 30, 2015 and 2016, respectively.
F-34
EWT Holdings I Corp.
Notes to Audited Consolidated Financial Statements (Continued)
September 30, 2015 and September 30, 2016
(in thousands)
13. Employee Benefit Plans (Continued)
Deferred Compensation
On April 1, 2014, the Company adopted a non-qualified deferred compensation plan for certain highly compensated employees. The Plan matches on a dollar-for-dollar basis, up to the first 6% of a participants' pay. The Company's obligation under the plan represents an unsecured promise to pay benefits in the future. In the event of bankruptcy or insolvency of the Company, assets of the plan would be available to satisfy the claims of general creditors. To increase the security of the participants' deferred compensation plan benefits, the Company has established and funded a grantor trust (known as a rabbi trust). The rabbi trust is specifically designed so that assets are available to pay plan benefits to participants in the event the Company is unwilling or unable to pay the plan benefits for any reason other than bankruptcy or insolvency. As a result, the Company is prevented from withdrawing or accessing assets for corporate needs. Plan participants choose to receive a return on their account balances equal to the return on the various investment options. The rabbi trust assets are primarily invested in mutual funds and insurance contracts of which the rabbi trust is the owner and beneficiary.
Health Benefit Plan
The Company maintains a qualified employee health benefit plan in the U.S. and is self-funded by the Company with respect to claims up to a certain amount. The plan requires contributions from eligible employees and their dependents.
14. Income Taxes
The Predecessor U.S. and non-U.S. operations were part of Siemens and were included in certain of Siemens' consolidated income tax returns. The tax provisions of the Predecessor were prepared on a stand-alone basis, as if the Predecessor was a separate group of companies under common ownership. The Predecessor assumes that, in the event a tax attribute was utilized by Siemens on a consolidated or combined return, the Predecessor has realized the benefits of the tax attribute and records the utilization as a current benefit and a transfer to Siemens. The operations were combined as if the Predecessor was filing on a consolidated basis for federal and state income tax purposes. The non-U.S. tax provision was determined on a stand-alone basis for each non-U.S. affiliate.
As of September 30, 2014, 2015, and 2016, undistributed earnings of non-U.S. affiliates were approximately $0, $0 and $2,170, respectively, which are considered permanently invested with no deferred taxes provided. Because the Company does not have any plans to repatriate the funds, the Company cannot determine the impact of local taxes, withholding taxes and foreign tax credits associated with the future repatriation of such earnings and, therefore, cannot reasonably estimate the associated tax liability.
F-35
EWT Holdings I Corp.
Notes to Audited Consolidated Financial Statements (Continued)
September 30, 2015 and September 30, 2016
(in thousands)
14. Income Taxes (Continued)
For financial reporting purposes, loss before income taxes includes the following components:
| |
Predecessor |
|
Successor | ||||||||||||
|---|---|---|---|---|---|---|---|---|---|---|---|---|---|---|---|
| |
October 1, 2013 through January 15, 2014 |
|
January 16, 2014 through September 30, 2014 |
Year ended September 30, 2015 |
Year ended September 30, 2016 |
||||||||||
| |
|
||||||||||||||
| |
|
||||||||||||||
United States |
$ | (2,157 | ) | $ | (99,882 | ) | $ | (33,360 | ) | $ | (1,941 | ) | |||
Rest of World |
(1,318 | ) | (46,340 | ) | (4,786 | ) | (3,422 | ) | |||||||
| | | | | | | | | | | | | | | | |
Total |
$ | (3,475 | ) | $ | (146,222 | ) | $ | (38,146 | ) | $ | (5,363 | ) | |||
| | | | | | | | | | | | | | | | |
| | | | | | | | | | | | | | | | |
| | | | | | | | | | | | | | | | |
The components of income tax expense (benefit) were as follows:
| |
Predecessor |
|
Successor | ||||||||||||
|---|---|---|---|---|---|---|---|---|---|---|---|---|---|---|---|
| |
October 1, 2013 through January 15, 2014 |
|
January 16, 2014 through September 30, 2014 |
Year ended September 30, 2015 |
Year ended September 30, 2016 |
||||||||||
| |
|
||||||||||||||
| |
|
||||||||||||||
Current: |
|||||||||||||||
Federal |
$ | 967 | $ | — | $ | — | $ | — | |||||||
State |
177 | — | (131 | ) | 678 | ||||||||||
Rest of World |
293 | 3,951 | 2,782 | 2,143 | |||||||||||
| | | | | | | | | | | | | | | | |
|
1,437 | 3,951 | 2,651 | 2,821 | |||||||||||
Deferred: |
|||||||||||||||
Federal |
(1,029 | ) | (31,744 | ) | 34,789 | (18,638 | ) | ||||||||
State |
(188 | ) | (5,789 | ) | 6,243 | (1,402 | ) | ||||||||
Rest of World |
(1,393 | ) | (14,883 | ) | 4,222 | (1,175 | ) | ||||||||
| | | | | | | | | | | | | | | | |
|
(2,610 | ) | (52,416 | ) | 45,254 | (21,215 | ) | ||||||||
| | | | | | | | | | | | | | | | |
Total tax (benefit) expense |
$ | (1,173 | ) | $ | (48,465 | ) | $ | 47,905 | $ | (18,394 | ) | ||||
| | | | | | | | | | | | | | | | |
| | | | | | | | | | | | | | | | |
| | | | | | | | | | | | | | | | |
F-36
EWT Holdings I Corp.
Notes to Audited Consolidated Financial Statements (Continued)
September 30, 2015 and September 30, 2016
(in thousands)
14. Income Taxes (Continued)
A reconciliation of income tax expense and the amount computed by applying the statutory federal income tax rate of 35% to income from operations before income taxes was as follows:
| |
Predecessor |
|
Successor | ||||||||||||
|---|---|---|---|---|---|---|---|---|---|---|---|---|---|---|---|
| |
October 1, 2013 through January 15, 2014 |
|
January 16, 2014 through September 30, 2014 |
Year ended September 30, 2015 |
Year ended September 30, 2016 |
||||||||||
| |
|
||||||||||||||
| |
|
||||||||||||||
Income tax benefit at the federal statutory rate |
$ | (1,213 | ) | $ | (51,280 | ) | $ | (13,058 | ) | $ | (1,877 | ) | |||
State and local income taxes, net of federal tax benefit |
24 | (3,763 | ) | (112 | ) | 791 | |||||||||
Foreign tax rate differential (based on local statutory rates ranging from 17% to 30%) |
337 | 5,316 | 399 | (272 | ) | ||||||||||
Contingent liabilities—warranty |
— | — | (1,651 | ) | (236 | ) | |||||||||
Contingent liabilities—long-term disability |
— | — | (670 | ) | (189 | ) | |||||||||
Transaction expense |
— | 834 | — | — | |||||||||||
Interest expense |
— | — | — | 1,141 | |||||||||||
Meals and entertainment expense |
140 | 419 | 518 | 601 | |||||||||||
Other permanent differences |
— | — | — | (872 | ) | ||||||||||
Provision to return adjustments |
— | — | (1,112 | ) | (168 | ) | |||||||||
Valuation allowances |
— | — | 63,470 | (17,714 | ) | ||||||||||
Other |
(461 | ) | 9 | 121 | 401 | ||||||||||
| | | | | | | | | | | | | | | | |
Total |
$ | (1,173 | ) | $ | (48,465 | ) | $ | 47,905 | $ | (18,394 | ) | ||||
| | | | | | | | | | | | | | | | |
| | | | | | | | | | | | | | | | |
| | | | | | | | | | | | | | | | |
F-37
EWT Holdings I Corp.
Notes to Audited Consolidated Financial Statements (Continued)
September 30, 2015 and September 30, 2016
(in thousands)
14. Income Taxes (Continued)
Significant components of deferred tax assets and liabilities were as follows:
| |
September 30, 2015 |
September 30, 2016 |
|||||
|---|---|---|---|---|---|---|---|
Receivable allowances |
$ | 451 | $ | 759 | |||
Reserves and accruals |
14,670 | 28,457 | |||||
Inventory valuation and other assets |
10,091 | 10,018 | |||||
Investment in partnership |
1,250 | 916 | |||||
Fixed assets |
1,841 | — | |||||
Intangibles |
14,738 | — | |||||
Other |
1,331 | 1,027 | |||||
Net operating loss carryforwards |
16,374 | 29,158 | |||||
| | | | | | | | |
Total deferred tax assets |
60,746 | 70,335 | |||||
Goodwill |
1,046 |
3,476 |
|||||
Fixed assets |
11,963 | ||||||
Intangibles |
15,613 | ||||||
| | | | | | | | |
Total deferred tax liabilities |
1,046 | 31,052 | |||||
| | | | | | | | |
Net deferred tax assets |
$ | 59,700 | $ | 39,283 | |||
Valuation allowance against net deferred tax assets |
(63,268 |
) |
(47,846 |
) |
|||
| | | | | | | | |
Net deferred tax liability |
$ | (3,568 | ) | $ | (8,563 | ) | |
| | | | | | | | |
| | | | | | | | |
| | | | | | | | |
We have income tax NOL carryforwards related to our operations of approximately $62,700 Federal, $25,900 state, and $23,900 of foreign income tax NOL carryforwards related to our operations. Approximately $93,100 will expire between 2019 and 2036 and $19,300 which has an indefinite carryforward period. We have recorded a deferred tax asset of $29,200 which has a full valuation allowance.
As required by U.S. GAAP, management assesses the available positive and negative evidence to estimate whether sufficient taxable income will be generated to permit use of the existing deferred tax assets. A significant piece of objective negative evidence evaluated was the cumulative loss incurred over the three-year period ended September 30, 2016. Such objective evidence limits the ability to consider other subjective evidence, such as our projections for future growth.
For the year ended September 30, 2014, the Company did not have a valuation allowance. In 2015, after considering all available evidence, both positive and negative, management determined that a full valuation allowance was necessary in certain jurisdictions as of September 30, 2015. Positive evidence included management's projections of scheduled growth as well as scheduling the reversal of timing differences to generate future taxable income. Negative evidence evaluated was the cumulative loss incurred over the three years ended September 30, 2015 in the jurisdictions where the Company operates. In 2016, the deferred tax assets subject to a valuation allowance decreased by $15,422. The reduction in the valuation allowance during the year ended September 30, 2016 was attributable to the
F-38
EWT Holdings I Corp.
Notes to Audited Consolidated Financial Statements (Continued)
September 30, 2015 and September 30, 2016
(in thousands)
14. Income Taxes (Continued)
change in deferred tax liabilities as a result of the acquisition of Neptune Benson on April 15, 2016. These deferred tax liabilities will generate additional taxable income in the future which will result in additional deferred tax assets to be realized. The Company evaluated the future reversals of the taxable temporary differences and confirmed that the reversal coincides with the reversal of the deferred tax asset. Therefore, the Company determined that it was appropriate to offset its existing deferred tax assets against the acquired gross deferred tax liability and as a result released the valuation allowance.
As of September 30, 2016 the company maintains a full valuation allowance against its net deferred tax assets in the US, Germany, Italy, Netherlands, and the UK. The valuation allowance at September 30, 2015 and September 30, 2016 was $63,268 and $47,846 respectively.
The following is the activity in our valuation allowance for the years ended September 30, 2015 and 2016 respectively:
| |
September 30, 2015 |
September 30, 2016 |
|||||
|---|---|---|---|---|---|---|---|
Balance at beginning of period |
— | (63,268 | ) | ||||
Valuation allowances established |
(63,268 | ) | — | ||||
Release of valuation allowances |
— | 15,422 | |||||
| | | | | | | | |
Balance at end of period |
(63,268 | ) | (47,846 | ) | |||
| | | | | | | | |
The Company utilizes the 'more likely than not" standard in recognizing a tax benefit in its financial statements. At September 30, 2016, the Company did not have any unrecognized tax benefits, nor did it record interest or penalties associated with unrecognized tax benefits. If accrual for interest or penalties is required, it is the Company's policy to include these as a component of tax expense.
No provision was made for U.S. income taxes on the undistributed earnings of non-U.S. subsidiaries because these earnings are intended to be indefinitely reinvested outside the United States. These earnings would become subject to income tax if they were remitted as dividends, were loaned to the Company or a U.S. affiliate, or if the Company were to sell its ownership interest in the subsidiaries. Determination of the amount of unrecognized deferred U.S. income tax liability on these indefinitely reinvested unremitted earnings is not practicable.
We are subject to taxation in the United States as well as various states and foreign jurisdictions. As of September 30, 2016, tax years for fiscal years 2014 and 2015 are subject to examination by the tax authorities.
15. Stock Option Plan
The Company established the EWT Holdings I Corp. Stock Option Plan shortly after the acquisition date of January 16, 2014. The plan allows certain management employees to purchase shares in EWT Holdings I Corp. and is designed to attract and retain employees while also aligning employees' interests with the interests of the Company's shareholders. In addition, members of the Company's Board of Directors participate in the stock option plan in connection with their service on the Company's Board. Under the EWT Holdings I Corp. Stock Option Plan, the number of shares
F-39
EWT Holdings I Corp.
Notes to Audited Consolidated Financial Statements (Continued)
September 30, 2015 and September 30, 2016
(in thousands)
15. Stock Option Plan (Continued)
available for award was 11,080. As of September 30, 2016, there were approximately 2,076 shares available for future grants.
Option awards are granted at various times during the fiscal year, vest ratably at 25% per year, and are exercisable at the time of vesting. The options granted have a ten year contractual term.
A summary of the stock option activity as of and for the periods ending September 30, 2014, 2015 and 2016 is presented below:
| |
2014 | 2015 | 2016 | |||||||||||||||||||||
|---|---|---|---|---|---|---|---|---|---|---|---|---|---|---|---|---|---|---|---|---|---|---|---|---|
Options
|
Shares | Weighted average exercise price |
Weighted average remaining contractual term |
Shares | Weighted average exercise price |
Weighted average remaining contractual term |
Shares | Weighted average exercise price |
Weighted average remaining contractual term |
|||||||||||||||
Outstanding at beginning of period |
3,778 | $ | 3.37 | 8.8 yrs | 8,025 | $ | 3.37 | 8.8 yrs | ||||||||||||||||
Granted |
4,027 | $ | 3.37 | 4,352 | 3.37 | 1,221 | 4.74 | |||||||||||||||||
Exercised |
— | — | — | — | — | — | ||||||||||||||||||
Forfeited |
(249 | ) | 3.37 | (105 | ) | 3.37 | (239 | ) | 3.62 | |||||||||||||||
Expired |
— | — | — | — | — | — | ||||||||||||||||||
Outstanding at end of period |
3,778 | 3.37 | 9.5 yrs | 8,025 | 3.37 | 8.8 yrs | 9,007 | 3.55 | 7.6 yrs | |||||||||||||||
Options exercisable at end of period |
— | 3.37 | — | 3.37 | 7.7 yrs | — | 3.37 | 7.7 yrs | ||||||||||||||||
A summary of the status of the Company's non-vested shares as of, and for the periods ended, September 30, 2014, 2015 and 2016 is presented below:
| |
2014 | 2015 | 2016 | ||||||||||||||||
|---|---|---|---|---|---|---|---|---|---|---|---|---|---|---|---|---|---|---|---|
Nonvested Shares
|
Shares | Weighted Average Grant Date Fair Value |
Shares | Weighted Average Grant Date Fair Value |
Shares | Weighted Average Grant Date Fair Value |
|||||||||||||
Nonvested at beginning of period |
— | — | 3,778 | 0.87 | 6,840 | $ | 0.95 | ||||||||||||
Granted |
4,027 | 0.87 | 4,352 | 1.02 | 1,221 | 1.97 | |||||||||||||
Vested |
— | (1,185 | ) | 0.96 | (1,891 | ) | 0.94 | ||||||||||||
Forfeited |
(249 | ) | 0.87 | (105 | ) | 0.87 | (239 | ) | 1.23 | ||||||||||
Nonvested at end of period |
3,778 | 0.87 | 6,840 | 0.95 | 5,931 | — | |||||||||||||
The weighted average grant date fair value for the options granted during the year was $1.02 and $1.97, for the periods ending September 30, 2015 and 2016, respectively. The total fair value of options vested during the year was $30,597 and $48,146 for the periods ending September 30, 2015 and 2016, respectively. The aggregate intrinsic value of vested and exercisable and outstanding stock options at September 30, 2015 and 2016 was $264,185 and $78,177, respectively.
F-40
EWT Holdings I Corp.
Notes to Audited Consolidated Financial Statements (Continued)
September 30, 2015 and September 30, 2016
(in thousands)
15. Stock Option Plan (Continued)
Expense Measurement and Recognition
The Company recognizes share-based compensation for all current award grants and, in future periods, will recognize compensation costs for the unvested portion of previous award grants based on grant date fair values. Unrecognized costs related to share-based awards outstanding at September 30, 2016 totaled approximately $4,900 and are expected to be recognized over a period of 3.9 years.
The Company has little historic data with respect to estimates of expected employee behaviors related to option exercises and forfeitures. As a result, the Company has used historic data from public disclosures of comparable companies which the Company believes to be representative of its own expected employee behaviors.
The Company estimates the fair value of each stock option award on the grant date using the Black-Scholes valuation model incorporating the assumptions noted in the following table. Option valuation models require the input of highly subjective assumptions, and changes in assumptions used can materially affect the fair value estimate. Option valuation assumptions for options granted are as follows:
| |
Year Ended September 30, 2015 |
Year Ended September 30, 2016 |
||
|---|---|---|---|---|
Expected volatility |
27.00% - 30.00% | 27.50% - 29.50% | ||
Expected dividends |
— | — | ||
Expected term (in years) |
5.7 - 5.8 | 6.1 | ||
Risk free rate |
1.31% - 1.58% | 1.01% - 1.42% | ||
Grant date fair value per share of options granted |
$23.58 - $36.44 | $36.44 - $61.77 |
The risk-free interest rate is based on the U.S. treasury security rate in effect as of the date of grant. As the Company has no history with respect to volatility of share prices the expected volatility is not based on realized volatility. The Company, as permitted under ASC 718, has identified guideline public companies who are participants in the Company's markets. The Company obtained historic share price trading data from the guideline companies and based their estimate of expected volatility on the historic volatility of the guideline companies. As the guideline companies are comparable in most significant respects, the Company believes they represent an appropriate basis for estimating expected volatility.
Reported non cash stock based compensation expense was classified as shown in the following table:
| |
January 16, 2014 through September 30, 2014 |
Year ended September 30, 2015 |
Year ended September 30, 2016 |
|||||||
|---|---|---|---|---|---|---|---|---|---|---|
Cost of services |
$ | 37 | $ | 38 | $ | 35 | ||||
General and administrative |
305 | 1,549 | 1,964 | |||||||
| | | | | | | | | | | |
|
$ | 342 | $ | 1,587 | $ | 1,999 | ||||
| | | | | | | | | | | |
| | | | | | | | | | | |
| | | | | | | | | | | |
F-41
EWT Holdings I Corp.
Notes to Audited Consolidated Financial Statements (Continued)
September 30, 2015 and September 30, 2016
(in thousands)
16. Other comprehensive loss
The components of accumulated other comprehensive loss were:
| |
September 30, 2015 |
September 30, 2016 |
|||||
|---|---|---|---|---|---|---|---|
Foreign currency translation loss |
$ | (2,238 | ) | $ | (745 | ) | |
Pension benefit plans, net of tax of ($72) and ($0) |
(2,275 | ) | (9,926 | ) | |||
| | | | | | | | |
Total accumulated other comprehensive loss |
$ | (4,513 | ) | $ | (10,671 | ) | |
| | | | | | | | |
| | | | | | | | |
| | | | | | | | |
The changes in accumulated other comprehensive loss by component, net of tax, for the year ending September 30, 2014 , 2015 and 2016 are as follows:
| |
Foreign currency translation loss |
Pension plans |
|||||
|---|---|---|---|---|---|---|---|
Balance at January 16, 2014 |
$ | — | $ | — | |||
Other comprehensive income before reclassifications |
2,038 | (2,560 | ) | ||||
Amounts reclassified from accumulated other comprehensive loss related to amortization of actuarial losses |
— | — | |||||
| | | | | | | | |
Balance at September 30, 2014 |
$ | 2,038 | $ | (2,560 | ) | ||
| | | | | | | | |
| | | | | | | | |
| | | | | | | | |
Other comprehensive income before reclassifications |
(4,276 | ) | 148 | ||||
Amounts reclassified from accumulated other comprehensive loss related to amortization of actuarial losses |
— | 137 | |||||
| | | | | | | | |
Balance at September 30, 2015 |
$ | (2,238 | ) | $ | (2,275 | ) | |
| | | | | | | | |
| | | | | | | | |
| | | | | | | | |
Other comprehensive income before reclassifications |
1,493 | (7,779 | ) | ||||
Amounts reclassified from accumulated other comprehensive loss related to amortization of actuarial losses |
— | 128 | |||||
| | | | | | | | |
Balance at September 30, 2016 |
$ | (745 | ) | $ | (9,926 | ) | |
| | | | | | | | |
| | | | | | | | |
| | | | | | | | |
Amounts reclassified out of other comprehensive loss related to the amortization of actuarial losses are included in pension expense.
17. Concentration of Credit Risk
The Company's cash and cash equivalents and accounts receivable are potentially subject to concentration of credit risk. Cash and cash equivalents are placed with financial institutions that management believes are of high credit quality. Accounts receivable are derived from revenue earned from customers located in the U.S. and internationally and generally do not require collateral. The Company's trade receivables do not represent a significant concentration of credit risk at fiscal 2015 and 2016 due to the wide variety of customers and markets into which products are sold and their dispersion across geographic areas. The Company does perform ongoing credit evaluations of its customers and maintains an allowance for potential credit losses on trade receivables. For the period October 1, 2013 to January 15, 2014 (predecessor) and the period January 16, 2014 to September 30,
F-42
EWT Holdings I Corp.
Notes to Audited Consolidated Financial Statements (Continued)
September 30, 2015 and September 30, 2016
(in thousands)
17. Concentration of Credit Risk (Continued)
2014 (successor), and as of and for the fiscal years ended September 30, 2015 and 2016, no customer accounted for more than 10% of net sales or net accounts receivable.
The Company operates predominantly in seven countries worldwide and provides a wide range of proven product brands and advanced water and wastewater treatment technologies, mobile and emergency water supply solutions and service contract options through its Industrial, Municipal, and Products segments. The Company is a multi-national business but its sales and operations are primarily in the U.S.
Sales to unaffiliated customers are based on the Company locations that maintain the customer relationship and transacts the external sale. The following tables set forth external net revenue, net of intercompany eliminations, and net asset information by region:
| |
Predecessor |
|
Successor | ||||||||||||
|---|---|---|---|---|---|---|---|---|---|---|---|---|---|---|---|
| |
October 1, 2013 through January 15, 2014 |
|
January 16, 2014 through September 30, 2014 |
|
|
||||||||||
| |
|
Year ended September 30, 2015 |
Year ended September 30, 2016 |
||||||||||||
| |
|
||||||||||||||
| |
|
||||||||||||||
Sales to external customers |
|||||||||||||||
United States |
$ | 249,422 | $ | 637,841 | $ | 880,787 | $ | 950,229 | |||||||
Rest of World |
56,892 | 153,313 | 180,179 | 186,967 | |||||||||||
| | | | | | | | | | | | | | | | |
Total |
306,314 | 791,154 | 1,060,966 | 1,137,196 | |||||||||||
| | | | | | | | | | | | | | | | |
| | | | | | | | | | | | | | | | |
| | | | | | | | | | | | | | | | |
| |
September 30, 2015 |
September 30, 2016 |
|||||
|---|---|---|---|---|---|---|---|
Net Assets |
|||||||
United States |
$ | 165,309 | $ | 200,511 | |||
Rest of World |
9,051 | 3,424 | |||||
| | | | | | | | |
|
$ | 174,360 | 203,935 | ||||
| | | | | | | | |
| | | | | | | | |
| | | | | | | | |
| |
September 30, 2015 |
September 30, 2016 |
|||||
|---|---|---|---|---|---|---|---|
Long Lived Assets |
|||||||
United States |
$ | 198,119 | $ | 212,457 | |||
Rest of World |
37,709 | 44,308 | |||||
| | | | | | | | |
|
$ | 235,828 | 256,765 | ||||
| | | | | | | | |
| | | | | | | | |
| | | | | | | | |
18. Related-Party Transactions
Transactions with Investors
The Company pays an advisory fee of $1,000 per quarter to AEA Investors LP ("AEA"), the private equity firm and ultimate majority shareholder. In addition, the Company reimburses AEA for
F-43
EWT Holdings I Corp.
Notes to Audited Consolidated Financial Statements (Continued)
September 30, 2015 and September 30, 2016
(in thousands)
18. Related-Party Transactions (Continued)
normal and customary expenses incurred by AEA on behalf of the Company. The Company incurred expenses, excluding advisory fees, of $1,382 for the period January 16, 2014 through September 30, 2014 and $1,963 and $377 for the years ending September 30, 2015 and 2016, respectively. The amounts owed to AEA were $758 and $100 at September 30, 2015 and 2016, respectively, and were included in Accrued expenses and other liabilities.
From time to time, the Company may facilitate the transfer of funds between employees and the Company, in connection with an employee stock purchase. As a result, the Company was due $250 from an officer of the Company as of September 30, 2016. This amount was repaid in full on January 31, 2017.
Additionally, in order to facilitate that acquisition of Neptune-Benson in April, 2016, the Company received an additional $6,895 of capital contribution from AEA that was used to fund the acquisition.
AEA, through two of its affiliated funds, is one of the lenders in the Incremental First Lien Facility and had a commitment of $14,925 at September 30, 2016.
Corporate Charges from Siemens and Affiliates
The Predecessor received services and support from various functions performed by Siemens and the Predecessor operations had been dependent upon Siemens' ability to provide these services and support functions. The total amount charged to the Predecessor for corporate services for the period ending January 15, 2014 was $3,048 and reflected in the Cost of product sales and services, General and administrative expenses, Marketing and selling and Research and development captions in the Combined Statements of Operations and Comprehensive Loss. The total amount charged was an allocation from Siemens based primarily on headcount of the Company. Management believes this allocation to be reasonable. It is not practicable to provide an estimate of such expenses for corporate services on a stand-alone basis.
The Predecessor had sales to and purchases from other entities of Siemens from time to time. Total sales for the period ending January 15, 2014 to other entities of Siemens were $4,498. The amount of purchases from other Siemens entities were not material for the period ending January 15, 2014.
19. Commitments and Contingencies
Operating Leases
The Company occupies certain facilities and operates certain equipment and vehicles under non-cancelable lease arrangements. Lease agreements may contain lease escalation clauses and purchase and renewal options. The Company recognizes scheduled lease escalation clauses over the course of the applicable lease term on a straight-line basis in the Consolidated Statement of Operations.
Total rent expense was $4,394 in the period from October 1, 2013 to January 15, 2014 (Predecessor). Total rent expense was $10,889 in the period from January 16, 2014 to September 30, 2014 (Successor), and was $14,592 and $11,760 for the fiscal years ended September 30, 2015 and 2016, respectively.
F-44
EWT Holdings I Corp.
Notes to Audited Consolidated Financial Statements (Continued)
September 30, 2015 and September 30, 2016
(in thousands)
19. Commitments and Contingencies (Continued)
Future minimum aggregate rental payments under non-cancelable operating leases are as follows:
| |
Operating Leases |
|||
|---|---|---|---|---|
Fiscal Year |
||||
2017 |
$ | 13,232 | ||
2018 |
9,982 | |||
2019 |
7,683 | |||
2020 |
6,167 | |||
2021 |
4,521 | |||
Thereafter |
5,784 | |||
| | | | | |
Total |
$ | 47,369 | ||
| | | | | |
| | | | | |
| | | | | |
Capital Leases
The Company leases certain equipment under leases classified as capital leases. The leased equipment is depreciated on a straight line basis over the life of the lease and is included in depreciation expense. The gross and net carrying values of the equipment under capital leases were $22,448 and $20,812, respectively, as of September 30, 2015 and was $29,261 and $22,788, respectively, as of September 30, 2016 and are recorded in Property, plant and equipment, net.
The following is a schedule showing the future minimum lease payments under capital leases by years and the present value of the minimum lease payments as of September 30, 2016.
| |
Capital Leases |
|||
|---|---|---|---|---|
Fiscal Year |
||||
2017 |
$ | 7,530 | ||
2018 |
6,941 | |||
2019 |
6,072 | |||
2020 |
4,797 | |||
2021 |
2,175 | |||
Thereafter |
839 | |||
| | | | | |
Total |
28,354 | |||
Less amount representing interest (at rates ranging from 2.0% to 2.8%) |
5,291 | |||
| | | | | |
Present value of net minimum capital lease payments |
23,063 | |||
Less current installments of obligations under capital leases |
6,231 | |||
| | | | | |
Obligations under capital leases, excluding current installments |
$ | 16,832 | ||
| | | | | |
| | | | | |
| | | | | |
The current installments of obligations under capital leases are included in Accrued expenses and other liabilities. Obligations under capital leases, excluding current installments, are included in Other non-current liabilities.
F-45
EWT Holdings I Corp.
Notes to Audited Consolidated Financial Statements (Continued)
September 30, 2015 and September 30, 2016
(in thousands)
19. Commitments and Contingencies (Continued)
The Company is a lessor to multiple parties. The Company purchases equipment through internal funding or bank debt equal to the fair market value of the equipment. The equipment is then leased to customers for periods ranging from five to twenty years. The Company also leases equipment to one customer under a direct financing lease. The primary difference between this lease and the other operating leases is that this transaction resulted from a sales-leaseback transaction and does not have the same level of performance guarantees that the other agreements have. As of September 30, 2016, future minimum lease payments receivable under the direct financing lease and the operating lease are as follows:
| |
Direct Financing Lease |
Operating Lease |
|||||
|---|---|---|---|---|---|---|---|
Fiscal year |
|||||||
2017 |
$ | 4,841 | $ | 11,523 | |||
2018 |
4,034 | 7,327 | |||||
2019 |
— | 4,961 | |||||
2020 |
— | 4,151 | |||||
2021 |
— | 2,144 | |||||
Thereafter |
— | 5,718 | |||||
Future minimum lease payments |
8,875 |
$ |
35,824 |
||||
| | | | | | | | |
| | | | | | | | |
| | | | | | | | |
Less unearned income |
(346 | ) | |||||
| | | | | | | | |
Net investment in direct financing lease |
8,529 | ||||||
Less current portion |
(4,605 | ) | |||||
| | | | | | | | |
Noncurrent portion |
$ | 3,924 | |||||
| | | | | | | | |
| | | | | | | | |
| | | | | | | | |
The current receivables under the direct financing lease are included in Prepaids and other current assets. The non-current portion of the direct financing lease is included in Other non-current assets.
Guarantees
From time to time, the Company is required to provide letters of credit, bank guarantees, or surety bonds in support of its commitments and as part of the terms and conditions on water treatment projects. In addition, the Company is required to provide letters of credit or surety bonds to the department of environmental protection or equivalent in some states in order to maintain its licenses to handle toxic substances at certain of its water treatment facilities.
These financial instruments typically expire after all Company commitments have been met, a period typically ranging from twelve months to ten years, or more in some circumstances. The letters of credit, bank guarantees, or surety bonds are arranged through major banks or insurance companies. In the case of surety bonds, the Company generally indemnifies the issuer for all costs incurred if a claim is made against the bond.
F-46
EWT Holdings I Corp.
Notes to Audited Consolidated Financial Statements (Continued)
September 30, 2015 and September 30, 2016
(in thousands)
19. Commitments and Contingencies (Continued)
As of September 30, 2015 and 2016, the Company had letters of credit totaling $20,238 and $18,129, respectively, and Surety Bonds totaling $65,038 and $102,228 respectively, outstanding under the Company's credit arrangement. The longest maturity date of the letters of credit and surety bonds related to commercial contracts in effect as of September 30, 2016 was March 31, 2024. Additionally, as of September 30, 2015 and 2016, the Company had letters of credit totaling $3,670 and $1,529, respectively, and Surety Bonds totaling $135,595 and $43,663, respectively, outstanding under the Company's prior arrangement with Siemens.
Litigation
From time to time, as a normal incident of the nature and kind of business in which the Company is engaged, various claims or charges are asserted and litigation commenced against it arising from or related to: product liability; personal injury; trademarks, trade secrets or other intellectual property; labor and employee disputes; commercial or contractual disputes; breach of warranty; or environmental matters. Claimed amounts may be substantial but may not bear any reasonable relationship to the merits of the claim or the extent of any real risk of court or arbitral awards. While it is not feasible to predict the outcome of these matters with certainty, and some lawsuits, claims or proceedings may be disposed or decided unfavorably, the Company does not expect that any asserted or unasserted legal claims or proceedings, individually or in the aggregate, will have a material adverse effect on the results of operations, or financial condition.
20. Accrued Expenses and Other Liabilities
Accrued expenses and other liabilities consisted of the following:
| |
September 30, 2015 | September 30, 2016 | |||||
|---|---|---|---|---|---|---|---|
Salaries, wages and other benefits |
$ | 50,472 | $ | 44,776 | |||
Severance payments |
1,814 | 13,217 | |||||
Taxes, other than income |
10,199 | 10,643 | |||||
Obligation under capital leases |
6,601 | 6,231 | |||||
Insurance liabilities |
5,620 | 5,484 | |||||
Provisions for litigation |
3,571 | 3,894 | |||||
Pension payable |
1,232 | 1,255 | |||||
Third party commissions |
8,771 | 9,155 | |||||
Other |
12,535 | 16,652 | |||||
| | | | | | | | |
|
$ | 100,815 | $ | 111,307 | |||
| | | | | | | | |
| | | | | | | | |
| | | | | | | | |
21. Business Segments
The Company has three reportable segments—Industrial, Municipal and Products. The key factors used to identify these reportable segments are the organization and alignment of the Company's
F-47
EWT Holdings I Corp.
Notes to Audited Consolidated Financial Statements (Continued)
September 30, 2015 and September 30, 2016
(in thousands)
21. Business Segments (Continued)
internal operations, the nature of the products and services, and customer type. The business segments are described as follows:
Industrial combines equipment and services to improve operational reliability and environmental compliance for heavy and light industry, commercial and institutional markets. Their customers include hydrocarbon refineries, chemical processing, power, food and beverage, life sciences, health services and microelectronics.
Municipal helps engineers and municipalities meet new demands for plant performance through leading equipment, solutions and services backed by trusted brands and over 100 plus years of applications experience. Their customers include wastewater and drinking water collection and distribution systems, utility operators and odor control services.
Products has distinct business operating units. Each has a unique standard product built on well-known brands and technologies that are sold globally through multiple sales and aftermarket channels. Additionally, Products also offers industrial, municipal and water recreational users with well-known brands that improve operational reliability and environmental compliance Their customers include original equipment manufacturers, regional and global distributors, engineering, procurement and contracting customers, end users in the municipal, industrial and commercial industries hotels, resorts, colleges, universities, waterparks, aquariums and zoos in addition to customers in the industrial and municipal industries.
The Company evaluates its business segments' operating results based on earnings before interest, taxes, depreciation and amortization. Corporate activities include general corporate expenses, elimination of intersegment transactions, interest income and expense and other unallocated charges. Since certain administrative and other operating expenses and other items have not been allocated to
F-48
EWT Holdings I Corp.
Notes to Audited Consolidated Financial Statements (Continued)
September 30, 2015 and September 30, 2016
(in thousands)
21. Business Segments (Continued)
business segments, the results in the below table are not necessarily a measure computed in accordance with generally accepted accounting principles and may not be comparable to other companies.
| |
Predecessor | |
Successor | ||||||||||||
|---|---|---|---|---|---|---|---|---|---|---|---|---|---|---|---|
| |
October 1, 2013 through January 15, 2014 |
|
January 16, 2014 through September 30, 2014 |
Year ended September 30, 2015 |
Year ended September 30, 2016 |
||||||||||
| |
|
||||||||||||||
| |
|
||||||||||||||
Total sales |
|||||||||||||||
Industrial |
$ | 170,557 | $ | 436,467 | $ | 574,338 | $ | 610,824 | |||||||
Municipal |
81,502 | 212,178 | 311,064 | 307,647 | |||||||||||
Products |
68,818 | 185,372 | 241,182 | 285,258 | |||||||||||
Other |
7,797 | 5,550 | 50 | — | |||||||||||
| | | | | | | | | | | | | | | | |
Total sales |
328,674 | 839,567 | 1,126,634 | 1,203,729 | |||||||||||
| | | | | | | | | | | | | | | | |
Intersegment sales |
|||||||||||||||
Industrial |
3,352 | 5,953 | 5,331 | 6,632 | |||||||||||
Municipal |
10,520 | 24,926 | 37,490 | 29,647 | |||||||||||
Products |
8,488 | 17,534 | 22,847 | 30,254 | |||||||||||
| | | | | | | | | | | | | | | | |
Total intersegment sales |
22,360 | 48,413 | 65,668 | 66,533 | |||||||||||
| | | | | | | | | | | | | | | | |
Sales to external customers |
|||||||||||||||
Industrial |
167,205 | 430,514 | 569,007 | 604,192 | |||||||||||
Municipal |
70,982 | 187,252 | 273,574 | 278,000 | |||||||||||
Products |
60,330 | 167,838 | 218,335 | 255,004 | |||||||||||
Other |
7,797 | 5,550 | 50 | — | |||||||||||
| | | | | | | | | | | | | | | | |
Total sales |
306,314 | 791,154 | 1,060,966 | 1,137,196 | |||||||||||
| | | | | | | | | | | | | | | | |
Earnings before interest, taxes, depreciation and amortization (EBITDA) |
|||||||||||||||
Industrial |
56,112 | 73,316 | 116,883 | 129,662 | |||||||||||
Municipal |
(2,247 | ) | 21,347 | 29,797 | 39,434 | ||||||||||
Products |
15,600 | 26,500 | 39,223 | 55,099 | |||||||||||
Corporate |
(57,983 | ) | (103,458 | ) | (131,850 | ) | (117,751 | ) | |||||||
| | | | | | | | | | | | | | | | |
Total EBITDA |
11,482 | 17,705 | 54,053 | 106,444 | |||||||||||
Depreciation and amortization |
|||||||||||||||
Industrial |
(5,981 | ) | (24,518 | ) | (30,567 | ) | (38,266 | ) | |||||||
Municipal |
(2,433 | ) | (16,906 | ) | (7,656 | ) | (8,147 | ) | |||||||
Products |
(352 | ) | (1,580 | ) | (1,695 | ) | (6,387 | ) | |||||||
Corporate |
(6,168 | ) | (96,930 | ) | (18,221 | ) | (16,489 | ) | |||||||
| | | | | | | | | | | | | | | | |
Total depreciation and amortization |
(14,934 | ) | (139,934 | ) | (58,139 | ) | (69,289 | ) | |||||||
(Loss) income from operations |
|||||||||||||||
Industrial |
50,131 | 48,798 | 86,316 | 91,396 | |||||||||||
Municipal |
(4,680 | ) | 4,441 | 22,141 | 31,287 | ||||||||||
Products |
15,248 | 24,920 | 37,528 | 48,712 | |||||||||||
Corporate |
(64,151 | ) | (200,387 | ) | (150,071 | ) | (134,240 | ) | |||||||
| | | | | | | | | | | | | | | | |
Total (loss) income from operations |
(3,452 | ) | (122,228 | ) | (4,086 | ) | 37,155 | ||||||||
Interest expense |
(23 | ) | (23,994 | ) | (34,060 | ) | (42,518 | ) | |||||||
| | | | | | | | | | | | | | | | |
Loss before income taxes |
(3,475 | ) | (146,222 | ) | (38,146 | ) | (5,363 | ) | |||||||
Income tax benefit (expense) |
1,173 | 48,465 | (47,905 | ) | 18,394 | ||||||||||
| | | | | | | | | | | | | | | | |
Net (loss) income |
$ | (2,302 | ) | $ | (97,757 | ) | $ | (86,051 | ) | $ | 13,031 | ||||
| | | | | | | | | | | | | | | | |
| | | | | | | | | | | | | | | | |
| | | | | | | | | | | | | | | | |
Capital expenditures |
|||||||||||||||
Industrial |
$ | 6,316 | $ | 22,152 | $ | 31,967 | $ | 34,007 | |||||||
Municipal |
657 | 4,152 | 4,523 | 6,113 | |||||||||||
Products |
104 | 1,272 | 3,358 | 3,852 | |||||||||||
Corporate |
888 | 1,049 | 4,231 | 3,756 | |||||||||||
| | | | | | | | | | | | | | | | |
Total Capital expenditures |
$ | 7,965 | $ | 28,625 | $ | 44,079 | $ | 47,728 | |||||||
| | | | | | | | | | | | | | | | |
| | | | | | | | | | | | | | | | |
| | | | | | | | | | | | | | | | |
Assets |
|||||||||||||||
Industrial |
381,947 | 370,970 | |||||||||||||
Municipal |
132,348 | 123,041 | |||||||||||||
Products |
130,110 | 477,804 | |||||||||||||
Corporate |
395,466 | 324,416 | |||||||||||||
| | | | | | | | | | | | | | | | |
Total assets |
$ | 1,039,871 | $ | 1,296,231 | |||||||||||
| | | | | | | | | | | | | | | | |
| | | | | | | | | | | | | | | | |
| | | | | | | | | | | | | | | | |
Goodwill |
|||||||||||||||
Industrial |
$ | 78,953 | $ | 80,157 | |||||||||||
Municipal |
9,546 | 9,691 | |||||||||||||
Products |
25,084 | 177,795 | |||||||||||||
| | | | | | | | | | | | | | | | |
Total goodwill |
$ | 113,583 | $ | 267,643 | |||||||||||
| | | | | | | | | | | | | | | | |
| | | | | | | | | | | | | | | | |
| | | | | | | | | | | | | | | | |
F-49
EWT Holdings I Corp.
Notes to Audited Consolidated Financial Statements (Continued)
September 30, 2015 and September 30, 2016
(in thousands)
22. Earnings per share
The following table sets forth the computation of basic and diluted loss from continuing operations per common share (in thousands, except per share amounts):
| |
September 30, 2014 |
September 30, 2015 |
September 30, 2016 |
|||||||
|---|---|---|---|---|---|---|---|---|---|---|
Numerator: |
||||||||||
Numerator for basic and diluted loss from continuing operations per common share—Net (loss) income from continuing operations attributable to Evoqua Water Technologies |
$ | (97,757 | ) | $ | (86,051 | ) | $ | 11,639 | ||
Denominator: |
||||||||||
Denominator for basic net (loss) income per common share—weighted average shares |
100,964 | 101,763 | 104,254 | |||||||
Effect of dilutive securities: |
||||||||||
Share-based compensation |
— | — | 1,907 | |||||||
| | | | | | | | | | | |
Denominator for diluted net loss per common share—adjusted weighted average shares |
100,964 | 101,763 | 106,161 | |||||||
| | | | | | | | | | | |
Basic (loss) income from continuing operations attributable to Evoqua Water Technologies per common share |
$ | (0.97 | ) | $ | (0.85 | ) | $ | 0.11 | ||
| | | | | | | | | | | |
| | | | | | | | | | | |
| | | | | | | | | | | |
Diluted (loss) income from continuing operations attributable to Evoqua Water Technologies per common share |
$ | (0.97 | ) | $ | (0.85 | ) | $ | 0.11 | ||
| | | | | | | | | | | |
| | | | | | | | | | | |
| | | | | | | | | | | |
Since the Company was in a net loss position for the years ended September 30, 2014 and 2015, there was no difference between the number of shares used to calculate basic and diluted loss per share. Because of their anti-dilutive effect, 3,774 and 8,033 common share equivalents comprised of employee stock options, have been excluded from the diluted EPS calculation for the years ended September 30, 2014 and 2015, respectively.
23. Subsequent Events
The Company performed an evaluation of subsequent events through October 16, 2017, the date the consolidated financial statements were available to be issued.
Acquisitions
On November 1, 2016, the Company acquired Environmental Treatment Services, Inc (ETS), a leading provider of engineered solutions to the industrial wastewater market based in Acworth, GA for $10,730. ETS had ten employees as of the date of acquisition, or November 1, 2016. ETS was acquired to support the Company's growth plan.
On May 9, 2017, the Company acquired the assets of Noble Water Technologies, a leader in high purity water systems and service, located in Dallas, TX for $8,281; $5,915 cash at closing in addition to earn out payments over the next twelve months. The Company is still working through the purchase price valuation.
On June 30, 2017, the Company acquired ADI Systems North America Inc., Lange Containment Systems, Inc. and Geomembrane Technologies Inc. (collectively, "ADI") from ADI Group Inc. for a total of CAD 74,800 ($57,545); CAD 67,320 ($51,785) cash at closing in addition to CAD 7,480 ($5,760) earn out payments over the next two years. The three are world leaders in wastewater
F-50
EWT Holdings I Corp.
Notes to Audited Consolidated Financial Statements (Continued)
September 30, 2015 and September 30, 2016
(in thousands)
23. Subsequent Events (Continued)
solutions for industrial and manufacturing applications, primarily based in Fredericton, New Brunswick. ADI offers a wide range of technologies tailored to its customer base around the world in anaerobic digestion, aerobic treatment, and biogas treatment. They also provide green energy recovery and water reuse technologies as well as industrial wastewater cover liners and containment systems. Combined, ADI has more than 260 customers in 35 countries.
On June 30, 2017, the Company acquired Olson Irrigation Systems, a leading designer and producer of filters and irrigation components for the agriculture and industrial markets, based in Santee, California for $9,000. Olson will become part of Evoqua's Products division and will help the business build upon its leadership position in filtration serving a broad range of industrial applications.
Debt
The Company completed a tack-on financing to the First Lien term loan on October 28, 2016 (the "Tack-On Facility") for $150,000, issued at a .25% discount, aggregating $375. The Company incurred $4,000 of additional financing fees related to this transaction, which have been capitalized and are included in other non-current assets on the balance sheet.
Proceeds from this transaction were used to repay $33,000 outstanding on the Revolving Credit Facility, as well as to extinguish the $75,000 Second Lien Term Loan facility, which had $2,525 of unamortized fees that were written off as a result. Through this transaction, The Company also upsized the Revolving Credit Facility capacity by $20,000, to an aggregate $95,000.
Issuance of the Tack-On Facility increased our First Lien Term Loan quarterly principal obligations to $1,648, subject to the same interest rate terms as the original First Lien Team Loan.
The Company completed a financing on June 30, 2017 (a Build Own Operate or "BOO" financing) for $7,100. The Company incurred $50 of additional financing fees related to this transaction, which have been capitalized and are included as a contra liability on the balance sheet. This BOO financing fully amortizes over the seven years tenor and at an interest rate of one month libor plus 300 bps. At the time of entering into the loan, the company entered into a swap transaction for the duration of the loan fixing the obligation at a rate of 5.08% per annum. Principal obligations are $254 per quarter.
On August 8, 2017 the Company amended the First Lien Term Facility to 1) Increase the facility term loan balance by $80,000, 2) Reprice the Incremental First Lien Term Facility and 3) Combine all tranches into a single tranche. The First Lien Term Facility now carries a rate of LIBOR + 375 basis points. Proceeds from the additional borrowing were used to reduce the revolving credit facility and to increase cash on hand for general corporate operating purposes.
Stock Split
On October 16, 2017, the Company's Board of Directors effected a 26.9576-for-one stock split of its common stock and increased its authorized shares to 1,000,000. All share and per share information has been retroactively adjusted to reflect the stock split. The incremental par value of the newly issued shares was recorded with the offset to additional-paid-in capital.
Name Change
On October 16, 2017, the Company's Board of Directors changed the name of the Company from EWT Holdings I Corp to Evoqua Water Technologies Corp.
F-51
SCHEDULE I—EWT HOLDINGS I CORP.
(Parent company only)
Condensed Consolidated Balance Sheets
(in thousands)
| |
September 30, 2015 | September 30, 2016 | |||||
|---|---|---|---|---|---|---|---|
ASSETS |
|||||||
Current assets |
$ | 9,123 | $ | 1,734 | |||
| | | | | | | | |
Cash and cash equivalents |
8,816 | 1,427 | |||||
Prepaid and other current assets |
307 | 307 | |||||
| | | | | | | | |
Investment in affiliate |
171,471 | 207,232 | |||||
| | | | | | | | |
Total assets |
$ | 180,594 | $ | 208,966 | |||
| | | | | | | | |
LIABILITIES AND EQUITY |
|||||||
Current liabilities |
$ | 1,721 | — | ||||
| | | | | | | | |
Due to affiliates |
1,721 | ||||||
| | | | | | | | |
Total liabilities |
1,721 | — | |||||
| | | | | | | | |
Commitments and Contingent Liabilities (Note 19) |
|||||||
Common stock, par value $.01: authorized 1,000,000 shares; issued 101,849 shares, outstanding 101,742 at September 30, 2015; issued 104,495 shares, outstanding 104,250 shares at September 30, 2016 |
1,018 | 1,045 | |||||
Treasury stock: 107 shares at September 30, 2015 and 245 shares at September 30, 2016 |
(410 | ) | (1,133 | ) | |||
Additional paid-in capital |
362,073 | 381,223 | |||||
Retained deficit |
(183,808 | ) | (172,169 | ) | |||
| | | | | | | | |
Total shareholders' equity |
178,873 | 208,966 | |||||
| | | | | | | | |
Total liabilities and shareholder's equity |
$ | 180,594 | $ | 208,966 | |||
| | | | | | | | |
F-52
SCHEDULE 1—EWT HOLDINGS I CORP.
(Parent company only)
Condensed Statements of Operations
(in thousands)
| |
January 16, 2014 through September 30, 2014 |
Year Ended September 30, 2015 |
Year ended September 30, 2016 |
|||||||
|---|---|---|---|---|---|---|---|---|---|---|
Net (loss) income of subsidiaries |
$ | (97,757 | ) | $ | (86,051 | ) | $ | 11,639 | ||
| | | | | | | | | | | |
(Loss) Income before taxes |
(97,757 | ) | (86,051 | ) | 11,639 | |||||
Benefit for income taxes |
— | — | — | |||||||
| | | | | | | | | | | |
Net (loss) income |
$ | (97,757 | ) | $ | (86,051 | ) | $ | 11,639 | ||
| | | | | | | | | | | |
F-53
SCHEDULE 1—EWT HOLDINGS I CORP.
Condensed Statements of Changes in Cash Flows
(Parent company only)
(in thousands)
| |
January 16, 2014 Through September 30, 2014 |
Year Ended September 30, 2015 |
Year Ended September 30, 2016 |
|||||||
|---|---|---|---|---|---|---|---|---|---|---|
Operating activities |
||||||||||
Net (loss) income |
$ | (97,757 | ) | $ | (86,051 | ) | $ | 11,639 | ||
Adjustments to reconcile net income to net cash used in operating activities |
||||||||||
Net income of subsidiaries |
$ | 97,757 | $ | 86,051 | (11,639 | ) | ||||
Changes in assets and liabilities |
||||||||||
Due to affiliates |
1,633 | 88 | (1,721 | ) | ||||||
Prepaids and other current assets |
(1,139 | ) | 832 | — | ||||||
| | | | | | | | | | | |
New cash provided by (used in) operating activities |
494 | 920 | (1,721 | ) | ||||||
| | | | | | | | | | | |
Investing activities |
||||||||||
Investment in subsidiaries |
— | — | (22,122 | ) | ||||||
| | | | | | | | | | | |
Net cash used in investing activities |
— | — | (22,122 | ) | ||||||
| | | | | | | | | | | |
Financing activities |
||||||||||
Proceeds from issuance of common stock |
6,965 | 847 | 10,282 | |||||||
Proceeds from capital contribution |
— | — | 6,895 | |||||||
Stock repurchases |
— | (410 | ) | (723 | ) | |||||
| | | | | | | | | | | |
Net cash provided by financing activities |
6,965 | 437 | 16,454 | |||||||
| | | | | | | | | | | |
Change in cash and cash equivalents |
7,459 | 1,357 | (7,389 | ) | ||||||
Cash and cash equivalents |
||||||||||
Beginning of period |
— | 7,459 | 8,816 | |||||||
| | | | | | | | | | | |
End of period |
$ | 7,459 | $ | 8,816 | $ | 1,427 | ||||
| | | | | | | | | | | |
F-54
SCHEDULE I—EWT HOLDINGS I CORP.
(Parent company only)
Notes to Financial Statements
(in thousands)
September 30, 2015 and 2016
1. Basis of Presentation
Basis of Presentation
In the parent-company-only financial statements, the Company's investment in subsidiaries is stated at cost plus equity in undistributed earnings of subsidiaries. The Company's share of net income (loss) of its consolidated subsidiaries is included in consolidated income (loss) using the equity method. The parent-company-only financial statements should be read in conjunction with the Company's consolidated financial statements.
2. Guarantees and Restrictions
As of September 30, 2016, EWT Holdings III, Corp., a subsidiary of the Company, had $675,188 collectively of debt outstanding under the First Lien Term Loan Facility and $75,000 outstanding under the Second Lien Term Loan Facility. Under the terms of the credit agreements governing our Credit Facilities, EWT Holdings II, Corp. has guaranteed the payment of all principal and interest. In the event of a default under our Credit Facilities, certain of the Company's subsidiaries will be directly liable to the debt holders. As of September 30, 2016, the Term Loan Facility had a maturity date of January 15, 2021. The credit agreements governing our Credit Facilities also include restrictions on the ability of the Company and its subsidiaries to (i) incur additional indebtedness and liens in connection therewith; (ii) pay dividends and make certain other restricted payments; (iii) effect mergers or consolidations; (iv) enter into transactions with affiliates; (v) sell or dispose of property or assets; and (vi) engage in unrelated lines of business.
3. Dividends from Subsidiaries
There were no cash dividends paid to EWT Holdings I Corp. from the Company's consolidated subsidiaries of each of the periods ended September 30, 2014, 2015 and 2016.
F-55
EWT HOLDINGS I CORP.
Unaudited Condensed Consolidated Balance Sheets
(in thousands)
| |
September 30, 2016 | (unaudited) June 30, 2017 |
|||||
|---|---|---|---|---|---|---|---|
ASSETS |
|||||||
Current assets |
$ | 418,336 | $ | 469,044 | |||
| | | | | | | | |
Cash and cash equivalents |
50,362 | 54,018 | |||||
Receivables, net |
184,789 | 202,469 | |||||
Inventories, net |
112,392 | 123,506 | |||||
Cost and earnings in excess of billings on uncompleted contracts |
50,081 | 58,418 | |||||
Prepaid and other current assets |
16,255 | 26,040 | |||||
Income tax receivable |
4,457 | 4,593 | |||||
| | | | | | | | |
Property, plant, and equipment, net |
256,765 | 271,830 | |||||
| | | | | | | | |
Goodwill |
267,643 | 317,393 | |||||
| | | | | | | | |
Intangible assets, net |
323,478 | 339,538 | |||||
| | | | | | | | |
Deferred income taxes |
— | 349 | |||||
| | | | | | | | |
Other non-current assets |
30,009 | 22,549 | |||||
| | | | | | | | |
Total assets |
$ | 1,296,231 | $ | 1,420,703 | |||
| | | | | | | | |
LIABILITIES AND EQUITY |
|||||||
Current liabilities |
$ | 284,862 | $ | 332,363 | |||
| | | | | | | | |
Accounts Payable |
102,379 | 106,421 | |||||
Current portion of debt |
30,024 | 73,093 | |||||
Billings in excess of costs incurred on uncompleted contracts |
22,175 | 24,764 | |||||
Product warranties |
16,860 | 10,692 | |||||
Accrued expenses and other liabilities |
111,307 | 116,333 | |||||
Income tax payable |
2,117 | 1,060 | |||||
| | | | | | | | |
Non-current liabilities |
807,434 | 886,853 | |||||
| | | | | | | | |
Long-term debt |
728,132 | 800,628 | |||||
Product warranties |
6,449 | 6,683 | |||||
Other non-current liabilities |
64,290 | 70,412 | |||||
Deferred income taxes |
8,563 | 9,130 | |||||
| | | | | | | | |
Total liabilities |
1,092,296 | $ | 1,219,216 | ||||
| | | | | | | | |
Commitments and Contingent Liabilities (Note 16) |
|||||||
Equity |
|||||||
EWT Holdings I Corp. equity |
|||||||
Common stock, par value $.01: authorized 1,000,000 shares; issued 104,495 shares, outstanding 104,250 shares at September 30, 2016; issued 105,359 shares, outstanding 104,990 shares at June 30, 2017. |
1,045 | 1,054 | |||||
Treasury stock: 245 shares at September 30, 2016 and 369 shares at June 30, 2017 |
(1,133 | ) | (2,209 | ) | |||
Additional paid-in capital |
381,223 | 388,369 | |||||
Retained deficit |
(172,169 | ) | (181,067 | ) | |||
Accumulated other comprehensive loss, net of tax |
(10,671 | ) | (7,898 | ) | |||
| | | | | | | | |
Total EWT Holdings I Corp. equity |
198,295 | 198,249 | |||||
Non-controlling interest |
5,640 | 3,238 | |||||
| | | | | | | | |
Total Equity |
203,935 | 201,487 | |||||
| | | | | | | | |
Total liabilities and equity |
$ | 1,296,231 | $ | 1,420,703 | |||
| | | | | | | | |
| | | | | | | | |
| | | | | | | | |
See accompanying notes to these Condensed Consolidated Financial Statements
F-56
EWT HOLDINGS I CORP.
Unaudited Condensed Consolidated Statements of Operations
(in thousands except per share data)
| |
Nine months ended | ||||||
|---|---|---|---|---|---|---|---|
| |
June 30, 2016 | June 30, 2017 | |||||
Revenue from product sales and services |
$ | 817,788 | $ | 890,916 | |||
Cost of product sales and services |
575,234 | 614,088 | |||||
| | | | | | | | |
Gross profit |
242,554 | 276,828 | |||||
| | | | | | | | |
Research and development expense |
17,469 | 15,684 | |||||
Sales and marketing expense |
97,078 | 108,729 | |||||
General and administrative expense |
108,496 | 120,534 | |||||
Other operating income |
(2,404 | ) | (981 | ) | |||
Interest expense |
29,467 | 39,117 | |||||
| | | | | | | | |
Loss before income taxes |
(7,552 | ) | (6,255 | ) | |||
| | | | | | | | |
Income tax benefit (expense) |
20,419 | (295 | ) | ||||
| | | | | | | | |
Net income (loss) |
12,867 | (6,550 | ) | ||||
| | | | | | | | |
Net income attributable to non controlling interest |
1,055 | 2,348 | |||||
| | | | | | | | |
Net income (loss) attributable to EWT Holdings I Corp. |
$ | 11,812 | $ | (8,898 | ) | ||
| | | | | | | | |
| | | | | | | | |
| | | | | | | | |
Basic earnings (loss) per common share |
$ | 0.11 | $ | (0.08 | ) | ||
Diluted earnings (loss) per common share |
$ | 0.11 | $ | (0.08 | ) | ||
See accompanying notes to these Condensed Consolidated Financial Statements
F-57
EWT HOLDINGS I CORP.
Unaudited Condensed Consolidated Statements of Comprehensive Income (Loss)
(in thousands)
| |
Nine months ended | ||||||
|---|---|---|---|---|---|---|---|
| |
June 30, 2016 | June 30, 2017 | |||||
Net income (loss) |
$ | 12,867 | $ | (6,550 | ) | ||
Other comprehensive income |
|||||||
Foreign currency translation adjustments |
781 | 2,773 | |||||
| | | | | | | | |
Total other comprehensive income |
$ | 781 | $ | 2,773 | |||
Less: Comprehensive income attributable to non controlling interest |
1,055 | 2,348 | |||||
| | | | | | | | |
Comprehensive income (loss) attributable to EWT Holdings I Corp. |
$ | 12,593 | $ | (6,125 | ) | ||
| | | | | | | | |
| | | | | | | | |
| | | | | | | | |
See accompanying notes to these Condensed Consolidated Financial Statements
F-58
EWT HOLDINGS I CORP.
Unaudited Condensed Consolidated Statements of Changes in Equity
(in thousands)
| |
Common Stock Shares |
Common Stock |
Treasury Stock Shares |
Treasury Stock |
Additional Paid-in Capital |
Retained Deficit |
Accumulated Other Comprehensive Loss |
Noncontrolling Interest |
Total | |||||||||||||||||||
|---|---|---|---|---|---|---|---|---|---|---|---|---|---|---|---|---|---|---|---|---|---|---|---|---|---|---|---|---|
Balance at September 30, 2015 |
101,849 | $ | 1,018 | 107 | $ | (410 | ) | $ | 362,073 | $ | (183,808 | ) | $ | (4,513 | ) | $ | — | $ | 174,360 | |||||||||
Equity based compensation expense |
— | — | — | — | 1,447 | — | — | — | 1,447 | |||||||||||||||||||
Capital Contribution |
— | — | — | — | 6,895 | — | — | — | 6,895 | |||||||||||||||||||
Issuance of common stock |
2,646 | 27 | — | — | 10,256 | — | — | — | 10,283 | |||||||||||||||||||
Stock repurchases |
— | — | 138 | (723 | ) | — | — | — | — | (723 | ) | |||||||||||||||||
Establishment of noncontrolling interest |
— | — | — | — | — | — | — | 6,873 | 6,873 | |||||||||||||||||||
Dividends paid to noncontrolling interest |
— | — | — | — | — | — | — | (1,875 | ) | (1,875 | ) | |||||||||||||||||
Net income |
— | — | — | — | — | 11,812 | — | 1,055 | 12,867 | |||||||||||||||||||
Other comprehensive income |
— | — | — | — | — | — | 781 | — | 781 | |||||||||||||||||||
| | | | | | | | | | | | | | | | | | | | | | | | | | | | | |
Balance at June 30, 2016 |
104,495 | $ | 1,045 | 245 | $ | (1,133 | ) | $ | 380,671 | $ | (171,996 | ) | $ | (3,732 | ) | $ | 6,053 | $ | 210,908 | |||||||||
| | | | | | | | | | | | | | | | | | | | | | | | | | | | | |
| | | | | | | | | | | | | | | | | | | | | | | | | | | | | |
| | | | | | | | | | | | | | | | | | | | | | | | | | | | | |
Balance at September 30, 2016 |
104,495 | $ | 1,045 | 245 | $ | (1,133 | ) | $ | 381,223 | $ | (172,169 | ) | $ | (10,671 | ) | $ | 5,640 | $ | 203,935 | |||||||||
| | | | | | | | | | | | | | | | | | | | | | | | | | | | | |
| | | | | | | | | | | | | | | | | | | | | | | | | | | | | |
| | | | | | | | | | | | | | | | | | | | | | | | | | | | | |
Equity based compensation expense |
— | — | — | — | 1,634 | — | — | — | 1,634 | |||||||||||||||||||
Issuance of common stock |
864 | 9 | — | — | 5,512 | — | — | — | 5,521 | |||||||||||||||||||
Stock repurchases |
— | — | 124 | (1,076 | ) | — | — | — | — | (1,076 | ) | |||||||||||||||||
Dividends paid to noncontrolling interest |
— | — | — | — | — | — | — | (4,750 | ) | (4,750 | ) | |||||||||||||||||
Net loss |
— | — | — | — | — | (8,898 | ) | — | 2,348 | (6,550 | ) | |||||||||||||||||
Other comprehensive income |
— | — | — | — | — | — | 2,773 | — | 2,773 | |||||||||||||||||||
| | | | | | | | | | | | | | | | | | | | | | | | | | | | | |
Balance at June 30, 2017 |
105,359 | $ | 1,054 | 369 | $ | (2,209 | ) | $ | 388,369 | $ | (181,067 | ) | $ | (7,898 | ) | $ | 3,238 | $ | 201,487 | |||||||||
| | | | | | | | | | | | | | | | | | | | | | | | | | | | | |
| | | | | | | | | | | | | | | | | | | | | | | | | | | | | |
| | | | | | | | | | | | | | | | | | | | | | | | | | | | | |
See accompanying notes to these Consolidated Financial Statements
F-59
EWT HOLDINGS I CORP.
Unaudited Condensed Consolidated Statements of Changes in Cash Flows
(in thousands)
| |
Nine Months Ended June 30, 2016 |
Nine Months Ended June 30, 2017 |
|||||
|---|---|---|---|---|---|---|---|
Operating activities |
|||||||
Net income (loss) |
$ | 12,867 | $ | (6,550 | ) | ||
Reconciliation of net loss to cash flows from operating activities: |
|||||||
Depreciation and amortization |
50,986 | 55,813 | |||||
Amortization of deferred financing costs |
2,911 | 5,970 | |||||
Deferred income taxes |
(22,296 | ) | (107 | ) | |||
Share based compensation |
1,447 | 1,634 | |||||
(Gain) loss on sale of property, plant and equipment |
(93 | ) | 349 | ||||
Foreign currency losses (gains) on intracompany loans |
724 | (1,489 | ) | ||||
Changes in assets and liabilities |
|||||||
Accounts receivable |
8,563 | (6,454 | ) | ||||
Inventories |
(2,659 | ) | (7,964 | ) | |||
Cost and earnings in excess of billings on uncompleted contracts |
(6,577 | ) | (8,900 | ) | |||
Prepaids and other current assets |
(320 | ) | (9,139 | ) | |||
Accounts payable |
1,895 | (1,009 | ) | ||||
Accrued expenses and other liabilities |
(32,796 | ) | (10,678 | ) | |||
Billings in excess of costs incurred |
(12,656 | ) | 249 | ||||
Income taxes |
455 | (1,181 | ) | ||||
Other non-current assets and liabilities |
8,204 | 5,248 | |||||
| | | | | | | | |
Net cash provided by operating activities |
10,655 | 15,793 | |||||
| | | | | | | | |
Investing activities |
|||||||
Purchases of property, plant and equipment |
(34,717 | ) | (40,475 | ) | |||
Purchases of intangibles |
(246 | ) | (4,175 | ) | |||
Proceeds from sale of property, plant and equipment |
3,369 | 5,221 | |||||
Acquisitions, net of cash received of $11,486 and $3,335 |
(299,633 | ) | (77,837 | ) | |||
| | | | | | | | |
Net cash used in investing activities |
(331,227 | ) | (117,266 | ) | |||
| | | | | | | | |
Financing activities |
|||||||
Issuance of debt, net of deferred issuance costs |
176,854 | 152,902 | |||||
Borrowings under credit facility |
26,850 | 113,000 | |||||
Repayment of debt |
(12,971 | ) | (156,306 | ) | |||
Repayment of capital lease obligation |
(6,246 | ) | (4,842 | ) | |||
Proceeds from capital contribution |
6,895 | — | |||||
Proceeds from issuance of common stock |
10,283 | 5,521 | |||||
Stock repurchases |
(723 | ) | (1,076 | ) | |||
Distribution to noncontrolling interest |
(1,875 | ) | (4,750 | ) | |||
| | | | | | | | |
Net cash provided by financing activities |
199,067 | 104,449 | |||||
| | | | | | | | |
Effect of exchange rate changes on cash |
369 | 680 | |||||
| | | | | | | | |
Change in cash and cash equivalents |
(121,136 | ) | 3,656 | ||||
Cash and cash equivalents |
|||||||
Beginning of period |
169,027 | 50,362 | |||||
| | | | | | | | |
End of period |
$ | 47,891 | $ | 54,018 | |||
| | | | | | | | |
| | | | | | | | |
| | | | | | | | |
See accompanying notes to these Condensed Consolidated Financial Statements
F-60
EWT HOLDINGS I CORP.
Unaudited Supplemental Disclosure of Cash Flow Information
(in thousands)
| |
Nine Months Ended June 30, 2016 |
Nine Months Ended June 30, 2017 |
|||||
|---|---|---|---|---|---|---|---|
Supplemental disclosure of cash flow information |
|||||||
Cash paid for taxes |
$ | 3,727 | $ | 2,335 | |||
Cash paid for interest |
$ | 25,434 | $ | 31,546 | |||
Non-cash investing and financing activities |
|||||||
Accrued earnout related to acquisitions |
— | $ | 4,871 | ||||
Capital lease transactions |
$ | 4,709 | $ | 12,686 | |||
Cloud computing related intangible transaction |
$ | — | $ | 5,544 | |||
See accompanying notes to these Condensed Consolidated Financial Statements
F-61
Notes to Unaudited Condensed Consolidated Financial Statements
(in thousands)
September 30, 2016 and June 30, 2017
1. Description of the Company and Basis of Presentation
The Business
EWT Holdings I Corp. (herein referred to as "EWT" or the "Company") provides a wide range of product brands and advanced water and wastewater treatment systems and technologies, as well as mobile and emergency water supply solutions and service contract options through its segment's branch network. Headquartered in Pittsburgh, Pennsylvania, EWT is a multi-national corporation with operations in the United States, Canada, the United Kingdom, the Netherlands, Italy, Germany, Australia, China, and Singapore.
The Company is organizationally structured into three reportable segments for the purpose of making operational decisions and assessing financial performance: (i) Industrial, (ii) Products and (iii) Municipal.
Basis of Presentation
These unaudited condensed consolidated financial statements have been prepared in accordance with U.S generally accepted accounting principles (U.S. GAAP) for interim financial reporting. Accordingly, they do not include all of the information and note disclosures required by U.S generally accepted accounting principles for the complete financial statements. In management's opinion, all adjustments (which include only normal recurring adjustments) considered necessary for a fair presentation have been included. These unaudited consolidated financial statements should be read in conjunction with the consolidated financial statements and notes thereto included in the Company's September 30, 2016 Annual Consolidated Financial Statements.
2. Summary of Significant Accounting Policies
Fiscal Year
The Company's fiscal year ends on September 30.
Use of Estimates
The consolidated financial statements have been prepared in conformity with U.S. GAAP and require management to make estimates and assumptions. These assumptions affect the reported amounts of assets and liabilities and disclosure of contingent assets and liabilities at the date of the consolidated financial statements and the reported amounts of revenue and expenses during the reporting period. Estimates and assumptions are used for, but not limited to: (i) revenue recognition; (ii) allowance for doubtful accounts; (iii) inventory valuation, asset valuations, impairment, and recoverability assessments; (iv) depreciable lives of assets; (v) useful lives of intangible assets; (vi) income tax reserves and valuation allowances; and (vii) product warranty and litigation reserves. Estimates are revised as additional information becomes available. Actual results could differ from these estimates.
Cash and Cash Equivalents
Cash and cash equivalents are liquid investments with an original maturity of three or fewer months when purchased.
F-62
Notes to Unaudited Condensed Consolidated Financial Statements (Continued)
(in thousands)
September 30, 2016 and June 30, 2017
2. Summary of Significant Accounting Policies (Continued)
Accounts Receivable
Receivables are primarily comprised of uncollected amounts owed to us from transactions with customers and are presented net of allowances for doubtful accounts. Allowances are estimated based on historical write-offs and the economic status of customers. The Company considers a receivable delinquent if it is unpaid after the term of the related invoice has expired. Write-offs are recorded at the time all collection efforts have been exhausted.
Inventories
Inventories are stated at the lower of cost or market, where cost is generally determined on the basis of an average or first-in, first-out (FIFO) method. Production costs comprise direct material and labor and applicable manufacturing overheads, including depreciation charges. The Company regularly reviews inventory quantities on hand and writes off excess or obsolete inventory based on estimated forecasts of product demand and production requirements. Manufacturing operations recognize cost of product sales using standard costing rates with overhead absorption which generally approximates actual cost.
Property, Plant, and Equipment
Property, plant, and equipment is valued at cost less accumulated depreciation and impairment losses. If the costs of certain components of an item of property, plant, and equipment are significant in relation to the total cost of the item, they are accounted for and depreciated separately. Depreciation expense is recognized using the straight-line method. Useful lives are reviewed annually and, if expectations differ from previous estimates, adjusted accordingly. Estimated useful lives for major classes of depreciable assets are as follows:
Asset Class
|
Estimated Useful Life | |
|---|---|---|
| Machinery and equipment | 3 to 20 years | |
| Buildings and improvements | 10 to 40 years |
Leasehold improvements are depreciated over the shorter of their estimated useful life or the term of the lease. Costs related to maintenance and repairs that do not extend the assets' useful life are expensed as incurred.
Goodwill and Other Intangible Assets
Goodwill represents purchase consideration paid in a business combination that exceeds the value assigned to the net assets of acquired businesses. Other intangible assets consist of customer-related intangibles, proprietary technology, software, trademarks and other intangible assets. The Company amortizes intangible assets with definite useful lives on a straight-line basis over their respective estimated economic lives which range from 1 to 26 years.
The Company reviews goodwill to determine potential impairment annually during the fourth quarter of the fiscal year, or more frequently if events and circumstances indicate that the asset might be impaired. Impairment testing for goodwill is performed at a reporting unit level. We have determined that we have four reporting units. Our quantitative impairment testing utilizes both a
F-63
Notes to Unaudited Condensed Consolidated Financial Statements (Continued)
(in thousands)
September 30, 2016 and June 30, 2017
2. Summary of Significant Accounting Policies (Continued)
market (guideline public company) and income (discounted cash flows) method for determining fair value. In estimating the fair value of the reporting unit utilizing a discounted cash flow ("DCF") valuation technique, we incorporate our judgment and estimates of future cash flows, future revenue and gross profit growth rates, terminal value amount, capital expenditures and applicable weighted-average cost of capital used to discount these estimated cash flows. The estimates and projections used in the estimate of fair value are consistent with our current budget and long-range plans, including anticipated change in market conditions, industry trend, growth rates and planned capital expenditures, among other considerations. If the carrying value of the reporting unit is greater than the fair value, the second step is performed, where the implied fair value of goodwill is compared to its carrying value.
Impairment of Long-Lived Assets
Long-lived assets, such as property, plant, and equipment, and purchased intangibles subject to amortization, are reviewed for impairment whenever events or changes in circumstances indicate that the carrying amount of an asset or asset group may not be recoverable. Recoverability of the asset or asset group is measured by comparison of its carrying amount to undiscounted future net cash flows the asset or asset group is expected to generate. If the carrying amount of an asset or asset group is not recoverable, the Company recognizes an impairment loss based on the excess of the carrying amount of the asset or asset group over its respective fair value which is generally determined as the present value of estimated future cash flows or as the appraised value.
Debt Issuance Costs and Debt Discounts
Debt issuance costs are capitalized and amortized over the contractual term of the underlying debt using the effective interest method. Debt discounts and lender arrangement fees deducted from the proceeds have been included as a component of the carrying value of debt and are being amortized to interest expense using the effective interest method.
Amortization of debt issuance costs and debt discounts/premiums included in interest expense were $2,911 and $4,376 for the nine months ended June 30, 2016 and 2017, respectively. Additionally, in October of 2016, the Company wrote off $2,075 of deferred financing fees related to the extinguishment of debt and incurred another $481 of fees related to a tack-on financing the Company completed on October 28, 2016. These amounts are included in interest expense during the nine months ended June 30, 2017.
Revenue Recognition
Sales of goods and services are recognized when persuasive evidence of an arrangement exists, the price is fixed or determinable, collectability is reasonably assured and delivery has occurred or services have been rendered.
For sales of aftermarket parts or products with a low level of customization and engineering time, the Company recognizes revenues at the time title and risks and rewards of ownership pass, which is generally when products are shipped or delivered to the customer as the Company has no obligation for installation. Sales of short-term service arrangements are recognized as the services are performed,
F-64
Notes to Unaudited Condensed Consolidated Financial Statements (Continued)
(in thousands)
September 30, 2016 and June 30, 2017
2. Summary of Significant Accounting Policies (Continued)
and sales of long-term service arrangements are typically recognized on a straight-line basis over the life of the agreement.
For certain arrangements where there is significant customization to the product, the Company recognizes revenue under the provisions of Accounting Standards Codification (ASC) 605-35, Revenue Recognition—Construction-Type and Production-Type Contracts. These products include large capital water treatment projects, systems and solutions for municipal and industrial applications. Revenues from construction-type contracts are generally recognized under the percentage-of-completion method, based on the input of costs incurred to date as a percentage of total estimated contract costs. The nature of the contracts are generally fixed price with milestone billings. Contract revenues and cost estimates are reviewed and revised quarterly at a minimum and the cumulative effect of such adjustments are recognized in current operations. The amount of such adjustments have not been material.
During the nine months ended June 30, 2016 and 2017, respectively, approximately $154,896 and $168,030 of revenues from construction-type contracts were recognized on the percentage-of-completion method. Cost and earnings in excess of billings under construction-type arrangements are recorded when contracts have net asset balances where contract costs plus recognized profits less recognized losses exceed progress billings. Billings in excess of costs incurred are recorded when contract progress billings exceed costs and recognized profit less recognized losses.
During the nine months ended June 30, 2016 and 2017, respectively, approximately $25,183 and $21,353 of revenues from construction-type contracts were recognized on a completed contract method, which is typically when the product is delivered and accepted by the customer. The completed contract method is principally used when the contract is short in duration (generally less than twelve months) and where results of operations would not vary materially from those resulting from the use of the percentage-of-completion method.
Product Warranties
Accruals for estimated expenses related to warranties are made at the time products are sold and are recorded as a component of Cost of product sales in the Consolidated Statements of Operations. The estimated warranty obligation is based on product warranty terms offered to customers, ongoing product failure rates, material usage and service delivery costs expected to be incurred in correcting a product failure, as well as specific obligations for known failures and other currently available evidence. The Company assesses the adequacy of the recorded warranty liabilities on a regular basis and adjusts amounts as necessary.
Shipping and Handling Cost
Shipping and handling costs are included as a component of cost of sales.
Income Taxes
The Company recognizes deferred tax assets and liabilities for the future tax consequences attributable to differences between the financial statement carrying amounts of existing assets and liabilities and their respective tax bases. Deferred tax assets and liabilities are measured using enacted
F-65
Notes to Unaudited Condensed Consolidated Financial Statements (Continued)
(in thousands)
September 30, 2016 and June 30, 2017
2. Summary of Significant Accounting Policies (Continued)
tax rates expected to apply to taxable income in the years in which those temporary differences are expected to be recovered or settled. The effect on deferred tax assets and liabilities of a change in tax rates is recognized in income in the period that included the enactment date. Valuation allowances are provided against deferred tax assets when it is deemed more likely than not that some portion or all of the deferred tax asset will not be realized within a reasonable time period. We assess tax positions using a two-step process. A tax position is recognized if it meets a more-likely-than-not threshold, and is measured at the largest amount of benefit that is greater than 50.0% percent of being realized. Uncertain tax positions are reviewed each balance sheet date. Liabilities recorded as a result of this analysis are classified as current or long-term based on the timing of expected payment.
Sales Taxes
Upon collection of sales tax from revenue, the amount of sales tax is placed into an accrued liability account. This liability is then relieved when the payment is sent to the proper government jurisdiction.
Foreign Currency Translation and Transactions
The functional currency for the international subsidiaries is the local currency. Assets and liabilities are translated into U.S. Dollars using current rates of exchange, while revenues and expenses are translated at the weighted-average exchange rate for the period. The resulting translation adjustments are recorded in other comprehensive income within shareholders' equity.
Foreign currency transaction gains (losses) aggregated $1,321 and $(1,663) for the nine months ended June 30, 2016 and 2017, respectively, and are primarily included in General and administrative expenses in the Consolidated Statements of Operations.
Research and Development Costs
Research and development costs are expensed as incurred.
Equity-based Compensation
The Company measures the cost of awards of equity instruments to employees based on the grant-date fair value of the award. Given the absence of a public trading market for our common stock, the fair value of the common stock underlying our share-bank awards was determined by our board, with input from management, in each case using net income and market valuation approach. Stock options are granted with exercise prices equal to or greater than the estimated fair market value on the date of grant as authorized by our compensation committee. The grant-date fair value is determined using the Black-Scholes model. The fair value, net of estimated forfeitures, is amortized as compensation cost on a straight-line basis over the vesting period primarily as a component of General and administrative expenses.
Retirement Benefits
The Company applies, ASC Topic 715, Compensation—Retirement Benefits, which requires the recognition in pension obligations and accumulated other comprehensive income of actuarial gains or
F-66
Notes to Unaudited Condensed Consolidated Financial Statements (Continued)
(in thousands)
September 30, 2016 and June 30, 2017
2. Summary of Significant Accounting Policies (Continued)
losses, prior service costs or credits and transition assets or obligations that have previously been deferred. The determination of retirement benefit pension obligations and associated costs requires the use of actuarial computations to estimate participant plan benefits to which the employees will be entitled. The significant assumptions primarily relate to discount rates, expected long-term rates of return on plan assets, rate of future compensation increases, mortality, years of service, and other factors. The Company develops each assumption using relevant experience in conjunction with market-related data for each individual country in which such plans exist. All actuarial assumptions are reviewed annually with third-party consultants and adjusted as necessary. For the recognition of net periodic postretirement cost, the calculation of the expected return on plan assets is generally derived by applying the expected long-term rate of return on the market-related value of plan assets. The fair value of plan assets is determined based on actual market prices or estimated fair value at the measurement date.
Restructuring and Related Charges
The Company accounts for costs associated with exit or disposal in accordance with ASC 420, Exit or Disposal Cost Obligations, which requires that (i) liabilities associated with exit and disposal activities be measured at fair value; (ii) onetime termination benefits be expensed at the date the entity notifies the employee, unless the employee must provide future service, in which case the benefits are expensed ratably over the future service period; (iii) liabilities related to an operating lease/contract be recognized and measured at its fair value when the contract does not have any future economic benefit to the entity (i.e., the entity ceases to utilize the rights conveyed by the contract); and (iv) for typically all other costs related to an exit or disposal activity to be expensed as incurred.
Treated Water Outsourcing
Treated Water Outsourcing (TWO) is a joint venture between the Company and the Ondeo Nalco Company (Nalco) to sell water management equipment and services to industrial customers located throughout the United States.
On October 1, 2015, a change occurred in the partnership structure of TWO such that the Company is now obligated to absorb all risk of loss up to 100% of the joint venture partner's equity. As such, the accounting for the Company's 50% interest changed from equity method investment to full consolidation as a variable interest entity (VIE) under ASC 810, Consolidation.
The following provides a summary of TWO as of September 30, 2016 and June 30, 2017. The Company has not provided additional financial support to this entity which it is not contractually
F-67
Notes to Unaudited Condensed Consolidated Financial Statements (Continued)
(in thousands)
September 30, 2016 and June 30, 2017
2. Summary of Significant Accounting Policies (Continued)
required to provide, and the Company does not have the ability to use the assets of TWO to settle obligations of the Company's other subsidiaries.
| |
September 30, 2016 |
June 30, 2017 |
|||||
|---|---|---|---|---|---|---|---|
Current Assets (including $7,370 and $3,859) |
9,048 | 10,864 | |||||
Property, Plant and Equipment |
8,481 | 6,594 | |||||
Goodwill |
2,206 | 2,206 | |||||
Other noncurrent assets |
8,229 | 525 | |||||
Total liabilities |
(16,684 | ) | (13,713 | ) | |||
| |
Nine months ended | ||||||
|---|---|---|---|---|---|---|---|
| |
June 30, 2016 |
June 30, 2017 |
|||||
Total revenues |
$ | 12,372 | $ | 11,645 | |||
Total expenses |
10,080 | 8,857 | |||||
| | | | | | | | |
Income from operations |
$ | 2,292 | $ | 2,788 | |||
| | | | | | | | |
| | | | | | | | |
| | | | | | | | |
Accounting Pronouncements Not Yet Adopted
In May 2014, the FASB issued ASU No. 2014-09, Revenue from Contracts with Customers (Topic 606). ASU No. 2014-09 clarifies the principles for recognizing revenue when an entity either enters into a contract with customers to transfer goods or services or enters into a contract for the transfer of non-financial assets. ASU 2014-09 may be adopted using either of two acceptable methods: (1) retrospective adoption to each prior period presented with the option to elect certain practical expedients; or (2) adoption with the cumulative effect recognized at the date of initial application and providing certain disclosures. To assess at which time revenue should be recognized, an entity should use the following steps: (1) identify the contract(s) with a customer; (2) identify the performance obligations in the contract; (3) determine the transaction price; (4) allocate the transaction price to the performance obligations in the contract; and (5) recognize revenue when, or as, the entity satisfies a performance obligation. The standard is effective for the Company for the quarter ending December 31, 2018. The Company has engaged a third party to assist in assessing the impact adoption of this guidance will have on its consolidated financial statements.
In February 2016, the FASB issued ASU No. 2016-02, Leases (Topic 842). ASU No. 2016-02 requires recognition of operating leases as lease assets and liabilities on the balance sheet, and disclosure of key information about leasing arrangements. ASU No. 2016-02 will be effective retrospectively for the Company for the quarter ending December 31, 2019, with early adoption permitted. The Company is currently assessing the impact adoption of this guidance will have on its consolidated financial statements.
In March 2016, the FASB issued (ASU) 2016-09, Improvements to Employee Share-Based Payment Accounting, which amends ASC Topic 718, Compensation—Stock Compensation. The ASU includes provisions intended to simplify various aspects related to how share-based payments are accounted for and presented in the financial statements. ASU No. 2016-09 will be effective for the Company for the
F-68
Notes to Unaudited Condensed Consolidated Financial Statements (Continued)
(in thousands)
September 30, 2016 and June 30, 2017
2. Summary of Significant Accounting Policies (Continued)
quarter ending December 31, 2017. This update is not expected to have an impact on the Company's consolidated financial statements.
In January 2017, the FASB issued ASU 2017-04, Simplifying the Test for Goodwill Impairment. This ASU simplifies how an entity is required to test goodwill for impairment by eliminating Step 2 from the goodwill impairment test. Step 2 measures a goodwill impairment loss by comparing the implied value of a reporting unit's goodwill with the carrying amount of that goodwill. The amendments in this ASU are effective for the Company for the quarter ending December 31, 2020. The Company does not expect this to have a material impact on the Consolidated Financial Statements.
In August 2016, the FASB issued ASU 2016-16, Statement of Cash Flows (Topic 230): Classification of Certain Cash Receipts and Cash Payments (a consensus of the Emerging Issues Task Force). This new guidance is intended to reduce diversity in practice in how certain transactions are classified in the statement of cash flows. ASU No. 2016-15 will be effective for the Company for the quarter ending December 31, 2017, with early adoption permitted. The guidance should be applied retrospectively to all periods presented, unless deem impracticable, in which case prospective application is permitted. The Company is currently evaluating the potential impact of adoption on the Company's Consolidated Financial Statements.
In May 2017, the FASB issued ASU 2017-09, Scope of Modification Accounting, which amended Accounting Standards Code Topic 718. FASB issued ASU 2017-09 to reduce the cost and complexity when applying Topic 718 and standardize the practice of applying Topic 718 to financial reporting. The ASU was not developed to fundamentally change the definition of a modification, but instead to provide guidance for what changes would qualify as a modification. ASU No. 2017-09 will be effective for the Company for the quarter ending December 31, 2018. The Company is currently evaluating the potential impact of adoption on the Company's Consolidated Financial Statements.
3. Acquisitions and Divestitures
Acquisitions support the Company's strategy of delivering a broad solutions portfolio with robust technology across multiple geographies and end markets. The following acquisitions were made during the year ending September 30, 2016:
On April 11, 2016, the Company acquired 100% of privately held Magneto, a leader in the development and manufacture of anodes for the electrochemical industry and refurbishment of electro chlorination cells for seawater electrolysis, for €23,585 (approximately $26,729). As a result of the acquisition, approximately $700 of acquisition costs were incurred which are included in General and administrative expenses. The company has approximately 120 employees across its two locations in Schiedam, the Netherlands and Suzhou, China. Magneto is included in the results of the Products segment of the Company.
On April 15, 2016, the Company acquired 100% of privately held Neptune-Benson, a leading manufacturer of high-quality water filtration and disinfection products for the recreational, industrial, and municipal water markets for $283,704, less cash received of $2,357, of which $185,000 was funded through newly acquired debt, $8,950 was contributed capital in the form of equity provided to the sellers, and the remaining was paid with cash. The Company incurred approximately $2,099 of acquisition costs, which are included in General and administrative expenses. The company has approximately 110 employees across its United States and Canadian locations. Neptune Benson is included in the results the Products segment of the Company.
F-69
Notes to Unaudited Condensed Consolidated Financial Statements (Continued)
(in thousands)
September 30, 2016 and June 30, 2017
3. Acquisitions and Divestitures (Continued)
The following table presents the unaudited pro forma results for the nine months ended June 30, 2016. The unaudited pro forma financial information combines the results of operations of EWT and Neptune Benson as though the Company had been combined as of October 1, 2015, and the pro forma information is presented for informational purposes only and is not indicative of the results of operations that would have been achieved if the acquisition had taken place at such time. The unaudited pro forma results presented below include adjustments for increased fair value of acquired intangible assets and related amortization charges, acquisition costs, and interest.
| |
Nine months ended | ||||||
|---|---|---|---|---|---|---|---|
| |
June 30, 2016(a) |
June 30, 2017(b) |
|||||
Total revenues |
$ | 851,981 | $ | 890,916 | |||
Net (loss) income attributable to EWT Holdings I Corp. |
16,741 | (8,898 | ) | ||||
- (a)
- Proforma
combined
- (b)
- Nine months ended June 30, 2017 will be equivalent to the results in the Condensed Consolidated Statements of Operations
On July 1, 2016, the Company acquired essentially all of the assets of Valve and Filtration Systems, Ltd (VAF) through its recently acquired Neptune Benson business for approximately $3,317; $2,667 cash at closing, in addition to earn out payments over the next five years. Included in consideration is $650, which represents the fair value of the earn outs at the date of the acquisition, with a maximum earnout payment of $1,000. VAF is a leading screen filtration manufacturer based in Arvada, Colorado, and has 12 employees. VAF's results are included within the Products segment of the Company.
On August 3, 2016, the Company acquired 100% of Delta Ultraviolet Corporation (Delta UV), a leading manufacturer and marketer of UV-C technology in North America, through the recently acquired Neptune Benson business for $4,813. The Company incurred approximately $100 of acquisition costs, included in General and administrative expenses. Delta UV is based in Gardena, California and had 17 employees. Delta's results are included within the Products segment of the Company.
F-70
Notes to Unaudited Condensed Consolidated Financial Statements (Continued)
(in thousands)
September 30, 2016 and June 30, 2017
3. Acquisitions and Divestitures (Continued)
The above acquisitions were done to support the Company's growth plan. The opening balance sheets for the above acquisitions are as follows:
| |
Magneto | Neptune Benson | VAF | Delta | Total | |||||||||||
|---|---|---|---|---|---|---|---|---|---|---|---|---|---|---|---|---|
Current Assets |
12,240 | 29,521 | 2,287 | 2,268 | 46,316 | |||||||||||
Property, plant and equipment |
2,323 | 2,480 | 37 | 518 | 5,358 | |||||||||||
Goodwill |
7,981 | 143,680 | 400 | 1,257 | 153,318 | |||||||||||
Other intangible assets |
9,401 | 149,127 | 1,190 | 1,970 | 161,688 | |||||||||||
Other noncurrent assets |
— | 3,576 | — | — | 3,576 | |||||||||||
| | | | | | | | | | | | | | | | | |
Total asset acquired |
31,945 | 328,384 | 3,914 | 6,013 | 370,256 | |||||||||||
Total liabilities assumed |
(5,216 | ) | (44,680 | ) | (597 | ) | (1,200 | ) | (51,693 | ) | ||||||
| | | | | | | | | | | | | | | | | |
Net assets acquired |
26,729 | 283,704 | 3,317 | 4,813 | 318,563 | |||||||||||
| | | | | | | | | | | | | | | | | |
| | | | | | | | | | | | | | | | | |
| | | | | | | | | | | | | | | | | |
On September 30, 2016, the Company sold the assets of an Industrial location in Vernon, California. The Company received $4,547 for this sale, and recognized a gain of $3,700 which is included as a gain on sale of assets within the Other operating income section of the Consolidated Statements of Operations and Comprehensive Loss. The major classes of assets and liabilities that were included in this sale were Receivables of $989, Property, plant and equipment of $717, Accrued expenses of $496 and Accounts Payable of $386.
The following acquisitions were made during the nine months ended June 30, 2017:
On November 1, 2016, the Company acquired Environmental Treatment Services, Inc (ETS), a leading provider of engineered solutions to the industrial wastewater market based in Acworth, GA for $10,730. ETS had ten employees as of the date of acquisition. The Company incurred approximately $16 of acquisition costs, which are included in General and administrative expenses. ETS was acquired to support the Company's growth plan and is included within the Industrial segment of the Company.
On May 9, 2017, the Company acquired the assets of Noble Water Technologies, a leader in high purity water systems and service, located in Dallas, TX for $7,634; $5,915 cash at closing in addition to earn out payments over the next twelve months. Included in consideration is $1,719, which represents the fair value of the earn outs at the date of the acquisition, with a maximum earnout payment of $2,366. The Company incurred approximately $116 of acquisition costs, which are included in General and administrative expenses. Noble's results are included within the Products segment of the Company.
On June 30, 2017, the Company acquired ADI Systems North America Inc., Geomembrane Technologies Inc., and Lange Containment Systems, Inc. (collectively, "ADI") from ADI Group Inc for a total of CAD 71,414 ($54,937); CAD 67,320 ($51,785) cash at closing and the fair value of the earnout payments of CAD 4,094 ($3,152) at the date of acquisition. The cash paid at closing was initially funded through borrowings under the credit facility, which was subsequently paid off through the August 8, 2017 First lien facility amendment. The maximum amount payable under the earnouts is CAD 7,480 ($5,760) if certain performance metrics are acheived over a period of twenty-four months. The three are world leaders in wastewater solutions for industrial and manufacturing applications, primarily based in Fredericton, New Brunswick. ADI offers a wide range of technologies tailored to its customer base around the world in anaerobic digestion, aerobic treatment, and biogas treatment. They
F-71
Notes to Unaudited Condensed Consolidated Financial Statements (Continued)
(in thousands)
September 30, 2016 and June 30, 2017
3. Acquisitions and Divestitures (Continued)
also provide green energy recovery and water reuse technologies as well as industrial wastewater cover liners and containment systems. Combined, ADI has more than 260 customers in 35 countries. ADI's results are included within the Industrial segment of the Company. The Company incurred approximately $109 of acquisition costs, which are included in General and administrative expenses.
On June 30, 2017, the Company acquired Olson Irrigation Systems, a leading designer and producer of filters and irrigation components for the agriculture and industrial markets, based in Santee, California, for $9,406. Olson is part of the Company's Product segment and will help the business build upon its leadership in filtration serving a broad range of industrial applications. The Company incurred approximately $140 of acquisition costs, which are included in General and administrative expenses.
The preliminary opening balance sheet for the acquisitions is summarized as follows:
| |
ETS | Noble | ADI | Olson | Total | |||||||||||
|---|---|---|---|---|---|---|---|---|---|---|---|---|---|---|---|---|
Current Assets |
$ | 782 | $ | 618 | $ | 14,579 | $ | 2,417 | $ | 18,396 | ||||||
Property, plant and equipment |
376 | 256 | 719 | 593 | 1,944 | |||||||||||
Goodwill |
5,619 | 4,135 | 34,734 | 3,566 | 48,054 | |||||||||||
Other intangible assets |
3,953 | 2,916 | 13,244 | 3,263 | 23,376 | |||||||||||
| | | | | | | | | | | | | | | | | |
Total asset acquired |
10,730 | 7,925 | 63,276 | 9,839 | 91,770 | |||||||||||
Total liabilities assumed |
— | (291 | ) | (8,339 | ) | (433 | ) | (9,063 | ) | |||||||
| | | | | | | | | | | | | | | | | |
Net assets acquired |
$ | 10,730 | $ | 7,634 | $ | 54,937 | $ | 9,406 | $ | 82,707 | ||||||
| | | | | | | | | | | | | | | | | |
| | | | | | | | | | | | | | | | | |
| | | | | | | | | | | | | | | | | |
4. Fair Value Measurements
As of September 30, 2016 and June 30, 2017, the fair values of cash and cash equivalents, accounts receivable and accounts payable approximate carrying values due to the short maturity of these items.
The Company measures the fair value of pension plan assets and liabilities, deferred compensation plan assets and liabilities and long-term debt on a recurring basis pursuant to ASC Topic 820. ASC Topic 820 establishes a three-tier fair value hierarchy, which prioritizes the inputs used in measuring fair value. These tiers include:
Level 1: Quoted prices for identical instruments in active markets.
Level 2: Quoted prices for similar instruments in active markets; quoted prices for identical or similar instruments in markets that are not active; and model-derived valuations whose inputs are observable or whose significant value driver is observable.
Level 3: Unobservable inputs in which little or no market data is available, therefore requiring an entity to develop its own assumptions.
F-72
Notes to Unaudited Condensed Consolidated Financial Statements (Continued)
(in thousands)
September 30, 2016 and June 30, 2017
4. Fair Value Measurements (Continued)
The following table presents the Company's financial assets and liabilities at fair value:
| |
Net Asset Value |
Quoted Market Prices in Active Markets (Level 1) |
Significant Other Observable Inputs (Level 2) |
Significant Unobservable Inputs (Level 3) |
|||||||||
|---|---|---|---|---|---|---|---|---|---|---|---|---|---|
As of September 30, 2016 |
|||||||||||||
Assets: |
|||||||||||||
Pension plan |
|||||||||||||
Cash |
$ | — | $ | 15,048 | $ | — | $ | — | |||||
Government Securities |
3,240 | — | — | — | |||||||||
Liability Driven Investment |
3,051 | — | — | — | |||||||||
Guernsey Unit Trust |
819 | — | — | — | |||||||||
Global Absolute Return |
2,028 | — | — | — | |||||||||
Deferred compensation plan assets |
|||||||||||||
Trust Assets |
2,145 | — | — | ||||||||||
Insurance |
— | 15,918 | — | ||||||||||
Liabilities: |
|||||||||||||
Pension plan |
— | — | (36,944 | ) | — | ||||||||
Deferred compensation plan liabilities |
— | — | (20,080 | ) | — | ||||||||
Long-term debt |
— | — | (771,560 | ) | — | ||||||||
As of June 30, 2017 |
|||||||||||||
Assets: |
|||||||||||||
Pension plan |
|||||||||||||
Cash |
$ | — | $ | 15,191 | $ | — | $ | — | |||||
Government Securities |
3,129 | — | — | — | |||||||||
Liability Driven Investment |
4,920 | — | — | — | |||||||||
Guernsey Unit Trust |
886 | — | — | — | |||||||||
Global Absolute Return |
2,025 | — | — | — | |||||||||
Deferred compensation plan assets |
|||||||||||||
Trust Assets |
— | 1,532 | — | — | |||||||||
Insurance |
— | — | 16,927 | — | |||||||||
Liabilities: |
|||||||||||||
Pension plan |
— | — | (36,285 | ) | — | ||||||||
Deferred compensation plan liabilities |
— | — | (20,375 | ) | — | ||||||||
Long-term debt |
— | — | (825,956 | ) | — | ||||||||
Long term debt is accounted for at book value.
The pension plan assets and liabilities and deferred compensation assets and liabilities are included in Other non-current assets and Other non-current liabilities at September 30, 2016 and June 30, 2017.
F-73
Notes to Unaudited Condensed Consolidated Financial Statements (Continued)
(in thousands)
September 30, 2016 and June 30, 2017
5. Accounts Receivable
Accounts receivable are summarized as follows:
| |
September 30, 2016 |
June 30, 2017 |
|||||
|---|---|---|---|---|---|---|---|
Accounts Receivable |
$ | 189,573 | $ | 206,060 | |||
Allowance for Doubtful Accounts |
(4,784 | ) | (3,591 | ) | |||
| | | | | | | | |
|
$ | 184,789 | $ | 202,469 | |||
| | | | | | | | |
| | | | | | | | |
| | | | | | | | |
6. Inventories
The major classes of inventory, net are as follows:
| |
September 30, 2016 |
June 30, 2017 |
|||||
|---|---|---|---|---|---|---|---|
Raw materials and supplies |
$ | 60,363 | $ | 65,951 | |||
Work in progress |
17,039 | 17,042 | |||||
Finished goods and products held for resale |
39,961 | 47,133 | |||||
Costs of unbilled projects |
5,825 | 5,474 | |||||
Advance payment from customers |
(655 | ) | (754 | ) | |||
Reserves for excess and obsolete |
(10,141 | ) | (11,340 | ) | |||
| | | | | | | | |
|
$ | 112,392 | $ | 123,506 | |||
| | | | | | | | |
| | | | | | | | |
| | | | | | | | |
7. Property, Plant, and Equipment
Property, plant, and equipment consists of the following:
| |
September 30, 2016 |
June 30, 2017 |
|||||
|---|---|---|---|---|---|---|---|
Machinery and equipment |
$ | 264,302 | $ | 311,939 | |||
Land and buildings |
79,423 | 81,075 | |||||
Construction in process |
27,388 | 31,949 | |||||
| | | | | | | | |
|
371,113 | 424,963 | |||||
Less: accumulated depreciation |
(114,348 | ) | (153,133 | ) | |||
| | | | | | | | |
|
$ | 256,765 | $ | 271,830 | |||
| | | | | | | | |
| | | | | | | | |
| | | | | | | | |
Depreciation expense, including depreciation expense for capital leases, was $38,147 and $38,645 for the nine months ended June 30, 2016 and 2017, respectively. Maintenance and repair expense was $16,133 and $15,905 for the nine months ended June 30, 2016 and 2017, respectively.
F-74
Notes to Unaudited Condensed Consolidated Financial Statements (Continued)
(in thousands)
September 30, 2016 and June 30, 2017
8. Goodwill
Changes in the carrying amount of goodwill are as follows:
| |
September 30, 2016 | June 30, 2017 | |||||
|---|---|---|---|---|---|---|---|
Balance at beginning of period |
$ | 113,583 | $ | 267,643 | |||
Business combinations |
153,890 | 48,054 | |||||
Measurement period adjustment |
(247 | ) | (572 | ) | |||
Foreign currency translation |
417 | 2,268 | |||||
| | | | | | | | |
Balance at end of period |
$ | 267,643 | $ | 317,393 | |||
| | | | | | | | |
| | | | | | | | |
| | | | | | | | |
The measurement period adjustment for the year ended September 30, 2016 is related to the finalization of the valuation of the United Kingdom (UK) pension plan assets and liabilities, including consideration of deferred taxes. The measurement period adjustment for nine months ended June 30, 2017 is related to the finalization of the valuation of the Magneto and Delta acquisitions.
As of September 30, 2016 and June 30, 2017, $129,083 and $137,461, respectively, of goodwill is deductible for tax purposes.
9. Debt
Long-term debt consists of the following:
| |
September 30, 2016 | June 30, 2017 | |||||
|---|---|---|---|---|---|---|---|
First Lien Term Facility, due January 15, 2021 |
$ | 491,113 | $ | 636,003 | |||
Second Lien Term Facility, due January 15, 2022 |
75,000 | — | |||||
Incremental First Lien Facility, due January 15, 2021 |
184,075 | 182,688 | |||||
Revolving Credit Facility, due January 15, 2019 |
18,000 | 60,000 | |||||
Build Own Operate Financing, due June 30, 2024 |
— | 7,100 | |||||
Notes Payable, due June 30, 2018 to July 31, 2023 |
11,223 | 7,414 | |||||
| | | | | | | | |
Total debt |
779,411 | 893,205 | |||||
Less unamortized discount and lender fees |
(21,255 |
) |
(19,484 |
) |
|||
| | | | | | | | |
Total net debt |
758,156 | 873,721 | |||||
Less current portion |
(30,024 |
) |
(73,093 |
) |
|||
| | | | | | | | |
Total long-term debt |
$ | 728,132 | $ | 800,628 | |||
| | | | | | | | |
| | | | | | | | |
| | | | | | | | |
Term Facilities and Revolving Credit Facility
On January 15, 2014, EWT Holdings III Corp. entered into First and Second Lien Term Loan Agreements (the "Term Loan Agreements") among the Company, the lenders party thereto and Credit Suisse AG as Administrative Agent and Collateral Agent. The Term Loan Agreements provided seven-year term loan facilities, consisting of the First Lien Term Loan and Second Lien Term Loan in aggregate principal amounts of $505,000 and $75,000, respectively. The First Lien Term Loan Agreement also made available to the Company a $75,000 revolving credit facility ("The Revolver"),
F-75
Notes to Unaudited Condensed Consolidated Financial Statements (Continued)
(in thousands)
September 30, 2016 and June 30, 2017
9. Debt (Continued)
which contains a Letter of Credit sub-facility up to $35,000. These borrowings were issued at a discount to face value of .5% aggregating $2,900 and net of lender arrangement fees aggregating $16,700. Additional capitalized financing fees, including lender fees paid for the Revolving Credit Facility placement, aggregated $5,483. The First Lien Term Loan bears interest based on a variable rate subject to a 1% floor + 3.75% spread. As of June 30, 2017, the applicable First Lien Term Loan interest rate was 4.75%. First Lien principal and interest is payable in quarterly installments, with quarterly principal reductions of $1,648, and the balance due at maturity.
In April, 2016 the Company issued an Incremental First Lien Term Loan (the "Incremental First Lien"), in an aggregate principal amount of $185,000, with a 1% discount. The proceeds of the Incremental First Lien facility were used to finance the acquisition of Neptune Benson. The Incremental First Lien bears interest based on a variable rate subject to a 1% floor + 4.5% spread, with quarterly interest payments and principal reductions of $462.5 through maturity. As of June 30, 2017, the applicable Incremental First Lien interest rate was 5.65%. The Incremental Term Loan is coterminous with the existing First Lien Term Loan. The Incremental First Lien borrowing issued in April, 2016 was issued at a discount to face value of 1%, aggregating $1,850. Additional capitalized financing fees associated with the transaction aggregated $4,446. Both of these amounts are included as a contra liability to debt and total $5,689 and $4,692, net of amortization, at September 30, 2016 and June 30, 2017, respectively.
On October 28, 2016, the Company completed a tack-on financing to the First Lien Term Loan for $150,000, issued at a 0.25% discount of $375. The Company also upsized the Revolving Credit Facility capacity by $20,000 through this transaction, resulting in total Revolving Credit capacity of $95,000. The Company incurred $4,264 of additional financing fees related to this transaction, of which $3,823 were capitalized and are included as a contra liability to debt on the balance sheet.
Proceeds from this transaction were used to repay $33,000 outstanding on the Revolving Credit Facility, and to extinguish the $75,000 Second Lien Term Loan facility. The Company had $2,075 of unamortized fees related to the Second Lien Term Loan facility outstanding on October 28, 2016, which were written off upon extinguishment of the Second Lien debt.
Total fees, net of amortization, were $15,566 related to the First and Second Lien Term Loans, as of September 30, 2016. Total fees, net of amortization, were $14,792 related to the First Lien Term Loan and Incremental First Lien Term Loan as of June 30, 2017. These fees were included as a contract liability to debt on the balance sheet.
On June 30, 2017, the Company completed a Build Own Operate financing for $7,100. The Company incurred $50 of additional financing fees related to this transaction, which have been capitalized and are included as a contra liability on the balance sheet. This financing fully amortizes over the seven year tenure and at an interest rate of one month LIBOR plus 300 basis points. At the time of entering into the loan, the company entered into a swap transaction for the duration of the loan fixing the obligation at a rate of 5.08% per annum. Principal obligations are $254 per quarter.
Borrowings under the Revolving Credit Facility bear interest at variable rates plus a margin ranging from 225 to 325 basis points, dependent upon The Company's leverage ratio and Variable Rate selected. Base Rate borrowings under the Revolving Credit Facility at June 30, 2017 would have incurred interest at 6.50%, calculated as the 225 basis point floor plus the Prime Rate of 3.75%. The
F-76
Notes to Unaudited Condensed Consolidated Financial Statements (Continued)
(in thousands)
September 30, 2016 and June 30, 2017
9. Debt (Continued)
weighted average interest rate on Revolver borrowings at September 30, 2016 was 4.66%. Base rate Revolver interest is calculated as the greatest of the Federal Funds Rate + 5 basis points, 1-Month LIBOR + 1%, or the Prime Rate, plus 225 basis points.
The Company has borrowing availability under the Revolving Credit Facility of $75,000 and $95,000 and at September 30, 2016 and June 30, 2017, respectively, reduced for outstanding letter of credit guarantees. Such letter of credit guarantees are subject to a $35,000 sublimit within the Revolving Credit Facility. The Company's outstanding letter of credit guarantees under this agreement aggregated approximately $9,742 and $7,476 at September 30, 2016 and June 30, 2017, respectively. As of September 30, 2016 and June 30, 2017, the Company had outstanding revolver borrowings of $18,000 and $60,000, with an unused portion of $47,258 and $27,524, respectively. The Company has issued additional letters of credit of $8,423 under a separate arrangement.
The Term Loan Agreement contains limitations on incremental borrowings, is subject to leverage ratios and allow for prepayment. Under certain circumstances beginning with fiscal 2015 results of operations, the Company may be required to remit excess cash flows as defined based upon exceeding certain leverage ratios. The Company did not exceed such ratios during fiscal 2016, does not anticipate exceeding such ratios during 2017, and therefore does not anticipate any additional repayments during 2017.
Notes Payable
As of September 30, 2016 and June 30, 2017, the Company had notes payable in an aggregate outstanding amount of $11,223 and $7,414, with interest rates ranging from 6.26% to 7.39%, and due dates ranging from June 30, 2018 to July 31, 2023. These notes are related to certain equipment related contracts and are secured by the underlying equipment and assignment of the related contracts.
Repayment Schedule
Aggregate maturities of all long-term debt, including current portion of long-term debt and excluding capital lease obligations as of June 30, 2017, are presented below:
Fiscal Year |
||||
Remainder of 2017 |
$ | 63,679 | ||
2018 |
13,451 | |||
2019 |
9,979 | |||
2020 |
9,878 | |||
2021 |
792,704 | |||
Thereafter |
3,514 | |||
| | | | | |
Total |
$ | 893,205 | ||
| | | | | |
| | | | | |
| | | | | |
10. Product Warranties
The Company accrues warranty obligations associated with certain products as revenue is recognized. Provisions for the warranty obligations are based upon historical experience of costs
F-77
Notes to Unaudited Condensed Consolidated Financial Statements (Continued)
(in thousands)
September 30, 2016 and June 30, 2017
10. Product Warranties (Continued)
incurred for such obligations, adjusted for site-specific risk factors and as necessary, for current conditions and factors. There are significant uncertainties and judgments involved in estimating warranty obligations, including changing product designs, differences in customer installation processes and future claims experience which may vary from historical claims experience.
A reconciliation of the activity related to the accrued warranty, including both the current and long-term portions, is as follows:
| |
June 30, 2016 | June 30, 2017 | |||||
|---|---|---|---|---|---|---|---|
Balance at beginning of the period |
$ | 31,758 | $ | 23,309 | |||
Warranty provision for sales |
9,523 | 4,108 | |||||
Settlement of warranty claims |
(14,333 | ) | (9,701 | ) | |||
Foreign currency and other |
(438 | ) | (341 | ) | |||
| | | | | | | | |
Balance at end of the period |
$ | 26,510 | $ | 17,375 | |||
| | | | | | | | |
| | | | | | | | |
| | | | | | | | |
The decline in accrued warranty over the periods presented is attributable to improved product quality and better project execution, as well as the expiration of warranty periods for certain specific exposures related to discontinued products.
11. Restructuring and Related Charges
To better align its resources with its growth strategies and reduce the cost structure, the Company commits to restructuring plans as necessary. The Company initiated a Voluntary Separation Plan (VSP) during the year ending September 30, 2016. The VSP plan includes severance payments to employees as a result of streamlining business operations for efficiency, elimination of redundancies, and reorganizing business processes. The table below sets forth the amounts accrued for the restructuring components and related activity:
| |
June 30, 2016 | June 30, 2017 | |||||
|---|---|---|---|---|---|---|---|
Balance at beginning of the period |
$ | 1,814 | $ | 13,217 | |||
Restructuring charges |
8,121 | 22,095 | |||||
Cash payments |
(10,040 | ) | (28,904 | ) | |||
Other adjustments |
534 | (250 | ) | ||||
| | | | | | | | |
Balance at end of the period |
$ | 429 | $ | 6,158 | |||
| | | | | | | | |
| | | | | | | | |
| | | | | | | | |
The balances for accrued restructuring liabilities at June 30, 2016 and 2017 are recorded in Accrued expenses and other liabilities. Restructuring charges primarily represent severance charges. The Company expects to pay out the remaining amounts accrued as of June 30, 2017 during the year ending September 30, 2017, in addition to incurring another $663 during that same time period related to the VSP. The Company continues to evaluate restructuring activities that may result in additional charges in the future.
F-78
Notes to Unaudited Condensed Consolidated Financial Statements (Continued)
(in thousands)
September 30, 2016 and June 30, 2017
12. Employee Benefit Plans
The Company maintains multiple employee benefit plans, covering employees at certain non-U.S. locations.
Certain of the Company's employees in the UK were participants in a Siemen's defined benefit plan established for employees of a UK-based operation acquired by Siemens in 2004. The plan was frozen with respect to future service credits for active employees, however the benefit formula recognized future compensation increases.
The Company's employees in Germany also participate in a defined benefit plan. Assets equaling the plan's accumulated benefit obligation were transferred to a German defined benefit plan sponsored by the Company upon the acquisition of EWT from Siemens. The German entity also sponsors a defined benefit plan for a small group of employees located in France.
Pension expense for the nine months ended June 30, 2016 and 2017 for the German and UK plans were as follows:
| |
Nine months ended | ||||||
|---|---|---|---|---|---|---|---|
| |
June 30, 2016 | June 30, 2017 | |||||
Service Cost |
$ | 596 | $ | 802 | |||
Interest Cost |
337 | 246 | |||||
Expected return on plan assets |
(118 | ) | (121 | ) | |||
Amortization of actuarial losses |
94 | 563 | |||||
| | | | | | | | |
Pension expense for defined benefit plans |
$ | 910 | $ | 1,490 | |||
| | | | | | | | |
| | | | | | | | |
| | | | | | | | |
13. Income Taxes
The Company's effective tax rate (ETR) was 270.38% for the nine months ended June 30, 2016 and (4.70)% for the nine months ended June 30, 2017, respectively. During the nine months ended June 30, 2017, the increase in tax expense to the Company was the result of realizing tax expense in a jurisdiction that excludes certain items from the valuation allowance analysis. This caused the quarterly ETR to be significantly different from the Company's historical annual ETR.
14. Concentration of Credit Risk
The Company's cash and cash equivalents and accounts receivable are potentially subject to concentration of credit risk. Cash and cash equivalents are placed with financial institutions that management believes are of high credit quality. Accounts receivable are derived from revenue earned from customers located in the U.S. and internationally and generally do not require collateral. The Company's trade receivables do not represent a significant concentration of credit risk as of and for the periods ended September 30, 2016 and June 30, 2017 due to the wide variety of customers and markets into which products are sold and their dispersion across geographic areas. The Company does perform ongoing credit evaluations of its customers and maintains an allowance for potential credit losses on trade receivables. As of and for the periods ended June 30, 2016 and, 2017, no customer accounted for more than 10% of net sales or net accounts receivable.
The Company operates predominantly in seven countries worldwide and provides a wide range of proven product brands and advanced water and wastewater treatment technologies, mobile and emergency water supply solutions and service contract options through its Industrial, Municipal and Products segments. The Company is a multi-national business but its sales and operations are primarily in the U.S.
F-79
Notes to Unaudited Condensed Consolidated Financial Statements (Continued)
(in thousands)
September 30, 2016 and June 30, 2017
15. Related-Party Transactions
Transactions with Investors
The Company pays an advisory fee of $1,000 per quarter to AEA Investors (AEA), the private equity firm and ultimate majority shareholder. In addition, the Company reimburses AEA for normal and customary expenses incurred by AEA on behalf of the Company. The Company incurred expenses, excluding advisory fees, of $190 and $249 for the nine months ended June 30, 2016 and 2017, respectively. The amounts owed to AEA were $100 and $0 at September 30, 2016 and June 30, 2017, respectively, and were included in Accrued expenses and other liabilities.
Additionally, in order to facilitate the acquisition of Neptune Benson in April, 2016, the Company received an additional $6,895 of capital contribution from AEA that was used to fund the acquisition.
AEA, through two of its affiliated funds, is one of the lenders in the Incremental First Lien facility, with a commitment of $14.925 and $16.262 as of September 30, 2016 and June 30, 2017, respectively.
16. Commitments and Contingencies
Operating Leases
The Company occupies certain facilities and operates certain equipment and vehicles under non-cancelable lease arrangements. Lease agreements may contain lease escalation clauses and purchase and renewal options. The Company recognizes scheduled lease escalation clauses over the course of the applicable lease term on a straight-line basis in the Consolidated Statement of Operations.
Total rent expense was $6,276 and $5,657 for the nine months ended June 30, 2016 and 2017, respectively. Future minimum aggregate rental payments under non-cancelable operating leases are as follows:
Fiscal Year |
||||
Remainder of 2017 |
3,047 | |||
2018 |
10,497 | |||
2019 |
8,262 | |||
2020 |
6,450 | |||
2021 |
3,758 | |||
Thereafter |
19,453 | |||
| | | | | |
Total |
$ | 51,467 | ||
| | | | | |
| | | | | |
| | | | | |
Capital Leases
The Company leases certain equipment under leases classified as capital leases. The leased equipment is depreciated on a straight line basis over the life of the lease and is included in depreciation expense. The gross and net carrying values of the equipment under capital leases were $29,261 and $22,788, respectively, as of September 30, 2016 and $41,947 and $29,920, respectively, as of June 30, 2017 and are recorded in Property, plant and equipment, net.
F-80
Notes to Unaudited Condensed Consolidated Financial Statements (Continued)
(in thousands)
September 30, 2016 and June 30, 2017
16. Commitments and Contingencies (Continued)
The following is a schedule showing the future minimum lease payments under capital leases by years and the present value of the minimum lease payments as of June 30, 2017.
Fiscal Year |
||||
Remainder of 2017 |
$ | 2,426 | ||
2018 |
9,394 | |||
2019 |
8,388 | |||
2020 |
6,425 | |||
2021 |
3,608 | |||
Thereafter |
3,098 | |||
| | | | | |
|
$ | 33,339 | ||
Less amount representing interest (at rates ranging from 2.15% to 3.65%) |
2,968 | |||
| | | | | |
Present value of net minimum capital lease payments |
30,371 | |||
Less current installments of obligations under capital leases |
9,400 | |||
| | | | | |
Obligations under capital leases, excluding current installments |
$ | 20,971 | ||
| | | | | |
| | | | | |
| | | | | |
The current installments of obligations under capital leases are included in Accrued expenses and other liabilities. Obligations under capital leases, excluding current installments, are included in Other non-current liabilities.
The Company is a lessor to multiple parties. The Company purchases equipment through internal funding or bank debt equal to the fair market value of the equipment. The equipment is then leased to customers for periods ranging from five to twenty years. The Company also leases equipment to one customer under a direct financing lease. The primary difference between this lease and the other operating leases is that this transaction resulted from a sale-leaseback transaction and does not have the same level of performance guarantees that the other agreements have. As of June 30, 2017, future
F-81
Notes to Unaudited Condensed Consolidated Financial Statements (Continued)
(in thousands)
September 30, 2016 and June 30, 2017
16. Commitments and Contingencies (Continued)
minimum lease payments receivable under the direct financing lease and the operating lease are as follows:
| |
Direct Financing Lease |
Operating Lease |
|||||
|---|---|---|---|---|---|---|---|
Fiscal year |
|||||||
Remainder of 2017 |
$ | 1,209 | $ | 2,770 | |||
2018 |
4,018 | 7,194 | |||||
2019 |
— | 4,942 | |||||
2020 |
— | 4,183 | |||||
2021 |
— | 1,929 | |||||
Thereafter |
— | 5,483 | |||||
| | | | | | | | |
Future minimum lease payments |
5,227 | $ | 26,501 | ||||
| | | | | | | | |
| | | | | | | | |
| | | | | | | | |
Less unearned income |
(243 | ) | |||||
| | | | | | | | |
Net investment in direct financing lease |
4,984 | ||||||
Less current portion |
(4,605 | ) | |||||
| | | | | | | | |
Noncurrent portion |
$ | 379 | |||||
| | | | | | | | |
| | | | | | | | |
| | | | | | | | |
The current receivables under the direct financing lease are included in Prepaid and other current assets. The non-current portion of the direct financing lease is included in Other non-current assets.
Guarantees
From time to time, the Company is required to provide letters of credit, bank guarantees, or surety bonds in support of its commitments and as part of the terms and conditions on water treatment projects. In addition, the Company is required to provide letters of credit or surety bonds to the department of environmental protection or equivalent in some states in order to maintain its licenses to handle toxic substances at certain of its water treatment facilities.
These financial instruments typically expire after all Company commitments have been met, a period typically ranging from twelve months to ten years, or more in some circumstances. The letters of credit, bank guarantees, or surety bonds are arranged through major banks or insurance companies. In the case of surety bonds, the Company generally indemnifies the issuer for all costs incurred if a claim is made against the bond.
As of September 30, 2016 and June 30, 2017, the Company had letters of credit totaling $18,129 and $15,902, respectively, and Surety Bonds totaling $102,228 and $80,259 respectively, outstanding under the Company's credit arrangements. The longest maturity date of the letters of credit and surety bonds related to commercial contracts in effect as of June 30, 2017 was March 31, 2024. Additionally, as of September 30, 2016 and June 30, 2017, the Company had letters of credit totaling $1,529 and $1,104, respectively, and Surety Bonds totaling $43,663 and $14,256, respectively, outstanding under the Company's prior arrangement with Siemens.
F-82
Notes to Unaudited Condensed Consolidated Financial Statements (Continued)
(in thousands)
September 30, 2016 and June 30, 2017
16. Commitments and Contingencies (Continued)
Litigation
From time to time, as a normal incident of the nature and kind of business in which the Company is engaged, various claims or charges are asserted and litigation commenced against it arising from or related to: product liability; personal injury; trademarks, trade secrets or other intellectual property; labor and employee disputes; commercial or contractual disputes; breach of warranty; or environmental matters. Claimed amounts may be substantial but may not bear any reasonable relationship to the merits of the claim or the extent of any real risk of court or arbitral awards. While it is not feasible to predict the outcome of these matters with certainty, and some lawsuits, claims or proceedings may be disposed or decided unfavorably, the Company does not expect that any asserted or unasserted legal claims or proceedings, individually or in the aggregate, will have a material adverse effect on the results of operations, or financial condition.
17. Accrued Expenses and Other Liabilities
Accrued expenses and other liabilities consisted of the following:
| |
September 30, 2016 | June 30, 2017 | |||||
|---|---|---|---|---|---|---|---|
Salaries, wages and other benefits |
$ | 44,776 | $ | 40,549 | |||
Taxes |
10,643 | 10,505 | |||||
Obligation under capital leases |
6,231 | 9,400 | |||||
Insurance liabilities |
5,484 | 7,032 | |||||
Provisions for litigation |
3,894 | 4,930 | |||||
Pension payable |
1,255 | 1,233 | |||||
Severance payments |
13,217 | 6,158 | |||||
Third party commissions |
9,155 | 7,686 | |||||
Other |
16,652 | 28,840 | |||||
| | | | | | | | |
|
$ | 111,307 | $ | 116,333 | |||
| | | | | | | | |
| | | | | | | | |
| | | | | | | | |
18. Segment Reporting
The Company has three reportable segments—Industrial, Municipal and Products. The key factors used to identify these reportable segments are the organization and alignment of the Company's internal operations, the nature of the products and services, and customer type. The business segments are described as follows:
Industrial combines equipment and services to improve operational reliability and environmental compliance for heavy and light industry, commercial and institutional markets. Their customers include hydrocarbon refineries, chemical processing, power, food and beverage, life sciences, health services and microelectronics.
Municipal helps engineers and municipalities meet new demands for plant performance through leading equipment, solutions and services backed by trusted brands and over 100 plus years of applications experience. Their customers include waste water and drinking water collection and distribution systems, utility operators and odor control services.
F-83
Notes to Unaudited Condensed Consolidated Financial Statements (Continued)
(in thousands)
September 30, 2016 and June 30, 2017
18. Segment Reporting (Continued)
Products has distinct business operating units. Each has a unique standard product built on well-known brands and technologies that are sold globally through multiple sales and aftermarket channels. Additionally, Products also offers industrial, municipal and water recreational users with well-known brands that improve operational reliability and environmental compliance. Their customers include original equipment manufacturers, regional and global distributors, engineering, procurement and contracting customers, end users in the municipal, industrial and commercial industries hotels, resorts, colleges, universities, waterparks, aquariums and zoos in addition to customers in the industrial and municipal industries.
The Company evaluates its business segments' operating results based on earnings before interest, taxes, depreciation and amortization. Corporate activities include general corporate expenses, elimination of intersegment transactions, interest income and expense and other unallocated charges. Since certain administrative and other operating expenses and other items have not been allocated to business segments, the results in the below table are not necessarily a measure computed in accordance with generally accepted accounting principles and may not be comparable to other companies.
| |
Nine months ended | ||||||
|---|---|---|---|---|---|---|---|
| |
June 30, 2016 | June 30, 2017 | |||||
Total sales |
|||||||
Industrial |
$ | 449,291 | $ | 464,415 | |||
Municipal |
220,006 | 217,897 | |||||
Products |
196,068 | 255,881 | |||||
| | | | | | | | |
Total sales |
865,365 | 938,193 | |||||
| | | | | | | | |
Intersegment sales |
|||||||
Industrial |
5,478 | 3,554 | |||||
Municipal |
20,526 | 18,970 | |||||
Products |
21,573 | 24,753 | |||||
| | | | | | | | |
Total intersegment sales |
47,577 | 47,277 | |||||
| | | | | | | | |
Sales to external customers |
|||||||
Industrial |
443,813 | 460,861 | |||||
Municipal |
199,481 | 198,927 | |||||
Products |
174,494 | 231,128 | |||||
| | | | | | | | |
Total sales |
817,788 | 890,916 | |||||
| | | | | | | | |
Earnings before interest, taxes, depreciation and amortization (EBITDA) |
|||||||
Industrial |
89,716 | 102,133 | |||||
Municipal |
27,427 | 29,644 | |||||
Products |
31,941 | 53,667 | |||||
Corporate |
(76,183 | ) | (96,754 | ) | |||
| | | | | | | | |
Total EBITDA |
72,901 | 88,690 | |||||
Depreciation and amortization |
|||||||
Industrial |
28,472 | 27,632 | |||||
Municipal |
6,026 | 6,119 | |||||
Products |
3,771 | 8,413 | |||||
F-84
Notes to Unaudited Condensed Consolidated Financial Statements (Continued)
(in thousands)
September 30, 2016 and June 30, 2017
18. Segment Reporting (Continued)
| |
Nine months ended | ||||||
|---|---|---|---|---|---|---|---|
| |
June 30, 2016 | June 30, 2017 | |||||
Corporate |
12,717 | 13,649 | |||||
| | | | | | | | |
Total depreciation and amortization |
50,986 | 55,813 | |||||
Income from operations |
|||||||
Industrial |
61,244 | 74,501 | |||||
Municipal |
21,401 | 23,525 | |||||
Products |
28,170 | 45,254 | |||||
Corporate |
(88,900 | ) | (110,418 | ) | |||
| | | | | | | | |
Total income from operations |
21,915 | 32,862 | |||||
Interest expense |
(29,467 | ) | (39,117 | ) | |||
| | | | | | | | |
Loss before income taxes |
(7,552 | ) | (6,255 | ) | |||
Income tax benefit (expense) |
20,419 | (295 | ) | ||||
| | | | | | | | |
Net income (loss) |
$ | 12,867 | $ | (6,550 | ) | ||
| | | | | | | | |
| | | | | | | | |
| | | | | | | | |
Capital expenditures |
|||||||
Industrial |
$ | 26,151 | $ | 31,019 | |||
Municipal |
4,011 | 4,239 | |||||
Products |
2,445 | 1,577 | |||||
Corporate |
2,110 | 3,640 | |||||
| | | | | | | | |
Total capital expenditures |
$ | 34,717 | $ | 40,475 | |||
| | | | | | | | |
| | | | | | | | |
| | | | | | | | |
| |
September 30, 2016 |
June 30, 2017 |
|||||
|---|---|---|---|---|---|---|---|
Assets |
|||||||
Industrial |
$ | 370,970 | $ | 442,809 | |||
Municipal |
123,041 | 138,498 | |||||
Products |
477,804 | 496,132 | |||||
Corporate |
324,416 | 343,264 | |||||
| | | | | | | | |
Total assets |
$ | 1,296,231 | $ | 1,420,703 | |||
| | | | | | | | |
| | | | | | | | |
| | | | | | | | |
| |
September 30, 2016 |
June 30, 2017 |
|||||
|---|---|---|---|---|---|---|---|
Goodwill |
|||||||
Industrial |
$ | 80,157 | $ | 127,599 | |||
Municipal |
9,691 | 10,049 | |||||
Products |
177,795 | 179,745 | |||||
| | | | | | | | |
Total goodwill |
$ | 267,643 | $ | 317,393 | |||
| | | | | | | | |
| | | | | | | | |
| | | | | | | | |
F-85
Notes to Unaudited Condensed Consolidated Financial Statements (Continued)
(in thousands)
September 30, 2016 and June 30, 2017
19. Earnings per share
The following table sets forth the computation of basic and diluted loss from continuing operations per common share (in thousands, except per share amounts):
| |
Nine months ended | ||||||
|---|---|---|---|---|---|---|---|
| |
June 30, 2016 | June 30, 2017 | |||||
Numerator: |
|||||||
Loss from continuing operations per common share - |
|||||||
Net income (loss) from continuing operations attributable to EWT |
$ | 11,812 | $ | (8,898 | ) | ||
Denominator: |
|||||||
Weighted average shares |
103,657 | 104,821 | |||||
Effect of dilutive securities: |
|||||||
Share-based compensation |
836 | — | |||||
| | | | | | | | |
Denominator for diluted net income (loss) per common share—adjusted weighted average shares |
104,493 | 104,821 | |||||
| | | | | | | | |
Basic income (loss) from continuing operations attributable to EWT Holdings I Corp per common share |
$ | 0.11 | $ | (0.08 | ) | ||
| | | | | | | | |
| | | | | | | | |
| | | | | | | | |
Diluted income (loss) from continuing operations attributable to EWT Holdings I Corp per common share |
$ | 0.11 | $ | (0.08 | ) | ||
| | | | | | | | |
| | | | | | | | |
| | | | | | | | |
Since the Company was in a net loss position for the nine months ended June 30, 2017, there was no difference between the number of shares used to calculate basic and diluted loss per share. Because of their anti-dilutive effect, 9,489 common share equivalents comprised of employee stock options have been excluded from the diluted EPS calculation for the nine months ended June 30, 2017.
20. Subsequent Events
The Company performed an evaluation of subsequent events through October 16, 2017, the date the consolidated financial statements were available to be issued.
On August 8, 2017 the company amended the First Lien Term Facility to 1) increase the term loan balance by $80,000 2) reprice the Incremental First Lien Term Facility and 3) combine all tranches into a single tranche. The First Lien Term Facility now carries a rate of LIBOR + 375 basis points. Proceeds from the additional borrowing were used to reduce the revolving credit facility balance and to increase cash on hand for general corporate operating purposes.
On October 16, 2017, the Company's Board of Directors effected a 26.9576-for-one stock split of its common stock and increased its authorized shares to 1,000,000. All share and per share information has been retroactively adjusted to reflect the stock split. The incremental par value of the newly issued shares was recorded with the offset to additional paid-in capital.
On October 16, 2017, the Company's Board of Directors changed the name of the Company from EWT Holdings I Corp. to Evoqua Water Technologies Corp.
F-86
To
the Board of Directors and Shareholders of
NB Intermediate Holdings, LLC
Report on the Financial Statements
We have audited the accompanying consolidated financial statements of NB Intermediate Holdings, LLC and Subsidiaries (the Company) which comprise the consolidated balance sheet as of December 31, 2015, and the related consolidated statements of income, changes in member's equity and cash flows for the year then ended and the related notes to the consolidated financial statements (collectively, the financial statements).
Management's Responsibility for the Financial Statements
Management is responsible for the preparation and fair presentation of these financial statements in accordance with accounting principles generally accepted in the United States of America; this includes the design, implementation, and maintenance of internal control relevant to the preparation and fair presentation of financial statements that are free from material misstatement, whether due to fraud or error.
Auditor's Responsibility
Our responsibility is to express an opinion on these financial statements based on our audit. We conducted our audit in accordance with auditing standards generally accepted in the United States of America. Those standards require that we plan and perform the audit to obtain reasonable assurance about whether the financial statements are free from material misstatement.
An audit involves performing procedures to obtain audit evidence about the amounts and disclosures in the financial statements. The procedures selected depend on the auditor's judgment, including the assessment of the risks of material misstatement of the financial statements, whether due to fraud or error. In making those risk assessments, the auditor considers internal control relevant to the entity's preparation and fair presentation of the financial statements in order to design audit procedures that are appropriate in the circumstances, but not for the purpose of expressing an opinion on the effectiveness of the entity's internal control. Accordingly, we express no such opinion. An audit also includes evaluating the appropriateness of accounting policies used and the reasonableness of significant accounting estimates made by management, as well as evaluating the overall presentation of the financial statements.
We believe that the audit evidence we have obtained is sufficient and appropriate to provide a basis for our audit opinion.
Opinion
In our opinion, the financial statements referred to above present fairly, in all material respects, the financial position of NB Intermediate Holdings, LLC and Subsidiaries as of December 31, 2015, and the results of their operations and their cash flows for the year then ended in accordance with accounting principles generally accepted in the United States of America.
/s/
RSM US LLP
Boston, Massachusetts
April 8, 2016, except for Note 13, as to which the date is April 15, 2016
F-87
NB Intermediate Holdings, LLC and Subsidiaries
Consolidated Balance Sheet as of December 31, 2015
| |
December 31, 2015 | |||
|---|---|---|---|---|
ASSETS |
||||
Cash and cash equivalents |
$ | 1,235,155 | ||
Restricted cash |
259,824 | |||
Accounts receivable, net of allowance for doubtful accounts of $63,541 |
18,397,030 | |||
Inventories, net |
10,582,896 | |||
Prepaid expenses and other current assets |
1,310,954 | |||
| | | | | |
Total current assets |
31,785,859 | |||
| | | | | |
Property and equipment, net |
1,343,511 | |||
Deferred Costs |
695,625 | |||
Intangible assets, net |
36,658,324 | |||
Goodwill |
30,538,623 | |||
| | | | | |
Total other assets |
69,236,083 | |||
| | | | | |
Total assets |
$ | 101,021,942 | ||
| | | | | |
| | | | | |
| | | | | |
LIABILITIES AND MEMBER'S EQUITY |
||||
Current liabilities: |
||||
Revolving loan |
$ | 900,000 | ||
Current portion of long term debt |
2,004,073 | |||
Accounts payable and accrued expenses |
8,785,507 | |||
Distributions payable |
2,673,078 | |||
Customer deposits |
773,357 | |||
Contingent consideration payable |
582,839 | |||
Due to related party |
5,892 | |||
| | | | | |
Total current liabilities |
15,724,746 | |||
Long-term debt, net of current portion |
61,173,258 | |||
| | | | | |
Total liabilities |
76,898,004 | |||
| | | | | |
Commitments and contingencies (Note 10) |
— | |||
Member's equity: |
||||
Contributed equity |
44,416,090 | |||
Additional paid in capital |
448,083 | |||
Accumulated deficit |
(20,740,235 | ) | ||
| | | | | |
Total member's equity |
24,123,938 | |||
| | | | | |
Total liabilities and member's equity |
$ | 101,021,942 | ||
| | | | | |
| | | | | |
| | | | | |
See notes to consolidated financial statements.
F-88
NB Intermediate Holdings, LLC and Subsidiaries
Consolidated Statement of Income for the Year Ended December 31, 2015
| |
December 31, 2015 |
|||
|---|---|---|---|---|
Net sales |
$ | 55,734,875 | ||
Cost of goods sold |
23,822,913 | |||
| | | | | |
Gross profit |
31,911,962 | |||
Commission income |
144,563 | |||
| | | | | |
|
32,056,525 | |||
Selling, general and administrative expenses |
13,995,048 | |||
Acquisition related expenses |
527,407 | |||
Intangible asset amortization expense |
7,510,962 | |||
Settlement of acquisition claim |
(562,701 | ) | ||
Management fees |
867,763 | |||
| | | | | |
Operating income |
9,718,046 | |||
| | | | | |
Other income (expense): |
||||
Other income (expense) |
27,896 | |||
Foreign currency gain (loss) |
(29,189 | ) | ||
Interest expense |
(5,174,048 | ) | ||
| | | | | |
Net other expense |
(5,175,341 | ) | ||
| | | | | |
Net income |
$ | 4,542,705 | ||
| | | | | |
| | | | | |
| | | | | |
See notes to consolidated financial statements.
F-89
NB Intermediate Holdings, LLC and Subsidiaries
Consolidated Statement of Member's Equity for the Year Ended December 31, 2015
| |
Contributed Equity |
Additional Paid in Capital |
Accumulated Deficit |
Total Member's Equity |
|||||||||
|---|---|---|---|---|---|---|---|---|---|---|---|---|---|
Balance at January 1, 2015 |
$ | 45,166,090 | $ | 569,811 | $ | (23,247,537 | ) | $ | 22,488,364 | ||||
Net income |
— | — | 4,542,705 | 4,542,705 | |||||||||
Distributions declared |
— | — | (2,035,403 | ) | (2,035,403 | ) | |||||||
Redemption of member units |
(750,000 | ) | (391,832 | ) | — | (1,141,832 | ) | ||||||
Equity based compensation |
— | 270,104 | — | 270,104 | |||||||||
| | | | | | | | | | | | | | |
Balance at December 31, 2015 |
$ | 44,416,090 | $ | 448,083 | $ | (20,740,235 | ) | $ | 24,123,938 | ||||
| | | | | | | | | | | | | | |
| | | | | | | | | | | | | | |
| | | | | | | | | | | | | | |
See notes to consolidated financial statements.
F-90
NB Intermediate Holdings, LLC and Subsidiaries
Consolidated Statement of Cash Flows for the Year Ended December 31, 2015
| |
2015 | |||
|---|---|---|---|---|
Cash flows from operating activities: |
||||
Net income |
$ | 4,542,705 | ||
Adjustments to reconcile net income to net cash provided by operating activities: |
||||
Depreciation |
303,525 | |||
Amortization |
7,510,421 | |||
Amortization of debt issuance costs |
610,869 | |||
Equity based compensation |
270,104 | |||
Changes in assets and liabilities: |
||||
(Increase) decrease in: |
||||
Accounts receivable, net |
(9,091,986 | ) | ||
Inventories, net |
(3,767,599 | ) | ||
Prepaid expenses |
(638 | ) | ||
Increase (decrease) in: |
||||
Accounts payable and accrued expenses |
4,328,122 | |||
Customer deposits |
477,841 | |||
Due to related party |
(5,779 | ) | ||
| | | | | |
Net cash provided by operating activities |
5,177,585 | |||
| | | | | |
Cash flows from investing activities: |
||||
Restriction of cash |
(259,824 | ) | ||
Deferred costs |
(695,625 | ) | ||
Purchases of property and equipment |
(558,126 | ) | ||
Purchase acquisitions |
(2,727,754 | ) | ||
Purchase of non-compete agreements |
(101,000 | ) | ||
Purchases of intangible assets |
(166,723 | ) | ||
| | | | | |
Net cash used in investing activities |
(4,509,052 | ) | ||
| | | | | |
Cash flows from financing activities: |
||||
Payments on long-term debt |
(3,500,000 | ) | ||
Payments of debt issuance costs |
(73,750 | ) | ||
Payments of contingent consideration |
(58,161 | ) | ||
Redemption of member units |
(1,141,832 | ) | ||
Distributions paid |
(760,919 | ) | ||
Payments to former Sonitec stockholders |
(316,000 | ) | ||
Proceeds (payments) from revolving loan |
576,890 | |||
Proceeds from long-term debt |
3,500,000 | |||
| | | | | |
Net cash used in financing activities |
(1,773,772 | ) | ||
| | | | | |
Net decrease in cash and cash equivalents |
(1,105,239 | ) | ||
Cash and cash equivalents, beginning of year |
2,340,394 | |||
| | | | | |
Cash and cash equivalents, end of year |
$ | 1,235,155 | ||
| | | | | |
| | | | | |
| | | | | |
Supplemental disclosures of cash flow information: |
||||
Interest paid |
$ | 4,455,375 | ||
| | | | | |
| | | | | |
| | | | | |
Income taxes |
$ | — | ||
| | | | | |
| | | | | |
| | | | | |
Supplemental disclosures of investing and financing activities: |
||||
Acquisitions: |
||||
Accounts receivable |
$ | 328,901 | ||
Inventory |
483,030 | |||
Prepaid expenses and other assets |
85,820 | |||
Property and equipment |
85,928 | |||
Trademarks and trade names |
243,000 | |||
Product technology |
960,000 | |||
Customer relationships |
1,500,000 | |||
Backlog |
60,000 | |||
Goodwill |
987,471 | |||
Accounts payable and accrued expenses |
(473,543 | ) | ||
Customer deposits |
(150,070 | ) | ||
Short-term debt |
(323,110 | ) | ||
Sonitec former stockholder advances |
(316,000 | ) | ||
| | | | | |
Net assets acquired |
3,471,427 | |||
Less: contingent consideration payable |
(641,000 | ) | ||
Less: working capital settlement payable |
(102,673 | ) | ||
| | | | | |
Cash paid for businesses acquired |
$ | 2,727,754 | ||
| | | | | |
| | | | | |
| | | | | |
Costs incurred with acquisition: |
||||
Transaction costs |
$ | 527,407 | ||
| | | | | |
| | | | | |
| | | | | |
See notes to consolidated financial statements.
F-91
NB Intermediate Holdings, LLC and Subsidiaries
Notes to Audited Consolidated Financial Statements
1. Nature of Operations and Basis of Presentation
NB Intermediate Holdings, LLC ("NB Intermediate") is a wholly owned subsidiary of NB Filtration Holdings, LLC. (the "Parent"). NB Intermediate, a Delaware Limited Liability Company, is the sole owner of Neptune-Benson, LLC ("Neptune-Benson"). Neptune-Benson is the sole owner of Engineered Treatment Systems, LLC ("ETS") and 3287920 Nova Scotia Limited ("Nova Scotia"). Nova Scotia is the sole owner of Sonitec-Vortisand Technologies ULC ("Sonitec"). The consolidated financial statements include the accounts of NB Intermediate, Neptune-Benson, ETS, Nova Scotia and Sonitec (together, the "Company"). The Parent, NB Intermediate and Neptune-Benson were established prior to July 7, 2011 for the purpose of acquiring all assets and assuming certain liabilities of Neptune-Benson, Inc. On September 11, 2012, Neptune-Benson acquired the assets and assumed certain liabilities of ETS. On December 6, 2013, Neptune-Benson acquired certain assets of BRI Metal Works, Inc. ("BRI"). Nova Scotia was established on April 9, 2015, for the purpose of acquiring the stock of Sonitec-Vortisand Technologies ULC. On January 14, 2015, Neptune-Benson acquired certain assets of ProFlo, Inc. ("ProFlo").
Neptune-Benson is principally engaged in the design and manufacture of aquatic filtration and recirculation systems, and is headquartered in Coventry, Rhode Island. The Company sells its products to swimming pool and aquatic recreational facilities, aquariums, zoos and water parks throughout the world. The Company generally sells to contractors building or renovating these facilities. ETS is principally engaged in the design and manufacture of UV Systems for the commercial aquatics industry and for the industrial and municipal markets. ETS's manufacturing facility is located in Beaver Dam, Wisconsin. Sonitec is principally engaged in the design and sale of micro-sand filters in the industrial sector. Sonitec's facility is located in Montreal, Canada. Manufacturing for Sonitec filters is performed out of Coventry, Rhode Island. BRI was principally engaged in the design and manufacture of filters and was a significant supplier to Neptune-Benson. ProFlo was principally engaged in the design and manufacture of water strainers.
2. Summary of Significant Accounting Policies
Codification
The accompanying consolidated financial statements have been prepared in accordance with accounting standards set by the Financial Accounting Standards Board ("FASB"). The FASB sets generally accepted accounting principles ("GAAP") that the Company follows to ensure its financial condition, results of operations, and cash flows are consistently reported. References to GAAP issued by the FASB in these notes to the consolidated financial statements are to the FASB Accounting Standards Codification ("ASC").
Principles of Consolidation
The consolidated financial statements include the accounts of the Company and its wholly-owned subsidiaries. All significant intercompany accounts and transactions have been eliminated in consolidation.
Cash and Cash Equivalents
The Company considers all highly liquid investments with original maturity dates of three months or less when purchased, to be cash equivalents.
F-92
NB Intermediate Holdings, LLC and Subsidiaries
Notes to Audited Consolidated Financial Statements (Continued)
2. Summary of Significant Accounting Policies (Continued)
The Company maintains its cash and cash equivalents in bank deposit accounts, which, at times may exceed federally insured limits. The Company has not experienced losses in such accounts. The Company believes that it is not exposed to any significant credit risk on cash and cash equivalents.
Restricted Cash
The Company's Bank has issued letters of guarantee to certain customers totaling $219,824 to guarantee the Company's performance on extended warranty contracts purchased by certain customers. The letters of guarantee are secured by cash held in a restricted cash account. The Company also has $40,000 of restricted cash securing corporate credit cards. These amounts are classified as restricted cash on the accompanying consolidated balance sheet at December 31, 2015.
Accounts Receivable
Accounts receivable are stated at the amount management expects to collect from the outstanding balance. On a regular basis, the Company reviews the adequacy of its allowance for doubtful accounts based on historical collection results and current economic conditions using factors based on the aging of its accounts receivable. In addition, the Company estimates specific additional allowances based on indications that a specific customer may be experiencing financial difficulties. When the Company determines that an account is uncollectible, it is written off against the allowance for doubtful accounts. Recoveries of amounts receivable previously written off are recorded when received. A receivable is considered to be past due if any portion of the receivable balance is outstanding for more than 90 days.
Inventories
Inventories, which include material, labor and overhead, are stated at the lower of cost or market. Cost is determined using the first-in, first-out ("FIFO") method. The Company expenses overhead costs related to idle capacity in the period the costs are incurred. On a regular basis, the Company reviews the adequacy of its provision for excess and obsolete inventory based on historical experience, product knowledge and demand estimates. The Company records, as a charge to cost of goods sold, any amounts required to reduce the carrying value of its inventory to net realizable value.
Property and Equipment
Property and equipment are stated at cost. Depreciation of property and equipment is recorded using the straight-line method over the estimated useful lives of the assets. Maintenance and repair costs are expensed as incurred. Upon sale or retirement, the cost and related accumulated depreciation are removed from the respective accounts and the resulting gain or loss is included in current operations.
The estimated useful lives of property and equipment are as follows:
Machinery and equipment |
1 - 5 years | |
Computer equipment and software |
1 - 5 years | |
Office equipment |
1 - 5 years | |
Furniture and fixtures |
1 - 5 years | |
Motor vehicle |
5 years |
F-93
NB Intermediate Holdings, LLC and Subsidiaries
Notes to Audited Consolidated Financial Statements (Continued)
2. Summary of Significant Accounting Policies (Continued)
Software Development Costs
Costs for software developed for internal use are accounted for in accordance with ASC 350, Intangibles—Goodwill and Other—Internal-Use Software. ASC 350 requires the capitalization of certain costs incurred in connection with developing or obtaining internal-use software. In accordance with ASC 350, the Company expenses costs incurred in the preliminary project stage of developing or acquiring internal use software, such as research and feasibility studies, as well as costs incurred in the post-implementation/operational stage, such as maintenance and training. Capitalization of software development costs occurs only after the preliminary project stage is complete, management authorizes the project, and it is probable that the project will be completed and the software will be used for the function intended. Costs associated with the purchase and development of computer software are capitalized and amortized on a straight-line basis over the estimated useful life of the related asset once placed in service. Software development costs totaling $695,625 are recorded in deferred costs as of December 31, 2015 and have not yet been placed in service. The capitalized costs include software license fees and contractor development and implementation costs. The software development project was put on hold by management late in 2015 and is expected to be continued in early 2016.
Impairment of Long-Lived Assets
The Company accounts for impairment of long-lived assets in accordance with ASC 360—Property, Plant and Equipment. ASC 360 requires that long-lived assets, including definite-lived intangibles, be reviewed for impairment whenever events or changes in circumstances indicate that the book value of the asset may not be recoverable. The Company evaluates whether events and circumstances have occurred that indicate possible impairment.
An asset is considered impaired if the net book value of the asset exceeds the future projected undiscounted cash flows anticipated to be generated by the asset. The impairment is then measured as the excess of the net book value of the asset over its estimated fair value. For the year ended December 31, 2015, no impairment charge was required.
Debt Issuance Costs
Debt issuance costs consist of capitalized professional fees, bank fees and other costs associated with the securing of bank financing. These costs represent a debt discount and reduce the carrying value of the related debt. The costs are being amortized using the effective interest method over the terms of the respective debt agreements. The Company paid debt issuance costs in 2015 totaling $73,750, which was recorded as additional debt discount in connection with the modifications of the senior debt.
Amortization expense for the year ended December 31, 2015 was $610,869, and is included in interest expense in the accompanying consolidated statement of income.
Goodwill and Intangible Assets
The Company accounts for business combinations pursuant to ASC 805, Business Combinations. Goodwill in such acquisitions represents the excess of the cost of a business acquired over the fair value of the net assets acquired, including identifiable intangible assets, and liabilities assumed. ASC 805 specifies criteria to be used in determining whether intangible assets acquired in a business
F-94
NB Intermediate Holdings, LLC and Subsidiaries
Notes to Audited Consolidated Financial Statements (Continued)
2. Summary of Significant Accounting Policies (Continued)
combination must be recognized and reported separately from goodwill. Amounts assigned to goodwill and other identifiable intangible assets were determined with the assistance of an independent appraiser using a market approach and a discounted cash flow analysis.
Under FASB ASC 350, Intangibles—Goodwill and Other, intangible assets with indefinite lives are reviewed annually for impairment. The review for impairment consists of a comparison of the fair value of the asset with its carrying amount. Fair value is an estimate of the price a willing buyer would pay for the intangible asset and is generally estimated by discounting the expected future cash flows associated with the intangible asset.
In accordance with the related guidance, the Company, with the assistance of independent valuation experts, conducts an impairment evaluation for goodwill at least annually, or more frequently, if events or changes in circumstances indicate that an asset might be impaired. The evaluation is performed using a two-step process. The first step (defined as "Step 1") compares the book value of the Company's reporting unit to its estimated fair value. The second step (defined as "Step 2") of the goodwill impairment test, which is only required when the net book value of the reporting unit exceeds the fair value, compares the implied fair value of goodwill to its book value to determine if an impairment is required. The Company estimates the fair value of its reporting units using the income and market approaches which measure the value of an intangible asset based on the expected stream of monetary benefits attributable to it over its remaining useful life, and market appraisal. The Company has two reporting units and performs its annual step 1 analysis in the fourth quarter.
The Company provides for amortization of intangible assets with definite lives using straight-line methods over their estimated useful lives. The amortization periods of the intangible assets are as follows:
Trademarks and trade names |
10 years | |
Developed technology |
9 years | |
Backlog |
<1 year | |
Non-compete agreements |
5 years | |
Customer relationships |
9 years | |
Patents |
9 years | |
Software development costs |
3 years |
Revenue Recognition
Revenue from product sales is recorded, net of sales tax, at the time of shipment, provided that persuasive evidence of an arrangement exists, the seller's price to the buyer is fixed or determinable and collectability is reasonably assured. Shipping and handling fees charged to customers are recognized at the time the products are shipped and are included in net sales. The related shipping and handling costs are included in cost of goods sold on the accompanying consolidated statements of operations.
The company follows the guidance of Accounting Standards Codification ("ASC") Subtopic 605-25, Multi-Deliverable Revenue Arrangements (ASC 605-25). Agreements containing multiple elements are divided into separate units of accounting if certain criteria are met, including whether the delivered element has a stand-alone value to the customer. The consideration received is then allocated among the separate units based on the hierarchy discussed below. For those deliverables that qualify as
F-95
NB Intermediate Holdings, LLC and Subsidiaries
Notes to Audited Consolidated Financial Statements (Continued)
2. Summary of Significant Accounting Policies (Continued)
separate units of accounting, the Company must assign value based on each deliverable's vendor-specific objective evidence ("VSOE") of the value, if applicable, third-party evidence ("TPE") of its value if VSOE is not available, or estimated selling price ("ESP") if neither VSOE or TPE is available. Arrangement consideration is then allocated to all deliverables using the relative selling price method.
Concentration of Credit Risk and Major Customers
For the year ended December 31, 2015 the Company had no customers that accounted for more than 10% of sales. As of December 31, 2015, there was no individual customer that accounted for more than 10% of the accounts receivable balance.
Advertising
The Company expenses the costs of advertising as incurred. For the year ended December 31, 2015, advertising expenses amounted to $172,450.
Fair Value Measurements
The Company follows current accounting standards for fair value measurements, which define fair value as "the price that would be received to sell an asset or paid to transfer a liability in an orderly transaction between market participants at the measurement date", and establish a fair value hierarchy that requires an entity to maximize the use of observable inputs and minimize the use of unobservable inputs when measuring fair value. A financial instrument's categorization within the fair value hierarchy is based upon the lowest level of input that is significant to the fair value measurement. There are three levels of inputs that may be used to measure fair value.
Level 1—Applies to assets or liabilities for which there are quoted prices in active markets for identical assets or liabilities. |
Level 2—Applies to assets or liabilities for which there are inputs, other than quoted prices included within Level 1, that are observable for the asset or liability such as quoted prices for similar assets or liabilities in active markets; quoted prices for identical assets or liabilities in markets with insufficient volume or infrequent transactions (less active markets); or model-derived valuations in which significant inputs are observable or can be derived principally from, or corroborated by, observable market data. |
Level 3—Applies to assets or liabilities for which there are unobservable inputs to the valuation methodology that are significant to the measurement of the fair value of the assets or liabilities. |
Use of Estimates
The preparation of consolidated financial statements in conformity with accounting principles generally accepted in the United States of America requires management to make estimates and assumptions that affect the reported amounts of assets and liabilities and disclosure of contingent assets and liabilities at the date of the financial statements and the reported amount of revenues and expenses during the reporting period. Actual results could differ from those estimates. Significant estimates included in the consolidated financial statements include allowance for doubtful accounts, excess and
F-96
NB Intermediate Holdings, LLC and Subsidiaries
Notes to Audited Consolidated Financial Statements (Continued)
2. Summary of Significant Accounting Policies (Continued)
obsolete inventory, warranty reserves, equity based compensation, contingent consideration and the estimated values and lives of long-lived assets, including goodwill and intangible assets.
Product Warranties
Most of the Company's products carry a product warranty, which generally provides customers the right to return defective product during the specified warranty period, for repair or replacement at no cost to the customer. Based upon a specific issue identified during 2013, with respect to certain grates sold through June 2013, the Company recorded a warranty reserve. At December 31, 2015, there was no requirement for a warranty reserve on other products. Following is a schedule of warranty reserve activity:
Warranty reserve, beginning balance |
$ | 250,288 | ||
Warranty costs |
— | |||
Warranty claims |
(45,718 | ) | ||
| | | | | |
Warranty reserve, ending balance |
$ | 204,570 | ||
| | | | | |
| | | | | |
| | | | | |
Financial Instruments
The carrying amount of cash and cash equivalents, accounts receivable, accounts payable, accrued expenses and customer deposits approximate fair value due to the short term nature of these instruments. The carrying amount of the long-term debt is reported net of unamortized debt issuance costs totaling $672,669 at December 31, 2015. The face value of the senior debt and revolving line of credit approximates fair value as the related interest rates approximate the Company's incremental borrowing rate for similar obligations. The face value of the related debt instruments are presented in Note 7. In addition, the senior and revolving debt are at variable rates. The following table summarizes the estimated fair values of the Company's other financial instruments at December 31, 2015:
| |
Fair Value at December 31, 2015 |
|||
|---|---|---|---|---|
Senior debt and revolving loan |
$ | (64,750,000 | ) | |
| | | | | |
| | | | | |
| | | | | |
Equity Based Compensation
The Company accounts for equity-based awards to employees using the fair value method as prescribed by U.S. GAAP. Accordingly, compensation expense is recorded for the fair value of equity awards issued to employees measured at the date of grant, over the requisite service period for P units of five years.
Compensation costs for unit awards issued to employees and expected to vest, are recognized over the vesting period based on the grant date fair value of the unit awards. For time based awards, compensation cost is recognized on a straight-line basis over the vesting period. The grant date has been considered the measurement date for all awards granted.
The fair value of each grant is estimated on the date of the grant based on a valuation of the equity interests issued, which is performed by a third party valuation specialist.
F-97
NB Intermediate Holdings, LLC and Subsidiaries
Notes to Audited Consolidated Financial Statements (Continued)
2. Summary of Significant Accounting Policies (Continued)
Income Taxes
The Company is a Limited Liability Company which has elected to be taxed as a partnership. The Company is not liable for any income taxes. The members of the Company's parent will pay income taxes on their respective share of the Company's income. The Company will declare and pay distributions calculated at the highest tax rate of the members on the income earned and reported by the Company on its tax returns. Such amounts will be recognized as a distribution in the period in which the income is earned. The Company declared $2,035,403 of distributions for the year ended December 31, 2015.
The Company follows FASB ASC 740, Accounting for Uncertainty in Income Taxes ("ASC 740"). ASC 740 provides guidance for how uncertain tax positions should be recognized, measured, presented and disclosed in the financial statements. ASC 740 also requires the evaluation of tax positions taken or expected to be taken in the course of preparing the Company's tax returns to determine whether the tax positions are more-likely-than-not of being sustained by the applicable tax authority. Tax positions not deemed to meet a more-likely-than-not threshold would be recorded as a tax expense in the current year.
The Company files tax returns in the federal and various state jurisdictions. Management has reviewed the Company's tax positions for the open tax years 2012 - 2015 and has determined that no provision for uncertain tax positions is required in the Company's consolidated financial statements. Penalties and interest, if any, would be recorded in income tax expense.
Foreign Currency Translation
The Company accounts for activity with its Sonitec subsidiary in accordance with ASC 830, Foreign Currency Matters. The Company determined that the functional currency of the Sonitec subsidiary is the United States Dollar.
Accordingly, all monetary assets and liabilities of the Sonitec subsidiary are remeasured into U.S. dollars at exchange rates in effect as of the balance sheet date, and nonmonetary assets and liabilities are translated at historical exchange rates. Results of operations are remeasured at the average exchange rates for the period. Foreign exchange gains and losses from revaluation of the non-U.S. dollar denominated assets and liabilities, which were immaterial in 2015 are included in the Company's results of operations.
The transaction gains and losses for the year ended December 31, 2015 were $29,189 and are recorded in other income (expense), net, in the consolidated statements of operations for the year then ended.
Recent Accounting Policies
On August 12, 2015, the FASB issued Accounting Standards Update (ASU) 2015-14, Revenue from Contracts with Customers (Topic 606): Deferral of the Effective Date. This ASU: (a) defers the effective date of ASU 2014-09, Revenue from Contracts with Customers (Topic 606), by one year for both public and nonpublic entities and (b) allows early adoption of the ASU by all entities as of the original effective date for public entities. ASU 2014-09, Revenue from Contracts with Customers (Topic 606), will require an entity to recognize the amount of revenue to which it expects to be entitled
F-98
NB Intermediate Holdings, LLC and Subsidiaries
Notes to Audited Consolidated Financial Statements (Continued)
2. Summary of Significant Accounting Policies (Continued)
for the transfer of promised goods or services to customers. The updated standard will replace most existing revenue recognition guidance in U.S. GAAP when it becomes effective for annual reporting periods beginning after December 15, 2018. The Company is currently assessing the impact adoption of this guidance will have on its consolidated financial statements.
The FASB issued Accounting Standards Update (ASU) 2015-03, Interest—Imputation of Interest (Subtopic 835-30): Simplifying the Presentation of Debt Issuance Cost. This ASU requires that debt issuance costs related to a recognized debt liability be presented in the balance sheet as a direct deduction from the carrying amount of that debt liability, consistent with debt discounts. The recognition and measurement guidance for debt issuance costs is not affected by the new guidance. This standard was implemented as of December 31, 2015.
3. Business Combinations
Sonitec Acquisition
On April 9, 2015, Neptune-Benson acquired all of the stock of Sonitec-Vortisand Technologies ULC and non-compete agreements with the seller, for a total consideration of $2,727,957, including a working capital settlement of $102,673, paid in January 2016. Of the total consideration, $2,637,957 was allocated to the purchase and $90,000 was allocated to the non-compete agreements. Of the consideration transferred, $2,334,284 was paid in cash to the sellers and a contingent earnout with an estimated fair market value of $291,000 was incurred. The contingent consideration requires the Company to make additional payments to the sellers, based on the performance of the business. The contingent payment is based on the value of purchase orders received for the year ending December 31, 2016 and was calculated by the Company's third party valuation specialist based on a probability weighting of likely outcomes.
Assets acquired and liabilities assumed in connection with the acquisition have been recorded at their fair values. The excess of the acquisition price over the fair value of the assets acquired and liabilities assumed was recorded as goodwill. All of the goodwill is deductible by the Parent Company's members for tax purposes. The Company incurred $483,654 in acquisition related expenses. The
F-99
NB Intermediate Holdings, LLC and Subsidiaries
Notes to Audited Consolidated Financial Statements (Continued)
3. Business Combinations (Continued)
following summarizes the estimated fair value of the assets acquired and liabilities assumed by the Company in accordance with the acquisition method of accounting:
Accounts receivable |
$ | 328,901 | ||
Inventory |
308,560 | |||
Prepaid expenses and other current assets |
85,820 | |||
Property and equipment |
85,928 | |||
Tradename |
220,000 | |||
Product technology |
760,000 | |||
Customer relationships |
1,500,000 | |||
Backlog |
60,000 | |||
Goodwill |
551,471 | |||
Accounts payable and accrued expenses |
(473,543 | ) | ||
Customer deposits |
(150,070 | ) | ||
Short-term debt |
(323,110 | ) | ||
Sonitec former stockholder advances |
(316,000 | ) | ||
| | | | | |
Net assets acquired |
$ | 2,637,957 | ||
| | | | | |
| | | | | |
| | | | | |
Fair market value of net assets acquired:
Total fair market value of net assets acquired |
$ | 2,637,957 | ||
Less: contingent consideration |
(291,000 | ) | ||
Less: working capital settlement payable |
(102,673 | ) | ||
| | | | | |
Cash paid for net assets acquired |
$ | 2,244,284 | ||
| | | | | |
| | | | | |
| | | | | |
The purpose of the transaction was to expand and diversify the Company's customer base to include industrial and municipal markets and to add complimentary products and services. Goodwill recorded in the transaction reflects the synergistic value of the customer base and product lines of the companies acquired and the Company's ability to leverage the existing and newly acquired resources to expand sales and profitability. The costs of the non-compete agreements are amortized over the life of the agreements.
The contractual gross receipts acquired were $364,723. Management anticipates recovery of these receipts of $328,901.
ProFlo, Inc. Acquisition
On January 14, 2015, Neptune-Benson acquired certain assets of ProFlo, Inc., for a total consideration of $844,470. Of the total consideration, $833,470 was allocated to the purchase and $11,000 was allocated to the non-compete agreements. Of the consideration transferred, $494,470 was paid in cash to the sellers and a contingent earnout with an estimated fair market value of $350,000 was incurred. The contingent consideration requires the Company to make additional payments to the sellers, based on the performance of the business. The contingent consideration was calculated by the Company's third party valuation specialist based on a probability weighting of potential outcomes discounted for the inherent risk and time value of money. Assets acquired in connection with the
F-100
NB Intermediate Holdings, LLC and Subsidiaries
Notes to Audited Consolidated Financial Statements (Continued)
3. Business Combinations (Continued)
acquisition have been recorded at their fair values. The Company incurred $43,753 in acquisition related expenses.
The following summarizes the estimated fair value of the assets acquired by the Company in accordance with the acquisition method of accounting:
Inventory |
$ | 174,470 | ||
Tradename |
23,000 | |||
Product technology |
200,000 | |||
Goodwill |
436,000 | |||
| | | | | |
Total assets acquired |
$ | 833,470 | ||
| | | | | |
| | | | | |
| | | | | |
Fair market value of net assets acquired:
Total fair market value of net assets acquired |
$ | 833,470 | ||
Less: contingent consideration |
(350,000 | ) | ||
| | | | | |
Cash paid for net assets acquired |
$ | 483,470 | ||
| | | | | |
| | | | | |
| | | | | |
The purpose of the transaction was to acquire a key product from a supplier to the Company and benefit from improved margins and the ability to accelerate the delivery of completed products.
Settlement of Acquisition Claim
In 2015, the Company settled claims against the seller in a prior acquisition related to product issues and to recover costs incurred during 2012-2015. The Company received $562,701 which was released from escrow for claims related to this prior acquisition. The recovery was recorded as gain in the accompanying consolidated statements of operations for the year ended December 31, 2015.
4. Inventories
Inventories consisted of the following at December 31, 2015:
Finished goods |
$ | 4,630,776 | ||
WIP |
2,714,778 | |||
Raw materials |
3,237,342 | |||
| | | | | |
|
$ | 10,582,896 | ||
| | | | | |
| | | | | |
| | | | | |
F-101
NB Intermediate Holdings, LLC and Subsidiaries
Notes to Audited Consolidated Financial Statements (Continued)
5. Property and Equipment
Property and equipment consisted of the following at December 31, 2015:
Machinery and equipment |
$ | 1,284,666 | ||
Computer equipment |
229,859 | |||
Office equipment |
183,250 | |||
Furniture and fixtures |
269,391 | |||
Leasehold improvements |
97,583 | |||
Motor vehicles |
104,832 | |||
| | | | | |
|
2,169,581 | |||
Less—accumulated depreciation |
(826,070 | ) | ||
| | | | | |
|
$ | 1,343,511 | ||
| | | | | |
| | | | | |
| | | | | |
Total depreciation expense for the year ended December 31, 2015 was $303,525.
6. Intangible Assets
Intangible assets consisted of the following at December 31, 2015:
| |
Cost | Accumulated Amortization |
Net Book Value |
|||||||
|---|---|---|---|---|---|---|---|---|---|---|
Definite lived intangible assets: |
||||||||||
Trademarks and trade names |
$ | 16,543,000 | $ | (6,582,693 | ) | $ | 9,960,307 | |||
Developed technology |
9,960,000 | (4,805,014 | ) | 5,154,986 | ||||||
Backlog |
1,620,000 | (1,603,750 | ) | 16,250 | ||||||
Non-compete agreements |
1,451,000 | (1,053,708 | ) | 397,292 | ||||||
Customer relationships |
39,373,000 | (18,438,884 | ) | 20,934,116 | ||||||
Patents |
195,373 | — | 195,373 | |||||||
| | | | | | | | | | | |
|
$ | 69,142,373 | $ | (32,484,049 | ) | $ | 36,658,324 | |||
| | | | | | | | | | | |
| | | | | | | | | | | |
| | | | | | | | | | | |
Amortization expense totaled $7,510,421 for the year ended December 31, 2015.
Estimated amortization expense, in the aggregate, and for the next five years and thereafter is expected to be:
2016 |
$ | 7,701,760 | ||
2017 |
7,368,641 | |||
2018 |
6,983,785 | |||
2019 |
5,363,458 | |||
2020 |
3,554,822 | |||
Thereafter |
5,685,858 | |||
| | | | | |
|
$ | 36,658,324 | ||
| | | | | |
| | | | | |
| | | | | |
For the amortizing intangible assets, the remaining weighted-average amortization period for aggregate net intangible assets at December 31, 2015 is 5.5 years.
F-102
NB Intermediate Holdings, LLC and Subsidiaries
Notes to Audited Consolidated Financial Statements (Continued)
6. Intangible Assets (Continued)
Goodwill consisted of the following at December 31, 2015:
Balance at December 31, 2014 |
$ | 29,551,152 | ||
Acquisition of Sonitec |
551,471 | |||
Acquisition of ProFlo |
436,000 | |||
| | | | | |
Balance at December 31, 2015 |
$ | 30,538,623 | ||
| | | | | |
| | | | | |
| | | | | |
7. Long-Term Debt
On September 11, 2012, the Company entered into a new credit facility with GE Capital ("GE"), which provided a Senior Debt term loan of $47,000,000 and a revolving line of credit of $8,000,000. The Senior Debt term loan was used to repay the Senior Debt term loan provided by Maranon and finance the acquisition of Engineered Treatment Systems, LLC. The Company also amended and restated the Mezzanine Debt agreement to increase loan availability to $22,000,000. Substantially all of the Company's assets are pledged as collateral under these debt agreements with the senior debt having priority over the mezzanine debt. On May 9, 2014, the Company amended and restated their credit facility with GE to increase the senior debt to an aggregate principle amount of $66,475,000. The proceeds of the additional senior debt were used to repay the mezzanine debt of $22,000,000 plus accrued interest on the same date. On April 9, 2015, the Company amended and restated their credit facility with GE to increase the senior debt to an aggregate principle amount of $66,475,000. The additional proceeds totaling $3,500,000 were used to finance the acquisition of Sonitec-Vortisand Technologies ULC. The debt agreements contain certain covenants, including a fixed charge coverage ratio, a leverage ratio, a limit on capital expenditures and EBITDA metrics that must be met on a periodic basis.
Revolving Line of Credit
The Company has an option to calculate interest, on the revolving line of credit, at either LIBOR, with a floor of 1%, plus a margin of 4.50%, or the Bank's base rate, plus a margin of 3.25% (7% at December 31, 2015). The outstanding balance under this agreement at December 31, 2015 was $900,000. The revolving line of credit expires on January 17, 2017. The line is cross-collateralized with the senior debt.
Senior Debt
On September 11, 2012, the Company entered into a senior debt term loan payable in the amount of $47,000,000 to GE in quarterly principal payments of $587,500, plus interest, until September 30, 2016 with a balloon payment totaling $37,600,000 due on January 17, 2017. On May 9, 2014, the Company amended and restated their credit facility to increase the senior debt term loan to an aggregate principle amount of $66,475,000, with quarterly principal payments of $875,000, plus interest, until September 30, 2016 with a balloon payment totaling $57,725,000 due on January 17, 2017.
On April 9, 2015, the Company amended and restated their credit facility to increase the senior debt term loan to an aggregate principle amount of $66,475,000, with quarterly principal payments of $875,000, plus interest, until September 30, 2016 with a balloon payment totaling $61,225,000 due on January 17, 2017. The Company has an option to calculate interest at either LIBOR, with a floor of
F-103
NB Intermediate Holdings, LLC and Subsidiaries
Notes to Audited Consolidated Financial Statements (Continued)
7. Long-Term Debt (Continued)
1%, plus a margin of 4.50%, or the Bank's base rate, plus a margin of 3.25% (7.00% at December 31, 2015).
The outstanding balance on the note at December 31, 2015 was $63,850,000, and is carried net of unamortized debt issue cost of $672,669, as of December 31, 2015.
Long-term debt consisted of the following at December 31, 2015:
Senior debt |
$ | 63,850,000 | ||
Less—unamortized debt issuance costs |
(672,669 | ) | ||
| | | | | |
|
63,177,331 | |||
Less—current portion |
(2,004,073 | ) | ||
| | | | | |
Long-term debt, net of current portion |
$ | 61,173,258 | ||
| | | | | |
| | | | | |
| | | | | |
Aggregate principal maturities of long-term debt at December 31, 2015, are as follows:
2016 |
$ | 2,625,000 | ||
2017 |
61,225,000 | |||
| | | | | |
|
$ | 63,850,000 | ||
| | | | | |
| | | | | |
| | | | | |
8. Member Equity
On July 7, 2011 the Company's Parent organized the Company under the Delaware Limited Liability Company Act. The Company shall continue until dissolved and its affairs wound up in accordance with the Company's operating agreement. There were no Member contributions during the year ended December 31, 2015.
During the year ended December 31, 2015, the Company repurchased a total of 2,418.11 Class A Member units from a former Member for total consideration of $1,141,832.
Member Contributions
The Company's Member shall not be obligated to make any additional equity contributions to the Company. The Member shall not have the right to withdraw or to be repaid any capital contributed by it or to receive any other payment in respect of the Member's interest.
Distributions
Distributions (including without limitation, distributions upon liquidation of the Company) may be made from all cash or property available for distribution and shall be made 100% to the Member. Any distributions made prior to the liquidation of the Company shall be made at such times and in such manner as shall be determined by the Member in its sole discretion. During the year ended December 31, 2015, the Company declared distributions totaling $2,035,403 to its member.
F-104
NB Intermediate Holdings, LLC and Subsidiaries
Notes to Audited Consolidated Financial Statements (Continued)
8. Member Equity (Continued)
Equity Based Compensation
Under the plan, the Parent issues P Units to employees of the Company in connection with and as part of its compensation and incentive arrangements. The P Units were granted at various times during the fiscal year, vest ratably at 20% per year, and are only exercisable in conjunction with a change in control of the Company, consummation of an initial public offering, or dissolution of the Company, as defined by the agreement. The Company recognizes compensation expense for P Units that are issued by its Parent in accordance with the Parent's operating agreement. The Company recognizes the costs associated with P Units using the fair value recognition provisions of ASC 718, Compensation—Stock Compensation on a straight-line basis over the vesting period of the awards.
The Parent issued P Units to certain members of the Company's management and employees during 2015. At December 31, 2015, 14,486 P units were issued and outstanding.
The Company estimates the fair value of each P Unit on the grant date using an option pricing valuation model incorporating the assumptions around the estimated stock price, dividend yield, expected volatility, risk free rate, and the discount associated with the limited marketability of these units.
A summary of P Unit activity, for the year ended December 31, 2015, is as follows:
| |
Nonvested Units |
Weighted-Average Grant Date Fair Value |
|||||
|---|---|---|---|---|---|---|---|
Nonvested at December 31, 2014 |
9,842 | $ | 95.36 | ||||
Granted |
— | — | |||||
Vested |
(2,926 | ) | 95.17 | ||||
Forfeited |
(274 | ) | 90.79 | ||||
| | | | | | | | |
Nonvested at December 31, 2015 |
6,642 | $ | 92.77 | ||||
| | | | | | | | |
| | | | | | | | |
| | | | | | | | |
Compensation expense recognized in the financial statements for the year ended December 31, 2015 was $270,104, and is included in selling, general and administrative expense. As of December 31, 2015, there was approximately $616,069 of unrecognized compensation expense related to nonvested awards that is expected to be recognized from 2016 through 2019.
9. Fair Value Measurements
The following table presents the Company's assets and liabilities measured at fair value on a recurring basis, as of December 31, 2015.
| |
Fair Value Measurement | ||||||||||||
|---|---|---|---|---|---|---|---|---|---|---|---|---|---|
December 31, 2015
|
Level 1 | Level 2 | Level 3 | Total | |||||||||
Contingent consideration payable |
$ | — | $ | — | $ | 582,839 | $ | 582,839 | |||||
| | | | | | | | | | | | | | |
|
$ | — | $ | — | $ | 582,839 | $ | 582,839 | |||||
| | | | | | | | | | | | | | |
| | | | | | | | | | | | | | |
| | | | | | | | | | | | | | |
Included in Level 3 liabilities is the contingent consideration payable to the seller of the Sonitec shares in connection with the Company's acquisition. The obligation was recorded at fair value based
F-105
NB Intermediate Holdings, LLC and Subsidiaries
Notes to Audited Consolidated Financial Statements (Continued)
9. Fair Value Measurements (Continued)
on a weighted probability of the payment amount discounted based on the relative risk of the estimate and the time value of money. The liability is adjusted to fair value at each reporting period. No fair value adjustment was made to the liability between the acquisition date and the balance sheet date aside from payments under the terms of the agreement. The categorization of the framework used to price the liabilities is considered Level 3, due to the subjective nature of the unobservable inputs used to determine the fair value.
Level 3 Value Techniques
Financial assets and liabilities are considered Level 3 when the fair values are determined using pricing models, discounted cash flow methodologies, or similar techniques and at least one significant model assumption or input is unobservable. The following table provides a reconciliation of the Company's Level 3 contingent consideration obligations for each of the following years:
Beginning balance |
$ | — | ||
Contingent consideration from Sonitec acquisition |
291,000 | |||
Contingent consideration from ProFlo acquisition |
350,000 | |||
Payments of contingent consideration |
(58,161 | ) | ||
| | | | | |
Ending balance |
$ | 582,839 | ||
| | | | | |
| | | | | |
| | | | | |
10. Commitments And Contingencies
Operating Lease Commitments
The Company leases several buildings used in the operations of its business, under leases which expire through 2020. Rental payments include amounts for operating expenses and taxes in excess of base-year values established within the leases.
Future minimum rent payments under operating leases with related parties, as discussed in Note 11, in the aggregate and for the next five years ending December 31, are as follows:
2016 |
$ | 821,472 | ||
2017 |
693,783 | |||
2018 |
587,016 | |||
2019 |
587,016 | |||
2020 |
30,762 | |||
| | | | | |
|
$ | 2,720,049 | ||
| | | | | |
| | | | | |
| | | | | |
Rental expense for the operating leases amounted to $742,076, for the year ended December 31, 2015.
Letter of Guarantee
In the ordinary course of business, the Company is contingently liable for performance under letters of guarantee totaling approximately $220,000 at December 31, 2015. The letters of credit are secured by a cash account totaling $259,824.
F-106
NB Intermediate Holdings, LLC and Subsidiaries
Notes to Audited Consolidated Financial Statements (Continued)
10. Commitments And Contingencies (Continued)
Other
During 2015, the Company entered into retention bonuses with certain executives that are payable only upon a sale of the company, as defined. As a result, no amount has been accrued for any future bonus payout under this plan as of December 31, 2015. The amount of the bonuses varies depending on the return on investment to the investors, as defined in the agreement.
The Company is involved in a variety of claims and other legal proceedings generally incidental to its normal business activities. While the outcome of any of these proceedings cannot be accurately predicted, the Company does not believe the ultimate resolution of any of these existing matters would have a material adverse effect on its financial condition or results of operations.
11. Related Party Transactions
Management Agreement
The Company entered into a management services agreement with the majority investor in the Company's parent entity, in July 2011. Under the terms of this agreement the investor is required to provide management and business services to the Company, including financial, marketing, insurance, executive personnel, corporate development and limited legal services, in exchange for an annual fee equal to the greater of $500,000 or a percentage of EBITDA, as defined, plus out of pocket costs, paid on a quarterly basis. The total cost of these services, for the year ended December 31, 2015, was $867,763.
Operating Lease
The Company leased manufacturing and office facilities from Gillespie Court LLC, an entity partially owned by a minority owner and former owner of Neptune-Benson, Inc. The Company leases manufacturing and office facilities from Commercial Drive 238, LLC, an entity partially owned by minority owners of NB Filtration Holdings, LLC and former owner of Engineered Treatment Systems, LLC ("ETS"). Rent expense and future minimum lease payments under these leases are included in Note 10.
Advances
For the year ended December 31, 2015, the Company owed $9,167, to its Parent, NB Filtration Holdings, LLC for various advances, net of reimbursements.
The Company purchases significant amounts of its inventory and supplies from ATG—Willand ("ATG"), an entity partially owned by minority owners of NB Filtration Holdings, LLC and sellers of ETS. Total purchases from ATG, for the year ended December 31, 2015, were $1,904,368. In addition to inventory and supply purchases, ATG provides support services to the Company. Expenses related to support services for 2015 totaled $259,320. Total accounts payable to ATG were $150,973 at December 31, 2015.
The Company also sells products to ATG when ATG is unable to procure material from its suppliers. Net sales to ATG for the year ended December 31, 2015 totaled $45,420. Total accounts receivable from ATG were $3,420 at December 31, 2015.
F-107
NB Intermediate Holdings, LLC and Subsidiaries
Notes to Audited Consolidated Financial Statements (Continued)
11. Related Party Transactions (Continued)
The Company sells product to Neuman Pools, Inc. ("Neuman"), an entity partially owned by minority owners of NB Filtration Holdings, LLC and sellers of ETS. Total sales to Neuman for the year ended December 31, 2015 were $3,872,577. Total accounts receivable from Neuman were $1,397,543 at December 31, 2015.
The Company also shares employee resources with Neuman and reimburses them for certain expenses incurred. Expenses of $6,691 were paid to Neuman for the year ended December 31, 2015. There were no accounts payable due to Neuman at December 31, 2015.
12. Employee Benefit Plan
Defined Contribution Plan
The Company offers a 401(k) plan to its full time employees who have completed one year of continuous service, including time spent at the acquired companies. Employees may contribute a percentage of their annual compensation to the plan, up to the annual IRS limits. The Company does not provide a matching contribution, but, at its sole discretion, does provide a profit sharing contribution to its employees on an annual basis. The Company's contribution under this plan, charged to operations in the year ended December 31, 2015, amounted to $321,734.
13. Subsequent Events
The Company has evaluated subsequent events through April 15, 2016, the date the financial statements were available to be issued. No subsequent events have been identified that require recognition or disclosure other than the events described below.
On January 1, 2016, 3297920 Nova Scotia Limited and Sonitec-Vortisand Technologies ULC were merged together to form Sonitec-Vortisand Technologies, Inc.
On April 15, 2016, Evoqua Water Technologies acquired 100% of the member's equity of the Company for $283.7 million.
F-108
NB Intermediate Holdings, LLC and Subsidiaries
Consolidated Balance Sheets as of March 31, 2016 (unaudited) and December 31, 2015
| |
March 31, 2016 |
December 31, 2015 |
|||||
|---|---|---|---|---|---|---|---|
ASSETS |
|||||||
Cash and cash equivalents |
$ | 1,260,569 | $ | 1,235,155 | |||
Restricted cash |
30,829 | 259,824 | |||||
Accounts receivable, net of allowance for doubtful accounts of $73,541 and $63,541 |
13,380,112 | 18,397,030 | |||||
Inventories, net |
12,973,745 | 10,582,896 | |||||
Prepaid expenses and other current assets |
1,705,418 | 1,310,954 | |||||
| | | | | | | | |
Total current assets |
29,350,673 | 31,785,859 | |||||
| | | | | | | | |
Property and equipment, net |
1,547,762 | 1,343,511 | |||||
Deferred costs |
695,625 | 695,625 | |||||
Intangible assets, net |
34,855,248 | 36,658,324 | |||||
Goodwill |
30,538,623 | 30,538,623 | |||||
| | | | | | | | |
Total other assets |
67,637,258 | 69,236,083 | |||||
| | | | | | | | |
Total assets |
$ | 96,987,931 | $ | 101,021,942 | |||
| | | | | | | | |
| | | | | | | | |
| | | | | | | | |
LIABILITIES AND MEMBER'S EQUITY |
|||||||
Current liabilities: |
|||||||
Revolving loan |
$ | 900,000 | $ | 900,000 | |||
Current portion of long term debt |
62,455,049 | 2,004,073 | |||||
Accounts payable and accrued expenses |
6,065,323 | 8,785,507 | |||||
Distributions payable |
1,664,318 | 2,673,078 | |||||
Customer deposits |
1,356,098 | 773,357 | |||||
Contingent consideration payable |
582,839 | 582,839 | |||||
Due to related party |
— | 5,892 | |||||
| | | | | | | | |
Total current liabilities |
73,023,627 | 15,724,746 | |||||
Long-term debt, net of current portion |
— | 61,173,258 | |||||
| | | | | | | | |
Total liabilities |
73,023,627 | 76,898,004 | |||||
| | | | | | | | |
Commitments and contingencies |
— | — | |||||
Member's equity: |
|||||||
Contributed equity |
44,416,090 | 44,416,090 | |||||
Additional paid in capital |
515,609 | 448,083 | |||||
Accumulated deficit |
(20,967,395 | ) | (20,740,235 | ) | |||
| | | | | | | | |
Total member's equity |
23,964,304 | 24,123,938 | |||||
| | | | | | | | |
Total liabilities and member's equity |
$ | 96,987,931 | $ | 101,021,942 | |||
| | | | | | | | |
| | | | | | | | |
| | | | | | | | |
See notes to consolidated financial statements.
F-109
NB Intermediate Holdings, LLC and Subsidiaries
Unaudited Consolidated Statements of Net Loss for the Three Months Ended March 31,
2015 and 2016
| |
Three months ended | ||||||
|---|---|---|---|---|---|---|---|
| |
March 31, 2016 | March 31, 2015 | |||||
Net sales |
$ | 12,154,800 | $ | 8,992,883 | |||
Cost of goods sold |
5,306,478 | 3,960,993 | |||||
| | | | | | | | |
Gross profit |
6,848,322 | 5,031,890 | |||||
Commission income |
14,283 | 42,816 | |||||
| | | | | | | | |
|
6,862,605 | 5,074,706 | |||||
Selling, general and administrative expenses |
3,706,972 | 2,565,445 | |||||
Acquisition related expenses |
— | 61,836 | |||||
Intangible asset amortization expense |
1,900,907 | 1,813,129 | |||||
Management fees |
221,693 | 199,362 | |||||
| | | | | | | | |
Operating income |
1,033,032 | 434,934 | |||||
| | | | | | | | |
Other expense: |
|||||||
Other expense |
(38,874 | ) | (1,122 | ) | |||
Foreign currency loss |
(32,791 | ) | — | ||||
Interest expense |
(1,188,527 | ) | (1,217,851 | ) | |||
| | | | | | | | |
Net other expense |
(1,260,192 | ) | (1,218,973 | ) | |||
| | | | | | | | |
Net loss |
$ | (227,160 | ) | $ | (784,039 | ) | |
| | | | | | | | |
| | | | | | | | |
| | | | | | | | |
See notes to consolidated financial statements.
F-110
NB Intermediate Holdings, LLC and Subsidiaries
Unaudited Consolidated Statements of Member's Equity for the Three Months Ended March 31, 2016
| |
Contributed Equity |
Additional Paid in Capital |
Accumulated Deficit |
Total Member's Equity |
|||||||||
|---|---|---|---|---|---|---|---|---|---|---|---|---|---|
Balance at December 31, 2015 |
$ | 44,416,090 | $ | 448,083 | $ | (20,740,235 | ) | $ | 24,123,938 | ||||
Net loss |
— | — | (227,160 | ) | (227,160 | ) | |||||||
Equity based compensation |
67,526 | 67,526 | |||||||||||
| | | | | | | | | | | | | | |
Balance at March 31, 2016 |
$ | 44,416,090 | $ | 515,609 | $ | (20,967,395 | ) | $ | 23,964,304 | ||||
| | | | | | | | | | | | | | |
| | | | | | | | | | | | | | |
| | | | | | | | | | | | | | |
See notes to consolidated financial statements.
F-111
NB Intermediate Holdings, LLC and Subsidiaries
Unaudited Consolidated Statements of Cash Flows for the Three Months Ended March 31, 2015
and 2016
| |
Three months ended | ||||||
|---|---|---|---|---|---|---|---|
| |
March 31, 2016 | March 31, 2015 | |||||
Cash flows from operating activities: |
|||||||
Net loss |
$ | (227,160 | ) | $ | (784,039 | ) | |
Adjustments to reconcile net loss to net cash provided by operating activities: |
|||||||
Depreciation |
78,644 | 73,024 | |||||
Amortization |
1,900,907 | 1,813,129 | |||||
Amortization of debt issuance costs |
152,718 | 145,175 | |||||
Equity based compensation |
67,526 | 67,526 | |||||
Loss on disposal of property and equipment |
9,653 | ||||||
Changes in assets and liabilities: |
|||||||
(Increase) decrease in: |
|||||||
Accounts receivable, net |
5,016,918 | 124,719 | |||||
Inventories, net |
(2,390,849 | ) | (2,218,493 | ) | |||
Prepaid expenses |
(394,464 | ) | 461,696 | ||||
Increase (decrease) in: |
|||||||
Accounts payable and accrued expenses |
(2,720,184 | ) | 701,143 | ||||
Customer deposits |
582,741 | 822,502 | |||||
Due to related party |
(5,892 | ) | 3,799 | ||||
| | | | | | | | |
Net cash provided by operating activities |
2,070,558 | 1,210,181 | |||||
| | | | | | | | |
Cash flows from investing activities: |
|||||||
Restriction of cash |
228,995 | — | |||||
Deferred costs |
— | (74,662 | ) | ||||
Purchases of property and equipment |
(292,548 | ) | (47,712 | ) | |||
Purchase acquisitions |
(483,470 | ) | |||||
Purchase of non-compete agreements |
— | (11,000 | ) | ||||
Purchases of intangible assets |
(97,831 | ) | — | ||||
| | | | | | | | |
Net cash used in investing activities |
(161,384 | ) | (616,844 | ) | |||
| | | | | | | | |
Cash flows from financing activities: |
|||||||
Payments on long-term debt |
(875,000 | ) | (875,000 | ) | |||
Distributions paid |
(1,008,760 | ) | (296,419 | ) | |||
| | | | | | | | |
Net cash used in financing activities |
(1,883,760 | ) | (1,171,419 | ) | |||
| | | | | | | | |
Net increase (decrease) in cash and cash equivalents |
25,414 | (578,082 | ) | ||||
Cash and cash equivalents, beginning of period |
1,235,155 | 2,340,394 | |||||
| | | | | | | | |
Cash and cash equivalents, end of period |
$ | 1,260,569 | $ | 1,762,312 | |||
| | | | | | | | |
| | | | | | | | |
| | | | | | | | |
Supplemental disclosures of cash flow information: |
|||||||
Interest paid |
$ | 1,127,382 | $ | 738,084 | |||
| | | | | | | | |
| | | | | | | | |
| | | | | | | | |
Income taxes |
$ | — | $ | — | |||
| | | | | | | | |
| | | | | | | | |
| | | | | | | | |
See notes to consolidated financial statements.
F-112
NB Intermediate Holdings, LLC and Subsidiaries
Unaudited Consolidated Statements of Cash Flows for the Three Months Ended March 31, 2015
and 2016 (Continued)
| |
Three months ended | ||||||
|---|---|---|---|---|---|---|---|
| |
March 31, 2016 | March 31, 2015 | |||||
Supplemental disclosures of investing and financing activities: |
|||||||
Acquisitions: |
|||||||
Inventory |
$ | — | $ | 174,470 | |||
Trademarks and trade names |
— | 23,000 | |||||
Product technology |
— | 200,000 | |||||
Goodwill |
— | 436,000 | |||||
| | | | | | | | |
Net Assets acquired |
— | 833,470 | |||||
Less: contingent consideration payable |
— | (350,000 | ) | ||||
| | | | | | | | |
Cash paid for businesses acquired |
$ | — | $ | 483,470 | |||
| | | | | | | | |
| | | | | | | | |
| | | | | | | | |
Costs incurred with acquisition: |
|||||||
Transaction costs |
$ | $ | 42,383 | ||||
| | | | | | | | |
| | | | | | | | |
| | | | | | | | |
See notes to consolidated financial statements.
F-113
NB Intermediate Holdings, LLC and Subsidiaries
Notes to Unaudited Consolidated Financial Statements
1. Nature of Operations and Basis of Presentation
NB Intermediate Holdings, LLC ("NB Intermediate") is a wholly owned subsidiary of NB Filtration Holdings, LLC. (the "Parent"). NB Intermediate, a Delaware Limited Liability Company, is the sole owner of Neptune-Benson, LLC ("Neptune-Benson"). Neptune-Benson is the sole owner of Engineered Treatment Systems, LLC ("ETS") and 3287920 Nova Scotia Limited ("Nova Scotia"). Nova Scotia is the sole owner of Sonitec-Vortisand Technologies ULC ("Sonitec"). The consolidated financial statements include the accounts of NB Intermediate, Neptune-Benson, ETS, Nova Scotia and Sonitec (together, the "Company"). The Parent, NB Intermediate and Neptune-Benson were established prior to July 7, 2011 for the purpose of acquiring all assets and assuming certain liabilities of Neptune-Benson, Inc. On September 11, 2012, Neptune-Benson acquired the assets and assumed certain liabilities of ETS. On December 6, 2013, Neptune-Benson acquired certain assets of BRI Metal Works, Inc. ("BRI"). Nova Scotia was established on April 9, 2015, for the purpose of acquiring the stock of Sonitec-Vortisand Technologies ULC. On January 14, 2015, Neptune-Benson acquired certain assets of ProFlo, Inc. ("ProFlo").
Neptune-Benson is principally engaged in the design and manufacture of aquatic filtration and recirculation systems, and is headquartered in Coventry, Rhode Island. The Company sells its products to swimming pool and aquatic recreational facilities, aquariums, zoos and water parks throughout the world. The Company generally sells to contractors building or renovating these facilities. ETS is principally engaged in the design and manufacture of UV Systems for the commercial aquatics industry and for the industrial and municipal markets. ETS's manufacturing facility is located in Beaver Dam, Wisconsin. Sonitec is principally engaged in the design and sale of micro-sand filters in the industrial sector. Sonitec's facility is located in Montreal, Canada. Manufacturing for Sonitec filters is performed out of Coventry, Rhode Island. BRI was principally engaged in the design and manufacture of filters and was a significant supplier to Neptune-Benson. ProFlo was principally engaged in the design and manufacture of water strainers.
2. Summary of Significant Accounting Policies
Codification
The accompanying consolidated financial statements have been prepared in accordance with accounting standards set by the Financial Accounting Standards Board ("FASB"). The FASB sets generally accepted accounting principles ("GAAP") that the Company follows to ensure its financial condition, results of operations, and cash flows are consistently reported. References to GAAP issued by the FASB in these notes to the consolidated financial statements are to the FASB Accounting Standards Codification ("ASC").
Principles of Consolidation
The consolidated financial statements include the accounts of the Company and its wholly-owned subsidiaries. All significant intercompany accounts and transactions have been eliminated in consolidation.
Cash and Cash Equivalents
The Company considers all highly liquid investments with original maturity dates of three months or less when purchased, to be cash equivalents.
F-114
NB Intermediate Holdings, LLC and Subsidiaries
Notes to Unaudited Consolidated Financial Statements (Continued)
2. Summary of Significant Accounting Policies (Continued)
The Company maintains its cash and cash equivalents in bank deposit accounts, which, at times may exceed federally insured limits. The Company has not experienced losses in such accounts. The Company believes that it is not exposed to any significant credit risk on cash and cash equivalents.
Restricted Cash
The Company has $30,829 and $40,000 of restricted cash securing corporate credit cards as of March 31, 2016 and December 31, 2015. In addition, as of December 31, 2015, the Company's bank issued letters of guarantee to certain customers totaling $219,824 to guarantee the Company's performance on extended warranty contracts purchased by certain customers. These amounts are classified as restricted cash on the accompanying consolidated balance sheet as of December 31, 2015.
Accounts Receivable
Accounts receivable are stated at the amount management expects to collect from the outstanding balance. On a regular basis, the Company reviews the adequacy of its allowance for doubtful accounts based on historical collection results and current economic conditions using factors based on the aging of its accounts receivable. In addition, the Company estimates specific additional allowances based on indications that a specific customer may be experiencing financial difficulties. When the Company determines that an account is uncollectible, it is written off against the allowance for doubtful accounts. Recoveries of amounts receivable previously written off are recorded when received. A receivable is considered to be past due if any portion of the receivable balance is outstanding for more than 90 days.
Inventories
Inventories, which include material, labor and overhead, are stated at the lower of cost or market. Cost is determined using the first-in, first-out ("FIFO") method. The Company expenses overhead costs related to idle capacity in the period the costs are incurred. On a regular basis, the Company reviews the adequacy of its provision for excess and obsolete inventory based on historical experience, product knowledge and demand estimates. The Company records, as a charge to cost of goods sold, any amounts required to reduce the carrying value of its inventory to net realizable value.
Property and Equipment
Property and equipment are stated at cost. Depreciation of property and equipment is recorded using the straight-line method over the estimated useful lives of the assets. Maintenance and repair costs are expensed as incurred. Upon sale or retirement, the cost and related accumulated depreciation are removed from the respective accounts and the resulting gain or loss is included in current operations.
The estimated useful lives of property and equipment are as follows:
Machinery and equipment |
1 - 5 years | |
Computer equipment and software |
1 - 5 years | |
Office equipment |
1 - 5 years | |
Furniture and fixtures |
1 - 5 years | |
Motor vehicle |
5 years |
F-115
NB Intermediate Holdings, LLC and Subsidiaries
Notes to Unaudited Consolidated Financial Statements (Continued)
2. Summary of Significant Accounting Policies (Continued)
Software Development Costs
Costs for software developed for internal use are accounted for in accordance with ASC 350, Intangibles—Goodwill and Other—Internal-Use Software. ASC 350 requires the capitalization of certain costs incurred in connection with developing or obtaining internal-use software. In accordance with ASC 350, the Company expenses costs incurred in the preliminary project stage of developing or acquiring internal use software, such as research and feasibility studies, as well as costs incurred in the post-implementation/operational stage, such as maintenance and training. Capitalization of software development costs occurs only after the preliminary project stage is complete, management authorizes the project, and it is probable that the project will be completed and the software will be used for the function intended. Costs associated with the purchase and development of computer software are capitalized and amortized on a straight-line basis over the estimated useful life of the related asset once placed in service. Software development costs totaling $695,625 are recorded in deferred costs as of March 31, 2016 and December 31, 2015 and have not yet been placed in service. The capitalized costs include software license fees and contractor development and implementation costs. The software development project was put on hold by management late in 2015 and is expected to be continued in early 2016.
Impairment of Long-Lived Assets
The Company accounts for impairment of long-lived assets in accordance with ASC 360—Property, Plant and Equipment. ASC 360 requires that long-lived assets, including definite-lived intangibles, be reviewed for impairment whenever events or changes in circumstances indicate that the book value of the asset may not be recoverable. The Company evaluates whether events and circumstances have occurred that indicate possible impairment.
An asset is considered impaired if the net book value of the asset exceeds the future projected undiscounted cash flows anticipated to be generated by the asset. The impairment is then measured as the excess of the net book value of the asset over its estimated fair value. For the quarters ended March 31, 2016 and 2015, no impairment charge was required.
Debt Issuance Costs
Debt issuance costs consist of capitalized professional fees, bank fees and other costs associated with the securing of bank financing. These costs represent a debt discount and reduce the carrying value of the related debt. The costs are being amortized using the effective interest method over the terms of the respective debt agreements.
Amortization expense for the quarters ended March 31, 2016 and 2015 was $152,718 and $145,175, respectively, and is included in interest expense in the accompanying consolidated statements of operations.
Goodwill and Intangible Assets
The Company accounts for business combinations pursuant to ASC 805, Business Combinations. Goodwill in such acquisitions represents the excess of the cost of a business acquired over the fair value of the net assets acquired, including identifiable intangible assets, and liabilities assumed. ASC 805 specifies criteria to be used in determining whether intangible assets acquired in a business
F-116
NB Intermediate Holdings, LLC and Subsidiaries
Notes to Unaudited Consolidated Financial Statements (Continued)
2. Summary of Significant Accounting Policies (Continued)
combination must be recognized and reported separately from goodwill. Amounts assigned to goodwill and other identifiable intangible assets were determined with the assistance of an independent appraiser using a market approach and a discounted cash flow analysis.
Under FASB ASC 350, Intangibles—Goodwill and Other, intangible assets with indefinite lives are reviewed annually for impairment. The review for impairment consists of a comparison of the fair value of the asset with its carrying amount. Fair value is an estimate of the price a willing buyer would pay for the intangible asset and is generally estimated by discounting the expected future cash flows associated with the intangible asset.
In accordance with the related guidance, the Company, with the assistance of independent valuation experts, conducts an impairment evaluation for goodwill at least annually, or more frequently, if events or changes in circumstances indicate that an asset might be impaired. The evaluation is performed using a two-step process. The first step (defined as "Step 1") compares the book value of the Company's reporting unit to its estimated fair value. The second step (defined as "Step 2") of the goodwill impairment test, which is only required when the net book value of the reporting unit exceeds the fair value, compares the implied fair value of goodwill to its book value to determine if an impairment is required. The Company estimates the fair value of its reporting units using the income and market approaches which measure the value of an intangible asset based on the expected stream of monetary benefits attributable to it over its remaining useful life, and market appraisal. The Company has two reporting units and performs its annual step 1 analysis in the fourth quarter.
The Company provides for amortization of intangible assets with definite lives using straight-line methods over their estimated useful lives. The amortization periods of the intangible assets are as follows:
Trademarks and trade names |
10 years | |
Developed technology |
9 years | |
Backlog |
<1 year | |
Non-compete agreements |
5 years | |
Customer relationships |
9 years | |
Patents |
9 years | |
Software development costs |
3 years |
Revenue Recognition
Revenue from product sales is recorded, net of sales tax, at the time of shipment, provided that persuasive evidence of an arrangement exists, the seller's price to the buyer is fixed or determinable and collectability is reasonably assured. Shipping and handling fees charged to customers are recognized at the time the products are shipped and are included in net sales. The related shipping and handling costs are included in cost of goods sold on the accompanying consolidated statements of operations.
The company follows the guidance of Accounting Standards Codification ("ASC") Subtopic 605-25, Multi-Deliverable Revenue Arrangements (ASC 605-25). Agreements containing multiple elements are divided into separate units of accounting if certain criteria are met, including whether the delivered element has a stand-alone value to the customer. The consideration received is then allocated among the separate units based on the hierarchy discussed below. For those deliverables that qualify as
F-117
NB Intermediate Holdings, LLC and Subsidiaries
Notes to Unaudited Consolidated Financial Statements (Continued)
2. Summary of Significant Accounting Policies (Continued)
separate units of accounting, the Company must assign value based on each deliverable's vendor-specific objective evidence ("VSOE") of the value, if applicable, third-party evidence ("TPE") of its value if VSOE is not available, or estimated selling price ("ESP") if neither VSOE or TPE is available. Arrangement consideration is then allocated to all deliverables using the relative selling price method.
Concentration of Credit Risk and Major Customers
For the quarter ended March 31, 2016 the Company had one customer (Neuman Pools, Inc., a related party, see Note 11) that accounted for 12.5% of sales. As of March 31, 2016, the same customer accounted for 11% of the accounts receivable balance. No other customers exceed 10% of sales for the quarter ended March 31, 2015 or exceeded 10% of the accounts receivable balance as of December 31, 2015.
Fair Value Measurements
The Company follows current accounting standards for fair value measurements, which define fair value as "the price that would be received to sell an asset or paid to transfer a liability in an orderly transaction between market participants at the measurement date", and establish a fair value hierarchy that requires an entity to maximize the use of observable inputs and minimize the use of unobservable inputs when measuring fair value. A financial instrument's categorization within the fair value hierarchy is based upon the lowest level of input that is significant to the fair value measurement. There are three levels of inputs that may be used to measure fair value.
Level 1—Applies to assets or liabilities for which there are quoted prices in active markets for identical assets or liabilities. |
Level 2—Applies to assets or liabilities for which there are inputs, other than quoted prices included within Level 1, that are observable for the asset or liability such as quoted prices for similar assets or liabilities in active markets; quoted prices for identical assets or liabilities in markets with insufficient volume or infrequent transactions (less active markets); or model-derived valuations in which significant inputs are observable or can be derived principally from, or corroborated by, observable market data. |
Level 3—Applies to assets or liabilities for which there are unobservable inputs to the valuation methodology that are significant to the measurement of the fair value of the assets or liabilities. |
Use of Estimates
The preparation of consolidated financial statements in conformity with accounting principles generally accepted in the United States of America requires management to make estimates and assumptions that affect the reported amounts of assets and liabilities and disclosure of contingent assets and liabilities at the date of the financial statements and the reported amount of revenues and expenses during the reporting period. Actual results could differ from those estimates. Significant estimates included in the consolidated financial statements include allowance for doubtful accounts, excess and obsolete inventory, warranty reserves, equity based compensation, contingent consideration and the estimated values and lives of long-lived assets, including goodwill and intangible assets.
F-118
NB Intermediate Holdings, LLC and Subsidiaries
Notes to Unaudited Consolidated Financial Statements (Continued)
2. Summary of Significant Accounting Policies (Continued)
Product Warranties
Most of the Company's products carry a product warranty, which generally provides customers the right to return defective product during the specified warranty period, for repair or replacement at no cost to the customer. Based upon a specific issue identified during 2013, with respect to certain grates sold through June 2013, the Company recorded a warranty reserve. Management has determined there was no requirement for a warranty reserve on other products. Following is a schedule of warranty reserve activity:
| |
March 31, 2016 |
December 31, 2015 |
|||||
|---|---|---|---|---|---|---|---|
Warranty reserve, beginning balance |
$ | 204,570 | $ | 239,845 | |||
Warranty costs |
— | ||||||
Warranty claims |
— | (35,275 | ) | ||||
| | | | | | | | |
Warranty reserve, ending balance |
$ | 204,570 | $ | 204,570 | |||
| | | | | | | | |
| | | | | | | | |
| | | | | | | | |
Financial Instruments
The carrying amount of cash and cash equivalents, accounts receivable, accounts payable, accrued expenses and customer deposits approximate fair value due to the short term nature of these instruments. The carrying amount of the long-term debt is reported net of unamortized debt issuance costs totaling $519,952 at March 31, 2016. The face value of the senior debt and revolving line of credit approximates fair value as the related interest rates approximate the Company's incremental borrowing rate for similar obligations. The face value of the related debt instruments are presented in Note 7. In addition, the senior and revolving debt are at variable rates. The following table summarizes the estimated fair values of the Company's other financial instruments at March 31, 2016 and December 31, 2015:
| |
Fair Value at March 31, 2016 |
Fair Value at December 31, 2015 |
|||||
|---|---|---|---|---|---|---|---|
Senior debt and revolving loan |
$ | 63,875,000 | $ | 64,750,000 | |||
| | | | | | | | |
| | | | | | | | |
| | | | | | | | |
Equity Based Compensation
The Company accounts for equity-based awards to employees using the fair value method as prescribed by U.S. GAAP. Accordingly, compensation expense is recorded for the fair value of equity awards issued to employees measured at the date of grant, over the requisite service period.
Compensation costs for unit awards issued to employees and expected to vest, are recognized over the vesting period based on the grant date fair value of the unit awards. For time based awards, compensation cost is recognized on a straight-line basis over the vesting period. The grant date has been considered the measurement date for all awards granted.
The fair value of each grant is estimated on the date of the grant based on a valuation of the equity interests issued, which is performed by a third party valuation specialist.
F-119
NB Intermediate Holdings, LLC and Subsidiaries
Notes to Unaudited Consolidated Financial Statements (Continued)
2. Summary of Significant Accounting Policies (Continued)
Income Taxes
The Company is a Limited Liability Company which has elected to be taxed as a partnership. The Company is not liable for any income taxes. The members of the Company's parent will pay income taxes on their respective share of the Company's income. The Company will declare and pay distributions calculated at the highest tax rate of the members on the income earned and reported by the Company on its tax returns. Such amounts will be recognized as a distribution in the period in which the income is earned. The Company did not declare distributions for the quarters ended March 31, 2016 and 2015.
The Company follows FASB ASC 740, Accounting for Uncertainty in Income Taxes ("ASC 740"). ASC 740 provides guidance for how uncertain tax positions should be recognized, measured, presented and disclosed in the financial statements. ASC 740 also requires the evaluation of tax positions taken or expected to be taken in the course of preparing the Company's tax returns to determine whether the tax positions are more-likely-than-not of being sustained by the applicable tax authority. Tax positions not deemed to meet a more-likely-than-not threshold would be recorded as a tax expense in the current year.
The Company files tax returns in the federal and various state jurisdictions. Management has reviewed the Company's tax positions for the open tax years 2012 - 2016 and has determined that no provision for uncertain tax positions is required in the Company's consolidated financial statements. Penalties and interest, if any, would be recorded in income tax expense.
Foreign Currency Translation
The Company accounts for activity with its Sonitec subsidiary in accordance with ASC 830, Foreign Currency Matters. The Company determined that the functional currency of the Sonitec subsidiary is the United States Dollar.
Accordingly, all monetary assets and liabilities of the Sonitec subsidiary are remeasured into U.S. dollars at exchange rates in effect as of the balance sheet date, and nonmonetary assets and liabilities are translated at historical exchange rates. Results of operations are remeasured at the average exchange rates for the period.
The transaction losses for the quarters ended March 31, 2016 and 2015 were $32,791 and $0, respectively, and are recorded in other income (expense), net, in the consolidated statements of net loss for the quarters then ended.
Recent Accounting Policies
On August 12, 2015, the FASB issued Accounting Standards Update (ASU) 2015-14, Revenue from Contracts with Customers (Topic 606): Deferral of the Effective Date. This ASU: (a) defers the effective date of ASU 2014-09, Revenue from Contracts with Customers (Topic 606), by one year for both public and nonpublic entities and (b) allows early adoption of the ASU by all entities as of the original effective date for public entities. ASU 2014-09, Revenue from Contracts with Customers (Topic 606), will require an entity to recognize the amount of revenue to which it expects to be entitled for the transfer of promised goods or services to customers. The updated standard will replace most existing revenue recognition guidance in U.S. GAAP when it becomes effective for annual reporting
F-120
NB Intermediate Holdings, LLC and Subsidiaries
Notes to Unaudited Consolidated Financial Statements (Continued)
2. Summary of Significant Accounting Policies (Continued)
periods beginning after December 15, 2018. The Company is currently assessing the impact adoption of this guidance will have on its consolidated financial statements.
The FASB issued Accounting Standards Update (ASU) 2015-03, Interest—Imputation of Interest (Subtopic 835-30): Simplifying the Presentation of Debt Issuance Cost. This ASU requires that debt issuance costs related to a recognized debt liability be presented in the balance sheet as a direct deduction from the carrying amount of that debt liability, consistent with debt discounts. The recognition and measurement guidance for debt issuance costs is not affected by the new guidance. This standard was implemented as of December 31, 2015.
In February 2016, the FASB issued ASU No. 2016-02, Leases (Topic 842). ASU No. 2016-02 requires recognition of operating leases as lease assets and liabilities on the balance sheet, and disclosure of key information about leasing arrangements. ASU No. 2016-02 will be effective retrospectively for the Company for the quarter ending December 31, 2019, with early adoption permitted. The Company is currently assessing the impact adoption of this guidance will have on its consolidated financial statements.
3. Business Combinations
Sonitec Acquisition
On April 9, 2015, Neptune-Benson acquired all of the stock of Sonitec-Vortisand Technologies ULC and non-compete agreements with the seller, for a total consideration of $2,727,957, including a working capital settlement of $102,673, paid in January 2016. Of the total consideration, $2,637,957 was allocated to the purchase and $90,000 was allocated to the non-compete agreements. Of the consideration transferred, $2,334,284 was paid in cash to the sellers and a contingent earn out with an estimated fair market value of $291,000 was incurred. The contingent consideration requires the Company to make additional payments to the sellers, based on the performance of the business. The contingent payment is based on the value of purchase orders received for the year ending December 31, 2016 and was calculated by the Company's third party valuation specialist based on a probability weighting of likely outcomes.
Assets acquired and liabilities assumed in connection with the acquisition have been recorded at their fair values. The excess of the acquisition price over the fair value of the assets acquired and liabilities assumed was recorded as goodwill. All of the goodwill is deductible by the Parent Company's members for tax purposes. For the year ending December 31, 2015, the Company incurred $483,654 in
F-121
NB Intermediate Holdings, LLC and Subsidiaries
Notes to Unaudited Consolidated Financial Statements (Continued)
3. Business Combinations (Continued)
acquisition related expenses. The following summarizes the estimated fair value of the assets acquired and liabilities assumed by the Company in accordance with the acquisition method of accounting:
Accounts receivable |
$ | 328,901 | ||
Inventory |
308,560 | |||
Prepaid expenses and other current assets |
85,820 | |||
Property and equipment |
85,928 | |||
Tradename |
220,000 | |||
Product technology |
760,000 | |||
Customer relationships |
1,500,000 | |||
Backlog |
60,000 | |||
Goodwill |
551,471 | |||
Accounts payable and accrued expenses |
(473,543 | ) | ||
Customer deposits |
(150,070 | ) | ||
Short-term debt |
(323,110 | ) | ||
Sonitec former stockholder advances |
(316,000 | ) | ||
| | | | | |
Net assets acquired |
$ | 2,637,957 | ||
| | | | | |
| | | | | |
| | | | | |
Fair market value of net assets acquired:
Total fair market value of net assets acquired |
$ | 2,637,957 | ||
Less: contingent consideration |
(291,000 | ) | ||
Less: working capital settlement payable |
(102,673 | ) | ||
| | | | | |
Cash paid for net assets acquired |
$ | 2,244,284 | ||
| | | | | |
| | | | | |
| | | | | |
The purpose of the transaction was to expand and diversify the Company's customer base to include industrial and municipal markets and to add complimentary products and services. Goodwill recorded in the transaction reflects the synergistic value of the customer base and product lines of the companies acquired and the Company's ability to leverage the existing and newly acquired resources to expand sales and profitability. The costs of the non-compete agreements are amortized over the life of the agreements.
The contractual gross receipts acquired were $364,723. Management anticipates recovery of these receipts of $328,901.
ProFlo, Inc. Acquisition
On January 14, 2015, Neptune-Benson acquired certain assets of ProFlo, Inc., for a total consideration of $844,470. Of the total consideration, $833,470 was allocated to the purchase and $11,000 was allocated to the non-compete agreements. Of the consideration transferred, $494,470 was paid in cash to the sellers and a contingent earn out with an estimated fair market value of $350,000 was incurred. The contingent consideration requires the Company to make additional payments to the sellers, based on the performance of the business. The contingent consideration was calculated by the Company's third party valuation specialist based on a probability weighting of potential outcomes discounted for the inherent risk and time value of money. Assets acquired in connection with the
F-122
NB Intermediate Holdings, LLC and Subsidiaries
Notes to Unaudited Consolidated Financial Statements (Continued)
3. Business Combinations (Continued)
acquisition have been recorded at their fair values. For the year ending December 31, 2015, the Company incurred $43,753 in acquisition related expenses.
The following summarizes the estimated fair value of the assets acquired by the Company in accordance with the acquisition method of accounting:
Inventory |
$ | 174,470 | ||
Tradename |
23,000 | |||
Product technology |
200,000 | |||
Goodwill |
436,000 | |||
| | | | | |
Total assets acquired |
$ | 833,470 | ||
| | | | | |
| | | | | |
| | | | | |
Fair market value of net assets acquired:
Total fair market value of net assets acquired |
$ | 833,470 | ||
Less: contingent consideration |
(350,000 | ) | ||
| | | | | |
Cash paid for net assets acquired |
$ | 483,470 | ||
| | | | | |
| | | | | |
| | | | | |
The purpose of the transaction was to acquire a key product from a supplier to the Company and benefit from improved margins and the ability to accelerate the delivery of completed products.
4. Inventories
Inventories consisted of the following:
| |
March 31, 2016 |
December 31, 2015 |
|||||
|---|---|---|---|---|---|---|---|
Finished goods |
$ | 5,676,944 | $ | 4,630,776 | |||
WIP |
3,328,091 | 2,714,778 | |||||
Raw materials |
3,968,710 | 3,237,342 | |||||
| | | | | | | | |
|
$ | 12,973,745 | $ | 10,582,896 | |||
| | | | | | | | |
| | | | | | | | |
| | | | | | | | |
F-123
NB Intermediate Holdings, LLC and Subsidiaries
Notes to Unaudited Consolidated Financial Statements (Continued)
5. Property and Equipment
Property and equipment consisted of the following:
| |
March 31, 2016 |
December 31, 2015 |
|||||
|---|---|---|---|---|---|---|---|
Machinery and equipment |
$ | 1,510,668 | $ | 1,284,666 | |||
Computer equipment |
291,029 | 229,859 | |||||
Office equipment |
184,702 | 183,250 | |||||
Furniture and fixtures |
269,391 | 269,391 | |||||
Leasehold improvements |
101,507 | 97,583 | |||||
Motor vehicles |
104,832 | 104,832 | |||||
| | | | | | | | |
|
2,462,129 | 2,169,581 | |||||
Less—accumulated depreciation |
(914,367 | ) | (826,070 | ) | |||
| | | | | | | | |
|
$ | 1,547,762 | $ | 1,343,511 | |||
| | | | | | | | |
| | | | | | | | |
| | | | | | | | |
Total depreciation expense for the quarter ended March 31, 2016 and 2015 was $78,644 and $73,024, respectively.
6. Intangible Assets
Intangible assets consisted of the following:
| |
March 31, 2016 | |||||||||
|---|---|---|---|---|---|---|---|---|---|---|
| |
Cost | Accumulated Amortization |
Net Book Value |
|||||||
Definite lived intangible assets: |
||||||||||
Trademarks and trade names |
$ | 16,543,000 | $ | (6,996,268 | ) | $ | 9,546,732 | |||
Developed Technology |
9,960,000 | (5,099,935 | ) | 4,860,065 | ||||||
Backlog |
1,620,000 | (1,618,750 | ) | 1,250 | ||||||
Non-compete agreements |
1,451,000 | (1,126,258 | ) | 324,742 | ||||||
Customer relationships |
39,373,000 | (19,543,745 | ) | 19,829,255 | ||||||
Patents |
293,204 | — | 293,204 | |||||||
| | | | | | | | | | | |
|
$ | 69,240,204 | $ | (34,384,956 | ) | $ | 34,855,248 | |||
| | | | | | | | | | | |
| | | | | | | | | | | |
| | | | | | | | | | | |
| |
December 31, 2015 | |||||||||
|---|---|---|---|---|---|---|---|---|---|---|
| |
Cost | Accumulated Amortization |
Net Book Value |
|||||||
Definite lived intangible assets: |
||||||||||
Trademarks and trade names |
$ | 16,543,000 | $ | (6,582,693 | ) | $ | 9,960,307 | |||
Developed Technology |
9,960,000 | (4,805,014 | ) | 5,154,986 | ||||||
Backlog |
1,620,000 | (1,603,750 | ) | 16,250 | ||||||
Non-compete agreements |
1,451,000 | (1,053,708 | ) | 397,292 | ||||||
Customer relationships |
39,373,000 | (18,438,884 | ) | 20,934,116 | ||||||
Patents |
195,373 | — | 195,373 | |||||||
| | | | | | | | | | | |
|
$ | 69,142,373 | $ | (32,484,049 | ) | $ | 36,658,324 | |||
| | | | | | | | | | | |
| | | | | | | | | | | |
| | | | | | | | | | | |
F-124
NB Intermediate Holdings, LLC and Subsidiaries
Notes to Unaudited Consolidated Financial Statements (Continued)
6. Intangible Assets (Continued)
Amortization expense totaled $1,900,907 and $1,813,129 for the quarters ended March 31, 2016 and 2015, respectively.
7. Long-Term Debt
On September 11, 2012, the Company entered into a new credit facility with GE Capital ("GE"), which provided a Senior Debt term loan of $47,000,000 and a revolving line of credit of $8,000,000. The Senior Debt term loan was used to repay the Senior Debt term loan provided by Maranon and finance the acquisition of Engineered Treatment Systems, LLC. The Company also amended and restated the Mezzanine Debt agreement to increase loan availability to $22,000,000. Substantially all of the Company's assets are pledged as collateral under these debt agreements with the senior debt having priority over the mezzanine debt. On May 9, 2014, the Company amended and restated their credit facility with GE to increase the senior debt to an aggregate principle amount of $66,475,000. The proceeds of the additional senior debt were used to repay the mezzanine debt of $22,000,000 plus accrued interest on the same date. On April 9, 2015, the Company amended and restated their credit facility with GE to increase the senior debt to an aggregate principle amount of $66,475,000. The additional proceeds totaling $3,500,000 were used to finance the acquisition of Sonitec-Vortisand Technologies ULC. The debt agreements contain certain covenants, including a fixed charge coverage ratio, a leverage ratio, a limit on capital expenditures and EBITDA metrics that must be met on a periodic basis.
Revolving Line of Credit
The Company has an option to calculate interest, on the revolving line of credit, at either LIBOR, with a floor of 1%, plus a margin of 4.50%, or the Bank's base rate, plus a margin of 3.25% (6.75% and 7% at March 31, 2016 and December 31, 2015, respectively). The outstanding balance under this agreement at March 31, 2016 was $900,000. The revolving line of credit expires on January 17, 2017. The line is cross-collateralized with the senior debt.
Senior Debt
On September 11, 2012, the Company entered into a senior debt term loan payable in the amount of $47,000,000 to GE in quarterly principal payments of $587,500, plus interest, until September 30, 2016 with a balloon payment totaling $37,600,000 due on January 17, 2017. On May 9, 2014, the Company amended and restated their credit facility to increase the senior debt term loan to an aggregate principle amount of $66,475,000, with quarterly principal payments of $875,000, plus interest, until September 30, 2016 with a balloon payment totaling $57,725,000 due on January 17, 2017.
On April 9, 2015, the Company amended and restated their credit facility to increase the senior debt term loan to an aggregate principle amount of $66,475,000, with quarterly principal payments of $875,000, plus interest, until September 30, 2016 with a balloon payment totaling $61,225,000 due on January 17, 2017. The Company has an option to calculate interest at either LIBOR, with a floor of 1%, plus a margin of 4.50%, or the Bank's base rate, plus a margin of 3.25% (6.75% at March 31, 2016).
The outstanding balance on the note at March 31, 2016 and December 31, 2015 was $62,975,001 and $63,850,000, respectively, and is carried net of unamortized debt issue cost of $519,952 and $672,669, respectively, as of March 31, 2016 and December 31, 2015.
F-125
NB Intermediate Holdings, LLC and Subsidiaries
Notes to Unaudited Consolidated Financial Statements (Continued)
7. Long-Term Debt (Continued)
Long-term debt consisted of the following at March 31, 2016 and December 31, 2015:
| |
March 31, 2016 |
December 31, 2015 |
|||||
|---|---|---|---|---|---|---|---|
Senior debt |
$ | 62,975,001 | $ | 63,850,000 | |||
Less—unamortized debt issuance costs |
(519,952 | ) | (672,669 | ) | |||
| | | | | | | | |
|
62,455,049 | 63,177,331 | |||||
Less—current portion |
(62,455,049 | ) | (2,004,073 | ) | |||
| | | | | | | | |
Long-term debt, net of current portion |
$ | — | $ | 61,173,258 | |||
| | | | | | | | |
| | | | | | | | |
| | | | | | | | |
Aggregate principal maturities of long-term debt at March 31, 2016 and December 31, 2015, are as follows:
| |
March 31, 2016 |
December 31, 2015 |
|||||
|---|---|---|---|---|---|---|---|
Due within one year |
$ | 62,975,001 | $ | 2,625,000 | |||
Due thereafter |
— | 61,225,000 | |||||
| | | | | | | | |
|
$ | 62,975,001 | $ | 63,850,000 | |||
| | | | | | | | |
| | | | | | | | |
| | | | | | | | |
8. Member's Equity
On July 7, 2011 the Company's Parent organized the Company under the Delaware Limited Liability Company Act. The Company shall continue until dissolved and its affairs wound up in accordance with the Company's operating agreement. There were no Member contributions during the quarters ended March 31, 2016 and 2015.
Distributions
Distributions (including without limitation, distributions upon liquidation of the Company) may be made from all cash or property available for distribution and shall be made 100% to the Member. Any distributions made prior to the liquidation of the Company shall be made at such times and in such manner as shall be determined by the Member in its sole discretion. During the quarters ended March 31, 2016 and 2015, the Company declared zero distributions to its member.
Equity Based Compensation
The Parent issues P Units to employees of the Company in connection with and as part of its compensation and incentive arrangements. The Company recognizes compensation expense for P Units that are issued by its Parent in accordance with the Parent's operating agreement. The Company recognizes the costs associated with P Units using the fair value recognition provisions of ASC 718, Compensation—Stock Compensation on a straight-line basis over the vesting period of the awards.
F-126
NB Intermediate Holdings, LLC and Subsidiaries
Notes to Unaudited Consolidated Financial Statements (Continued)
9. Fair Value Measurements
The following table as of both March 31, 2016 and December 31, 2015 presents the Company's assets and liabilities measured at fair value on a recurring basis.
| |
Fair Value Measurement | ||||||||||||
|---|---|---|---|---|---|---|---|---|---|---|---|---|---|
| |
Level 1 | Level 2 | Level 3 | Total | |||||||||
Contingent consideration payable |
$ | — | $ | — | $ | 582,839 | $ | 582,839 | |||||
| | | | | | | | | | | | | | |
|
$ | — | $ | — | $ | 582,839 | $ | 582,839 | |||||
| | | | | | | | | | | | | | |
| | | | | | | | | | | | | | |
| | | | | | | | | | | | | | |
Included in Level 3 liabilities is the contingent consideration payable to the seller of the Sonitec shares in connection with the Company's acquisition. The obligation was recorded at fair value based on a weighted probability of the payment amount discounted based on the relative risk of the estimate and the time value of money. The liability is adjusted to fair value at each reporting period. No fair value adjustment was made to the liability between the acquisition date and the balance sheet date aside from payments under the terms of the agreement. The categorization of the framework used to price the liabilities is considered Level 3, due to the subjective nature of the unobservable inputs used to determine the fair value.
Level 3 Value Techniques
Financial assets and liabilities are considered Level 3 when the fair values are determined using pricing models, discounted cash flow methodologies, or similar techniques and at least one significant model assumption or input is unobservable. The following table provides a make-up of the Company's Level 3 contingent consideration obligations as of both March 31, 2016 and December 31, 2015:
Contingent consideration from Sonitec acquisition |
$ | 291,000 | ||
Contingent consideration from ProFlo acquisition |
291,839 | |||
| | | | | |
|
$ | 582,839 | ||
| | | | | |
| | | | | |
| | | | | |
10. Commitments and Contingencies
Operating Lease Commitments
The Company leases several buildings used in the operations of its business, under leases which expire through 2020. Rental payments include amounts for operating expenses and taxes in excess of base-year values established within the leases.
Future minimum rent payments under operating leases with related parties, as discussed in Note 11, in the aggregate and for the next five years ending December 31, are as follows:
April 1 - December 31, 2016 |
$ | 616,104 | ||
2017 |
693,783 | |||
2018 |
587,016 | |||
2019 |
587,016 | |||
2020 |
30,762 | |||
| | | | | |
|
$ | 2,514,681 | ||
| | | | | |
| | | | | |
| | | | | |
F-127
NB Intermediate Holdings, LLC and Subsidiaries
Notes to Unaudited Consolidated Financial Statements (Continued)
10. Commitments and Contingencies (Continued)
Rental expense for the operating leases was $186,497 and $131,747 for the quarters ended March 31, 2016 and 2015, respectively.
Other
During 2015, the Company entered into retention bonuses with certain executives that are payable only upon a sale of the company, as defined. As a result, no amount has been accrued for any future bonus payout under this plan as of March 31, 2016. The amount of the bonuses varies depending on the return on investment to the investors, as defined in the agreement.
The Company is involved in a variety of claims and other legal proceedings generally incidental to its normal business activities. While the outcome of any of these proceedings cannot be accurately predicted, the Company does not believe the ultimate resolution of any of these existing matters would have a material adverse effect on its financial condition or results of operations.
11. Related Party Transactions
Management Agreement
The Company entered into a management services agreement with the majority investor in the Company's parent entity, in July 2011. Under the terms of this agreement the investor is required to provide management and business services to the Company, including financial, marketing, insurance, executive personnel, corporate development and limited legal services, in exchange for an annual fee equal to the greater of $500,000 or a percentage of EBITDA, as defined, plus out of pocket costs, paid on a quarterly basis. The total cost of these services, for the quarters ended March 31, 2016 and 2015 was $221,693 and $199,362, respectively.
Operating Lease
The Company leased manufacturing and office facilities from Gillespie Court LLC, an entity partially owned by a minority owner and former owner of Neptune-Benson, Inc. The Company leases manufacturing and office facilities from Commercial Drive 238, LLC, an entity partially owned by minority owners of NB Filtration Holdings, LLC and former owner of Engineered Treatment Systems, LLC ("ETS"). Rent expense and future minimum lease payments under these leases are included in Note 10.
Advances
As of March 31, 2016 and December 31, 2015, the Company owed $9,167 to its Parent, NB Filtration Holdings, LLC for various advances, net of reimbursements.
The Company purchases significant amounts of its inventory and supplies from ATG—Willand ("ATG"), an entity partially owned by minority owners of NB Filtration Holdings, LLC and sellers of ETS. Total purchases from ATG, for the quarters ended March 31, 2016 and 2015 was $423,088 and $438,279, respectively. In addition to inventory and supply purchases, ATG provides support services to the Company. Expenses related to support services and royalties for the quarter ended March 31, 2016 were $45,675 and $10,525, respectively. Expenses related to support services and royalties for the quarter ended March 31, 2015 were $45,405 and zero, respectively. Total accounts payable to ATG was $87,842 and $150,973 at March 31, 2016 and December 31, 2015, respectively.
F-128
NB Intermediate Holdings, LLC and Subsidiaries
Notes to Unaudited Consolidated Financial Statements (Continued)
11. Related Party Transactions (Continued)
The Company also sells products to ATG when ATG is unable to procure material from its suppliers. Net sales to ATG for the quarters ended March 31, 2016 and December 31, 2015 totaled $1,454 and $2,716 respectively. Total accounts receivable from ATG was $4,874 and $3,420 at March 31, 2016 and December 31, 2015, respectively.
The Company sells product to Neuman Pools, Inc. ("Neuman"), an entity partially owned by minority owners of NB Filtration Holdings, LLC and sellers of ETS. Total sales to Neuman for the quarters ended March 31, 2016 and 2015 were $1,504,992 and $305,951, respectively. Total accounts receivable from Neuman was $1,554,635 and $1,397,543 at March 31, 2016 and December 31, 2015, respectively.
The Company also shares employee resources with Neuman and reimburses them for certain expenses incurred. Expenses of zero and $466 were paid to Neuman for the quarters ended March 31, 2016 and 2015, respectively.
12. Employee Benefit Plan
Defined Contribution Plan
The Company offers a 401(k) plan to its full time employees who have completed one year of continuous service, including time spent at the acquired companies. Employees may contribute a percentage of their annual compensation to the plan, up to the annual IRS limits. The Company does not provide a matching contribution, but, at its sole discretion, does provide a profit sharing contribution to its employees on an annual basis. The Company's contribution under this plan, charged to operations in the quarter ended March 31, 2016 and 2015 was $79,527 and $82,233, respectively.
13. Subsequent Events
The Company has evaluated subsequent events through July 17, 2017, the date the financial statements were available to be issued. No subsequent events have been identified that require recognition or disclosure other than the events described below.
On April 15, 2016, Evoqua Water Technologies acquired 100% of the member's equity of the Company for $283.7 million.
F-129
27,777,777 Shares
Evoqua Water Technologies Corp.
Common Stock

Credit Suisse
J.P. Morgan
RBC Capital Markets
Citigroup
Goldman Sachs & Co. LLC
Morgan Stanley
Baird
Raymond James
Stifel
Wells Fargo Securities
Through and including , 2017 (the 25th day after the date of this prospectus), all dealers effecting transactions in these securities, whether or not participating in this offering, may be required to deliver a prospectus. This is in addition to a dealer's obligation to deliver a prospectus when acting as an underwriter and with respect to an unsold allotment or subscription.
PART II.
INFORMATION NOT REQUIRED IN PROSPECTUS
Item 13. Other Expenses of Issuance and Distribution
The following table sets forth all the costs and expenses, other than underwriting discounts and commissions, payable in connection with the sale of the shares of common stock being registered hereby. Except as otherwise noted, the registrant will pay all of the costs and expenses set forth in the following table. The selling stockholders will not pay any of the costs and expenses set forth in the following table. All amounts shown below are estimates, except the SEC registration fee, the FINRA filing fee and the stock exchange listing fee:
| |
Amount | |||
|---|---|---|---|---|
SEC registration fee |
$ | 75,565 | ||
FINRA filing fee |
91,542 | |||
Stock exchange listing fee |
255,000 | |||
Printing and engraving expenses |
350,000 | |||
Legal fees and expenses |
3,000,000 | |||
Accounting fees and expenses |
1,700,000 | |||
Transfer agent and registrar fees |
10,000 | |||
Miscellaneous expenses |
117,893 | |||
| | | | | |
Total |
$ | 5,600,000 | ||
| | | | | |
| | | | | |
| | | | | |
Item 14. Indemnification of Directors and Officers
EWT Holdings I Corp. (to be renamed Evoqua Water Technologies Corp. prior to the date of effectiveness of this Registration Statement) is incorporated under the laws of the state of Delaware. Section 102 of the Delaware General Corporation Law, as amended (the "DGCL") allows a corporation to eliminate the personal liability of a director to the corporation or its stockholders for monetary damages for breach of fiduciary duty as a director, except in cases where the director breached his or her duty of loyalty to the corporation or its stockholders, failed to act in good faith, engaged in intentional misconduct or a knowing violation of the law, willfully or negligently authorized the unlawful payment of a dividend or approved an unlawful stock redemption or repurchase or obtained an improper personal benefit. The registrant's certificate of incorporation contains a provision which eliminates directors' personal liability as set forth above.
The registrant's certificate of incorporation and bylaws provide in effect that the registrant shall indemnify its directors and officers to the extent permitted by the Delaware law. Section 145 of the DGCL provides that a Delaware corporation has the power to indemnify its directors, officers, employees, and agents in certain circumstances. Subsection (a) of Section 145 of the DGCL empowers a corporation to indemnify any director, officer, employee or agent, or former director, officer, employee or agent, who was or is a party or is threatened to be made a party to any threatened, pending or completed action, suit or proceeding, whether civil, criminal, administrative or investigative (other than an action by or in the right of the corporation), against expenses (including attorneys' fees), judgments, fines, and amounts paid in settlement actually and reasonably incurred in connection with such action, suit or proceeding, provided that such director, officer, employee or agent acted in good faith and in a manner he or she reasonably believed to be in or not opposed to the best interests of the corporation, and, with respect to any criminal action or proceeding, provided that such director, officer, employee or agent had no reasonable cause to believe that his or her conduct was unlawful.
Subsection (b) of Section 145 of the DGCL empowers a corporation to indemnify any director, officer, employee or agent, or former director, officer, employee or agent, who was or is a party or is
II-1
threatened to be made a party to any threatened, pending or completed action or suit by or in the right of the corporation to procure a judgment in its favor by reason of the fact that such person acted in any of the capacities set forth above, against expenses (including attorneys' fees) actually and reasonably incurred in connection with the defense or settlement of such action or suit provided that such person acted in good faith and in a manner he or she reasonably believed to be in or not opposed to the best interests of the corporation, except that no indemnification may be made in respect of any claim, issue or matter as to which such person shall have been adjudged to be liable to the corporation unless and only to the extent that the Court of Chancery or the court in which such action or suit was brought shall determine that despite the adjudication of liability such person is fairly and reasonably entitled to indemnity for such expenses which the court shall deem proper.
Section 145 further provides that to the extent that a present or former director or officer of a corporation has been successful in the defense of any action, suit or proceeding referred to in subsections (a) and (b) of Section 145 or in the defense of any claim, issue or matter therein, he or she shall be indemnified against expenses (including attorneys' fees) actually and reasonably incurred by him or her in connection therewith; that indemnification provided by Section 145 shall not be deemed exclusive of any other rights to which the party seeking indemnification may be entitled; that the corporation is empowered to purchase and maintain insurance on behalf of a director, officer, employee or agent of the corporation against any liability asserted against him or her or incurred by him or her in any such capacity or arising out of his or her status as such whether or not the corporation would have the power to indemnify him or her against such liabilities under Section 145; and that, unless indemnification is ordered by a court, the determination that indemnification under subsections (a) and (b) of Section 145 is proper because the director, officer, employee or agent has met the applicable standard of conduct under such subsections shall be made by (1) a majority vote of the directors who are not parties to such action, suit or proceeding (or a committee of such directors designated by majority vote of such directors), even though less than a quorum, or (2) if there are no such directors, or if such directors so direct, by independent legal counsel in a written opinion, or (3) by the stockholders.
The right to indemnification conferred by the registrant's certificate of incorporation and bylaws also includes the right to be paid the expenses (including attorneys' fees) incurred by a present or former director or officer in defending any civil, criminal, administrative, or investigative action, suit, or proceeding in advance of its final disposition, provided, however, that if the Delaware law requires, an advancement of expenses incurred by a director or officer in his or her capacity as a director or officer shall be made only upon delivery to the registrant of an undertaking by or on behalf of such director or officer to repay all amounts so advanced if it is ultimately determined that such person is not entitled to be indemnified for such expenses under the registrant's certificate of incorporation, bylaws, or otherwise.
In addition, the registrant intends to enter into indemnification agreements with each of its directors and certain of its officers, a form of which will be filed as an exhibit to a pre-effective amendment to this Registration Statement. These agreements require the registrant to indemnify such persons to the fullest extent permitted under Delaware law against liabilities that may arise by reason of their service to the registrant, and to advance expenses incurred as a result of any action, suit, or proceeding against them as to which they could be indemnified.
The registrant has in effect insurance policies for general officers' and directors' liability insurance covering all of its officers and directors.
II-2
Item 15. Recent Sales of Unregistered Securities
During the three years preceding the filing of this registration statement, we have issued the following securities which were not registered under the Securities Act of 1933, as amended (all share numbers before the proposed split):
Since July 1, 2014, we issued options to purchase an aggregate of 6,685,197 shares of common stock under the EWT Holdings I Corp. Stock Option Plan.
Since July 1, 2014, we sold to our employees, as well as to single director, an aggregate of 983,873 shares of common stock, 871,185 of which were issued under the EWT Holdings I Corp. Employee Stock Purchase Plan, for an aggregate consideration of $6,241,973.
We issued 1,378,691 shares of our common stock, with an aggregate value of $8,950,000, in connection with the Neptune-Benson Acquisition.
The issuances of the securities in the transactions described above were deemed to be exempt from registration under the Securities Act in reliance upon Section 4(a)(2) of the Securities Act and/or Rules 506 and 701 promulgated thereunder. The securities were issued directly by the registrant and did not involve a public offering or general solicitation. The recipients of such securities represented their intentions to acquire the securities for investment purposes only and not with a view to, or for sale in connection with, any distribution thereof.
Item 16. Exhibits and Financial Statement Schedules
The Exhibits filed herewith are set forth on the Index to Exhibits filed as a part of this Registration Statement beginning on page II-6 hereof.
The undersigned registrant hereby undertakes to provide to the underwriters at the closing specified in the underwriting agreement certificates in such denominations and registered in such names as required by the underwriters to permit prompt delivery to each purchaser.
Insofar as indemnification for liabilities arising under the Securities Act of 1933 may be permitted to directors, officers and controlling persons of the registrant pursuant to the foregoing provisions, or otherwise, the registrant has been advised that in the opinion of the Securities and Exchange Commission such indemnification is against public policy as expressed in the Securities Act and is, therefore, unenforceable. In the event that a claim for indemnification against such liabilities (other than the payment by the registrant of expenses incurred or paid by a director, officer or controlling person of the registrant in the successful defense of any action, suit or proceeding) is asserted by such director, officer or controlling person in connection with the securities being registered, the registrant will, unless in the opinion of its counsel the matter has been settled by controlling precedent, submit to a court of appropriate jurisdiction the question whether such indemnification by it is against public policy as expressed in the Securities Act and will be governed by the final adjudication of such issue.
The undersigned registrant hereby undertakes that:
(1) For purposes of determining any liability under the Securities Act of 1933, the information omitted from the form of prospectus filed as part of this registration statement in reliance upon Rule 430A and contained in a form of prospectus filed by the registrant pursuant to Rule 424(b)(1) or (4) or 497(h) under the Securities Act shall be deemed to be part of this registration statement as of the time it was declared effective.
(2) For the purpose of determining any liability under the Securities Act of 1933, each post-effective amendment that contains a form of prospectus shall be deemed to be a new registration
II-3
statement relating to the securities offered therein, and the offering of such securities at that time shall be deemed to be the initial bona fide offering thereof.
(3) For the purpose of determining liability of the registrant under the Securities Act of 1933 to any purchaser in the initial distribution of the securities, the undersigned registrant undertakes that in a primary offering of securities of the undersigned registrant pursuant to this registration statement, regardless of the underwriting method used to sell the securities to the purchaser, if the securities are offered or sold to such purchaser by means of any of the following communications, the undersigned registrant will be a seller to the purchaser and will be considered to offer or sell such securities to such purchaser:
- (i)
- Any
preliminary prospectus or prospectus of the undersigned registrant relating to the offering required to be filed pursuant to Rule 424 under the Securities
Act;
- (ii)
- Any
free writing prospectus relating to the offering prepared by or on behalf of the undersigned registrant or used or referred to by the undersigned registrant;
- (iii)
- The
portion of any other free writing prospectus relating to the offering containing material information about the undersigned registrant or its securities
provided by or on behalf of the undersigned registrant; and
- (iv)
- Any other communication that is an offer in the offering made by the undersigned registrant to the purchaser.
II-4
II-5
II-6
| Exhibit No. |
Exhibit Description | ||
|---|---|---|---|
| 10.32 | ** | Form of Standard Restricted Stock Unit Agreement. | |
| 10.33 | ** | Form of Indemnification Agreement. | |
| 21.1 | ** | List of subsidiaries of Evoqua Water Technologies Corp. | |
| 23.1 | Consent of Ernst & Young LLP. | ||
| 23.2 | Consent of RSM US LLP. | ||
| 23.3 | Consent of Amane Advisors. | ||
| 23.4 | ** | Consent of Fried, Frank, Harris, Shriver & Jacobson LLP (included in Exhibit 5.1). | |
| 24.1 | ** | Power of Attorney. | |
- *
- To
be filed by amendment.
- **
- Previously filed.
II-7
Pursuant to the requirements of the Securities Act of 1933, as amended, the registrant has duly caused this Registration Statement to be signed on its behalf by the undersigned, thereunto duly authorized, in the City of Pittsburgh, Pennsylvania, on this 18th day of October, 2017.
| Evoqua Water Technologies Corp. | ||||
By: |
/s/ BENEDICT J. STAS Benedict J. Stas Chief Financial Officer |
|||
Pursuant to the requirements of the Securities Act of 1933, this registration statement has been signed below by the following persons in the capacities and on the dates indicated.
Signature
|
Title
|
Date
|
||||
|---|---|---|---|---|---|---|
| * Ronald C. Keating |
Chief Executive Officer (Principal Executive Officer) | October 18, 2017 | ||||
/s/ BENEDICT J. STAS Benedict J. Stas |
Chief Financial Officer (Principal Financial Officer and Principal Accounting Officer) |
October 18, 2017 |
||||
* Martin Lamb |
Chairman of the Board and Director |
October 18, 2017 |
||||
* Nick Bhambri |
Director |
October 18, 2017 |
||||
* Gary Cappeline |
Director |
October 18, 2017 |
||||
* Judd Gregg |
Director |
October 18, 2017 |
||||
* Brian R. Hoesterey |
Director |
October 18, 2017 |
||||
II-8
Signature
|
Title
|
Date
|
||||
|---|---|---|---|---|---|---|
| * Vinay Kumar |
Director | October 18, 2017 | ||||
*By: |
/s/ BENEDICT J. STAS Benedict J. Stas Attorney-in-fact |
|||||
II-9