Attached files
| file | filename |
|---|---|
| EX-23.01 - EX-23.01 - ACM Research, Inc. | d311227dex2301.htm |
| EX-10.13 - EX-10.13 - ACM Research, Inc. | d311227dex1013.htm |
| EX-10.12 - EX-10.12 - ACM Research, Inc. | d311227dex1012.htm |
| EX-10.11 - EX-10.11 - ACM Research, Inc. | d311227dex1011.htm |
| EX-10.10 - EX-10.10 - ACM Research, Inc. | d311227dex1010.htm |
| EX-10.09 - EX-10.09 - ACM Research, Inc. | d311227dex1009.htm |
| EX-10.08 - EX-10.08 - ACM Research, Inc. | d311227dex1008.htm |
| EX-10.07 - EX-10.07 - ACM Research, Inc. | d311227dex1007.htm |
| EX-10.04 - EX-10.04 - ACM Research, Inc. | d311227dex1004.htm |
| EX-4.02 - EX-4.02 - ACM Research, Inc. | d311227dex402.htm |
| EX-4.01 - EX-4.01 - ACM Research, Inc. | d311227dex401.htm |
| EX-3.04 - EX-3.04 - ACM Research, Inc. | d311227dex304.htm |
| EX-3.03 - EX-3.03 - ACM Research, Inc. | d311227dex303.htm |
| EX-1.01 - EX-1.01 - ACM Research, Inc. | d311227dex101.htm |
Table of Contents
As filed with the Securities and Exchange Commission on October 18, 2017.
Registration No. 333-220451
UNITED STATES
SECURITIES AND EXCHANGE COMMISSION
WASHINGTON, D.C. 20549
Amendment No. 1
to
FORM S-1
REGISTRATION STATEMENT
UNDER
THE SECURITIES ACT OF 1933
ACM RESEARCH, INC.
(Exact name of registrant as specified in its charter)
| Delaware | 3559 | 94-3290283 | ||
| (State or other jurisdiction of incorporation or organization) |
(Primary Standard Industrial Classification Code Number) |
(I.R.S. Employer Identification Number) |
42307 Osgood Road, Suite I
Fremont, California 94539
(510) 445-3700
(Address, including zip code, and telephone number, including area code, of registrant’s principal executive offices)
David H. Wang
Chief Executive Officer and President
ACM Research, Inc.
42307 Osgood Road, Suite I
Fremont, California 94539
Telephone: (510) 445-3700
(Name, address, including zip code, and telephone number, including area code, of agent for service)
Copies to:
| Mark L. Johnson Bella Zaslavsky K&L Gates LLP One Lincoln Street Boston, Massachusetts 02111 Telephone: (617) 261-3100 Telecopy: (617) 261-3175 |
Michael D. Maline Seo Salimi Goodwin Procter LLP 620 Eighth Avenue New York, New York 10018 Telephone: (212) 813-8800 Telecopy: (212) 355-3333 |
Approximate date of commencement of proposed sale to the public: As soon as practicable after this Registration Statement is declared effective.
If any of the securities being registered on this Form are to be offered on a delayed or continuous basis pursuant to Rule 415 under the Securities Act of 1933, check the following box. ☐
If this Form is filed to register additional securities for an offering pursuant to Rule 462(b) under the Securities Act, please check the following box and list the Securities Act registration statement number of the earlier effective registration statement for the same offering. ☐
If this Form is a post-effective amendment filed pursuant to Rule 462(c) under the Securities Act, check the following box and list the Securities Act registration statement number of the earlier effective registration statement for the same offering. ☐
If this Form is a post-effective amendment filed pursuant to Rule 462(d) under the Securities Act, check the following box and list the Securities Act registration statement number of the earlier effective registration statement for the same offering. ☐
Indicate by check mark whether the registrant is a large accelerated filer, an accelerated filer, a non-accelerated filer, smaller reporting company or an emerging growth company. See the definitions of “large accelerated filer,” “accelerated filer,” “smaller reporting company” and “emerging growth company” in Rule 12b-2 of the Exchange Act. (Check one):
| Large accelerated filer | ☐ | Accelerated filer | ☐ | |||
| Non-accelerated filer | ☐ (Do not check if a smaller reporting company) | Smaller reporting company | ☒ | |||
| Emerging growth company | ☒ | |||||
If an emerging growth company, indicate by check mark if the registrant has elected not to use the extended transition period for complying with any new or revised financial accounting standards provided pursuant to Section 7(a)(2)(B) of the Securities Act. ☒
CALCULATION OF REGISTRATION FEE
|
| ||||||||
| Title of Each Class of Securities to be Registered | Amount to be Registered(1) |
Proposed Maximum Offering Price Per Share(2) |
Proposed Maximum Aggregate Offering |
Amount of Registration Fee(3) | ||||
| Class A common stock, $0.0001 par value per share |
2,300,000 | $9.50 | $21,850,000 | $2,270.33 | ||||
|
| ||||||||
|
| ||||||||
| (1) | Includes 300,000 shares that the underwriters have the option to purchase. |
| (2) | Estimated solely for the purpose of calculating the registration fee in accordance with Rule 457(a) of the Securities Act of 1933, as amended. |
| (3) | A total of $3,998.55 was previously paid in connection with the initial filing of this Registration Statement. |
The Registrant hereby amends this Registration Statement on such date or dates as may be necessary to delay its effective date until the Registrant shall file a further amendment which specifically states that this Registration Statement shall thereafter become effective in accordance with Section 8(a) of the Securities Act of 1933 or until the Registration Statement shall become effective on such date as the Commission, acting pursuant to such Section 8(a), may determine.
Table of Contents
The information in this prospectus is not complete and may be changed. We may not sell these securities until the Securities and Exchange Commission declares our registration statement effective. This prospectus is not an offer to sell these securities and is not soliciting an offer to buy these securities in any state where the offer or sale is not permitted.
PRELIMINARY PROSPECTUS, SUBJECT TO COMPLETION, DATED OCTOBER 18, 2017
PROSPECTUS
2,000,000 Shares

Class A Common Stock
This is the initial public offering of common stock of ACM Research, Inc. We are selling 2,000,000 shares of Class A common stock. We anticipate that the initial public offering price of shares of Class A common stock will be between $7.50 and $9.50 per share. After the pricing of the offering, we expect that shares of Class A common stock will trade on The Nasdaq Global Market under the symbol “ACMR.”
We have two classes of common stock, Class A and Class B. Each share of Class A common stock is entitled to one vote. Each share of Class B common stock is entitled to twenty votes and is convertible at any time into one share of Class A common stock. The rights attributable to each class of common stock are otherwise identical. Immediately following this offering and the concurrent private placement described below, holders of Class B common stock will have 79.1% of the voting power of our outstanding capital stock and holders of Class A common stock will have the remaining 20.9%.
We are an “emerging growth company” as that term is used in the Jumpstart Our Business Startups Act of 2012 and will be subject to reduced public company reporting requirements. See “Prospectus Summary—Our Company—Implications of Being an Emerging Growth Company” on page 6.
Investing in Class A common stock involves a high degree of risk. See “Risk Factors” beginning on page 12.
| Per Share | Total | |||||||
| Initial public offering price |
$ | $ | ||||||
| Underwriting discounts and commissions(1) |
$ | $ | ||||||
| Proceeds to us, before expenses |
$ | $ | ||||||
| (1) | Does not include warrants that are issuable by us to the underwriters for the purchase of 80,000 shares of Class A common stock (92,000 shares if the underwriters’ over-allotment option described below is exercised in full) at a price per share equal to 110% of the initial public offering price or certain out-of-pocket expenses of the underwriters that are reimbursable by us. See “Underwriting” beginning on page 141 for additional disclosure regarding underwriter discounts, commissions and estimated offering expenses. |
We have entered into agreements pursuant to which we expect to issue and sell, in a concurrent private placement, 833,334 shares of Class A common stock to Xinxin (Hongkong) Capital Co., Limited, a subsidiary of Sino IC Capital Co., Ltd., and 500,000 shares of Class A common stock to Victorious Way Limited, a subsidiary of China Everbright Limited. These shares are to be sold, subject to limitations described under “Concurrent Private Placement” on page 41, at the initial public offering price for the offering made hereby, net of a 3.5% placement fee payable to the firms who are also serving as underwriters of this offering. We expect the closing of the concurrent private placement to occur immediately after the closing of the offering made hereby, but the closing of this offering is not contingent on the closing of the concurrent private placement.
The offering is being underwritten on a firm commitment basis. We have granted the underwriters an option to buy up to an additional 300,000 shares of Class A common stock from us to cover over-allotments. The underwriters may exercise this option at any time and from time to time during the 30-day period from the date of this prospectus.
Neither the Securities and Exchange Commission nor any other regulatory body has approved or disapproved of these securities or passed upon the accuracy or adequacy of this prospectus. Any representation to the contrary is a criminal offense.
The underwriters expect to deliver the shares of Class A common stock to purchasers in the offering on or about , 2017.
Sole Book-Running Manager
Roth Capital Partners
Co-Managers
| Craig-Hallum Capital Group | The Benchmark Company |
The date of this prospectus is , 2017
Table of Contents
You should rely only on the information contained in this prospectus and any free writing prospectus we may authorize to be delivered to you. We have not, and the underwriters have not, authorized anyone to provide you with information different from, or in addition to, that contained in this prospectus and any related free writing prospectus. We and the underwriters take no responsibility for, and can provide no assurances as to the reliability of, any information that others may give you. This prospectus is not an offer to sell, nor is it seeking an offer to buy, these securities in any jurisdiction where the offer or sale is not permitted. The information contained in this prospectus is only accurate as of the date of this prospectus, regardless of the time of delivery of this prospectus and any sale of shares of Class A common stock.
For investors outside of the United States: Neither we nor the underwriters have done anything that would permit this offering or possession or distribution of this prospectus in any jurisdiction where action for that purpose is required, other than the United States. Persons outside of the United States who come into possession of this prospectus must inform themselves about, and observe any restrictions relating to, the offering of the shares of Class A common stock and the distribution of this prospectus outside of the United States.
Unless the context requires otherwise, references in this prospectus to “our company,” “our,” “us,” “we” and similar terms refer to ACM Research, Inc. (including its predecessor prior to its redomestication from California to Delaware in November 2016) and its subsidiaries. References to “ACM Research” refer to ACM Research, Inc., and references to “ACM Shanghai” are to ACM Research (Shanghai), Inc., a subsidiary of ACM Research.
SAPS, TEBO, ULTRA C and our logo design are our trademarks. This prospectus also contains other companies’ trademarks, registered marks and trade names, which are the property of those companies.
i
Table of Contents
The following summary highlights selected information contained elsewhere in this prospectus. Because the following is only a summary, it does not contain all of the information you should consider before investing in Class A common stock. You should carefully read this entire prospectus, including the risks set forth under the heading “Risk Factors” and our consolidated financial statements and related notes included at the end of this prospectus, before making an investment decision.
Our Company
We develop, manufacture and sell single-wafer wet cleaning equipment, which semiconductor manufacturers can use in numerous manufacturing steps to remove particles, contaminants and other random defects, and thereby improve product yield, in fabricating advanced integrated circuits, or chips. Our Ultra C equipment is designed to remove random defects from a wafer surface effectively, without damaging a wafer or its features, even at an increasingly advanced process node (the minimum line width on a chip) of 22 nanometers, or nm, or less. Our equipment is based on our innovative, proprietary Space Alternated Phase Shift, or SAPS, and Timely Energized Bubble Oscillation, or TEBO, technologies. We developed our proprietary technologies to enable manufacturers to produce chips that reach their ultimate physical limitations while maintaining product yield, which is the percentage of chips on a wafer that meet manufacturing specifications.
Differentiated technologies for advanced chips. Our SAPS and TEBO single-wafer wet cleaning technologies control the power, intensity and distribution of megasonic cleaning in order to remove random defects from a wafer surface effectively, without damaging the wafer or its features, even at process nodes of 22nm or less. As process nodes continue to shrink to 22nm and less, finer feature sizes and denser, more complex architectures make the cleaning process even more complicated and challenging. Our SAPS and TEBO technologies specifically address the inadequacies of conventional equipment available for the critical cleaning steps in chip manufacturing processes. One of our customers has implemented SAPS-based equipment for the 22nm process node, and we have demonstrated TEBO technology to be effective for the 16nm node. Furthermore, we believe both SAPS and TEBO technologies can be applied for even smaller process nodes. According to Transparency Market Research Pvt. Ltd, the global market for cleaning equipment for single-wafer processing systems totaled $2.6 billion in 2015 and will increase to an estimated $3.7 billion in 2020, a compound annual growth rate of 6.8%.
China-based operations positioned for growth in new chip fabrication plants. In 2006 we established our operational center in Shanghai, and we currently conduct substantially all of our development and manufacturing activities in the People’s Republic of China, or the PRC. The PRC’s share of worldwide semiconductor manufacturing capacity expanded from 7.3% in 2006 to 12.7% in 2015, and its semiconductor manufacturing revenue increased at a compound annual growth rate of 17.6% over the ten-year period ending in 2015 (PricewaterhouseCoopers, January 2017). Our Shanghai operations position us near potential customers in not only the PRC but also Taiwan, Korea and throughout Asia, giving us increased access to those customers and reducing shipping and manufacturing costs for equipment they purchase. The PRC government is implementing focused policies, including state-led investment initiatives, that aim to create and support an independent domestic semiconductor supply chain spanning from design to final system production.
Referenceable customer base. In commercializing our equipment, we place evaluation equipment with a selected group of leading chip manufacturers, whose use of our products can influence decisions by other manufacturers. We believe this process is helping us penetrate the mature chip manufacturing markets and build credibility with industry leaders. Since beginning to place evaluation SAPS equipment with a small number of selected customers in 2009, we have worked on equipment improvements and qualification with those customers, who include a leading Korean memory chip company and four leading PRC memory and logic chip foundries. In 2016, using a similar “demo-to-sales” process, we placed TEBO evaluation equipment with a leading PRC foundry
1
Table of Contents
and a leading Taiwanese foundry and recognized revenue from our initial sale of TEBO equipment. Our revenue from the selected customers’ purchases of single-wafer wet cleaning equipment totaled $10.6 million, or 73.6% of our revenue, in the first six months of 2017, $21.5 million, or 78.4% of our revenue, in 2016 and $26.8 million, or 86.0% of our revenue, in 2015.
Extensive intellectual property protection. Since our formation in 1998, we have focused on building a strategic portfolio of intellectual property to support and protect our key innovations, including most recently our SAPS and TEBO technologies. As of September 30, 2017, we had been issued more than 140 patents in the United States, the PRC, Japan, Korea, Singapore and Taiwan.
Industry Background and Trends
Semiconductors are the foundation of the exponential growth of digital technologies and applications. After 30 years of growth fueled by demand for personal computers, tablet computers, mobile phones and other digital products, semiconductor shipments are expected to reach 1.0 trillion units in 2018 based on demand driven by the migration of computing, networking and storage to the cloud and the proliferation of the “Internet of Things” (IC Insights, Inc., March 2016).
New and enhanced digital applications and products have relied on the development and deployment of progressively faster and more powerful—but ever smaller and less costly—semiconductors known as integrated circuits, or chips. For a half century the number of transistors that can fit in a given area has roughly doubled every two years, a rate of improvement referred to as “Moore’s Law.” Chip feature sizes have been repeatedly scaled down to pack more transistors in smaller chips, as nodes shrank from 30,000nm in 1963 to 14nm in 2014. In recent years the rate of chip improvement delivered solely by shrinking feature sizes has slowed as conventional two-dimensional, or 2D, chips have begun to approach their critical performance limitations. In order to extend Moore’s Law, chip designers and manufacturers are developing and implementing technologies and architectures to transition to advanced chips with three-dimensional, or 3D, structures.
Manufacturing advanced chips at smaller nodes requires a more complex process flow that incorporates enhanced, more expensive capital equipment, or tools, to perform increasingly complex process steps, as well as an increased number of tools to perform a greater number of process steps per wafer. A fabrication plant capable of producing advanced 3D chips may have more than 500 highly specialized tools representing more than 70 categories of equipment and may cost between $5 and $10 billion. Because of significant capital expenditures and manufacturing expenses, chip makers must focus on avoiding product yield loss by implementing additional fabrication process steps and innovative, reliable tool solutions.
Chip yield loss can result directly from random defects, which can originate from nearly every aspect of the manufacturing process. As a result, cleaning steps to eliminate random defects, without damaging features, are critical to chip fabrication. Wet cleaning, which uses liquid chemistry to spray, scrub, etch and dissolve random defects, has become the standard method for wafer cleaning. Wet cleaning’s chemistry has not changed appreciably over the past 25 years, but its implementation has shifted from simple immersion to increasingly sophisticated techniques such as tools using jet spraying and megasonic energy, which transmits acoustic waves through a fluid bath to produce bubble oscillation that dislodges random defects.
As chip complexity has increased, cleaning has become the most frequently repeated step in chip fabrication and may be performed in as many as 200 steps for each wafer. As process nodes continue to shrink to 22nm and less, finer feature sizes and denser, more complex architectures make the cleaning process even more complicated and challenging. Effective, damage-free cleaning poses a significant challenge for manufacturers seeking to fabricate chips in the advanced process nodes available today or introduced in the future. In order to extend Moore’s law, chip manufacturers must be able to remove ever smaller random defects from not only flat
2
Table of Contents
wafer surfaces but also progressively more intricate, finer-featured 3D chip structures, in each case without incurring damage or material loss that curtails yield and profits.
Our Product Offerings
We have developed single-wafer wet cleaning equipment that chip manufacturers can use in numerous steps of the fabrication process in order to avoid yield loss at existing and future process nodes. Using our proprietary technologies, we have designed our tools to remove random defects from chip wafers with fine feature sizes, complex patterning, dense circuit structures and high aspect ratios (the ratio of the structure’s depth to its width) more effectively than traditional jet spray and transient megasonic technologies.
Flat and patterned wafer surfaces. Our SAPS technology, which we introduced in 2009, employs alternating phases of megasonic waves to deliver megasonic energy to flat and patterned wafer surfaces in a highly uniform manner on a microscopic level. We have shown SAPS technology to be more effective than conventional megasonic and jet spray technologies in removing random defects across an entire wafer as node sizes shrink from 300nm to 45nm, including node sizes for which jet spray technology has proven to be ineffective. Based on their initial mass production experience with SAPS equipment, customers have increased their use of SAPS equipment by adding cleaning steps to the manufacturing processes for advanced chips in order to achieve higher yields and reduce chemical usage.
High-aspect ratio conventional 2D and advanced 3D patterned wafer surfaces. Our TEBO technology, which we introduced in March 2016, has been developed to provide effective, damage-free cleaning for both conventional 2D and 3D patterned wafers at advanced process nodes. TEBO technology provides multi-parameter control of bubble cavitation during megasonic cleaning by using a sequence of rapid pressure changes to force bubbles to oscillate at controlled sizes, shapes and temperatures. Because the bubbles oscillate instead of imploding or collapsing, TEBO technology avoids the pattern damage caused by traditional megasonic cleaning processes. We have demonstrated the damage-free cleaning capabilities of TEBO technology on patterned wafers for feature nodes as small as 1xnm (16nm to 19nm), and we have shown that TEBO technology can be applied in manufacturing processes for patterned chips with 3D structures having aspect ratios as high as 60-to-1. We believe TEBO technology can be applied for even smaller process nodes. TEBO tools are currently being evaluated by a selected group of leading memory and logic chip manufacturers.
Custom-made wafer assembly and packaging solutions. In addition to our product offerings for single-wafer cleaning, we leverage our technologies and expertise to provide a wide range of advanced packaging equipment, such as coaters, developers, photoresist strippers, scrubbers, wet etchers and copper-plating tools, to wafer assembly and packaging factories, particularly in the PRC. For these offerings, we focus on providing customized equipment with competitive performance, service and pricing.
Our Strategy
Our objective is to be the leading global provider of a full range of wet cleaning equipment for the manufacture of advanced integrated circuits. To achieve this goal, we are pursuing the following strategies:
Extend technology leadership. We intend to build upon our technology leadership in wet processing by continuing to develop and refine our differentiated SAPS and TEBO technologies and equipment to address cleaning challenges presented by the manufacture of increasingly advanced chip nodes.
Establish referenceable customer base. In commercializing our SAPS equipment, we placed evaluation equipment with selected customers, who subsequently purchased additional SAPS equipment to enable them to add more cleaning steps during their manufacturing processes. Using a similar “demo-to-sales” process, we have
3
Table of Contents
placed TEBO evaluation equipment with a leading PRC foundry and a leading Taiwanese foundry and we recognized revenue from our initial sale of TEBO equipment in 2016. Based on our market experience, we believe that implementation of our SAPS and TEBO equipment by selected leading memory and logic chip manufacturers will encourage evaluation of our equipment by other manufacturers, who will view the leading companies’ implementation as a validation of our equipment that facilitates a shorter evaluation process.
Leverage local presence to address growing Chinese market. The market for semiconductor manufacturing equipment in the PRC is expected to grow markedly in the upcoming years. Our experience has shown that chip manufacturers in the PRC demand equipment meeting their specific technical requirements and prefer building relationships with local suppliers. We established our operations in Shanghai a decade ago, and we will continue to work closely with chip manufacturers in China and throughout Asia to understand their specific requirements, encourage them to adopt our SAPS and TEBO technologies, and enable us to design innovative products and solutions to address their needs.
Continue to improve performance through operational excellence. We actively manage our business through principles of operational excellence designed to ensure continuous improvement of our key operational and financial metrics. As we increase the breadth of our product offerings and the size of our operations and customer base, we must continue to develop and implement these principles in order to improve the efficiency and quality of our operations, satisfy our customers’ needs, and meet our financial goals.
Pursue strategic acquisitions and relationships. To complement and accelerate our internal growth, we may pursue acquisitions of businesses, technologies, products or business relationships that will expand the functionality of our products, provide access to new markets or customers, or otherwise complement our existing operations.
Acquisition of Outstanding Minority Interests in Our Operating Company
In 2006 we established our operational center in Shanghai in the PRC, where we operate through our subsidiary ACM Shanghai. Until recently ACM Research owned 62.87% of the outstanding equity interests in ACM Shanghai and three PRC-based third-party investors held the remaining 37.13%.
| • | Effective as of August 31, 2017, ACM Research acquired, for a purchase price of $5.8 million, an additional 18.77% of ACM Shanghai’s equity interests from one of the minority investors and issued, for a purchase price of $5.8 million, capital stock that, upon the closing of this offering, will convert into 1,666,170 shares of Class A common stock. |
| • | Pursuant to agreements entered into as of August 31, 2017, ACM Research issued to the other two minority investors a total of 1,906,674 shares of Class A common stock on September 8, 2017 for a purchase price of $14.3 million and will acquire the remaining 18.36% of ACM Shanghai’s minority equity interests in the fourth quarter of 2017 for a purchase price of $14.3 million. |
As a result of these arrangements, ACM Research owned 81.64% of ACM Shanghai’s equity interests as of August 31, 2017 and will own 100% of those equity interests by no later than December 31, 2017.
Risks Related to Our Business
Our business is subject to a number of risks, including risks that may prevent us from achieving our business objectives or may adversely affect our business, financial condition, results of operations, cash flows or prospects. These risks are discussed more fully in “Risk Factors” beginning on page 12. Before making a
4
Table of Contents
decision to invest in Class A common stock, you should carefully consider all of those risks, including the following:
| • | We have incurred significant losses since our inception and have generated limited revenue to date, and we may not be able to maintain profitability. |
| • | Demand for our tools is subject to substantial variation due to the cyclic nature of the chip industry. |
| • | The commercial success of our tools requires that we demonstrate the differentiated, innovative nature of our technology to gain acceptance by leading chip manufacturers and then leverage our reputation to gain market acceptance by additional manufacturers, which may have existing relationships with our competitors. |
| • | The chip equipment industry is highly competitive, and many of our competitors are larger and better-established than we are, have significantly greater operating and financial resources than we have, and may have existing relationships with our potential customers. |
| • | We depend on a small number of customers for a significant percentage of our revenue and the number of potential customers for our tools is limited, so the loss of a major customer could harm our financial condition. |
| • | Our success depends on our ability to protect the intellectual property of our SAPS and TEBO technologies and to combat infringement from competitors who may try to replicate our technologies. |
Preliminary Operating Results for the Nine Months Ended September 30, 2017
Our consolidated financial statements for the nine months ended September 30, 2017 are not yet available. The following expectations regarding our results for this period are solely management estimates based on currently available information. Our independent registered public accounting firm has not audited, reviewed or performed any procedures with respect to this preliminary financial data and, accordingly, does not express an opinion or any other form of assurance with respect to this data.
We expect our revenue for the nine months ended September 30, 2017 to be between $19.0 million and $19.5 million, compared to $12.9 million for the nine months ended September 30, 2016, representing an increase of 47% to 51%. The expected increase in revenue of $6.1 million to $6.6 million in the nine months ended September 30, 2017 principally reflects increased sales of single-wafer cleaning equipment.
We expect our gross margin for the nine months ended September 30, 2017 to be 40% to 41%, compared to 43.7% for the nine months ended September 30, 2016. The decrease in gross margin was the result of a relative decrease in sales of higher-margin products.
Our Corporate Information
We incorporated in California in January 1998 and redomesticated in Delaware in November 2016. Our headquarters are located at 42307 Osgood Road, Suite I, Fremont, California 94539, where our telephone number is (510) 445-3700. Our website address is www.acmrcsh.com. The information contained in, or accessible through, our website is not part of, and is not incorporated into, this prospectus, and investors should not rely on any such information in deciding whether to invest in Class A common stock.
5
Table of Contents
Implications of Being an Emerging Growth Company
As a company with less than $1.0 billion in revenue during our last fiscal year, we qualify as an “emerging growth company” as defined in the Jumpstart Our Business Startups Act. An emerging growth company may take advantage of provisions that reduce its reporting and other obligations from those otherwise generally applicable to public companies. An emerging growth company may, among other things, elect to:
| • | present only two years of audited financial statements and related disclosure under “Management’s Discussion and Analysis of Financial Condition and Results of Operations”; |
| • | not obtain from its auditors an attestation and report on the assessment of internal control over financial reporting pursuant to the Sarbanes-Oxley Act; |
| • | provide less extensive disclosure about its executive compensation arrangements; and |
| • | not present to its stockholders non-binding advisory votes on executive compensation and golden parachute arrangements. |
We may take advantage of these provisions until the earliest of December 31, 2022 or such time that we have annual revenue greater than $1.0 billion, the market value of our capital stock held by non-affiliates exceeds $700 million or we have issued more than $1.0 billion of non-convertible debt in a three-year period. We have chosen to take advantage of some of these provisions, and as a result we may not provide stockholders with all of the information that is provided by other public companies. For example, Section 107 of the JOBS Act provides that an emerging growth company can use the extended transition period provided in Section 7(a)(2)(B) of the Securities Act of 1933 for complying with new or revised accounting standards. We have, however, irrevocably elected not to avail ourselves of the extended transition period for complying with new or revised accounting standards, and we therefore will be subject to the same new or revised accounting standards as public companies that are not emerging growth companies.
6
Table of Contents
Offering
| Class A common stock offered by us |
2,000,000 shares |
| Class A common stock to be outstanding after this offering and the concurrent private placement |
12,702,546 shares |
| Class B common stock outstanding |
2,409,738 shares |
| Total Class A and Class B common stock to be outstanding after this offering and the concurrent private placement |
15,112,184 shares |
| Over-allotment option of Class A common stock |
300,000 shares |
| Concurrent private placement |
We have entered into agreements pursuant to which we expect to issue and sell, in a concurrent private placement, 833,334 shares of Class A common stock to Xinxin (Hongkong) Capital Co., Limited, a subsidiary of China IC Industry Investment Fund, and 500,000 shares of Class A common stock to Victorious Way Limited, a subsidiary of China Everbright Limited. These shares would be sold at the initial public offering price for the offering made hereby, except that: |
| • | neither investor will be required to pay more than $10.50 per share; and |
| • | if the initial public offering price is less than $8.40, Xinxin (Hongkong) Capital Co., Limited may elect not to purchase any shares, in which case Victorious Way Limited also could elect not to purchase any shares. |
| The private placement investors have agreed with us not to, directly or indirectly, sell, transfer or dispose of any shares of Class A common stock acquired in the private placement for a period of 180 days after the closing of the private placement. |
| Xinxin (Hongkong) Capital Co., Limited will have the right to designate one individual for nomination to our board of directors, and holders who will have 51.2% of the voting power of common stock immediately after this offering have agreed to vote their shares for the election of the nominee. |
| Use of proceeds |
We estimate we will receive net proceeds from this offering and the concurrent private placement of $24.4 million, assuming an initial public offering price of |
7
Table of Contents
| $8.50 per share, the midpoint of the initial offering price range set forth on the cover page of this prospectus, and after deducting estimated underwriting discounts and commissions, private placement fees, and offering expenses. If the underwriters’ option to purchase additional shares is exercised in full, we estimate our net proceeds will be $26.8 million. |
| We intend to use our net proceeds from this offering and the concurrent private placement for working capital and other general corporate purposes, which may include financing our growth, developing new products, and acquiring complementary businesses, technologies and products. See “Use of Proceeds.” |
| Proposed NASDAQ symbol |
ACMR |
| Voting Rights |
Holders of Class A common stock and Class B common stock will generally vote together as a single class, unless otherwise required by law. Class A common stock is entitled to one vote per share, and Class B common stock is entitled to twenty votes per share. After this offering, our executive officers and directors, some of whom hold Class B common stock, will control 65.2% of the voting power of our outstanding capital stock and therefore may be able to control the outcome of matters submitted to stockholders, including the election of directors. See “Principal Stockholders” and “Description of Capital Stock.” |
The numbers of shares of Class A and Class B common stock to be outstanding following this offering and the concurrent private placement are based on 9,369,212 shares of Class A common stock and 2,409,738 shares of Class B common stock outstanding as of September 30, 2017, and exclude the following as of September 30, 2017:
| • | 397,502 shares of Class A common stock issuable upon the exercise of an outstanding warrant, with an exercise price of $7.50 per share, as described under “Management’s Discussion and Analysis of Financial Condition and Results of Operations—Recent Equity Transactions—Issuance of Warrants”; |
| • | 3,276,074 shares of Class A common stock issuable upon the exercise of outstanding options, with a weighted-average exercise price of $2.39 per share; |
| • | 120,002 shares of Class A common stock that will be issuable upon the exercise of options approved for grant to employees, effective as of the date of this prospectus, with an exercise price per share equal to the initial public offering price of the offering made hereby; and |
| • | 585,381 shares of Class A common stock reserved for future issuance under our equity incentive plan. |
Unless otherwise indicated, this prospectus reflects and assumes the following:
| • | the issuance of 1,333,334 shares of Class A common stock in the concurrent private placement, which is to be completed immediately following, and subject to, the closing of the offering made hereby; |
| • | effective immediately prior to the completion of this offering, the automatic conversion of all of our outstanding preferred stock into an aggregate of 4,627,577 shares of Class A common stock and the restatement of our charter and bylaws; |
| • | a 1-for-3 reverse split of Class A and Class B common stock effective as of September 13, 2017; |
8
Table of Contents
| • | no exercises of outstanding stock options; and |
| • | no exercise of the underwriters’ over-allotment option. |
The information in this prospectus does not reflect our issuance to the underwriters of warrants exercisable for 80,000 shares of Class A common stock (92,000 shares if the underwriters’ over-allotment option is exercised in full) at a price per share equal to 110% of the initial public offering price, as described in “Underwriting—Discounts, Commissions and Expenses” beginning on page 141.
Summary Consolidated Financial Information
The following tables summarize our consolidated financial data. You should read the following data in conjunction with “Selected Consolidated Financial Information,” “Management’s Discussion and Analysis of Financial Condition and Results of Operations,” and our consolidated financial statements and related notes included at the end of this prospectus.
| Six Months Ended June 30, | Year Ended December 31, | |||||||||||||||
| 2017 | 2016 | 2016 | 2015 | |||||||||||||
| (in thousands, except share and per share data) | ||||||||||||||||
| Consolidated Statement of Operations Data: |
||||||||||||||||
| Revenue |
$ | 14,423 | $ | 8,122 | $ | 27,371 | $ | 31,206 | ||||||||
| Cost of revenue |
8,570 | 5,292 | 14,042 | 17,085 | ||||||||||||
|
|
|
|
|
|
|
|
|
|||||||||
| Gross profit |
5,853 | 2,830 | 13,329 | 14,121 | ||||||||||||
|
|
|
|
|
|
|
|
|
|||||||||
| Operating expenses: |
||||||||||||||||
| Sales and marketing |
2,583 | 1,818 | 3,907 | 4,213 | ||||||||||||
| Research and development |
1,867 | 1,486 | 3,259 | 2,942 | ||||||||||||
| General and administrative |
3,158 | 1,089 | 2,673 | 2,103 | ||||||||||||
|
|
|
|
|
|
|
|
|
|||||||||
| Total operating expenses, net |
7,608 | 4,393 | 9,839 | 9,258 | ||||||||||||
|
|
|
|
|
|
|
|
|
|||||||||
| Income (loss) from operations |
(1,755 | ) | (1,563 | ) | 3,490 | 4,863 | ||||||||||
| Interest expense, net |
(159 | ) | (45 | ) | (165 | ) | (105 | ) | ||||||||
| Other income (expense), net |
(292 | ) | 506 | (343 | ) | 632 | ||||||||||
|
|
|
|
|
|
|
|
|
|||||||||
| Income (loss) before income taxes |
(2,206 | ) | (1,102 | ) | 2,982 | 5,390 | ||||||||||
| Income tax benefit (expense) |
(749 | ) | 73 | (595 | ) | 2,525 | ||||||||||
|
|
|
|
|
|
|
|
|
|||||||||
| Net income (loss) |
(2,955 | ) | (1,029 | ) | 2,387 | 7,915 | ||||||||||
| Less: Net income (loss) attributable to non-controlling interests(1) |
(208 | ) | (476 | ) | 1,356 | 2,535 | ||||||||||
|
|
|
|
|
|
|
|
|
|||||||||
| Net income (loss) attributable to ACM Research, Inc. |
$ | (2,747 | ) | $ | (553 | ) | $ | 1,031 | $ | 5,380 | ||||||
|
|
|
|
|
|
|
|
|
|||||||||
| Net income (loss) per common share(2): |
||||||||||||||||
| Basic |
$ | (0.56 | ) | $ | (0.27 | ) | $ | 0.30 | $ | 1.50 | ||||||
|
|
|
|
|
|
|
|
|
|||||||||
| Diluted |
$ | (0.56 | ) | $ | (0.27 | ) | $ | 0.18 | $ | 0.97 | ||||||
|
|
|
|
|
|
|
|
|
|||||||||
| Weighted-average common shares outstanding used in computing per share amounts(2): |
||||||||||||||||
| Basic |
4,927,973 | 2,061,339 | 2,176,315 | 2,047,383 | ||||||||||||
|
|
|
|
|
|
|
|
|
|||||||||
| Diluted |
4,927,973 | 2,061,339 | 3,792,137 | 3,144,120 | ||||||||||||
|
|
|
|
|
|
|
|
|
|||||||||
| Pro forma net income (loss) per common share(2): |
||||||||||||||||
| Basic |
$ | (0.35) | $ | 0.20 | ||||||||||||
|
|
|
|
|
|||||||||||||
| Diluted |
$ | (0.35) | $ | 0.15 | ||||||||||||
|
|
|
|
|
|||||||||||||
| Pro forma weighted-average common shares outstanding used in computing per share amounts(2): |
||||||||||||||||
| Basic |
7,889,818 | 5,137,211 | ||||||||||||||
|
|
|
|
|
|||||||||||||
| Diluted |
7,889,818 | 6,753,033 | ||||||||||||||
|
|
|
|
|
|||||||||||||
9
Table of Contents
| (1) | As of each date ACM Research held 62.87% of the outstanding equity interests of its operating subsidiary ACM Shanghai and the remaining 37.13% was held by third-party investors. As described above under “—Our Company—Acquisition of Outstanding Minority Interests in Our Operating Company,” we have entered into agreements pursuant to which ACM Research acquired an additional 18.77% of the outstanding ACM Shanghai equity interests as of August 31, 2017 and will acquire, by no later than December 31, 2017, all of the remaining outstanding equity interests held by minority investors. |
| (2) | See note 2 to our consolidated financial statements included at the end of this prospectus for an explanation of the method used to determine the number of shares used in computing historical and pro forma net income (loss) per share. |
In the following table:
| • | “As Adjusted” data gives effect to the following: |
| (a) | the closing of strategic investment transactions on September 11, 2017, with Ninebell Co., Ltd. or Ninebell, one of our key subassembly providers, in which we issued 133,334 shares of Class A common stock to Ninebell for a purchase price of $1.0 million and Ninebell issued ordinary shares, representing 20% of its post-closing equity, to us for a purchase price of $1.2 million; |
| (b) | the completion of the transactions described under “—Our Company—Acquisition of Outstanding Minority Interests in Our Operating Company” on page 4, pursuant to which, in the third quarter of 2017, (i) we issued 3,572,844 shares of Class A common stock (on an as-converted basis) to minority investors in ACM Shanghai for an aggregate purchase price of $20.1 million and (ii) ACM Research acquired 18.77% of the outstanding ACM Shanghai equity interests, for a purchase price of $5.8 million and will acquire by no later than December 31, 2017, all of the remaining outstanding minority ACM Shanghai equity interests for an aggregate purchase price of $14.3 million; and |
| (c) | exercises of stock options in the third quarter of 2017 to acquire 74,334 shares of Class A common stock. |
| • | “Pro Forma” data gives further effect to the automatic conversion of all of our outstanding convertible preferred stock into Class A common stock, which will occur automatically upon completion of this offering; and |
| • | “Pro Forma As Adjusted” data further adjusts “Pro Forma” data to reflect our sale of 2,000,000 shares of Class A common stock in this offering and our sale of 1,333,334 shares of Class A common stock in the concurrent private placement at an assumed initial public offering price of $8.50 per share, the midpoint of the initial public offering price range set forth on the cover page of this prospectus, after deducting estimated underwriting discounts and commissions, private placement fees, and offering expenses. |
| As of June 30, 2017 | ||||||||||||||||
| Actual | As Adjusted | Pro Forma | Pro Forma As Adjusted |
|||||||||||||
| (in thousands) | ||||||||||||||||
| Consolidated Balance Sheet Data: |
||||||||||||||||
| Cash and cash equivalents |
$ | 13,206 | $ | 13,062 | $ | 13,062 | $ | 37,458 | ||||||||
| Working capital(1) |
23,433 | 23,289 | 23,289 | 47,685 | ||||||||||||
| Total assets |
47,437 | 48,493 | 48,493 | 72,889 | ||||||||||||
| Total indebtedness |
4,595 | 4,595 | 4,595 | 4,595 | ||||||||||||
| Total liabilities |
27,883 | 27,883 | 27,883 | 27,883 | ||||||||||||
| Total redeemable convertible preferred stock |
18,034 | 23,834 | — | — | ||||||||||||
| Total ACM Research, Inc. stockholders’ (deficit) equity |
(3,289 | ) | (3,224 | ) | 20,610 | 45,006 | ||||||||||
| Non-controlling interests |
4,809 | — | — | — | ||||||||||||
| Total stockholders’ equity |
1,520 | (3,224 | ) | 20,610 | 45,006 | |||||||||||
| (1) | Calculated as current assets less current liabilities. |
10
Table of Contents
To supplement our consolidated financial statements presented in accordance with U.S. generally accepted accounting principles, or GAAP, we monitor and consider adjusted EBITDA, free cash flow and adjusted operating income (loss), which are non-GAAP financial measures. We are presenting adjusted EBITDA, free cash flow and adjusted operating income (loss) because they are key metrics used by our management in tracking business performance. See “Management’s Discussion and Analysis of Financial Condition and Results of Operations—Key Components of Results of Operations.”
| • | We define adjusted EBITDA as our net income excluding interest expense (net), income tax expense (benefit), depreciation and amortization, and stock-based compensation. The following table reconciles net income (loss), the most directly comparable GAAP financial measure, to adjusted EBITDA: |
| Six Months Ended June 30, | Year Ended December 31, | |||||||||||||||
| 2017 | 2016 | 2016 | 2015 | |||||||||||||
| (in thousands) | ||||||||||||||||
| Adjusted EBITDA Data: |
||||||||||||||||
| Net income (loss) |
$ | (2,955 | ) | $ | (1,029 | ) | $ | 2,387 | $ | 7,915 | ||||||
| Interest expense, net |
159 | 45 | 165 | 105 | ||||||||||||
| Income tax expense (benefit) |
749 | (73 | ) | 595 | (2,525 | ) | ||||||||||
| Depreciation and amortization |
118 | 88 | 187 | 160 | ||||||||||||
| Stock-based compensation |
1,348 | 193 | 383 | 423 | ||||||||||||
|
|
|
|
|
|
|
|
|
|||||||||
| Adjusted EBITDA |
$ | (581 | ) | $ | (776 | ) | $ | 3,717 | $ | 6,078 | ||||||
|
|
|
|
|
|
|
|
|
|||||||||
| • | We define free cash flow as net cash provided by operating activities less purchases of property and equipment (net of proceeds from disposals) and of intangible assets. The following table reconciles net cash provided by operating activities, the most directly comparable GAAP financial measure, to free cash flow: |
| Six Months Ended June 30, | Year Ended December 31, | |||||||||||||||
| 2017 | 2016 | 2016 | 2015 | |||||||||||||
| (in thousands) | ||||||||||||||||
| Free Cash Flow Data: |
||||||||||||||||
| Net cash provided by operating activities |
$ | 2,983 | $ | 4,739 | $ | (3,702 | ) | $ | 2,702 | |||||||
| Purchase of property and equipment, net of proceeds from disposals |
(26 | ) | (95 | ) | (788 | ) | (1,371 | ) | ||||||||
| Purchase of intangible assets |
(36 | ) | (9 | ) | (22 | ) | — | |||||||||
|
|
|
|
|
|
|
|
|
|||||||||
| Free cash flow |
$ | 2,921 | $ | 4,635 | $ | (4,512 | ) | $ | 1,331 | |||||||
|
|
|
|
|
|
|
|
|
|||||||||
| • | We define adjusted operating income (loss) as our income (loss) from operations excluding stock-based compensation. The following table reconciles income (loss) from operations, the most directly comparable GAAP financial measure, to adjusted operating income (loss): |
| Six Months Ended June 30, |
Year Ended December 31, |
|||||||||||||||
| 2017 | 2016 | 2016 | 2015 | |||||||||||||
| (in thousands) | ||||||||||||||||
| Adjusted Operating Income (Loss) Data: |
||||||||||||||||
| Income (loss) from operations |
$ | (1,755 | ) | $ | (1,563 | ) | $ | 3,490 | $ | 4,863 | ||||||
| Stock-based compensation |
1,348 | 193 | 383 | 423 | ||||||||||||
|
|
|
|
|
|
|
|
|
|||||||||
| Adjusted operating income (loss) |
$ | (407 | ) | $ | (1,370 | ) | $ | 3,873 | $ | 5,286 | ||||||
|
|
|
|
|
|
|
|
|
|||||||||
11
Table of Contents
Investing in Class A common stock involves a high degree of risk. You should consider and read carefully all of the risks and uncertainties described below, as well as other information contained in this prospectus, including our audited consolidated financial statements and related notes appearing at the end of this prospectus, before making an investment decision. The occurrence of any of the following risks or additional risks and uncertainties not presently known to us or that we currently believe to be immaterial could materially and adversely affect our business, financial condition, results of operations or cash flows. In any such case, the trading price of Class A common stock could decline, and you may lose all or part of your investment. This prospectus also contains forward-looking statements and estimates that involve risks and uncertainties. Our actual results could differ materially from those anticipated in the forward-looking statements as a result of specific factors, including the risks and uncertainties described below.
Risks Related to Our Business and Our Industry
We have incurred significant losses since our inception and we are uncertain about our future profitability.
We have incurred significant losses since our inception in 1998, and as of June 30, 2017 we had an accumulated deficit of $12.4 million. We may not be able to generate sufficient revenue to achieve and sustain profitability. We expect our costs to increase in future periods, which could negatively affect our future operating results if our revenue does not increase. In particular, we expect to continue to expend substantial financial and other resources on:
| • | research and development, including continued investments in our research and development team; |
| • | sales and marketing, including a significant expansion of our sales organization, both domestically and internationally, building our brand, and providing our single-wafer wet cleaning equipment and other capital equipment, or tools, for evaluation by customers; |
| • | the cost of goods being manufactured and sold for our installed base; |
| • | expansion of field service; and |
| • | general and administrative expenses, including legal and accounting expenses related to being a public company. |
These investments may not result in increased revenue or growth in our business. If we are unable to increase our revenue at a rate sufficient to offset the expected increase in our costs, then our business, financial position and results of operations will be harmed and we may not be able to achieve or maintain profitability over the long term. Additionally, we may encounter unforeseen operating expenses, difficulties, complications, delays and other factors that may result in losses in future periods. If our revenue growth does not meet our expectations in future periods, our financial performance may be harmed and we may not achieve or maintain profitability in the future.
We currently have limited revenue and may not be able to regain or maintain profitability.
To date we have only generated limited revenue from sales of our products. Our revenue totaled $31.2 million in 2015, $27.4 million in 2016 and $14.4 million in the first half of 2017. Our revenue was not sufficient to cover our operating expenses prior to 2015, and our net income decreased to $2.4 million in 2016 from $7.9 million in 2015. In the first half of 2017, we incurred an operating loss of $1.8 million, which was an increase from our operating loss of $1.6 million in the first half of 2016, and a net loss of $3.0 million, which was an increase from a net loss of $1.0 million in the first half of 2016. Our ability to generate significant revenue and operate profitably depends upon our ability to commercialize our Ultra C single-wafer wet cleaning equipment based on our Space Alternated Phase Shift, or SAPS, and Timely Energized Bubble Oscillation, or TEBO,
12
Table of Contents
technologies. Our ability to generate significant product revenue from our current tools or future tool candidates also depends on a number of additional factors, including our ability to:
| • | achieve market acceptance of Ultra C equipment based on SAPS technology as well as Ultra C equipment based on TEBO technology; |
| • | increase our customer base, including the establishment of relationships with companies in the United States; |
| • | continue to expand our supplier relationships with third parties; and |
| • | establish and maintain our reputation for providing efficient on-time delivery of high quality products. |
If we fail to regain and sustain profitability on a continuing basis, we may be unable to continue our operations at planned levels and be forced to reduce our operations or even shut down.
We may require additional capital in the future and we cannot give any assurance that such capital will be available at all or available on terms acceptable to us and, if it is available, additional capital raised by us may dilute holders of Class A common stock.
We may need to raise funds in the future, depending on many factors, including:
| • | our sales growth; |
| • | the costs of applying our existing technologies to new or enhanced products; |
| • | the costs of developing new technologies and introducing new products; |
| • | the costs associated with protecting our intellectual property; |
| • | the costs associated with our expansion, including capital expenditures, increasing our sales and marketing and service and support efforts, and expanding our geographic operations; |
| • | our ability to continue to obtain governmental subsidies for developmental projects in the future; |
| • | future debt repayment obligations; and |
| • | the number and timing of any future acquisitions. |
To the extent that our existing sources of cash, together with any cash generated from operations and the net proceeds from this offering and the concurrent private placement, are insufficient to fund our activities, we may need to raise additional funds through public or private financings, strategic relationships, or other arrangements. Additional funding may not be available to us on acceptable terms or at all. If adequate funding is not available, we may be required to reduce expenditures, including curtailing our growth strategies and reducing our product development efforts, or to forego acquisition opportunities.
If we succeed in raising additional funds through the issuance of equity or convertible securities, then the issuance could result in substantial dilution to existing stockholders. Furthermore, the holders of these new securities or debt may have rights, preferences and privileges senior to those of the holders of Class A common stock. In addition, any preferred equity issuance or debt financing that we may obtain in the future could have restrictive covenants relating to our capital raising activities and other financial and operational matters, which may make it more difficult for us to obtain additional capital and to pursue business opportunities, including potential acquisitions.
There is no assurance that the concurrent private placement of our Class A common stock will be completed.
There is no assurance that the concurrent private placement of our Class A common stock will be completed or, if completed, on what terms it will be completed. The closing of the concurrent private placement is subject to
13
Table of Contents
standard closing conditions, which may not be completed. In addition, Xinxin (Hongkong) Capital Co., Limited has the option not to purchase its 833,334 shares of Class A common stock if the initial public offering price is less than $8.40 and Victorious Way Limited has the option not to purchase its 500,000 shares of Class A common stock if Xinxin (Hongkong) Capital Co., Limited elects not to purchase its shares for any reason pursuant to the terms of its purchase agreement. If the concurrent private placement is not completed, our stock price and our ability to raise equity in the future may be adversely affected.
Our quarterly operating results can be difficult to predict and can fluctuate substantially, which could result in volatility in the price of Class A common stock.
Our quarterly revenue and other operating results have varied in the past and are likely to continue to vary significantly from quarter to quarter. Accordingly, you should not rely upon our past quarterly financial results as indicators of future performance. Any variations in our quarter-to-quarter performance may cause our stock price to fluctuate. Our financial results in any given quarter can be influenced by a variety of factors, including:
| • | the cyclicality of the semiconductor industry and the related impact on the purchase of equipment used in the manufacture of integrated circuits, or chips; |
| • | the timing of purchases of our tools by chip fabricators, which order types of tools based on multi-year capital plans under which the number and dollar amount of tool purchases can vary significantly from year to year; |
| • | the relatively high average selling price of our tools and our dependence on a limited number of customers for a substantial portion of our revenue in any period, whereby the timing and volume of purchase orders or cancellations from our customers could significantly reduce our revenue for that period; |
| • | the significant expenditures required to customize our products often exceed the deposits received from our customers; |
| • | the lead time required to manufacture our tools; |
| • | the timing of recognizing revenue due to the timing of shipment and acceptance of our tools; |
| • | our ability to sell additional tools to existing customers; |
| • | the changes in customer specifications or requirements; |
| • | the length of our product sales cycle; |
| • | changes in our product mix, including the mix of systems, upgrades, spare parts and service; |
| • | the timing of our product releases or upgrades or announcements of product releases or upgrades by us or our competitors, including changes in customer orders in anticipation of new products or product enhancements; |
| • | our ability to enhance our tools with new and better functionality that meet customer requirements and changing industry trends; |
| • | constraints on our suppliers’ capacity; |
| • | the timing of investments in research and development related to releasing new applications of our technologies and new products; |
| • | delays in the development and manufacture of our new products and upgraded versions of our products and the market acceptance of these products when introduced; |
| • | our ability to control costs, including operating expenses and the costs of the components and subassemblies used in our products; |
| • | the costs related to the acquisition and integration of product lines, technologies or businesses; and |
14
Table of Contents
| • | the costs associated with protecting our intellectual property, including defending our intellectual property against third-party claims or litigation. |
Seasonality has played an increasingly important role in the market for chip manufacturing tools. The period of November through February has been a particularly weak period historically for manufacturers of chip tools, in part because capital equipment needed to support manufacturing of chips for the December holidays usually needs to be in the supply chain by no later than October and chip makers in Asia often wait until after Chinese New Year, which occurs in January or February, before implementing their capital acquisition plans. The timing of new product releases also has an impact on seasonality, with the acquisition of manufacturing equipment occurring six to nine months before a new release.
Many of these factors are beyond our control, and the occurrence of one or more of them could cause our operating results to vary widely. As a result, it is difficult for us to forecast our quarterly revenue accurately. Our results of operations for any quarter may not be indicative of results for future quarters and quarter-to-quarter comparisons of our operating results are not necessarily meaningful. Variability in our periodic operating results could lead to volatility in our stock price. Because a substantial proportion of our expenses are relatively fixed in the short term, our results of operations will suffer if revenue falls below our expectations in a particular quarter, which could cause the price of Class A common stock to decline. Moreover, as a result of any of the foregoing factors, our operating results might not meet our announced guidance or expectations of public market analysts or investors, in which case the price of Class A common stock could decrease significantly.
Cyclicality in the semiconductor industry is likely to lead to substantial variations in demand for our products, and as a result our operating results could be adversely affected.
The chip industry has historically been cyclic and is characterized by wide fluctuations in product supply and demand. From time to time, this industry has experienced significant downturns, often in connection with, or in anticipation of, maturing product and technology cycles, excess inventories and declines in general economic conditions. This cyclicality could cause our operating results to decline dramatically from one period to the next.
Our business depends upon the capital spending of chip manufacturers, which, in turn, depends upon the current and anticipated market demand for chips. During industry downturns, chip manufacturers often have excess manufacturing capacity and may experience reductions in profitability due to lower sales and increased pricing pressure for their products. As a result, chip manufacturers generally sharply curtail their spending during industry downturns and historically have lowered their spending more than the decline in their revenues. If we are unable to control our expenses adequately in response to lower revenue from our customers, our operating results will suffer and we could experience operating losses.
Conversely, during industry upturns we must successfully increase production output to meet expected customer demand. This may require us or our suppliers, including third-party contractors, to order additional inventory, hire additional employees and expand manufacturing capacity. If we are unable to respond to a rapid increase in demand for our tools on a timely basis, or if we misjudge the timing, duration or magnitude of such an increase in demand, we may lose business to our competitors or incur increased costs disproportionate to any gains in revenue, which could have a material adverse effect on our business, results of operations, financial condition or cash flows.
The government of the People’s Republic of China, or the PRC, is implementing focused policies, including state-led investment initiatives, that aim to create and support an independent domestic semiconductor supply chain spanning from design to final system production. If these policies, which include loans and subsidies, result in lower demand for equipment than is expected by equipment manufacturers, the resulting overcapacity in the chip manufacturing equipment market could lead to excess inventory and price discounting that could have a material adverse effect on our business and operating results.
15
Table of Contents
Our success will depend on industry chip manufacturers adopting our SAPS and TEBO technologies.
To date our strategy for commercializing our tools has been to place them with selected industry leaders in the manufacturing of memory and logic chips, the two largest chip categories, to enable those leading manufacturers to evaluate our technologies, and then leverage our reputation to gain broader market acceptance. In order for these industry leaders to adopt our tools, we need to establish our credibility by demonstrating the differentiated, innovative nature of our SAPS and TEBO technologies. Our SAPS technology has been tested and purchased by industry leaders, but has not achieved, and may never achieve, widespread market acceptance. We have initiated a similar commercialization process for our TEBO technology with a selected group of industry leaders. If these leading manufacturers do not agree that our technologies add significant value over conventional technologies or do not otherwise accept and use our tools, we may need to spend a significant amount of time and resources to enhance our technologies or develop new technologies. Even if these leading manufacturers adopt our technologies, other manufacturers may not choose to accept and adopt our tools and our products may not achieve widespread adoption. Any of the above factors would have a material adverse effect on our business, results of operations and financial condition.
If our SAPS and TEBO technologies do not achieve widespread market acceptance, we will not be able to compete effectively.
The commercial success of our tools will depend, in part, on gaining substantial market acceptance by chip manufacturers. Our ability to gain acceptance for our products will depend upon a number of factors, including:
| • | our ability to demonstrate the differentiated, innovative nature of our SAPS and TEBO technologies and the advantages of our tools over those of our competitors; |
| • | compatibility of our tools with existing or potential customers’ manufacturing processes and products; |
| • | the level of customer service available to support our products; and |
| • | the experiences our customers have with our products. |
In addition, obtaining orders from new customers may be difficult because many chip manufacturers have pre-existing relationships with our competitors. Chip manufacturers must make a substantial investment to qualify and integrate wet processing equipment into a chip production line. Due, in part, to the cost of manufacturing equipment and the investment necessary to integrate a particular manufacturing process, a chip manufacturer that has selected a particular supplier’s equipment and qualified that equipment for production typically continues to use that equipment for the specific production application and process node, which is the minimum line width on a chip, as long as that equipment continues to meet performance specifications. Some of our potential and existing customers may prefer larger, more established vendors from which they can purchase equipment for a wider variety of process steps than our tools address. Further, because the cleaning process with our TEBO equipment can be up to five times longer than cleaning processes based on other technologies, we must convince chip manufacturers of the innovative, differentiated nature of our technologies and the benefits associated with using our tools. If we are unable to obtain new customers and continue to achieve widespread market acceptance of our tools, then our business, operations, financial results and growth prospects will be materially and adversely affected.
If we do not continue to enhance our existing single-wafer wet cleaning tools and achieve market acceptance, we will not be able to compete effectively.
We operate in an industry that is subject to evolving standards, rapid technological changes and changes in customer demands. Additionally, if process nodes continue to shrink to ever-smaller dimensions and conventional two-dimensional chips reach their critical performance limitations, the technology associated with manufacturing chips may advance to a point where our Ultra C equipment based on SAPS and TEBO technologies becomes obsolete. Accordingly, the future of our business will depend in large part upon the continuing relevance of our
16
Table of Contents
technological capabilities, our ability to interpret customer and market requirements in advance of tool deliveries, and our ability to introduce in a timely manner new tools that address chip makers’ requirements for cost-effective cleaning solutions. We expect to spend a significant amount of time and resources developing new tools and enhancing existing tools. Our ability to introduce and market successfully any new or enhanced cleaning equipment is subject to a wide variety of challenges during the tool’s development, including the following:
| • | accurate anticipation of market requirements, changes in technology and evolving standards; |
| • | the availability of qualified product designers and technologies needed to solve difficult design challenges in a cost-effective, reliable manner; |
| • | our ability to design products that meet chip manufacturers’ cost, size, acceptance and specification criteria, and performance requirements; |
| • | the ability and availability of suppliers and third-party manufacturers to manufacture and deliver the critical components and subassemblies of our tools in a timely manner; |
| • | market acceptance of our customers’ products, and the lifecycle of those products; and |
| • | our ability to deliver products in a timely manner within our customers’ product planning and deployment cycle. |
Certain enhancements to our Ultra C equipment in future periods may reduce demand for our pre-existing tools. As we introduce new or enhanced cleaning tools, we must manage the transition from older tools in order to minimize disruptions in customers’ ordering patterns, avoid excessive levels of older tool inventories and ensure timely delivery of sufficient supplies of new tools to meet customer demand. Furthermore, product introductions could delay purchases by customers awaiting arrival of our new products, which could cause us to fail to meet our expected level of production orders for pre-existing tools.
Our success will depend on our ability to identify and enter new product markets.
We expect to spend a significant amount of time and resources identifying new product markets in addition to the market for cleaning solutions and in developing new products for entry into these markets. Our TEBO technology took eight years to develop, and development of any new technology could require a similar, or even longer, period of time. Product development requires significant investments in engineering hours, third-party development costs, prototypes and sample materials, as well as sales and marketing expenses, which will not be recouped if the product launch is unsuccessful. We may fail to predict the needs of other markets accurately or develop new, innovative technologies to address those needs. Further, we may not be able to design and introduce new products in a timely or cost-efficient manner, and our new products may be more costly to develop, may fail to meet the requirements of the market, or may be adopted slower than we expect. If we are not able to introduce new products successfully, our inability to gain market share in new product markets could adversely affect our ability to sustain our revenue growth or maintain our current revenue levels.
If we fail to establish and maintain a reputation for credibility and product quality, our ability to expand our customer base will be impaired and our operating results may suffer.
We must develop and maintain a market reputation for innovative, differentiated technologies and high quality, reliable products in order to attract new customers and achieve widespread market acceptance of our products. Our market reputation is critical because we compete against several larger, more established competitors, many of which supply equipment for a larger number of process steps than we do to a broader customer base in an industry with a limited number of customers. In these circumstances, traditional marketing and branding efforts are of limited value, and our success depends on our ability to provide customers with reliable and technically sophisticated products. If the limited customer base does not perceive our products and services to be of high quality and effectiveness, our reputation could be harmed, which could adversely impact our ability to achieve our targeted growth.
17
Table of Contents
We operate in a highly competitive industry and many of our competitors are larger, better-established, and have significantly greater operating and financial resources than we have.
The chip equipment industry is highly competitive, and we face substantial competition throughout the world in each of the markets we serve. Many of our current and potential competitors have, among other things:
| • | greater financial, technical, sales and marketing, manufacturing, distribution and other resources; |
| • | established credibility and market reputations; |
| • | longer operating histories; |
| • | broader product offerings; |
| • | more extensive service offerings, including the ability to have large inventories of spare parts available near, or even at, customer locations; |
| • | local sales forces; and |
| • | more extensive geographic coverage. |
These competitors may also have the ability to offer their products at lower prices by subsidizing their losses in wet cleaning with profits from other lines of business in order to retain current or obtain new customers. Among other things, some competitors have the ability to offer bundled discounts for customers purchasing multiple products. Many of our competitors have more extensive customer and partner relationships than we do and may therefore be in a better position to identify and respond to market developments and changes in customer demands. Potential customers may prefer to purchase from their existing suppliers rather than a new supplier, regardless of product performance or features. If we are not able to compete successfully against existing or new competitors, our business, operating results and financial condition will be negatively affected.
We depend on a small number of customers for a substantial portion of our revenue, and the loss of, or a significant reduction in orders from, one of our major customers could have a material adverse effect on our revenue and operating results. There are also a limited number of potential customers for our products.
The chip manufacturing industry is highly concentrated, and we derive a significant portion of our revenue from the sale of our products to a small number of customers. In the first half of 2017, 62.8% of our revenue was derived from three customers: SK Hynix Inc., 22.8%; Shanghai Huali Microelectronics Corporation, 20.6%; and Yangtze Memory Technologies Co., Ltd. and a subsidiary, 19.4%. In 2016 99.3% of our revenue was derived from four customers: Shanghai Huali Microelectronics Corporation, 33.7%; Semiconductor Manufacturing International Corporation, 25.0%; SK Hynix Inc., 24.0%; and JiangYin ChangDian Advanced Packaging Co. Ltd., 16.6%. In 2015 all of our revenue was derived from three customers, including SK Hynix Inc., which accounted for 86.0% of our revenue, and JiangYin ChangDian Advanced Packaging Co., Ltd., which accounted for 10.1% of our revenue. As a consequence of the concentrated nature of our customer base, our revenue and results of operations may fluctuate from quarter to quarter and are difficult to estimate, and any cancellation of orders or any acceleration or delay in anticipated product purchases or the acceptance of shipped products by our larger customers could materially affect our revenue and results of operations in any quarterly period.
We may be unable to sustain or increase our revenue from our larger customers or offset the discontinuation of concentrated purchases by our larger customers with purchases by new or existing customers. We expect a small number of customers will continue to account for a high percentage of our revenue for the foreseeable future and that our results of operations may fluctuate materially as a result of such larger customers’ buying patterns. Thus, our business success depends on our ability to maintain strong relationships with our customers. The loss of any of our key customers for any reason, or a change in our relationship with any of our key customers, including a significant delay or reduction in their purchases, may cause a significant decrease in our revenue, which we may not be able to recapture due to the limited number of potential customers.
18
Table of Contents
We have seen, and may see in the future, consolidation of our customer base. Industry consolidation generally has negative implications for equipment suppliers, including a reduction in the number of potential customers, a decrease in aggregate capital spending and greater pricing leverage on the part of consumers over equipment suppliers. Continued consolidation of the chip industry could make it more difficult for us to grow our customer base, increase sales of our products and maintain adequate gross margins.
Our customers do not enter into long-term purchase commitments, and they may decrease, cancel or delay their projected purchases at any time.
In accordance with industry practice, our sales are on a purchase order basis, which we seek to obtain three to four months in advance of the expected product delivery date. Until a purchase order is received, we do not have a binding purchase commitment. Our SAPS and TEBO customers to date have provided us with non-binding one- to two-year forecasts of their anticipated demands, but those forecasts can be changed at any time, without any required notice to us. Because the lead-time needed to produce a tool customized to a customer’s specifications can extend up to six months, we may need to begin production of tools based on non-binding forecasts, rather than waiting to receive a binding purchase order. No assurance can be made that a customer’s forecast will result in a firm purchase order within the time period we expect, or at all.
If we do not accurately predict the amount and timing of a customer’s future purchases, we risk expending time and resources on producing a customized tool that is not purchased by a particular customer, which may result in excess or unwanted inventory, or we may be unable to fulfill an order on the schedule required by a purchase order, which would result in foregone sales. Customers may place purchase orders that exceed forecasted amounts, which could result in delays in our delivery time and harm our reputation. In the future a customer may decide not to purchase our tools at all, may purchase fewer tools than it did in the past or may otherwise alter its purchasing patterns, and the impact of any such actions may be intensified given our dependence on a small number of large customers. Our customers make major purchases periodically as they add capacity or otherwise implement technology upgrades. If any significant customers cancel, delay or reduce orders, our operating results could suffer.
We may incur significant expenses long before we can recognize revenue from new products, if at all, due to the costs and length of research, development, manufacturing and customer evaluation process cycles.
We often incur significant research and development costs for products that are purchased by our customers only after much, or all, of the cost has been incurred or that may never be purchased. We allow new customers, or existing customers considering new products, to evaluate products without any payment becoming due unless the product is ultimately accepted, which means we may invest $1.0 to $2.0 million in manufacturing a tool that may never be accepted and purchased or may be purchased months or even years after production. In the past we have borrowed money in order to fund first-time purchase order equipment and next-generation evaluation equipment. When we complete a first-time sale, we may not receive payment for up to 24 months. Even returning customers may take as long as six months to make any payments. If our sales efforts are unsuccessful after expending significant resources, or if we experience delays in completing sales, our future cash flow, revenue and profitability may fluctuate or be materially adversely affected.
Our sales cycle is long and unpredictable, which results in variability of our financial performance and may require us to incur high sales and marketing expenses with no assurance that a sale will result, all of which could adversely affect our profitability.
Our results of operations may fluctuate, in part, because of the resource-intensive nature of our sales efforts and the length and variability of our sales cycle. A sales cycle is the period between initial contact with a prospective customer and any sale of our tools. Our sales process involves educating customers about our tools, participating in extended tool evaluations and configuring our tools to customer-specific needs, after which customers may evaluate the tools. The length of our sales cycle, from initial contact with a customer to the
19
Table of Contents
execution of a purchase order, is generally 6 to 24 months. During the sales cycle, we expend significant time and money on sales and marketing activities and make investments in evaluation equipment, all of which lower our operating margins, particularly if no sale occurs or if the sale is delayed as a result of extended qualification processes or delays from our customers’ customers.
The duration or ultimate success of our sales cycle depends on factors such as:
| • | efforts by our sales force; |
| • | the complexity of our customers’ manufacturing processes and the compatibility of our tools with those processes; |
| • | our customers’ internal technical capabilities and sophistication; and |
| • | our customers’ capital spending plans and processes, including budgetary constraints, internal approvals, extended negotiations or administrative delays. |
It is difficult to predict exactly when, or even if, we will make a sale to a potential customer or if we can increase sales to our existing customers. As a result, we may not recognize revenue from our sales efforts for extended periods of time, or at all. The loss or delay of one or more large transactions in a quarter could impact our results of operations for that quarter and any future quarters for which revenue from that transaction is lost or delayed. In addition, we believe that the length of the sales cycle and intensity of the evaluation process may increase for those current and potential customers that centralize their purchasing decisions.
Difficulties in forecasting demand for our tools may lead to periodic inventory shortages or excess spending on inventory items that may not be used.
We need to manage our inventory of components and production of tools effectively to meet changing customer requirements. Accurately forecasting customers’ needs is difficult. Our tool demand forecasts are based on multiple assumptions, including non-binding forecasts received from our customers years in advance, each of which may introduce error into our estimates. Inventory levels for components necessary to build our tools in excess of customer demand may result in inventory write-downs and could have an adverse effect on our operating results and financial condition. Conversely, if we underestimate demand for our tools or if our manufacturing partners fail to supply components we require at the time we need them, we may experience inventory shortages. Such shortages might delay production or shipments to customers and may cause us to lose sales. These shortages may also harm our credibility, diminish the loyalty of our channel partners or customers. A failure to prevent inventory shortages or accurately predict customers’ needs could result in decreased revenue and gross margins and harm our business.
Some of our products and supplies may become obsolete or be deemed excess while in inventory due to rapidly changing customer specifications, changes in product structure, components or bills of material as a result of engineering changes, or a decrease in customer demand. We also have exposure to contractual liabilities to our contract manufacturers for inventories purchased by them on our behalf, based on our forecasted requirements, which may become excess or obsolete. Our inventory balances also represent an investment of cash. To the extent our inventory turns are slower than we anticipate based on historical practice, our cash conversion cycle extends and more of our cash remains invested in working capital. If we are not able to manage our inventory effectively, we may need to write down the value of some of our existing inventory or write off non-saleable or obsolete inventory. Any such charges we incur in future periods could materially and adversely affect our results of operations.
The difficulty in forecasting demand also makes it difficult to estimate our future results of operations and financial condition from period to period. A failure to accurately predict the level of demand for our products could adversely affect our net revenue and net income, and we are unlikely to forecast such effects with any certainty in advance.
20
Table of Contents
If our tools contain defects or do not meet customer specifications, we could lose customers and revenue.
Highly complex tools such as our may develop defects during the manufacturing and assembly process. We may also experience difficulties in customizing our tools to meet customer specifications or detecting defects during the development and manufacturing of our tools. Some of these failures may not be discovered until we have expended significant resources in customizing our tools, or until our tools have been installed in our customers’ production facilities. These quality problems could harm our reputation as well as our customer relationships in the following ways:
| • | our customers may delay or reject acceptance of our tools that contain defects or fail to meet their specifications; |
| • | we may suffer customer dissatisfaction, negative publicity and reputational damage, resulting in reduced orders or otherwise damaging our ability to retain existing customers and attract new customers; |
| • | we may incur substantial costs as a result of warranty claims or service obligations or in order to enhance the reliability of our tools; |
| • | the attention of our technical and management resources may be diverted; |
| • | we may be required to replace defective systems or invest significant capital to resolve these problems; and |
| • | we may be required to write off inventory and other assets related to our tools. |
In addition, defects in our tools or our inability to meet the needs of our customers could cause damage to our customers’ products or manufacturing facilities, which could result in claims for product liability, tort or breach of warranty, including claims from our customers. The cost of defending such a lawsuit, regardless of its merit, could be substantial and could divert management’s attention from our ongoing operations. In addition, if our business liability insurance coverage proves inadequate with respect to a claim or future coverage is unavailable on acceptable terms or at all, we may be liable for payment of substantial damages. Any or all of these potential consequences could have an adverse impact on our operating results and financial condition.
Warranty claims in excess of our estimates could adversely affect our business.
We have provided warranties against manufacturing defects of our tools that range from 12 to 36 months in duration. Our product warranty requires us to provide labor and parts necessary to repair defects. To date we have not accrued a significant liability contingency for potential warranty claims. Warranty claims substantially in excess of our expectations, or significant unexpected costs associated with warranty claims, could harm our reputation and could cause customers to decline to place new or additional orders, which could have a material adverse effect on our business, results of operations and financial condition.
We rely on third parties to manufacture significant portions of our tools and our failure to manage our relationships with these parties could harm our relationships with our customers, increase our costs, decrease our sales and limit our growth.
Our tools are complex and require components and subassemblies having a high degree of reliability, accuracy and performance. We rely on third parties to manufacture most of the subassemblies and supply most of the components used in our tools. Accordingly, we cannot directly control our delivery schedules and quality assurance. This lack of control could result in shortages or quality assurance problems. These issues could delay shipments of our tools, increase our testing costs or lead to costly failure claims.
We do not have long-term supply contracts with some of our suppliers, and those suppliers are not obligated to perform services or supply products to us for any specific period, in any specific quantities or at any specific
21
Table of Contents
price, except as may be provided in a particular purchase order. In addition, we attempt to maintain relatively low inventories and acquire subassemblies and components only as needed. There are significant risks associated with our reliance on these third-party suppliers, including:
| • | potential price increases; |
| • | capacity shortages or other inability to meet any increase in demand for our products; |
| • | reduced control over manufacturing process for components and subassemblies and delivery schedules; |
| • | limited ability of some suppliers to manufacture and sell subassemblies or parts in the volumes we require and at acceptable quality levels and prices, due to the suppliers’ relatively small operations and limited manufacturing resources; |
| • | increased exposure to potential misappropriation of our intellectual property; and |
| • | limited warranties on subassemblies and components supplied to us. |
Any delays in the shipment of our products due to our reliance on third-party suppliers could harm our relationships with our customers. In addition, any increase in costs due to our suppliers increasing the price they charge us for subassemblies and components or arising from our need to replace our current suppliers that we are unable to pass on to our customers could negatively affect our operating results.
Any shortage of components or subassemblies could result in delayed delivery of products to us or in increased costs to us, which could harm our business.
The ability of our manufacturers to supply our tools is dependent, in part, upon the availability certain components and subassemblies. Our manufacturers may experience shortages in the availability of such components or subassemblies, which could result in delayed delivery of products to us or in increased costs to us. Any shortage of components or subassemblies or any inability to control costs associated with manufacturing could increase the costs for our products or impair our ability to ship orders in a timely cost-efficient manner. As a result, we could experience cancellation of orders, refusal to accept deliveries or a reduction in our prices and margins, any of which could harm our financial performance and results of operations.
We depend on a limited number of suppliers, including single source suppliers, for critical components and subassemblies, and our business could be disrupted if they are unable to meet our needs.
We depend on a limited number of suppliers for components and subassemblies used in our tools. Certain components and subassemblies of our tools have only been purchased from our current suppliers to date, and changing the source of those components and subassemblies may result in disruptions during the transition process and entail significant delay and expense. We rely on Product Systems, Inc., or ProSys, as the sole supplier of megasonic transducers, a key subassembly used in our single-wafer cleaning equipment. We also rely on Ninebell Co., Ltd., or Ninebell, which is the principal supplier of robotic delivery system subassemblies used in our single-wafer cleaning equipment. An adverse change to our relationship with ProSys or Ninebell would disrupt our production of single-wafer cleaning equipment and could cause substantial harm to our business.
With some of these suppliers, we do not have long-term agreements and instead purchase components and subassemblies through a purchase order process. As a result, these suppliers may stop supplying us components and subassemblies, limit the allocation of supply and equipment to us due to increased industry demand or significantly increase their prices at any time with little or no advance notice. Our reliance on a limited number of suppliers could also result in delivery problems, reduced control over product pricing and quality, and our inability to identify and qualify another supplier in a timely manner.
Moreover, some of our suppliers may experience financial difficulties that could prevent them from supplying us with components or subassemblies used in the design and manufacture of our products. In addition,
22
Table of Contents
our suppliers, including our sole supplier ProSys, may experience manufacturing delays or shut downs due to circumstances beyond their control, such as labor issues, political unrest or natural disasters. Any supply deficiencies could materially and adversely affect our ability to fulfill customer orders and our results of operations. We have in the past and may in the future, experience delays or reductions in supply shipments, which could reduce our revenue and profitability. If key components or materials are unavailable, our costs would increase and our revenue would decline.
We have depended on PRC governmental subsidies to help fund our technology development since 2008, and our failure to obtain additional subsidies may impede our development of new technologies and may increase our cost of capital, either of which could make it difficult for us to expand our product base.
We received subsidies from local and central governmental authorities in the PRC in 2008, 2009 and 2014. These grants have provided a majority of the funding for our development and commercialization of stress-free polishing and electro copper-plating technologies. If we are unable to obtain similar governmental subsidies for development projects in the future, we may need to raise additional funds through public or private financings, strategic relationships, or other arrangements, which could force us to reduce our efforts to develop technologies beyond SARS and TEBO. To the extent that we receive a lower level of, or no, governmental subsidies in the future, we may need to raise additional funds through public or private financings, strategic relationships, or other arrangements.
The success of our business will depend on our ability to manage any future growth.
We have experienced rapid growth in our business recently due, in part, to an expansion of our product offerings and an increase in the number of customers that we serve. For example, our headcount grew by 18.7% during 2016 and by an additional 28.1% from January 1, 2017 to September 30, 2017. We will seek to continue to expand our operations in the future, including by adding new offices, locations and employees. Managing our growth has placed and could continue to place a significant strain on our management, other personnel and our infrastructure. If we are unable to manage our growth effectively, we may not be able to take advantage of market opportunities, develop new products, enhance our technological capabilities, satisfy customer requirements, respond to competitive pressures or otherwise execute our business plan. In addition, any inability to manage our growth effectively could result in operating inefficiencies that could impair our competitive position and increase our costs disproportionately to the amount of growth we achieve. To manage our growth, we believe we must effectively:
| • | hire, train, integrate and manage additional qualified engineers for research and development activities, sales and marketing personnel, service and support personnel and financial and information technology personnel; |
| • | manage multiple relationships with our customers, suppliers and other third parties; and |
| • | continue to enhance our information technology infrastructure, systems and controls. |
Our organizational structure has become more complex, and we will need to continue to scale and adapt our operational, financial and management controls, as well as our reporting systems and procedures. The continued expansion of our infrastructure will require us to commit substantial financial, operational and management resources before our revenue increases and without any assurances that our revenue will increase.
We are highly dependent on our Chief Executive Officer and President and other senior management and key employees.
Our success largely depends on the skills, experience and continued efforts of our management, technical and sales personnel, including in particular Dr. David H. Wang, our Chair of the Board, Chief Executive Officer, President and founder. If one or more of our senior management were unable or unwilling to continue their
23
Table of Contents
employment with us, we may not be able to replace them in a timely manner. We may incur additional expenses to recruit and retain qualified replacements. We do not currently maintain key person life insurance policies on any of our employees. Our business may be severely disrupted and our financial condition and results of operations may be materially and adversely affected. In addition, our senior management may join a competitor or form a competing company. All of our senior management are at-will employees, which means either we or the employee may terminate his or her employment at any time. The loss of Dr. Wang or other key management personnel could significantly delay or prevent the achievement of our business objectives.
Failure to attract and retain qualified personnel could put us at a competitive disadvantage and prevent us from effectively growing our business.
Our future success depends, in part, on our ability to continue to attract and retain highly skilled personnel. There is substantial competition for experienced management, technical and sales personnel in the chip equipment industry. If qualified personnel become scarce or difficult to attract or retain for compensation-related or other reasons, we could experience higher labor, recruiting or training costs. New hires may require significant training and time before they achieve full productivity and may not become as productive as we expect. If we are unable to retain and motivate our existing employees and attract qualified personnel to fill key positions, we may experience inadequate levels of staffing to develop and market our products and perform services for our customers, which could have a negative effect on our operating results.
Our ability to utilize certain U.S. and state net operating loss carryforwards may be limited under applicable tax laws.
As of June 30, 2017, we had net operating loss carryforward amounts, or NOLs, of $18.9 million for U.S. federal income tax purposes and $322,000 for U.S. state income tax purposes. The federal and state NOLs will expire at various dates beginning in 2036.
Utilization of these NOLs could be subject to a substantial annual limitation if the ownership change limitations under U.S. Internal Revenue Code Sections 382 and 383 and similar U.S. state provisions are triggered by changes in the ownership of our capital stock. Such an annual limitation would result in the expiration of the NOLs before utilization. Our existing NOLs may be subject to limitations arising from previous ownership changes, including in connection with this offering, the concurrent private placement and any future follow-on public offerings. Future changes in our stock ownership, some of which are outside of our control, could result in an ownership change. Regulatory changes, such as suspensions on the use of NOLs, or other unforeseen reasons, may cause our existing NOLs to expire or otherwise become unavailable to offset future income tax liabilities. Additionally, U.S. state NOLs generated in one state cannot be used to offset income generated in another U.S. state. For these reasons, we may be limited in our ability to realize tax benefits from the use of our NOLs, even if our profitability would otherwise allow for it.
Acquisitions that we pursue in the future, whether or not consummated, could result in other operating and financial difficulties.
In the future we may seek to acquire additional product lines, technologies or businesses in an effort to increase our growth, enhance our ability to compete, complement our product offerings, enter new and adjacent markets, obtain access to additional technical resources, enhance our intellectual property rights or pursue other competitive opportunities. We may also make investments in certain key suppliers to align our interests with such suppliers. If we seek acquisitions, we may not be able to identify suitable acquisition candidates at prices we consider appropriate. We cannot readily predict the timing or size of our future acquisitions, or the success of any future acquisitions.
To the extent that we consummate acquisitions or investments, we may face financial risks as a result, including increased costs associated with merged or acquired operations, increased indebtedness, economic
24
Table of Contents
dilution to gross and operating profit and earnings per share, or unanticipated costs and liabilities. Acquisitions may involve additional risks, including:
| • | the acquired product lines, technologies or businesses may not improve our financial and strategic position as planned; |
| • | we may determine we have overpaid for the product lines, technologies or businesses, or that the economic conditions underlying our acquisition have changed; |
| • | we may have difficulty integrating the operations and personnel of the acquired company; |
| • | we may have difficulty retaining the employees with the technical skills needed to enhance and provide services with respect to the acquired product lines or technologies; |
| • | the acquisition may be viewed negatively by customers, employees, suppliers, financial markets or investors; |
| • | we may have difficulty incorporating the acquired product lines or technologies with our existing technologies; |
| • | we may encounter a competitive response, including price competition or intellectual property litigation; |
| • | we may become a party to product liability or intellectual property infringement claims as a result of our sale of the acquired company’s products; |
| • | we may incur one-time write-offs, such as acquired in-process research and development costs, and restructuring charges; |
| • | we may acquire goodwill and other intangible assets that are subject to impairment tests, which could result in future impairment charges; |
| • | our ongoing business and management’s attention may be disrupted or diverted by transition or integration issues and the complexity of managing geographically or culturally diverse enterprises; and |
| • | our due diligence process may fail to identify significant existing issues with the target business. |
From time to time, we may enter into negotiations for acquisitions or investments that are not ultimately consummated. These negotiations could result in significant diversion of management time, as well as substantial out-of-pocket costs, any of which could have a material adverse effect on our business, operating results and financial condition.
Future declines in the semiconductor industry, and the overall world economic conditions on which the industry is significantly dependent, could have a material adverse impact on our results of operations and financial condition.
Our business depends on the capital equipment expenditures of chip manufacturers, which in turn depend on the current and anticipated market demand for integrated circuits. With the consolidation of customers within the industry, the chip capital equipment market may experience rapid changes in demand driven both by changes in the market generally and the plans and requirements of particular customers. Global economic and business conditions, which are often unpredictable, have historically impacted customer demand for our products and normal commercial relationships with our customers, suppliers and creditors. Additionally, in times of economic uncertainty our customers’ budgets for our tools, or their ability to access credit to purchase them, could be adversely affected. This would limit their ability to purchase our products and services. As a result, economic downturns could cause material adverse changes to our results of operations and financial condition including:
| • | a decline in demand for our products; |
| • | an increase in reserves on accounts receivable due to our customers’ inability to pay us; |
25
Table of Contents
| • | an increase in reserves on inventory balances due to excess or obsolete inventory as a result of our inability to sell such inventory; |
| • | valuation allowances on deferred tax assets; |
| • | restructuring charges; |
| • | asset impairments including the potential impairment of goodwill and other intangible assets; |
| • | a decline in the value of our investments; |
| • | exposure to claims from our suppliers for payment on inventory that is ordered in anticipation of customer purchases that do not come to fruition; |
| • | a decline in the value of certain facilities we lease to less than our residual value guarantee with the lessor; and |
| • | challenges maintaining reliable and uninterrupted sources of supply. |
Fluctuating levels of investment by chip manufacturers may materially affect our aggregate shipments, revenue, operating results and earnings. Where appropriate, we will attempt to respond to these fluctuations with cost management programs aimed at aligning our expenditures with anticipated revenue streams, which could result in restructuring charges. Even during periods of reduced revenues, we must continue to invest in research and development and maintain extensive ongoing worldwide customer service and support capabilities to remain competitive, which may temporarily harm our profitability and other financial results.
We conduct substantially all of our operations outside the United States and face risks associated with conducting business in foreign markets.
All of our sales in 2015, 2016 and the first half of 2017 were made to customers outside the United States. Our manufacturing center has been located in Shanghai, PRC since 2006 and substantially all of our operations are located in the PRC. We expect that all of our significant activities will remain outside the United States in the future. We are subject to a number of risks associated with our international business activities, including:
| • | imposition of, or adverse changes in, foreign laws or regulatory requirements; |
| • | the need to comply with the import laws and regulations of various foreign jurisdictions, including a range of U.S. import laws; |
| • | potentially adverse tax consequences, including withholding tax rules that may limit the repatriation of our earnings, and higher effective income tax rates in foreign countries where we conduct business; |
| • | competition from local suppliers with which potential customers may prefer to do business; |
| • | seasonal reduction in business activity, such as during Chinese, or Lunar, New Year in parts of Asia and in other periods in various individual countries; |
| • | increased exposure to foreign currency exchange rates; |
| • | reduced protection for intellectual property; |
| • | longer sales cycles and reliance on indirect sales in certain regions; |
| • | increased length of time for shipping and acceptance of our products; |
| • | greater difficulty in responding to customer requests for maintenance and spare parts on a timely basis; |
| • | greater difficulty in enforcing contracts and accounts receivable collection and longer collection periods; |
| • | difficulties in staffing and managing foreign operations and the increased travel, infrastructure and legal and compliance costs associated with multiple international locations; |
26
Table of Contents
| • | heightened risk of unfair or corrupt business practices in certain geographies and of improper or fraudulent sales arrangements that may impact financial results and result in restatements of, or irregularities in, our consolidated financial statements; and |
| • | general economic conditions, geopolitical events or natural disasters in countries where we conduct our operations or where our customers are located, including political unrest, war, acts of terrorism or responses to such events. |
In particular, the Asian market is extremely competitive, and chip manufacturers may be aggressive in seeking price concessions from suppliers, including chip equipment manufacturers.
We may not be successful in developing and implementing policies and strategies that will be effective in managing these risks in each country in which we do business. Our failure to manage these risks successfully could adversely affect our business, operating results and financial condition.
Fluctuation in foreign currency exchange rates may adversely affect our results of operations and financial position.
Our results of operations and financial position could be adversely affected as a result of fluctuations in foreign currency exchange rates. Although our financial statements are denominated in U.S. dollars, a sizable portion of our revenues and costs are denominated in other currencies, primarily the Chinese Renminbi. Because many of our raw material purchases are denominated in Renminbi while the majority of the purchase orders we receive are denominated in U.S. dollars, exchange rates have a significant effect on our gross margin. We have not engaged in any foreign currency exchange hedging transactions to date, and any strategies that we may use in the future to reduce the adverse impact of fluctuations in foreign currency exchange rates may not be successful. Our foreign currency exposure with respect to assets and liabilities for which we do not have hedging arrangements could have a material impact on our results of operations in periods when the U.S. dollar significantly fluctuates in relation to unhedged non-U.S. currencies in which we transact business.
Changes in political and economic policies of the PRC government may materially and adversely affect our business, financial condition and results of operations and may result in our inability to sustain our growth and expansion strategies.
Substantially all of our operations are conducted in the PRC, and a substantial majority of our revenue is sourced from the PRC. Accordingly, our financial condition and results of operations are affected to a significant extent by economics, political and legal developments in the PRC.
The Chinese economy differs from the economies of most developed countries in many respects, including the extent of government involvement, level of development, growth rate, and control of foreign exchange and allocation of resources. Although the PRC government has implemented measures emphasizing the utilization of market forces for economic reform, the reduction of state ownership of productive assets and the establishment of improved corporate governance in business enterprises, a substantial portion of productive assets in the PRC are still owned by the government. In addition, the PRC government continues to play a significant role in regulating industry development by imposing industrial policies. The PRC government also exercises significant control over economic growth in the PRC by allocating resources, controlling payment of foreign currency-denominated obligations, setting monetary policy, regulating financial services and institutions, and providing preferential treatment to particular industries or companies.
While the PRC economy has experienced significant growth in the past three decades, growth has been uneven, both geographically and among various sectors of the economy. The PRC government has implemented various measures to encourage economic growth and guide the allocation of resources. Some of these measures may benefit the overall PRC economy, but may also have a negative effect on us. Our financial condition and
27
Table of Contents
results of operation could be materially and adversely affected by government control over capital investments or changes in tax regulations that are applicable to us. In the past the PRC government has implemented measures to control the pace of economic growth, and similar measures in the future may cause decreased economic activity, which in turn could lead to a reduction in demand for our products and consequently have a material adverse effect on our businesses, financial condition and results of operations.
Although the PRC government has been implementing policies to develop an independent domestic semiconductor industry supply chain, there is no guaranteed time frame in which these initiatives will be implemented. We cannot guarantee that the implementation of these policies will result in additional revenue to us or that our presence in the PRC will result in support from the PRC government. To the extent that any capital investment or other assistance from the PRC government is not provided to us, it could be used to promote the products and technologies of our competitors, which could adversely affect our business, operating results and financial condition.
We are subject to government regulation, including import, export, economic sanctions, and anti-corruption laws and regulations, that may limit our sales opportunities, expose us to liability and increase our costs.
Our products are subject to import and export controls in jurisdictions in which we distribute or sell our products. Import and exports control and economic sanctions laws and regulations include restrictions and prohibitions on the sale or supply of certain products and on our transfer of parts, components, and related technical information and know-how to certain countries, regions, governments, persons and entities.
Various countries regulate the importation of certain products through import permitting and licensing requirements and have enacted laws that could limit our ability to distribute our products. The exportation, re-exportation, transfers within foreign countries and importation of our products, including by our partners, must comply with these laws and regulations, and any violations may result in reputational harm, government investigations and penalties, and a denial or curtailment of exporting. Complying with export control and sanctions laws for a particular sale may be time consuming, may increase our costs, and may result in the delay or loss of sales opportunities. If we are found to be in violation of U.S. sanctions or export control laws, or similar laws in other jurisdictions, we and the individuals working for us could incur substantial fines and penalties. Changes in export, sanctions or import laws or regulations may delay the introduction and sale of our products in international markets, require us to spend resources to seek necessary government authorizations or to develop different versions of our products, or, in some cases, prevent the export or import of our products to certain countries, regions, governments, persons or entities, which could adversely affect our business, financial condition and operating results.
We are subject to various domestic and international anti-corruption laws, such as the U.S. Foreign Corrupt Practices Act, as well as similar anti-bribery and anti-kickback laws and regulations. These laws and regulations generally prohibit companies and their intermediaries from offering or making improper payments to non-U.S. officials for the purpose of obtaining, retaining or directing business. Our exposure for violating these laws and regulations increases as our international presence expands and as we increase sales and operations in foreign jurisdictions.
Breaches of our cybersecurity systems could degrade our ability to conduct our business operations and deliver products to our customers, result in data losses and the theft of our intellectual property, damage our reputation, and require us to incur significant additional costs to maintain the security of our networks and data.
We increasingly depend upon our information technology systems to conduct our business operations, ranging from our internal operations and product development and manufacturing activities to our marketing and sales efforts and communications with our customers and business partners. Computer programmers may attempt to penetrate our network security, or that of our website, and misappropriate our proprietary information or cause interruptions of our service. Because the techniques used by such computer programmers to access or sabotage
28
Table of Contents
networks change frequently and may not be recognized until launched against a target, we may be unable to anticipate these techniques. We have also outsourced a number of our business functions to third-party contractors, including our manufacturers, and our business operations also depend, in part, on the success of our contractors’ own cybersecurity measures. Accordingly, if our cybersecurity systems and those of our contractors fail to protect against unauthorized access, sophisticated cyberattacks and the mishandling of data by our employees and contractors, our ability to conduct our business effectively could be damaged in a number of ways, including sensitive data regarding our employees or business, including intellectual property and other proprietary data, could be stolen. Should this occur, we could be subject to significant claims for liability from our customers and regulatory actions from governmental agencies. In addition, our ability to protect our intellectual property rights could be compromised and our reputation and competitive position could be significantly harmed. Consequently, our financial performance and results of operations could be adversely affected.
Our production facilities could be damaged or disrupted by a natural disaster, war, terrorist attacks or other catastrophic events.
Our manufacturing facilities are subject to risks associated with natural disasters, such as earthquakes, fires, floods tsunami, typhoons and volcanic activity, environmental disasters, health epidemics, and other events beyond our control such as power loss, telecommunications failures, and uncertainties arising out of armed conflicts or terrorist attacks. A substantial majority of our facilities as well as our research and development personnel are located in the PRC. Any catastrophic loss or significant damage to any of our facilities would likely disrupt our operations, delay production, and adversely affect our product development schedules, shipments and revenue. In addition, any such catastrophic loss or significant damage could result in significant expense to repair or replace the facility and could significantly curtail our research and development efforts in a particular product area or primary market, which could have a material adverse effect on our operations and operating results.
Our management and auditors identified a material weakness in our internal control over financial reporting that, if not properly remediated, could result in material misstatements in our consolidated financial statements that could cause investors to lose confidence in our reported financial information and have a negative effect on the trading price of our stock.
Neither we nor BDO China Shu Lun Pan Certified Public Accountants LLP, or BDO China, our independent registered public accounting firm, has performed a comprehensive assessment of our internal control over financial reporting, as defined by the American Institute of Certified Public Accountants, for purposes of identifying and reporting material weaknesses and other control deficiencies. We are not currently required to comply with Section 404 of the Sarbanes-Oxley Act and therefore are not required to assess the effectiveness of our internal control over financial reporting. Further, BDO China has not been engaged to express, nor has it expressed, an opinion on the effectiveness of our internal control over financial reporting.
In connection with its audits of our consolidated financial statements as of, and for the years ended, December 31, 2016 and 2015, BDO China informed us that it had identified a material weakness in our internal control over financial reporting relating to our lack of sufficient qualified financial reporting and accounting personnel with an appropriate level of expertise to properly address complex accounting issues under accounting principles generally accepted in the United States, or GAAP, and to prepare and review our consolidated financial statements and related disclosures to fulfill GAAP and Securities and Exchange Commission financial reporting requirements. We are taking remedial measures to improve the effectiveness of our controls, including by hiring additional accounting and finance personnel and by engaging outside consulting firms.
The existence of material weaknesses is an indication that there is a more than remote likelihood that a material misstatement of our financial statements will not be prevented or detected in a future period, and the process of designing and implementing effective internal controls and procedures will be a continual effort that may require us to expend significant resources to establish and maintain a system of controls that is adequate to satisfy our reporting obligations as a public company. We cannot assure you that the measures we take will be
29
Table of Contents
sufficient to remediate the material weakness identified by BDO China or that we will implement and maintain adequate controls over our financial processes and reporting in the future in order to avoid additional material weaknesses or controlled deficiencies in our internal control over financing reporting. If our remediation efforts are not successful or other material weaknesses or control deficiencies occur in the future, we may be unable to report our financial results accurately or on a timely basis, which could cause our reported financial results to be materially misstated and result in the loss of investor confidence and cause the trading price of Class A common stock to decline. Moreover, ineffective controls could significantly hinder our ability to prevent fraud.
Our auditor, as a registered public accounting firm operating in the PRC, is not permitted to be inspected by the Public Company Accounting Oversight Board, and consequently investors may be deprived of the benefits of such inspections.
BDO China Shu Lun Pan Certified Public Accountants LLP, or BDO China, is the independent registered public accounting firm that issued the audit report included at the end of this prospectus in connection with our consolidated financial statements as of, and for the years ended, December 31, 2016 and 2015. BDO China, as an auditor of companies that are traded publicly in the United States and a firm registered with the U.S. Public Company Accounting Oversight Board, or PCAOB, is required by the laws of the United States to undergo regular inspections by the PCAOB to assess its compliance with the laws of the United States and applicable professional standards. BDO China is located in the PRC. The PCAOB is currently unable to conduct inspections on auditors in the PRC without the approval of PRC authorities, and therefore BDO China, like other independent registered public accounting firms operating in the PRC, is currently not inspected by the PCAOB.
In May 2013 the PCAOB announced that it has entered into a Memorandum of Understanding on Enforcement Cooperation with the China Securities Regulatory Commission and the Ministry of Finance of China pursuant to which the Ministry of Finance established a cooperative framework between the parties for the production and exchange of audit documents relevant to investigations in both the PRC and the United States. More specifically, the Memorandum of Understanding provides a mechanism for the parties to request and receive from each other assistance in obtaining documents and information in furtherance of their investigative duties. In addition the PCAOB is engaged in continuing discussions with the China Securities Regulatory Commission and the Ministry of Finance to permit joint inspections in the PRC of audit firms that are registered with the PCAOB and to audit PRC companies whose securities are listed on U.S. stock exchanges.
The PCAOB’s inspections of firms outside of the PRC have identified deficiencies in audit procedures and quality control procedures, and such deficiencies may be addressed as part of the inspection process to improve future audit quality. The inability of the PCAOB to conduct inspections of BDO China with respect to its audit of our consolidated financial statements may make it more difficult for investors to evaluate BDO China’s audit procedures and quality control procedures by depriving investors of potential benefits from improvements that could have been facilitated by PCAOB inspections.
Risks Relating to Our Intellectual Property
Our success depends on our ability to protect our intellectual property, including our SAPS and TEBO technologies.
Our commercial success depends in part on our ability to obtain and maintain patent and trade secret protection for our intellectual property, including our SAPS and TEBO technologies and the design of our Ultra C equipment, as well as our ability to operate without infringing upon the proprietary rights of others. There can be no assurance that our patent applications will result in additional patents being issued or that issued patents will afford sufficient protection against competitors with similar technology, nor can there be any assurance that the patents issued will not be infringed, designed around, or invalidated by third parties. Even issued patents may later be found unenforceable or may be modified or revoked in proceedings instituted by third parties before various patent offices or in courts. The degree of future protection for our intellectual property is uncertain. Only
30
Table of Contents
limited protection may be available and may not adequately protect our rights or permit us to gain or keep any competitive advantage. This failure to properly protect the intellectual property rights relating to our products and technologies could have a material adverse effect on our financial condition and results of operations.
The patent application process is subject to numerous risks and uncertainties, and there can be no assurance that we or any of our future development partners will be successful in protecting our product candidates by obtaining and defending patents. These risks and uncertainties include the following:
| • | The U.S. Patent and Trademark Office and various foreign governmental patent agencies require compliance with a number of procedural, documentary, fee payment and other provisions during the patent process. There are situations in which noncompliance can result in abandonment or lapse of a patent or patent application, resulting in partial or complete loss of patent rights in the relevant jurisdiction. In such an event, competitors might be able to enter the market earlier than would otherwise have been the case. |
| • | Patent applications may not result in any patents being issued. |
| • | Patents that may be issued may be challenged, invalidated, modified, revoked, circumvented, found to be unenforceable or otherwise may not provide any competitive advantage. |
| • | Our competitors may seek or may have already obtained patents that will limit, interfere with, or eliminate our ability to make, use and sell our potential product candidates. |
| • | The PRC and other countries other than the United States may have patent laws less favorable to patentees than those upheld by U.S. courts, allowing foreign competitors a better opportunity to create, develop and market competing product candidates. |
In addition, we rely on the protection of our trade secrets and know-how. Although we have taken steps to protect our trade secrets and unpatented know-how, including entering into confidentiality and non-disclosure agreements with third parties and confidential information and inventions agreements with key employees, customers and suppliers, other parties may still obtain this information or may come upon this information independently. If any of these events occurs or if we otherwise lose protection for our trade secrets or proprietary know-how, the value of this information may be greatly reduced.
We may be involved in lawsuits to protect or enforce our patents, which could be expensive, time consuming and unsuccessful.
Competitors may infringe upon our patents. If our technologies are adopted, we believe that competitors may try to match our technologies and tools in order to compete. To counter infringement or unauthorized use, we may be required to file infringement claims, which can be expensive and time consuming. An adverse result in any litigation or defense proceedings, including our current suits, could put one or more of our patents at risk of being invalidated, found to be unenforceable or interpreted narrowly and could put our patent applications at risk of not issuing. Furthermore, because of the substantial amount of discovery required in connection with intellectual property litigation, there is a risk that some of our confidential information could be compromised by disclosure during litigation. In addition, any future patent litigation, interference or other administrative proceedings will result in additional expense and distraction of our personnel. Most of our competitors are larger than we are and have substantially greater resources, and they therefore are likely to be able to sustain the costs of complex patent litigation longer than we could. An adverse outcome in such litigation or proceedings may expose us to loss of our proprietary position.
We may not be able to protect our intellectual property rights throughout the world, which could materially, negatively affect our business.
Filing, prosecuting and defending patents on our products or proprietary technologies in all countries throughout the world would be prohibitively expensive, and our intellectual property rights in some countries
31
Table of Contents
outside the United States, including the PRC, can be less extensive than those in the United States. In addition, the laws of some foreign countries do not protect intellectual property rights to the same extent as federal and state laws in the United States. Consequently, competitors may use our technologies in jurisdictions where we have not obtained patent protection to develop their own products and may export otherwise infringing products to territories where we have patent protection but enforcement is not as strong as that in the United States. These products may compete with our products, and our patents or other intellectual property rights may not be effective or sufficient to prevent them from competing.
Many companies have encountered significant problems in protecting and defending intellectual property rights in foreign jurisdictions. The legal systems of certain countries, particularly certain developing countries, do not favor the enforcement of patents and other intellectual property protection, which could make it difficult for us to stop the infringement of our patents or marketing of competing products in violation of our proprietary rights generally. Proceedings to enforce our patent rights in foreign jurisdictions could result in substantial costs and divert our efforts and attention from other aspects of our business, could put our patents at risk of being invalidated or interpreted narrowly and our patent applications at risk of not issuing, and could provoke third parties to assert claims against us. We may not prevail in any lawsuits that we initiate, and the damages or other remedies awarded, if any, may not be commercially meaningful. Accordingly, our efforts to enforce our intellectual property rights around the world may be inadequate to obtain a significant commercial advantage from the intellectual property that we develop or license and may adversely affect our business.
If we are sued for infringing intellectual property rights of third parties, it will be costly and time consuming, and an unfavorable outcome in that litigation could have a material adverse effect on our business.
Our success depends on our ability to develop, manufacture, market and sell our products without infringing upon the proprietary rights of third parties. Numerous U.S. and foreign-issued patents and pending patent applications owned by third parties exist in the fields in which we are developing products, some of which may contain claims that overlap with the subject matter of our intellectual property. A third party has claimed in the past, and others may claim in the future, that our technology or products infringe their intellectual property. In some instances third parties may initiate litigation against us in an effort to prevent us from using our technology in alleged violation of their intellectual property rights. The risk of such a lawsuit will likely increase as our size and the number and scope of our products increase and as our geographic presence and market share expand. Any potential intellectual property claims or litigation commenced against us could:
| • | be time consuming and expensive to defend, whether or not meritorious; |
| • | force us to stop selling products or using technology that allegedly infringes the third party’s intellectual property rights; |
| • | delay shipments of our products; |
| • | require us to pay damages or settlement fees to the party claiming infringement; |
| • | require us to attempt to obtain a license to the relevant intellectual property, which may not be available on reasonable terms or at all; |
| • | force us to attempt to redesign products that contain the allegedly infringing technology, which could be expensive or which we may be unable to do; |
| • | require us to indemnify our customers, suppliers or other third parties for any loss caused by their use of our technology that allegedly infringes the third party’s intellectual property rights; or |
| • | divert the attention of our technical and managerial resources. |
Because patent applications can take many years to issue, there may be currently pending applications, unknown to us, that may later result in issued patents upon which our products or technologies may infringe. Similarly, there may be issued patents relevant to our products of which we are not aware.
32
Table of Contents
Risks Related to Our Initial Public Offering and Ownership of Class A Common Stock
The market price of Class A common stock may be volatile or may decline regardless of our operating performance, and you may not be able to resell your shares at or above the initial public offering price.
The initial public offering price for Class A common stock was determined through negotiations between the underwriters and us and may vary from the market price of Class A common stock following this offering. If you purchase shares of Class A common stock in this offering, you may not be able to resell those shares at or above the initial public offering price. We cannot assure you that the market price following this offering will equal or exceed prices in privately negotiated transactions of our stock that have occurred from time to time prior to this offering. The market price of Class A common stock may fluctuate significantly in response to numerous factors, many of which are beyond our control, including:
| • | actual or anticipated fluctuations in our revenue and other operating results; |
| • | the financial projections we may provide to the public, any changes in these projections or our failure to meet these projections; |
| • | actions of securities analysts who initiate or maintain coverage of us, changes in financial estimates by any securities analysts who follow our company, or our failure to meet these estimates or the expectations of investors; |
| • | changes in projections for the chips or chip equipment industries or in the operating performance or expectations and stock market valuations of chip companies, chip equipment companies or technology companies in general; |
| • | changes in operating results; |
| • | any changes in the financial projections we may provide to the public, our failure to meet these projections, or changes in recommendations by any securities analysts that elect to follow Class A common stock; |
| • | additional shares of Class A common stock being sold into the market by us or our existing stockholders or the anticipation of such sales; |
| • | price and volume fluctuations in the overall stock market, including as a result of trends in the economy as a whole; |
| • | lawsuits threatened or filed against us; |
| • | litigation and other developments relating to our patents or other proprietary rights or those of our competitors; |
| • | developments in new legislation and pending lawsuits or regulatory actions, including interim or final rulings by judicial or regulatory bodies; and |
| • | general economic trends, including changes in the demand for electronics or information technology or geopolitical events such as war or acts of terrorism, or any responses to such events. |
In recent years, the stock market in general, and the NASDAQ Global Market, or NASDAQ, in particular, has experienced extreme price and volume fluctuations that have often been unrelated or disproportionate to changes in the operating performance of the companies whose stock is experiencing those price and volume fluctuations. These fluctuations may be even more pronounced in the trading market for our stock shortly following this offering.
As a newly public company, our stock price may be volatile, and securities class action litigation has often been instituted against companies following periods of volatility of their stock price. Any such litigation, if instituted against us, could result in substantial costs and a diversion of our management’s attention and resources.
In the past, following periods of volatility in the overall market and the market price of a particular company’s securities, securities class action litigation has often been instituted against these companies. This litigation, if instituted against us, could result in substantial costs and a diversion of our management’s attention and resources.
33
Table of Contents
No public market for Class A common stock currently exists, and an active trading market may not develop or be sustained following this offering.
Prior to this offering, there has been no public market for Class A common stock. An active trading market may not develop following completion of this offering or, if developed, may not be sustained. The lack of an active market may impair your ability to sell your shares at the time you wish to sell them or at a price that you consider reasonable. The lack of an active market may also reduce the fair market value of your shares. There can be no assurance that we will be able to successfully develop a liquid market for Class A common stock.
We have broad discretion in the use of the net proceeds from this offering and the concurrent private placement and may not use them effectively.
We cannot specify with any certainty the particular uses of the net proceeds that we will receive from this offering and the concurrent private placement. Our management will have broad discretion in the application of the net proceeds, including working capital and other general corporate purposes, and we may spend or invest these proceeds in a way with which our stockholders disagree. The failure by our management to apply these funds effectively could harm our business and financial condition. Pending their use, we may invest the net proceeds in a manner that does not produce income or that loses value.
If securities or industry analysts publish inaccurate or unfavorable research about our business, our stock price could decline.
The trading market for Class A common stock will depend in part on the research and reports that securities or industry analysts publish about us or our business. If one or more of the analysts who cover us downgrade the Class A common stock or publish inaccurate or unfavorable research about our business, the Class A common stock price would likely decline. In addition, if one or more of these analysts ceases coverage of the Class A common stock or fails to publish reports about the Class A common stock on a regular basis, we could lose visibility in the financial markets, which in turn could cause the Class A common stock price or trading volume to decline.
Requirements associated with being a public reporting company will increase our costs significantly, as well as divert significant company resources and management attention.
We will be subject to the reporting requirements of the Securities Exchange Act, the Sarbanes-Oxley Act, the Dodd-Frank Wall Street Reform and Consumer Protection Act, the listing requirements of NASDAQ, and other rules and regulations of the SEC upon consummation of this offering. We are working with our legal, independent accounting and financial advisors to identify those areas in which changes should be made to our financial and management control systems to manage our growth and our obligations as a public reporting company. These areas include corporate governance, corporate control, disclosure controls and procedures, and financial reporting and accounting systems. We have made, and will continue to make, changes in these and other areas. Compliance with the various reporting and other requirements applicable to public reporting companies will require considerable time, attention of management and financial resources. In addition, the changes we make may not be sufficient to allow us to satisfy our obligations as a public reporting company on a timely basis.
The listing requirements of NASDAQ require that we satisfy certain corporate governance requirements relating to director independence, distributing annual and interim reports, stockholder meetings, approvals and voting, soliciting proxies, conflicts of interest and a code of conduct. Our management and other personnel will need to devote a substantial amount of time to ensure that we comply with all of these requirements. The reporting requirements, rules and regulations will increase our legal and financial compliance costs and will make some activities more time-consuming and costly. These reporting requirements, rules and regulations, coupled with the increase in potential litigation exposure associated with being a public company, could also make it more difficult for us to attract and retain qualified persons to serve as our directors or executive officers, or to obtain certain types of insurance, including director and officer liability insurance, on acceptable terms.
34
Table of Contents
We have never paid and do not intend to pay cash dividends and, consequently, your ability to achieve a return on your investment will depend on appreciation in the price of Class A common stock.
We have never declared or paid cash dividends on our capital stock. We currently intend to retain any future earnings to finance the operation and expansion of our business, and we do not expect to declare or pay any dividends in the foreseeable future. Accordingly, you may only receive a return on your investment in Class A common stock if the market price of Class A common stock increases.
Our ability to pay dividends on Class A common stock depends significantly on our receiving distributions of funds from our subsidiaries in the PRC. PRC statutory laws and regulations permit payments of dividends by those subsidiaries only out of their retained earnings, which are determined in accordance with PRC accounting standards and regulations that differ from U.S. generally accepted accounting principles. The PRC regulations and our subsidiaries’ articles of association require annual appropriations of 10% of net after-tax profits to be set aside, prior to payment of dividends, as a reserve or surplus fund, which restricts our subsidiaries’ ability to transfer a portion of their net assets to us. In addition, our subsidiaries’ short-term bank loans restrict their ability to pay dividends to us.
If you purchase shares of Class A common stock in this offering, you will experience substantial and immediate dilution.
If you purchase shares of Class A common stock in this offering, you will experience substantial and immediate dilution in the pro forma as adjusted net tangible book value per share of Class A common stock of $2.98 per share as of June 30, 2017. Investors purchasing Class A common stock in this offering will pay a price per share that substantially exceeds the pro forma as adjusted net tangible book value per share. As a result, investors purchasing Class A common stock in this offering will incur immediate dilution of $5.52 per share, based on the initial public offering price of $8.50 per share, the midpoint of the price range on the cover page of this prospectus. This dilution is due in large part to the fact that our earlier investors paid substantially less than the initial public offering price when they purchased their shares of our capital stock. You will experience additional dilution upon exercise of options to purchase Class A common stock under our equity incentive plans or if we issue restricted stock to our employees under our equity incentive plans, and you may experience additional dilution in the future if we otherwise issue additional shares of Class A common stock.
The dual class structure of Class A common stock has the effect of concentrating voting control with our executive officers and directors, including our Chief Executive Officer and President, which will limit or preclude your ability to influence corporate matters.
Class B common stock has twenty votes per share and Class A common stock has one vote per share. Stockholders who hold shares of Class B common stock, who consist principally of our executive officers, employees, directors and their respective affiliates, will collectively hold approximately 79.1% of the voting power of our outstanding capital stock following this offering and the concurrent private placement. Because of the twenty-to-one voting ratio between Class B and Class A common stock, holders of Class B common stock collectively will continue to control a majority of the combined voting power of Class A common stock and therefore be able to control all matters submitted to our stockholders for approval so long as the shares of Class B common stock represent at least 4.8% of all outstanding shares of Class A and Class B common stock. This concentrated control will limit or preclude your ability to influence corporate matters for the foreseeable future. This concentrated control could also discourage a potential investor from acquiring Class A common stock due to the limited voting power of such stock relative to the Class B common stock and might harm the market price of Class A common stock.
Future transfers by holders of Class B common stock will result in those shares converting to Class A common stock, subject to limited exceptions. The conversion of Class B common stock to Class A common stock will have the effect, over time, of increasing the relative voting power of those holders of Class B common stock who retain their shares in the long term.
35
Table of Contents
Substantial future sales of shares by existing stockholders, or the perception that such sales may occur, could cause our stock price to decline.
If our existing stockholders, particularly our directors and executive officers, sell substantial amounts of Class A common stock in the public market, or are perceived by the public market as intending to sell substantial numbers of shares of Class A common stock, the trading price of Class A common stock could decline below the initial public offering price. Based on shares outstanding as of September 30, 2017, upon completion of this offering and the concurrent private placement, we will have 15,112,284 outstanding shares of common stock. Of these shares, only the shares of Class A common stock sold in this offering and registered shares issued pursuant to our equity plans will be freely tradable in the public market, subject to any applicable lock-up agreements or Rule 144 transfer restrictions applicable to affiliates. Our officers, directors and certain holders of our equity securities have entered into contractual lock-up agreements with the underwriters pursuant to which they have agreed, subject to certain exceptions, not to sell or otherwise transfer any of their common stock or securities convertible into or exchangeable for shares of common stock for a period of 180 days after the date of the final prospectus for this offering. We and the lead underwriter in this offering may, however, permit these holders to sell shares prior to the expiration of the lock-up agreements with the underwriters.
Based on shares outstanding as of September 30, 2017, of the 13,112,284 shares of common stock that were not offered and sold in this offering:
| • | 523,210 shares will be eligible for sale in the public market immediately upon completion of this offering; and |
| • | up to 12,589,074 shares will be eligible for sale in the public market beginning 180 days from the date of this prospectus, 8,770,975 of which are held by directors, executive officers and other affiliates and will be subject to volume and other limitations under Rule 144 under the Securities Act. |
Delaware law and provisions in our restated charter and bylaws could make a merger, tender offer or proxy contest difficult, thereby depressing the trading price of Class A common stock.
Our status as a Delaware corporation and the anti-takeover provisions of the Delaware General Corporation Law may discourage, delay, or prevent a change in control by prohibiting us from engaging in a business combination with an interested stockholder for a period of three years after the person becomes an interested stockholder, even if a change of control would be beneficial to our existing stockholders. Our restated charter and bylaws contain provisions that may make the acquisition of our company more difficult, including the following:
| • | our dual class common stock structure provides holders of Class B common stock with the ability to control the outcome of matters requiring stockholder approval, even if they own significantly less than a majority of the total number of outstanding shares of Class A and Class B common stock; |
| • | when the outstanding shares of Class B common stock represent less than a majority of the combined voting power of common stock: |
| • | amendments to our restated charter or bylaws will require the approval of two-thirds of the combined vote of our then-outstanding shares of Class A and Class B common stock; |
| • | vacancies on the board of directors will be able to be filled only by the board and not by stockholders; |
| • | the board, which currently is not staggered, will be automatically separated into three classes with staggered three-year terms; |
| • | directors will only be able to be removed from office for cause; and |
| • | our stockholders will only be able to take action at a meeting and not by written consent; |
| • | only our chair, our chief executive officer or a majority of our directors will be authorized to call a special meeting of stockholders; |
| • | advance notice procedures will apply for stockholders to nominate candidates for election as directors or to bring matters before an annual meeting of stockholders; |
36
Table of Contents
| • | our restated charter will authorize undesignated preferred stock, the terms of which may be established, and shares of which may be issued, without stockholder approval; and |
| • | cumulative voting in the election of directors is prohibited. |
As a Delaware corporation, we are also subject to provisions of Delaware law, including Section 203 of the Delaware General Corporation Law, which limits the ability of stockholders holding more than 15% of our outstanding voting stock from engaging in certain business combinations with us. Any provision of our charter or bylaws or Delaware law that has the effect of delaying or deterring a change in control could limit the opportunity for our stockholders to receive a premium for their shares of Class A common stock, and could also affect the price that some investors are willing to pay for Class A common stock.
Our restated charter designates the Court of Chancery of the State of Delaware as the sole and exclusive forum for certain litigation that may be initiated by our stockholders, which could limit our stockholders’ ability to obtain a favorable judicial forum for disputes with us or our directors, officers or stockholders.
Our restated charter provides that the Court of Chancery of the State of Delaware will, to the fullest extent permitted by law, be the sole and exclusive forum for:
| • | any derivative action or proceeding brought on our behalf; |
| • | any action asserting a claim of breach of a fiduciary duty owed to us, our stockholders, creditors or other constituents by any of our directors, officers, other employees, agents or stockholders; |
| • | any action asserting a claim arising under the Delaware General Corporation Law, our charter or bylaws, or as to which the Delaware General Corporation Law confers jurisdiction on the Court of Chancery of the State of Delaware; or |
| • | any action asserting a claim that is governed by the internal affairs doctrine. |
By becoming a stockholder in our company, you will be deemed to have notice of and have consented to the provisions of our restated charter related to choice of forum. The choice of forum provision in our restated charter may limit our stockholders’ ability to obtain a favorable judicial forum for disputes with us or any of our directors, officers, other employees, agents or stockholders, which may discourage lawsuits with respect to such claims. Alternatively, if a court were to find the choice of forum provision contained in our restated charter to be inapplicable or unenforceable in an action, we may incur additional costs associated with resolving such action in other jurisdictions, which could harm our business, results of operations and financial condition.
We are currently an “emerging growth company,” and the reduced disclosure requirements applicable to emerging growth companies may make Class A common stock less attractive to investors.
We are currently an “emerging growth company,” as defined in the Jumpstart Our Business Startups Act. For so long as we remain an emerging growth company, we are permitted, and intend, to rely on exemptions from certain disclosure requirements that are applicable to other public companies that are not emerging growth companies. These exemptions include reduced disclosure obligations regarding executive compensation and exemptions from the requirements of holding a non-binding advisory vote on executive compensation and stockholder approval of any golden parachute payments not previously approved, not being required to comply with the auditor attestation requirements of Section 404 of the Sarbanes-Oxley Act and not being required to comply with any requirement that may be adopted by the PCAOB regarding mandatory audit firm rotation or a supplement to the auditor’s report providing additional information about the audit and the financial statements. In this prospectus, we have not included all of the executive compensation related information that would be required if we were not an emerging growth company. We cannot predict whether investors will find the Class A common stock less attractive if we rely on these exemptions. If some investors find the Class A common stock less attractive as a result, there may be a less active trading market, and more volatile trading price, for Class A common stock.
37
Table of Contents
We will incur increased costs and demands upon management as a result of complying with the laws and regulations affecting public companies, particularly after we are no longer an “emerging growth company,” which could adversely affect our business, operating results and financial condition.
As a public company, and particularly after we cease to be an “emerging growth company,” we will continue to incur significant legal, accounting and other expenses. We are subject to the reporting requirements of the Securities and Exchange Act, the Sarbanes-Oxley Act, the Dodd-Frank Wall Street Reform and Consumer Protection Act, and the rules and regulations of NASDAQ. These requirements have increased and will continue to increase our legal, accounting and financial compliance costs and have made and will continue to make some activities more time consuming and costly. For example, we expect these rules and regulations to make it more difficult and more expensive for us to obtain director and officer liability insurance, and we may be required to accept reduced policy limits and coverage or incur substantially higher costs to maintain the same or similar coverage. As a result, it may be more difficult for us to attract and retain qualified individuals to serve as our executive officers or on the board of directors, particularly to serve on the audit and compensation committees.
The Sarbanes-Oxley Act requires, among other things, that we assess the effectiveness of our internal control over financial reporting annually and the effectiveness of our disclosure controls and procedures quarterly. In particular, beginning with respect to the year ending December 31, 2018, Section 404 of the Sarbanes-Oxley Act, or Section 404, will require our management to perform system and process evaluation and testing to allow it to report on the effectiveness of our internal control over financial reporting.
We are currently evaluating our internal controls, identifying and remediating deficiencies in those internal controls and documenting the results of our evaluation, testing and remediation. Please see “—Our management and auditors identified a material weakness in our internal control over financial reporting that, if not properly remediated, could result in material misstatements in our consolidated financial statements that could cause investors to lose confidence in our reported financial information and have a negative effect on the trading price of our stock.”
Investor perceptions of our company may suffer if deficiencies are found, which could cause a decline in the market price of our stock. Irrespective of compliance with Section 404, any failure of our internal control over financial reporting could have a material adverse effect on our stated operating results and harm our reputation. If we are unable to implement these requirements effectively or efficiently, it could harm our operations, financial reporting, or financial results and could result in an adverse opinion on our internal controls from our independent registered public accounting firm.
In addition, changing laws, regulations and standards relating to corporate governance and public disclosure are creating uncertainty for public companies, increasing legal and financial compliance costs and making some activities more time consuming. These laws, regulations and standards are subject to varying interpretations, in many cases due to their lack of specificity, and, as a result, their application in practice may evolve over time as new guidance is provided by regulatory and governing bodies. This could result in continuing uncertainty regarding compliance matters and higher costs necessitated by ongoing revisions to disclosure and governance practices. We intend to invest resources to comply with evolving laws, regulations and standards, and this investment may result in increased general and administrative expense and a diversion of management’s time and attention from revenue-generating activities to compliance activities. If our efforts to comply with new laws, regulations and standards differ from the activities intended by regulatory or governing bodies, regulatory authorities may initiate legal proceedings against us and our business may be harmed.
38
Table of Contents
FORWARD-LOOKING STATEMENTS AND STATISTICAL DATA
Special Note Regarding Forward-Looking Statements
This prospectus contains forward-looking statements that involve risks and uncertainties. All statements, other than statements of historical facts, included in this prospectus regarding our strategy, future operations, future financial position, future revenue, projected costs, prospects, plans and objectives of management are forward-looking statements. The forward-looking statements are contained principally in “Prospectus Summary,” “Risk Factors,” “Management’s Discussion and Analysis of Financial Condition and Results of Operations” and “Business.” In some cases, you can identify forward-looking statements by terms such as “may,” “might,” “will,” “objective,” “intend,” “should,” “could,” “can,” “would,” “expect,” “believe,” “anticipate,” “project,” “target,” “design,” “estimate,” “predict,” “potential,” “plan” or the negative of these terms, and similar expressions intended to identify forward-looking statements.
These statements reflect our current views with respect to future events and are based on our management’s belief and assumptions and on information currently available to our management. Although we believe that the expectations reflected in these forward-looking statements are reasonable, these statements relate to future events or our future operational or financial performance, and involve known and unknown risks, uncertainties and other factors that may cause our actual results, performance or achievements to be materially different from any future results, performance or achievements expressed or implied by these forward-looking statements. Some of the key factors that could cause actual results to differ from our expectations include:
| • | our expectations regarding our expenses and revenue, our ability to maintain and expand gross profit; |
| • | the rate and degree of market acceptance of any of our products, particularly in the PRC; |
| • | the size and growth of the potential markets for our products and our ability to serve those markets; |
| • | the progress and costs of developing and commercializing new products; |
| • | our expectations regarding competition; |
| • | the anticipated trends and challenges in our business and the market in which we operate; |
| • | our anticipated growth strategies; |
| • | our ability to attract or retain key personnel; |
| • | our expectations regarding, and the stability of our, supply chain and manufacturing; |
| • | our expectations regarding federal, state and foreign regulatory requirements, including export controls, tax law changes and interpretations, economic sanctions and anti-corruption regulations; |
| • | regulatory developments in the United States and foreign countries; |
| • | our ability to obtain and maintain intellectual property protection for our products; and |
| • | our use of proceeds from this offering and the concurrent private placement. |
Any forward-looking statement made by us in this prospectus speaks only as of the date on which it is made. Except as required by law, we assume no obligation to update these statements publicly, or to update the reasons actual results could differ materially from those anticipated in these statements, even if new information becomes available in the future.
You should read this prospectus, and the documents that we reference in this prospectus and have filed as exhibits to the registration statement of which this prospectus is a part, completely and with the understanding that our actual future results may be materially different from what we expect. We qualify all of our forward-looking statements by these cautionary statements.
39
Table of Contents
Industry and Market Data
This prospectus contains statistical data and estimates, including forecasts, that are based on independent industry and government organization publications or other publicly available information, as well as other information based on our internal sources. While we are not aware of any misstatements regarding any third-party data presented in this prospectus, estimates, and in particular forecasts, involve numerous assumptions and are subject to risks and uncertainties as well as change based on various factors, including those discussed under “Risk Factors” and elsewhere in this prospectus. These and other factors could cause results to differ materially from those expressed in the estimates included in this prospectus.
The following list identifies the sources of certain of the third-party forecasts and other estimates included in this prospectus, together with the section or subsection of this prospectus in which that estimate appears. As of September 30, 2017, each of the following sources was publicly available without charge:
| • | PricewaterhouseCoopers, China’s impact on the semiconductor industry: 2016 update, January 2017 (“Prospectus Summary—Our Company” and “Business—Industry Background—Growing Influence of the PRC Across the Semiconductor Industry”); |
| • | IC Insights, Inc., Semiconductor Unit Shipments To Exceed One Trillion Devices in 2018, March 7, 2016 (“Prospectus Summary—Industry Background and Trends” and “Business—Industry Background”); |
| • | Semiconductor Industry Association and Nathan Associates, Beyond Borders: The Global Semiconductor Value Chain: How an Interconnected Industry Promotes Innovation and Growth, May 2016 (“Business—Industry Background—Ongoing Need for Improved Chip Manufacturing Equipment”); |
| • | Semiconductor Equipment and Materials International, Fab Equipment Spending Trending Upward in 2016 and 2017, September 6, 2016 (“Business—Industry Background—Escalating Need for Advanced Chip Manufacturing Equipment”); |
| • | International Trade Administration of the United States Department of Commerce, 2016 Top Markets Report Semiconductors and Semiconductor Manufacturing Equipment Country Case Study, July 1, 2016 (“Business—Industry Background—Growing Influence of the PRC Across the Semiconductor Industry”); and |
| • | Semiconductor Equipment and Materials International, World Fab Forecast Report, November 2016 (“Business—Our Solutions—China-based operations”). |
40
Table of Contents
We have entered into agreements pursuant to which we expect to issue and sell, in a concurrent private placement, an aggregate of 1,333,334 shares of Class A common stock, of which 833,334 shares would be issued to Xinxin (Hongkong) Capital Co., Limited, a subsidiary of Sino IC Capital Co., Ltd., and 500,000 shares would be issued to Victorious Way Limited, a subsidiary of China Everbright Limited. The concurrent private placement is conditioned upon the closing of this offering, as well as other standard closing conditions. We expect the closing of the concurrent private placement to occur immediately after the closing of the offering made hereby, but the closing of this offering is not contingent on the closing of the concurrent private placement.
Subject to specified limitations, the shares in the concurrent private placement would be sold at the initial public offering price for the offering. Neither investor will be required to pay more than $10.50 per share sold in the concurrent private placement. Xinxin (Hongkong) Capital Co., Limited also has the option not to purchase any of the shares if the initial public offering price is less than $8.40 and Victorious Way Limited has the option not to purchase any shares if Xinxin (Hongkong) Capital Co., Limited elects not to purchase its shares for any reason (pursuant to the terms of its purchase agreement).
The private placement investors have agreed with us not to, directly or indirectly, sell, transfer or dispose of any shares of Class A common stock acquired in the private placement for a period of 180 days after the closing of the private placement. See “Shares Eligible for Future Sale—Lock-up Agreements.”
We have granted the investors certain registration rights, including demand registration rights, with respect to Class A common stock issued in the concurrent private placement, as described under “Description of Capital Stock—Registration Rights.”
Xinxin (Hongkong) Capital Co., Limited will have the right, as described under “Management—Board of Directors—Director Nomination Rights,” to designate one individual for nomination to our board of directors. David H. Wang, our Chair of the Board, Chief Executive Officer and President, members of Dr. Wang’s family, and Haiping Dun, our Lead Director, who collectively will beneficially own shares having 51.2% of the voting power of common stock immediately after the closing of this offering and the concurrent private placement, have agreed to vote their shares for the election of the nominee. We expect Xinxin (Hongkong) Capital Co., Limited to designate an individual for nomination to our board shortly after the consummation of this offering and the concurrent private placement.
41
Table of Contents
We estimate that we will receive net proceeds from this offering and the concurrent private placement of $24.4 million, assuming an initial public offering price of $8.50 per share, the midpoint of the initial public offering price range reflected on the cover page of this prospectus, and after deducting estimated underwriting discounts and commissions, private placement fees, and offering expenses. If the underwriters’ option to purchase additional shares in this offering is exercised in full, we estimate that our net proceeds will be $26.8 million.
A $1.00 increase (decrease) in the assumed initial public offering price of $8.50 per share, the midpoint of the initial public offering price range reflected on the cover page of this prospectus, would increase (decrease) the net proceeds to us from this offering and the concurrent private placement by $1.9 million, assuming the number of shares offered by us, as set forth on the cover page of this prospectus, remains the same and after deducting estimated underwriting discounts and commissions, private placement fees, and offering expenses. Similarly, each increase (decrease) of 100,000 in the number of shares offered by us would increase (decrease) our net proceeds by $790,500, assuming the assumed initial public offering price of $8.50 per share remains the same, and after deducting estimated underwriting discounts and commissions, private placement fees, and offering expenses.
We expect the closing of the concurrent private placement to occur immediately after the closing of the offering made hereby, but the closing of this offering is not contingent on the closing of the concurrent private placement. The investors in the concurrent private placement may, as described in “Concurrent Private Placement,” have the option not to purchase shares in specified circumstances. We estimate that, if no shares were to be purchased in the concurrent private placement, we would receive net proceeds from this offering of $13.6 million, assuming an initial public offering price of $8.50 per share, the midpoint of the initial public offering price range reflected on the cover page of this prospectus, and after deducting estimated underwriting discounts and commissions and offering expenses. If the underwriters’ option to purchase additional shares in this offering were exercised in full, we estimate that our net proceeds of this offering would be $15.9 million.
We intend to use the net proceeds from this offering and the concurrent private placement for working capital and other general corporate purposes, which may include financing our growth and developing new products. The other principal purposes for this offering are to:
| • | create a public market for Class A common stock, which will, among other things, provide future liquidity for our existing security holders; |
| • | facilitate our future access to the public capital markets; and |
| • | improve the effectiveness of our equity compensation plans in attracting and retaining directors and key employees. |
We may use a portion of our net proceeds to acquire businesses, technologies and products that will help us expand the breadth and features of our product offerings, provide access to new markets or customers, or otherwise complement our existing operations. We assess acquisition opportunities on an ongoing basis. We do not currently have any agreement with respect to an acquisition, and we cannot assure you that we will make any acquisitions in the future.
Our expected use of the net proceeds of this offering and the concurrent private placement represents our current intentions based upon our present plans and business conditions. The amounts and timing of our actual expenditures may vary significantly from our expectations depending upon numerous factors, including our operating costs and capital expenditures and the factors described under “Risk Factors.” Because we cannot currently specify with any certainty the particular uses of our net proceeds, our management will have broad discretion in the application of the net proceeds.
Pending use of our net proceeds, we intend to invest the net proceeds in short-term, investment-grade, interest-bearing instruments, certificates of deposit, or direct or guaranteed obligation of the U.S. government.
42
Table of Contents
We have never declared or paid cash dividends on our capital stock. We currently intend to retain all available funds and any future earnings for use in the operation of our business and do not anticipate paying any cash dividends in the foreseeable future. Any future determination to pay dividends on Class A and Class B common stock is subject to the discretion of the board of directors and will depend upon various factors, including our results of operations, financial condition, liquidity requirements, capital requirements, level of indebtedness, contractual restrictions with respect to payment of dividends, restrictions imposed by applicable law, general business conditions and other factors that the board may deem relevant.
Our ability to pay dividends on Class A and Class B common stock depends significantly on our receiving distributions of funds from our subsidiaries in the PRC. PRC statutory laws and regulations permit payments of dividends by those subsidiaries only out of their retained earnings, which are determined in accordance with PRC accounting standards and regulations that differ from U.S. generally accepted accounting principles. The PRC regulations and our subsidiaries’ articles of association require annual appropriations of 10% of net after-tax profits to be set aside, prior to payment of dividends, as a reserve or surplus fund, which restricts our subsidiaries’ ability to transfer a portion of their net assets to us. As of June 30, 2017, no cash was restricted under those PRC regulations or our subsidiaries’ articles because our subsidiaries had never generated net after-tax profits. In addition, our subsidiaries’ short-term bank loans restrict their ability to pay dividends to us.
43
Table of Contents
The table below sets forth our capitalization as of June 30, 2017:
| • | on an actual basis; |
| • | as adjusted to reflect the following: |
| (a) | the closing of strategic investment transactions on September 11, 2017, with Ninebell Co., Ltd. or Ninebell, one of our key subassembly providers, in which we issued 133,334 shares of Class A common stock to Ninebell for a purchase price of $1.0 million and Ninebell issued ordinary shares, representing 20% of its post-closing equity, to us for a purchase price of $1.2 million; |
| (b) | the completion of transactions with minority investors in ACM Shanghai in the third-quarter of 2017, pursuant to which (i) we issued, capital stock consisting of (or convertible, upon the closing of this offering, into) a total of 3,572,844 shares of Class A common stock to the minority investors for an aggregate purchase price of $20.1 million and (ii) ACM Research acquired 18.77% of the outstanding ACM Shanghai equity interests for a purchase price of $5.8 million and will acquire, in the fourth quarter of 2017, all of the remaining outstanding minority ACM Shanghai equity interests for an aggregate purchase price of $14.3 million, as described under “Management’s Discussion and Analysis of Financial Condition and Results of Operations—Recent Equity Transactions—Acquisition of Outstanding Minority Interests in Our Operating Company”; and |
| (c) | exercises of stock options in the third quarter of 2017 to acquire 74,334 shares of Class A common stock; |
| • | on a pro forma basis to further reflect the automatic conversion of all outstanding shares of our convertible preferred stock into Class A common stock and the restatement of our charter, all of which will occur upon completion of this offering; and |
| • | on a pro forma basis as further adjusted to reflect our issuance and sale of 2,000,000 shares of Class A common stock in this offering and of 1,333,334 shares of Class A common stock in the concurrent private placement at an assumed initial public offering price of $8.50 per share, the midpoint of the price range on the cover page of this prospectus, after deducting estimated underwriting discounts and commissions, private placement fees, and offering expenses. |
44
Table of Contents
You should read the information in this table together with “Management’s Discussion and Analysis of Financial Condition and Results of Operations” and our consolidated financial statements and related notes appearing at the end of this prospectus.
| As of June 30, 2017 | ||||||||||||||||
| Actual | As Adjusted | Pro Forma | Pro Forma As Adjusted |
|||||||||||||
| (in thousands, except share and per share data) | ||||||||||||||||
| Short-term debt |
$ | 4,595 | $ | 4,595 | $ | 4,595 | $ | 4,595 | ||||||||
|
|
|
|
|
|
|
|
|
|||||||||
| Redeemable convertible preferred stock, without par value, actual, $0.0001 par value per share, as adjusted, pro forma and pro forma as adjusted: |
||||||||||||||||
| Series A: 385,000 shares authorized, issued and outstanding, actual and as adjusted; no shares authorized, issued or outstanding, pro forma and pro forma as adjusted |
$ | 288 | $ | 288 | $ | — | $ | — | ||||||||
| Series B: 1,572,000 shares authorized, issued and outstanding, actual and as adjusted; no shares authorized, issued or outstanding, pro forma and pro forma as adjusted |
1,572 | 1,572 | — | — | ||||||||||||
| Series C: 1,360,962 shares authorized, issued and outstanding, actual and as adjusted; no shares authorized, issued or outstanding, pro forma and pro forma as adjusted |
2,041 | 2,041 | — | — | ||||||||||||
| Series D: 2,659,975 shares authorized and 1,326,642 shares issued and outstanding, actual and as adjusted; no shares authorized, issued or outstanding, pro forma and pro forma as adjusted |
4,975 | 4,975 | — | — | ||||||||||||
| Series E: 10,718,530 shares authorized and no shares issued and outstanding, actual; 10,718,530 shares authorized and 4,998,530 shares issued and outstanding, as adjusted; no shares authorized, issued or outstanding, pro forma and pro forma as adjusted |
— | 5,800 | — | — | ||||||||||||
| Series F: 6,000,000 shares authorized and 3,663,254 shares, issued and outstanding, actual and as adjusted; no shares authorized, issued or outstanding, pro forma and pro forma as adjusted |
9,158 | 9,158 | — | — | ||||||||||||
|
|
|
|
|
|
|
|
|
|||||||||
| Total redeemable convertible preferred stock |
18,034 | 23,834 | — | — | ||||||||||||
|
|
|
|
|
|
|
|
|
|||||||||
| Stockholders’ (deficit) equity: |
||||||||||||||||
| Undesignated preferred stock, $0.0001 par value per share: no shares authorized, issued and outstanding, actual or as adjusted; 25,000,000 shares authorized and no shares issued or outstanding, pro forma and pro forma as adjusted |
— | — | — | — | ||||||||||||
| Common stock, $0.0001 par value per share: |
||||||||||||||||
| Class A: 100,000,000 shares authorized; 2,627,293 shares issued and outstanding, actual; 4,741,635 shares issued and outstanding, as adjusted; 9,369,212 shares issued and outstanding pro forma; 12,702,546 shares issued and outstanding, pro forma as adjusted |
1 | 1 | 1 | 1 | ||||||||||||
| Class B: 7,303,533 shares authorized and 2,409,738 shares issued and outstanding, actual, and as adjusted; 2,409,738 shares authorized, issued and outstanding, pro forma and pro forma as adjusted |
1 | 1 | 1 | 1 | ||||||||||||
| Additional paid-in capital |
9,346 | 9,411 | 33,245 | 57,641 | ||||||||||||
| Accumulated deficit |
(12,390 | ) | (12,390 | ) | (12,390 | ) | (12,390 | ) | ||||||||
| Accumulated other comprehensive loss |
(247 | ) | (247 | ) | (247 | ) | (247 | ) | ||||||||
|
|
|
|
|
|
|
|
|
|||||||||
| Total ACM Research, Inc. stockholders’ (deficit) equity |
(3,289 | ) | (3,224 | ) | 20,610 | 45,006 | ||||||||||
| Non-controlling interests |
4,809 | — | — | — | ||||||||||||
|
|
|
|
|
|
|
|
|
|||||||||
| Total stockholders’ equity |
1,520 | (3,224 | ) | 20,610 | 45,006 | |||||||||||
|
|
|
|
|
|
|
|
|
|||||||||
| Total capitalization |
$ | (19,554 | ) | $ | (20,610 | ) | $ | 20,610 | $ | 45,006 | ||||||
|
|
|
|
|
|
|
|
|
|||||||||
A $1.00 increase (decrease) in the assumed initial public offering price of $8.50 per share, the midpoint of the initial public offering price range set forth on the cover page of this prospectus, would increase (decrease) the amount of additional paid-in capital, total stockholders’ (deficit) equity and total capitalization by $1.9 million, assuming the number of shares offered by us, as set forth on the cover page of this prospectus, remains the same and after deducting estimated underwriting discounts and commissions, private placement fees, and offering expenses. Similarly, each increase (decrease) of 100,000 shares in the number of shares offered by us would
45
Table of Contents
increase (decrease) additional paid-in capital, total stockholders’ (deficit) equity and total capitalization by $790,500, assuming the assumed initial public offering price of $8.50 per share remains the same, and after deducting estimated underwriting discounts and commissions, private placement fees, and offering expenses. The pro forma as adjusted information discussed above is illustrative only and will be adjusted based on the actual public offering price and other terms of this offering determined at pricing. Moreover, the investors in the concurrent private placement may, as described in “Concurrent Private Placement” and “Use of Proceeds,” have the option not to purchase shares of Class A common stock in specified circumstances, in which case we would receive only the net proceeds of this offering.
The table above excludes the shares of Class A common stock issuable upon the exercise of an outstanding warrant and outstanding options as well as shares of Class A common stock reserved for future issuance under our equity incentive plan, which consisted of:
| • | 397,502 shares of Class A common stock issuable upon the exercise of an outstanding warrant, with an exercise price of $7.50 per share, at June 30, 2017 and September 30, 2017, as described under “Management’s Discussion and Analysis of Financial Condition and Results of Operations—Recent Equity Transactions—Issuance of Warrant”); |
| • | 3,489,959 shares of Class A common stock issuable upon the exercise of outstanding options with a weighted-average exercise price of $2.29 per share at June 30, 2017 and 3,276,074 shares of Class A common stock issuable upon the exercise of outstanding options with a weighted-average exercise price of $2.39 per share at September 30, 2017; and |
| • | 705,383 shares of Class A common stock reserved for issuance under our equity incentive plan at June 30, 2017 and 585,381 shares of Class A common stock reserved for issuance under our equity incentive plan at September 30, 2017 after giving effect to 120,002 shares of Class A common stock to be issuable upon the exercise of options approved for grant to employees, as of the date of this prospectus, with an exercise price per share equal to the initial public offering price of the offering made hereby. |
46
Table of Contents
If you invest in Class A common stock in this offering, your ownership interest will be diluted immediately to the extent of the difference between the initial public offering price per share you will pay in this offering and the pro forma as adjusted net tangible book value per share of Class A common stock immediately after this offering.
As of June 30, 2017, the actual net tangible book value of Class A and Class B common stock was $14.7 million, or $1.84 per share. Actual net tangible book value per share of common stock represents (a) total tangible assets less total liabilities and non-controlling interests, divided by (b) the total number of shares of common stock outstanding on an as-converted basis, assuming the conversion of all outstanding shares of our convertible preferred stock into an aggregate of 2,960,968 shares of Class A common stock, upon completion of this offering.
As of June 30, 2017, the as adjusted net tangible book value of Class A and Class B common stock was $20.6 million, or $1.75 per share. Our as adjusted net tangible book value per share gives effect to:
| • | the closing of strategic investment transactions on September 11, 2017, with Ninebell, in which we issued 133,334 shares of Class A common stock to Ninebell for a purchase price of $1.0 million and Ninebell issued ordinary shares, representing 20% of its post-closing equity, to us for a purchase price of $1.2 million; |
| • | the completion of transactions with minority investors in ACM Shanghai, pursuant to which in the third-quarter of 2017 (i) we issued, 3,572,844 shares of Class A common stock (on an as-converted basis) to the minority investors for an aggregate purchase price of $20.1 million and (ii) ACM Research acquired 18.77% of the outstanding ACM Shanghai equity interests for a purchase price of $5.8 million and will acquire, in the fourth quarter of 2017, all of the remaining outstanding minority ACM Shanghai equity interests for an aggregate purchase price of $14.3 million, as described in “Management’s Discussion and Analysis of Financial Condition and Results of Operations—Recent Equity Transactions—Acquisition of Outstanding Minority Interests in Our Operating Company”; |
| • | exercises of stock options in the third quarter of 2017 to acquire 74,334 shares of Class A common stock; and |
| • | the conversion, upon completion of this offering, of all outstanding shares of our convertible preferred stock into an aggregate of 4,627,577 shares of Class A common stock. |
Our pro forma as adjusted net tangible book value of Class A common stock as of June 30, 2017 would have been $45.0 million, or $2.98 per share. Pro forma as adjusted net tangible book value further adjusts as adjusted data to reflect our sale of 2,000,000 shares of Class A common stock in this offering and 1,333,334 shares of Class A common stock in the concurrent private placement at an assumed initial public offering price of $8.50, the midpoint of the offering price range set forth on the cover page of this prospectus, after deducting estimated underwriting discounts and commissions, private placement fees, and offering expenses. This represents an immediate increase in pro forma as adjusted net tangible book value of $1.23 per share to our existing stockholders and an immediate dilution of $5.52 per share to purchasers.
| Assumed initial public offering price per share |
$ | 8.50 | ||||||
| As adjusted net tangible book value per share as of June 30, 2017 |
$ | 1.75 | ||||||
| Increase in net tangible book value per share attributable to this offering and the concurrent private placement |
1.23 | |||||||
|
|
|
|||||||
| Pro forma as adjusted net tangible book value per share after this offering and the concurrent private placement |
2.98 | |||||||
|
|
|
|||||||
| Dilution per share to purchasers of Class A common stock in this offering and the concurrent private placement |
$ | 5.52 | ||||||
|
|
|
47
Table of Contents
Each $1.00 increase (decrease) in the assumed initial public offering price of $8.50 per share, the midpoint of the initial public offering price range reflected on the cover page of this prospectus, would increase (decrease) the pro forma as-adjusted net tangible book value by $1.9 million and decrease (increase) the dilution per share to purchasers of Class A common stock in this offering by $0.21 per share, assuming the number of shares offered by us, as set forth on the cover page of this prospectus, remains the same and after deducting estimated underwriting discounts and commissions, private placement fees, and offering expenses. We may also increase (decrease) the number of shares we are offering. An increase (decrease) of 100,000 in the number of shares offered by us would increase (decrease) the as adjusted pro forma net tangible book value by $790,500 and decrease (increase) the dilution per share to purchasers of Class A common stock in this offering by $0.02 per share, assuming the assumed initial public offering price of $8.50 per share remains the same, and after deducting estimated underwriting discounts and commissions, private placement fees, and offering expenses. The pro forma information discussed above is illustrative only and will adjust based on the actual initial public offering price and other terms of this offering determined at pricing. Moreover, the investors in the concurrent private placement may, as described in “Concurrent Private Placement” and “Use of Proceeds,” have the option not to purchase shares of Class A common stock in specified circumstances, in which case we would receive only the net proceeds of this offering.
The following table summarizes, on a pro forma as adjusted basis as of June 30, 2017, the differences between existing stockholders, the purchasers of Class A common stock in the concurrent private placement and purchasers of Class A common stock in this offering with respect to the number of shares of Class A common stock purchased from us, the total consideration paid to us and the average price per share paid. The calculation below is based on the assumed initial public offering price of $8.50 per share, the midpoint of the initial public offering price range set forth on the cover page of this prospectus, before deducting estimated underwriting discounts and commissions, private placement fees, and offering expenses.
| Shares Purchased | Total Consideration | Average Price Per Share |
||||||||||||||||||
| Number | Percent | Amount | Percent | |||||||||||||||||
| Existing stockholders |
11,778,950 | 78.0 | % | $ | 54,337,150 | 65.7 | % | $ | 4.61 | |||||||||||
| Purchasers of Class A common stock in the concurrent private placement |
1,333,334 | 8.8 | 11,333,339 | 13.7 | 8.50 | |||||||||||||||
| Purchasers of Class A common stock in this offering |
2,000,000 | 13.2 | 17,000,000 | 20.6 | 8.50 | |||||||||||||||
|
|
|
|
|
|
|
|
|
|||||||||||||
| Totals |
15,112,284 | 100.0 | % | $82,670,489 | 100.0 | % | 5.47 | |||||||||||||
|
|
|
|
|
|
|
|
|
|||||||||||||
The table above excludes the shares of Class A common stock issuable upon the exercise of an outstanding warrant and outstanding options as well as shares of Class A common stock reserved for future issuance under out equity incentive plan, which consisted of:
| • | 397,502 shares of Class A common stock issuable upon the exercise of an outstanding warrant, with an exercise price of $7.50 per share, at June 30, 2017 and September 30, 2017, as described under “Management’s Discussion and Analysis of Financial Condition and Results of Operations—Recent Equity Transactions—Issuance of Warrant”); |
| • | 3,489,959 shares of Class A common stock issuable upon the exercise of outstanding options with a weighted-average exercise price of $2.29 per share at June 30, 2017 and 3,276,074 shares of Class A common stock issuable upon the exercise of outstanding options with a weighted-average exercise price of $2.39 per share at September 30, 2017; and |
| • | 705,383 shares of Class A common stock reserved for issuance under our equity incentive plan at June 30, 2017 and 585,381 shares of Class A common stock reserved for issuance under our equity incentive plan at September 30, 2017 after giving effect to 120,002 shares of Class A common stock to be issuable upon the exercise of options approved for grant to employees, as of the date of this prospectus, with an exercise price per share equal to the initial public offering price of the offering made hereby. |
48
Table of Contents
This prospectus contains translations of Renminbi, or RMB, amounts into U.S. dollars at specific rates solely for the convenience of the reader. We make no representation that any Renminbi or U.S. dollar amounts could have been, or could be, converted into U.S. dollars or Renminbi, as the case may be, at any particular rate, the rates stated below, or at all. The PRC government imposes control over its foreign currency reserves in part through direct regulation of the conversion of Renminbi into foreign exchange and through restrictions on foreign trade. On September 29, 2017, the conversion rate was RMB 6.6369 to U.S. $1.00.
The following table sets forth information concerning exchange rates between the Renminbi and the U.S. dollar for the periods indicated. These rates are provided solely for your convenience and are not necessarily the exchange rates that we used in this prospectus or will use in the preparation of our periodic reports or any other information to be provided to you.
| Exchange Rate | ||||||||||||||||
| Period |
Period End | Average(1) | Low | High | ||||||||||||
| (RMB per U.S. $1.00) | ||||||||||||||||
| 2012 |
6.3001 | 6.2928 | 6.2670 | 6.3495 | ||||||||||||
| 2013 |
6.2897 | 6.1933 | 6.0969 | 6.2898 | ||||||||||||
| 2014 |
6.0990 | 6.1090 | 6.0930 | 6.1710 | ||||||||||||
| 2015 |
6.4936 | 6.2284 | 6.1079 | 6.4936 | ||||||||||||
| 2016 |
6.9370 | 6.6423 | 6.4565 | 6.9508 | ||||||||||||
| 2017 (through September 29) |
6.6369 | 6.7983 | 6.4997 | 6.9526 | ||||||||||||
Source: safe.gov.cn
| (1) | Calculated using the average of the daily exchange rates during the relevant period. |
SELECTED CONSOLIDATED FINANCIAL INFORMATION
The following tables set forth selected consolidated financial data. We derived the consolidated statement of operations data for the years ended December 31, 2015 and 2016 and the consolidated balance sheet data as of December 31, 2016 from our consolidated financial statements audited by BDO China Shu Lun Pan Certified Public Accountants LLP and included at the end of this prospectus. We derived the consolidated statement of operations data for the six months ended June 30, 2016 and June 30, 2017 and the consolidated balance sheet data as of June 30, 2017 from our unaudited consolidated financial statements included elsewhere in this prospectus. In the opinion of management, the unaudited consolidated financial statements have been prepared on the same basis as our audited consolidated financial statements and include all adjustments, consisting only of normal recurring adjustments, necessary for a fair presentation of the information set forth therein. The following tables also show certain operational and non-GAAP financial measures. Our historical results and key metrics are not necessarily indicative of the results to be expected for any future period, and the results for any interim period are not necessarily indicative of the results that may be expected for a full year. The following should be read in conjunction with “Management’s Discussion and Analysis of Financial Condition and Results of Operations” and our consolidated financial statements and related notes included at the end of this prospectus.
49
Table of Contents
Pro forma information in the following tables gives effect to the automatic conversion of all outstanding shares of our convertible preferred stock into Class A common stock upon completion of this offering. See note 2 to the consolidated financial statements appearing at the end of this prospectus for an explanation of the method used to determine the number of shares used in computing historical and pro forma net income (loss) per share.
| Six Months Ended June 30, | Year Ended December 31, | |||||||||||||||
| 2017 | 2016 | 2016 | 2015 | |||||||||||||
| (in thousands, except share and per share data) |
||||||||||||||||
| Consolidated Statement of Operations Data: |
||||||||||||||||
| Revenue |
$ | 14,423 | $ | 8,122 | $ | 27,371 | $ | 31,206 | ||||||||
| Cost of revenue |
8,570 | 5,292 | 14,042 | 17,085 | ||||||||||||
|
|
|
|
|
|
|
|
|
|||||||||
| Gross profit |
5,853 | 2,830 | 13,329 | 14,121 | ||||||||||||
|
|
|
|
|
|
|
|
|
|||||||||
| Operating expenses: |
||||||||||||||||
| Sales and marketing |
2,583 | 1,818 | 3,907 | 4,213 | ||||||||||||
| Research and development |
1,867 | 1,486 | 3,259 | 2,942 | ||||||||||||
| General and administrative |
3,158 | 1,089 | 2,673 | 2,103 | ||||||||||||
|
|
|
|
|
|
|
|
|
|||||||||
| Total operating expenses, net |
7,608 | 4,393 | 9,839 | 9,258 | ||||||||||||
|
|
|
|
|
|
|
|
|
|||||||||
| Income (loss) from operations |
(1,755 | ) | (1,563 | ) | 3,490 | 4,863 | ||||||||||
| Interest expense, net |
(159 | ) | (45 | ) | (165 | ) | (105 | ) | ||||||||
| Other income (expense), net |
(292 | ) | 506 | (343 | ) | 632 | ||||||||||
|
|
|
|
|
|
|
|
|
|||||||||
| Income (loss) before income taxes |
(2,206 | ) | (1,102 | ) | 2,982 | 5,390 | ||||||||||
| Income tax benefit (expense) |
(749 | ) | 73 | (595 | ) | 2,525 | ||||||||||
|
|
|
|
|
|
|
|
|
|||||||||
| Net income (loss) |
(2,955 | ) | (1,029 | ) | 2,387 | 7,915 | ||||||||||
| Less: Net income (loss) attributable to non-controlling interests(1) |
(208 | ) | (476 | ) | 1,356 | 2,535 | ||||||||||
|
|
|
|
|
|
|
|
|
|||||||||
| Net income (loss) attributable to ACM Research, Inc. |
$ | (2,747 | ) | (553 | ) | $ | 1,031 | $ | 5,380 | |||||||
|
|
|
|
|
|
|
|
|
|||||||||
| Net income (loss) per share of common share: |
||||||||||||||||
| Basic |
$ | (0.56) | $ | (0.27) | $ | 0.30 | $ | 1.50 | ||||||||
|
|
|
|
|
|
|
|
|
|||||||||
| Diluted |
$ | (0.56) | $ | (0.27) | $ | 0.18 | $ | 0.97 | ||||||||
|
|
|
|
|
|
|
|
|
|||||||||
| Weighted-average common shares outstanding used in computing per share amounts: |
||||||||||||||||
| Basic |
4,927,973 | 2,061,339 | 2,176,315 | 2,047,383 | ||||||||||||
|
|
|
|
|
|
|
|
|
|||||||||
| Diluted |
4,927,973 | 2,061,339 | 3,792,137 | 3,144,120 | ||||||||||||
|
|
|
|
|
|
|
|
|
|||||||||
| Pro forma net income (loss) per common share: |
||||||||||||||||
| Basic |
$ | (0.35) | $ | 0.20 | ||||||||||||
|
|
|
|
|
|||||||||||||
| Diluted |
$ | (0.35) | $ | 0.15 | ||||||||||||
|
|
|
|
|
|||||||||||||
| Pro forma weighted-average common shares outstanding used in computing per share amounts: |
||||||||||||||||
| Basic |
7,889,818 | 5,137,211 | ||||||||||||||
|
|
|
|
|
|||||||||||||
| Diluted |
7,889,818 | 6,753,033 | ||||||||||||||
|
|
|
|
|
|||||||||||||
| (1) | As of each date, ACM Research held 62.87% of the outstanding equity interests of ACM Shanghai and the remaining 37.13% was held by three third-party investors. As described under “Management’s Discussion and Analysis of Financial Condition and Results of Operations—Recent Equity Transactions—Acquisition of Minority Interests in Our Operating Company,” ACM Research acquired an additional 18.77% of the outstanding ACM Shanghai equity interests as of August 31, 2017 and will acquire, in the fourth quarter of 2017, all of the remaining outstanding equity interests held by the minority investors. |
50
Table of Contents
| Six Months Ended June 30, 2017 |
Year Ended December 31, | |||||||||||
| 2016 | 2015 | |||||||||||
| (in thousands) | ||||||||||||
| Consolidated Balance Sheet Data: |
||||||||||||
| Cash and cash equivalents |
$ | 13,206 | $ | 10,119 | $ | 4,401 | ||||||
| Working capital(1) |
23,433 | 23,278 | 7,381 | |||||||||
| Total assets |
47,437 | 44,467 | 32,151 | |||||||||
| Total indebtedness |
4,595 | 4,772 | 9,691 | |||||||||
| Total liabilities |
27,883 | 23,948 | 27,754 | |||||||||
| Total redeemable convertible preferred stock |
18,034 | 18,034 | 8,876 | |||||||||
| Total ACM Research, Inc. stockholders’ deficit |
(3,289 | ) | (2,434 | ) | (8,236 | ) | ||||||
| Non-controlling interests |
4,809 | 4,919 | 3,757 | |||||||||
| Total stockholders’ (deficit) equity |
1,520 | 2,485 | (4,479 | ) | ||||||||
| (1) | Calculated as current assets minus current liabilities. |
To supplement our consolidated financial statements presented in accordance with U.S. generally accepted accounting principles, or GAAP, we monitor and consider adjusted EBITDA, free cash flow and adjusted operating income (loss), which are non-GAAP financial measures. These measures are commonly used by management and investors as performance measures. They are not considered measures of financial performance under GAAP, and the items excluded from the measures are significant components in understanding and assessing our financial performance. Each of adjusted EBITDA, free cash flow and adjusted operating income (loss) has limitations as an analytical tool, and should not be considered in isolation or as an alternative to such GAAP measures as net income, cash flows provided by or used in operations, investing or financing activities, or other financial statement data presented in our consolidated financial statements as an indicator of financial performance or liquidity. In addition, because they are not measures determined in accordance with GAAP and are susceptible to varying calculations, adjusted EBITDA, free cash flow and adjusted operating income (loss), as presented, may not be comparable to other similarly titled measures of other companies.
| • | We define adjusted EBITDA as our net income excluding interest expense (net), income tax benefit (expense), depreciation and amortization, and stock-based compensation. The following table reconciles net income (loss), the most directly comparable GAAP financial measure, to adjusted EBITDA: |
| Six Months Ended June 30, | Year Ended December 31, | |||||||||||||||
| 2017 | 2016 | 2016 | 2015 | |||||||||||||
| (in thousands) | ||||||||||||||||
| Adjusted EBITDA Data: |
||||||||||||||||
| Net income (loss) |
$ | (2,955 | ) | $ | (1,029 | ) | $ | 2,387 | $ | 7,915 | ||||||
| Interest expense, net |
159 | 45 | 165 | 105 | ||||||||||||
| Income tax expense (benefit) |
749 | (73 | ) | 595 | (2,525 | ) | ||||||||||
| Depreciation and amortization |
118 | 88 | 187 | 160 | ||||||||||||
| Stock-based compensation |
1,348 | 193 | 383 | 423 | ||||||||||||
|
|
|
|
|
|
|
|
|
|||||||||
| Adjusted EBITDA |
$ | (581 | ) | $ | (776 | ) | $ | 3,717 | $ | 6,078 | ||||||
|
|
|
|
|
|
|
|
|
|||||||||
51
Table of Contents
| • | We define free cash flow as net cash provided by operating activities less purchases of property and equipment, net of proceeds from disposals, and purchase of intangible assets. The following table reconciles net cash provided by operating activities, the most directly comparable GAAP financial measure, to free cash flow: |
| Six Months Ended June 30, | Year Ended December 31, | |||||||||||||||
| 2017 | 2016 | 2016 | 2015 | |||||||||||||
| (in thousands) | ||||||||||||||||
| Consolidated Statement of Cash Flows and Free Cash Flow Data: |
||||||||||||||||
| Net cash provided by operating activities |
$ | 2,983 | $ | 4,739 | $ | (3,702 | ) | $ | 2,702 | |||||||
| Purchase of property and equipment, net |
(26 | ) | (95 | ) | (788 | ) | (1,371 | ) | ||||||||
| Purchase of intangible assets |
(36 | ) | (9 | ) | (22 | ) | — | |||||||||
|
|
|
|
|
|
|
|
|
|||||||||
| Free cash flow |
$ | 2,921 | $ | 4,635 | $ | (4,512 | ) | $ | (1,331 | ) | ||||||
|
|
|
|
|
|
|
|
|
|||||||||
| • | We define adjusted operating income (loss) as our income (loss) from operations excluding stock-based compensation. The following table reconciles income (loss) from operations, the most directly comparable GAAP financial measure, to adjusted operating income (loss): |
| Six Months Ended June 30, | Year Ended December 31, | |||||||||||||||
| 2017 | 2016 | 2016 | 2015 | |||||||||||||
| (in thousands) | ||||||||||||||||
| Adjusted Operating Income (Loss) Data: |
||||||||||||||||
| Income (loss) from operations |
$ | (1,755 | ) | $ | (1,563 | ) | $ | 3,490 | $ | 4,863 | ||||||
| Stock-based compensation |
1,348 | 193 | 383 | 423 | ||||||||||||
|
|
|
|
|
|
|
|
|
|||||||||
| Adjusted operating income (loss) |
$ | (407 | ) | $ | (1,370 | ) | $ | 3,873 | $ | 5,286 | ||||||
|
|
|
|
|
|
|
|
|
|||||||||
52
Table of Contents
MANAGEMENT’S DISCUSSION AND ANALYSIS OF
FINANCIAL CONDITION AND RESULTS OF OPERATIONS
You should read the following discussion in conjunction with our consolidated financial statements and related notes appearing at the end of this prospectus. In addition to historical information, the following discussion contains forward-looking statements that involve risks, uncertainties and assumptions. You should read “Risk Factors” for a discussion of factors that could cause our actual results to differ materially from our expectations.
Overview
We develop, manufacture and sell single-wafer wet cleaning equipment, which semiconductor manufacturers can use in numerous manufacturing steps to remove particles, contaminants and other random defects, and thereby improve product yield, in fabricating advanced integrated circuits, or chips. Our Ultra C equipment is designed to remove random defects from a wafer surface effectively, without damaging a wafer or its features, even at an increasingly advanced process node (the minimum line width on a chip) of 22 nanometers, or nm, or less. Our equipment is based on our innovative, proprietary Space Alternated Phase Shift, or SAPS, and Timely Energized Bubble Oscillation, or TEBO, technologies. We developed our proprietary technologies to enable manufacturers to produce chips that reach their ultimate physical limitations while maintaining product yield, which is the percentage of chips on a wafer that meet manufacturing specifications
We seek to market our wet processing equipment by first establishing a referenceable base of leading logic and memory chip makers, whose use of our products can influence decisions by other manufacturers. We believe this process will help us to penetrate the mature integrated circuit manufacturing markets and to build credibility with industry leaders. We have placed evaluation SAPS equipment with selected memory and logic chip customers since 2009 and recognized revenue from SAPS equipment since 2011. Using a similar “demo-to-sales” process, we began placing TEBO evaluation equipment with selected customers in 2016 and recognized revenue from our initial sale of TEBO equipment in December 2016. As of June 30, 2017, we had sold and deployed more than 30 single-wafer wet cleaning tools. We recognized revenue from the selected customers’ purchases of single-wafer wet cleaning equipment totaling $10.6 million, or 73.6% of our revenue, in the first half of 2017, $21.5 million, or 78.4% of our revenue, in 2016, and $26.8 million, or 86.0% of our revenue, in 2015.
We market and sell our products worldwide using a combination of our direct sales force and third-party representatives. We employ direct sales teams in Asia, Europe and North America, and have located these teams near our customers, primarily in the People’s Republic of China, or PRC, Korea, Taiwan and the United States. To supplement our direct sales teams, we have contacts with several independent sales representatives in the PRC, Taiwan and Korea. We also provide after-sales services to our customers by installing new replacement parts as well as making small scale modifications to improve our customers’ product yields.
We established our operational center in Shanghai in 2006 to help us establish and build relationships with chip manufacturers in China and throughout Asia. In addition to our SAPS and TEBO tools, we offer a range of custom-made wafer assembly and packaging equipment, such as coaters and developers, to wafer assembly and packaging factories, principally in the PRC.
Corporate Background
ACM Research incorporated in California in 1998 and redomesticated to Delaware in November 2016. Key events in our corporate development have included:
| • | Initially we focused on developing tools for semiconductor manufacturing process steps involving the integration of ultra-low-K materials and copper. In the early 2000s, we sold tools based on stress-free copper-polishing technology. |
53
Table of Contents
| • | In 2006 we moved our operational center to Shanghai, where we began to conduct our business through our subsidiary ACM Shanghai. This move was made to help us establish and build relationships with chip manufacturers in the PRC. We have financed our operations in part through the sale of minority equity interests in ACM Shanghai. |
| • | In 2007 we began to focus our development efforts on single-wafer wet-cleaning solutions for the front-end chip fabrication process. |
| • | In 2008 ACM Shanghai received an initial grant from local and central governmental authorities in the PRC. The grant relates to the development and commercialization of 65nm to 45nm stress-free polishing technology. |
| • | In 2009 we introduced SAPS megasonic technology, which can be applied in wet wafer cleaning at numerous steps during the chip fabrication process. |
| • | In 2011 ACM Shanghai formed a wholly owned subsidiary in the PRC, ACM Research (Wuxi), Inc., to manage sales and service operations. |
| • | In 2014 ACM Shanghai received an additional grant from local and central governmental authorities in the PRC. The grant relates to the development of electro copper-plating technology. |
| • | In March 2016 we introduced TEBO technology, which can be applied at numerous steps during the fabrication of small node conventional two-dimensional and three-dimensional patterned wafers. |
| • | In March and August 2017, we entered into agreements pursuant to which we will acquire all of the outstanding minority equity interests in ACM Shanghai by no later than December 31, 2017, as described below under “—Recent Equity Transactions—Acquisition of Outstanding Minority Interests in Our Operating Company.” |
| • | In June 2017 we formed a wholly owned subsidiary in Hong Kong, CleanChip Technologies Limited, to act on our behalf in Asian markets outside the PRC by, for example, serving as a trading partner between ACM Shanghai and its customers, procuring raw materials and components, performing sales and marketing activities, and making strategic investments. |
Recent Equity Transactions
Issuance of Warrant
In December 2016 Shengxin (Shanghai) Management Consulting Limited Partnership, or SMC, delivered to our subsidiary ACM Shanghai 20,123,500 RMB (approximately $3.0 million as of the date of funding) in cash, which we refer to as the SMC Investment, for potential investment pursuant to terms to be subsequently negotiated. SMC is a PRC limited partnership owned by Jian Wang, our Vice President, Research and Development and the brother of our Chair of the Board, Chief Executive Officer and President, David H. Wang, and other employees of ACM Shanghai. In March 2017 we issued to SMC a warrant exercisable to purchase 397,502 shares of Class A common stock at a price of $7.50 per share, for a total exercise price of approximately $3.0 million. The warrant may be exercised for cash or on a cashless basis, at the option of SMC, at any time on or before May 17, 2023 to acquire all, but not less than all, of the shares of Class A common stock subject to the warrant.
| • | If SMC does not exercise the warrant by May 17, 2023, ACM Shanghai will be obligated, subject to approval of PRC governmental authorities and ACM Shanghai’s equity holders, to deliver an equity interest of 3.6394% (subject to dilution) in satisfaction of the SMC Investment. |
| • | If SMC exercises the warrant or SMC does not exercise the warrant and the issuance of the equity interest in ACM Shanghai is not completed by August 17, 2023 due to the inability of the parties to obtain required governmental or equity holder approvals, then ACM Shanghai will be obligated to pay to SMC, in satisfaction of the SMC Investment, an amount equal to approximately $3.0 million. |
For more information, see “Related Party Transactions—Issuance of Warrant,” “Principal Stockholders,” and “Description of Capital Stock—Warrant.”
54
Table of Contents
Acquisition of Outstanding Minority Interests in Our Operating Company
Until August 31, 2017 ACM Research owned 62.87% of the outstanding equity interests in ACM Shanghai and three PRC-based third-party investors held the remaining 37.13% of equity interests, which are reflected as “non-controlling interests” in our consolidated balance sheets and related notes. We have taken the following actions in order to enable ACM Research to acquire, consistent with requirements of arrangements previously entered into in connection with the investors’ acquisition of ACM Shanghai equity interests, the outstanding non-controlling interests in ACM Shanghai:
| • | In March 2017 we entered into a securities purchase agreement with Shanghai Science and Technology Venture Capital Co., Ltd., or SSTVC, which held 18.77% of the ACM Shanghai equity interests. Pursuant to that agreement, effective as of August 31, 2017, we (a) acquired, for a purchase price of $5.8 million, SSTVC’s equity interests in ACM Shanghai and (b) issued to SSTVC, for a purchase price of $5.8 million, shares of Series E preferred stock that will convert, upon the closing of this offering, into 1,666,170 shares of Class A common stock, which SSTVC will have acquired at an effective purchase price of $3.48 per share. |
| • | In August 2017 we entered into a securities purchase agreement with Shanghai Pudong High-Tech Investment Co., Ltd., or PDHTI, and its subsidiary Pudong Science and Technology (Cayman) Co., Ltd., or PST, pursuant to which we (a) submitted the winning bid, in an auction process mandated by PRC regulations, to purchase PDHTI’s 10.78% equity interests in ACM Shanghai and (b) issued to PST, on September 8, 2017, 1,119,576 shares of Class A common stock for a purchase price of $7.50 per share, representing an aggregate purchase price of $8.4 million. |
| • | In August 2017 we entered into a securities purchase agreement with Shanghai Zhangjiang Science & Technology Venture Capital Co., Ltd., or ZSTVC, and its subsidiary Zhangjiang AJ Company Limited, or ZJAJ, pursuant to which we (a) submitted the winning bid, in an auction process mandated by PRC regulations, to purchase ZSTVC’s 7.58% equity interests in ACM Shanghai and (b) issued to ZJAJ, on September 8, 2017, 787,098 shares of Class A common stock for a purchase price of $7.50 per share, or an aggregate purchase price of $5.9 million. |
As a result of the foregoing arrangements, ACM Research owned 81.64% of ACM Shanghai’s equity interests as of August 31, 2017 and will own 100% of those equity interests by no later than December 31, 2017.
In accordance with the foregoing agreements, we (a) entered into a voting agreement with SSTVC pursuant to which SSTVC will have certain rights to designate one individual for nomination and election to our board of directors, as described in “Management—Board of Directors—Director Nomination Rights,” and (b) granted SSTVC, PST and ZJAJ certain registration rights with respect to the shares of Class A common stock, as described in “Description of Capital Stock—Registration Rights.”
Strategic Investment in Key Supplier
Ninebell Co., Ltd., or Ninebell, which is located in Seoul, Korea, is the principal supplier of robotic delivery system subassemblies used in our single-wafer cleaning equipment. On September 6, 2017 we and Ninebell entered into:
| • | an ordinary share purchase agreement, effective as of September 11, 2017, pursuant to which, contemporaneously with signing, Ninebell issued to us, for a purchase price of $1.2 million, ordinary shares representing 20% of Ninebell’s post-closing equity; and |
| • | a common stock purchase agreement, effective as of September 11, 2017, pursuant to which, contemporaneously with signing, we issued 133,334 shares of Class A common stock to Ninebell for a purchase price of $7.50 per share, or an aggregate purchase price of $1.0 million. |
In addition, under the ordinary share purchase agreement, Ninebell granted us a preemptive right for all future issuances of equity-related securities by Ninebell and the founder of Ninebell, who is the only other equity holder of Ninebell, granted us a right of first refusal with respect to any future sales of his equity securities.
55
Table of Contents
Key Components of Results of Operations
Revenue
We develop, manufacture and sell single-wafer wet cleaning equipment and custom-made wafer assembly and packaging equipment. Because we currently sell our capital equipment, or tools, to a small number of customers and we customize those tools to fulfill the customers’ specific requirements, our revenue generation fluctuates, depending on the length of the sales, development and evaluation phases:
Sales and Development. During the sale process we may, depending on a prospective customer’s specifications and requirements, need to perform additional research, development and testing to establish that a tool can meet the prospective customer’s requirements. We then host an in-house demonstration of the customized tool prototype. Sales cycles for orders that require limited customization and do not require that we develop new technology usually take from 6 to 12 months, while the product life cycle, including the initial design, demonstration and final assembly phases, for orders requiring development and testing of new technologies can take as long as 2 to 4 years. As we expand our customer base, we expect to gain more repeat purchase orders for tools that we have already developed and tested, which will eliminate the need for a demonstration phase and shorten the development cycle.
Evaluation Periods. When a chip manufacturer proposes to purchase a particular type of tool from us for the first time, we offer the manufacturer an opportunity to evaluate the tool for a period that can extend for 24 months or longer. We do not receive any payment on first-time purchases until the tool is accepted. As a result, we may spend between $1.0 and $2.0 million to produce a tool without receiving payment for more than 24 months or, if the tool is not accepted, without receiving any payment. Please see “Risk Factors—Risks Related to Our Business and Our Industry—We may incur significant expenses long before we can recognize revenue from new products, if at all, due to the costs and length of research, development, manufacturing and customer evaluation process cycles.”
Purchase Orders. In accordance with industry practice, sales of our tools are made pursuant to purchase orders. Each purchase order from a customer for one of our tools contains specific technical requirements intended to ensure, among other things, that the tool will be compatible with the customer’s manufacturing process line. Until a purchase order is received, we do not have a binding purchase commitment. Our SAPS and TEBO customers to date have provided us with non-binding one- to two-year forecasts of their anticipated demands, and we expect future customers to furnish similar non-binding forecasts for planning purposes. Any of those forecasts would be subject to change, however, by the customer at any time, without notice to us.
Fulfillment. We seek to obtain a purchase order for a tool from three to four months in advance of the expected delivery date. Depending upon the nature of a customer’s specifications, the lead time for production of a tool generally will extend from two to four months. The lead-time can be as long as six months, however, and in some cases we may need to begin producing a tool based on a customer’s non-binding forecast, rather than waiting to receive a binding purchase order.
We expect our sales prices generally to range between $2.5 million and $5.0 million for SAPs tools and between $3.5 million and $6.5 million for TEBO tools. The sales price of a particular tool will vary depending upon the required specifications. We have designed equipment models using a modular configuration that we customize to meet customers’ technical specifications. For example, our Ultra C models for SAPS and TEBO solutions use modular configurations that enable us to create a wet-cleaning tool meeting a customer’s specific requirements, while using pre-existing designs for chamber, electrical, chemical delivery and other modules.
Because of the relatively large purchase prices of our tools, customers generally pay in installments. For a customer’s repeat purchase of a particular type of tool, the specific payment terms are negotiated in connection with acceptance of a purchase order. Based on our limited experience with repeat sales of SAPS and TEBO tools, we expect that we will receive an initial payment upon delivery of a tool in connection with a repeat purchase, with the balance being paid once the tool has been tested and accepted by the customer. Our sales arrangements for repeat purchases do not include a general right of return.
56
Table of Contents
Since introducing SAPS technology in 2009, we have focused on selling SAPS-based tools and, beginning in 2016, TEBO-based tools. Our revenue from sales of single-wafer wet cleaning equipment totaled $10.6 million, or 73.6% of our revenue, in the first half of 2017 (compared with $5.6 million, or 69.1% of revenue, in the first half of 2016), $21.5 million, or 78.4% of our revenue, in 2016 and $26.8 million, or 86.0% of our revenue, in 2015.
We have generated most of our revenue from a limited number of customers as the result of our strategy of initially placing SAPS- and TEBO-based equipment with a small number of leading chip manufacturers that are driving technology trends and key capability implementation. In the first half of 2017, 62.8% of our revenue was derived from three customers: SK Hynix Inc., a leading Korean memory chip company that accounted for 22.8% of our revenue; Shanghai Huali Microelectronics Corporation, a leading PRC foundry that accounted for 20.6% of our revenue; and Yangtze Memory Technologies Co., Ltd., a leading PRC memory chip company that, together with one of its subsidiaries, accounted 19.4% of our revenue. In 2016 99.3% of our revenue was derived from four customers: Shanghai Huali Microelectronics Corporation, which accounted for 33.7% of our revenue; Semiconductor Manufacturing International Corporation, a leading PRC foundry that accounted for 25.0% of our revenue; SK Hynix Inc., which accounted for 24.0% of our revenue; and JiangYin ChangDian Advanced Packaging Co. Ltd., a leading PRC foundry that accounted for 16.6% of our revenue. In 2015 all of our revenue was derived from three customers, including SK Hynix Inc., which accounted for 86.0% of our revenue, and JiangYin ChangDian Advanced Packaging Co., Ltd., which accounted for 10.1% of our revenue.
Based on our market experience, we believe that implementation of our equipment by one of our selected leading companies will attract and encourage other manufacturers to evaluate our equipment, because the leading company’s implementation will serve as validation of our equipment and will enable the other manufacturers to shorten their evaluation processes. We placed our first SAPS-based tool in 2009 as a prototype. We worked closely with the customer for two years in debugging and modifying the tool, and the customer then spent two more years of qualification and running pilot production before beginning volume manufacturing. Our revenue in 2015 included sales of SAPS-based tools following the customer’s completion of its qualification process. We expect that the period from new product introduction to high volume manufacturing will be three years or less in the future. Please see “Risk Factors—Business—We depend on a small number of customers for a substantial portion of our revenue, and the loss of, or a significant reduction in orders from, one or more of our major customers could have a material adverse effect on our revenue and operating results. There are also a limited number of potential customers for our products.”
All of our sales in 2015, 2016 and the first half of 2017 were to customers located in Asia, and we anticipate that a substantial majority of our revenue will continue to come from customers located in this region for the near future. We have increased our sales efforts to penetrate the markets in North America and Western Europe.
We recognize revenue in accordance with the Securities and Exchange Commission’s Staff Accounting Bulletin No. 104, as described below under “—Critical Accounting Policies and Significant Judgments and Estimates—Revenue Recognition.”
We offer extended maintenance service contracts to provide services such as trouble-shooting or fine-tuning tools, and installing spare parts, following expiration of applicable initial warranty coverage periods, which for sales to date have extended from 12 to 36 months as described under “—Critical Accounting Policies and Significant Judgments and Estimates—Warranty.” A limited number of the single-wafer wet cleaning tools we have sold to date are no longer covered by their initial warranties. In 2015, 2016 and the first half of 2017, we received payments for parts and labor for service activities provided from time to time, but as of June 30, 2017 we had not yet entered into extended maintenance service contracts with respect to any of the tools for which initial warranty coverage had expired. We expect to enter into extended maintenance service contracts with customers as additional initial warranties expire, but we do not expect revenue from extended maintenance service contracts to represent a material portion of our revenue in the future.
57
Table of Contents
The loss or delay of one or more large sale transactions in a quarter could impact our results of operations for that quarter and any future quarters for which revenue from that transaction is lost or delayed, as described under “Risk Factors—Risks Related to Our Business and Our Industry—Our quarterly operating results can be difficult to predict and can fluctuate substantially, which could result in volatility in the price of Class A common stock.” It is difficult to predict accurately when, or even if, we can complete a sale of a tool to a potential customer or to increase sales to any existing customer. Our tool demand forecasts are based on multiple assumptions, including non-binding forecasts received from customers years in advance, each of which may introduce error into our estimates. Difficulties in forecasting demand for our tools make it difficult for us to project future operating results and may lead to periodic inventory shortages or excess spending on inventory or on tools that may not be purchased, as further described in “Risk Factors—Risks Related to Our Business and Our Industry—Difficulties in forecasting demand for our tools may lead to periodic inventory shortages or excess spending on inventory items that may not be used.”
Cost of Revenue
Cost of revenue for capital equipment consists primarily of:
| • | direct costs, which consist principally of costs of tool components and subassemblies purchased from third-party vendors; |
| • | compensation of personnel associated with our manufacturing operations, including stock-based compensation; |
| • | depreciation of manufacturing equipment; |
| • | amortization of costs of software used for manufacturing purposes; |
| • | other expenses attributable to our manufacturing department; and |
| • | allocated overhead for rent and utilities. |
We are not party to any long-term purchasing agreements with suppliers. Please see “Risk Factors—Risks Related to Our Business and Our Industry—Our customers do not enter into long-term purchase commitments, and they may decrease, cancel or delay their projected purchases at any time.”
As our customer base and tool installations continue to grow, we will need to hire additional manufacturing personnel. The rates at which we add customers and install tools will affect the level and time of this spending. In addition, because we often import components and spare parts from the United States, we have experienced, and expect to continue to experience, the effect of the dollar’s growth on our cost of revenue.
Gross Margin
Our gross margin was 40.6% in the first half of 2017 (compared with 34.8% in the first half of 2016), 48.7% in 2016 and 45.3% in 2015. Gross margin may vary from period to period, primarily related to the level of utilization and the timing and mix of purchase orders. We expect gross margin to be between 40% and 45% for the foreseeable future, with direct manufacturing costs approximating 50% to 55% of revenue and overhead costs totaling approximately 5% of revenue.
We seek to maintain our gross margin by continuing to develop proprietary technologies that avoid pricing pressure for our wet cleaning equipment. We actively manage our operations through principles of operational excellence designed to ensure continuing improvement in the efficiency and quality of our manufacturing operations by, for example, implementing factory constraint management and change control and inventory management systems. In addition, our purchasing department actively seeks to identify and negotiate supply contracts with improved pricing to reduce cost of revenue.
58
Table of Contents
A significant portion of our raw materials are denominated in Renminbi, or RMB, while the majority of our purchase orders are denominated in U.S. dollars. As a result, currency exchange rates may have a significant effect on our gross margin. For further information, please see “Exchange Rate Information.”
Operating Expenses
We have experienced, and expect to continue to experience, growth in the dollar amount of our operating expenses, as we make investments to support the anticipated growth of our customer base and the continued development of proprietary technologies. As we continue to grow our business, we expect operating expenses to increase in absolute dollars.
Sales and Marketing
Sales and marketing expense accounted for 17.9% of our revenue in the first half of 2017 (compared with 22.4% of revenue in the first half of 2016), 14.3% of our revenue in 2016 and 13.5% of our revenue in 2015. Sales and marketing expense consists primarily of:
| • | compensation of personnel associated with pre- and after-sales support and other sales and marketing activities, including stock-based compensation; |
| • | sales commissions paid to independent sales representatives; |
| • | fees paid to sales consultants; |
| • | shipping and handling costs for transportation of products to customers; |
| • | warranty costs; |
| • | cost of trade shows; |
| • | travel and entertainment; and |
| • | allocated overhead for rent and utilities. |
Sales and marketing expense can be significant and may fluctuate, in part because of the resource-intensive nature of our sales efforts and the length and variability of our sales cycle. The length of our sales cycle, from initial contact with a customer to the execution of a purchase order, is generally 6 to 24 months.
During the sales cycle, we expend significant time and money on sales and marketing activities, including educating customers about our tools, participating in extended tool evaluations and configuring our tools to customer-specific needs. Sales and marketing expense in a given period can be particularly affected by the increase in travel and entertainment expenses associated with the finalization of purchase orders or the installation of tools.
We expect that, for the foreseeable future, sales and marketing expense will increase in absolute dollars, as we continue to invest in sales and marketing by hiring additional employees and expanding marketing programs in existing or new markets. We must invest in sales and marketing processes in order to develop and maintain close relationships with customers. We are making dollar-based investments in dollars in order to support growth of our customer base in the United States, and the relative strength of the dollar could have a significant effect on our sales and marketing expense.
59
Table of Contents
Research and Development
Research and development expense accounted for 13.0% of our revenue in the first half of 2017 (compared with 18.3% of revenue in the first half of 2016), 11.9% of our revenue in 2016 and 9.4% of our revenue in 2015. Research and development expense relates to the development of new products and processes and encompasses our research, development and customer support activities. Research and development expense consists primarily of:
| • | compensation of personnel associated with our research and development activities, including stock-based compensation; |
| • | costs of components and other research and development supplies; |
| • | travel expense associated with customer support; |
| • | amortization of costs of software used for research and development purposes; and |
| • | allocated overhead for rent and utilities. |
Some of our research and development has been funded by grants from the PRC government, as described in “—PRC Government Research and Development Funding” below.
We expect that, for the foreseeable future, research and development expense will increase in absolute dollars and will range between 10% and 12% of revenue, as we continue to invest in research and development to advance our technologies. We intend to continue to invest in research and development to support and enhance our existing single-wafer wet cleaning products and to develop future product offerings to build and maintain our technology leadership position.
General and Administrative
General and administrative expense accounted for 21.9% of our revenue in the first half of 2017 (compared with 13.4% of revenue in the first half of 2016), 9.8% of our revenue in 2016 and 6.7% of our revenue in 2015. General and administrative expense consists primarily of:
| • | compensation of executive, accounting and finance, human resources, information technology, and other administrative personnel, including stock-based compensation; |
| • | professional fees, including accounting and legal fees; |
| • | other corporate expenses; and |
| • | allocated overhead for rent and utilities. |
We expect that, for the foreseeable future, general and administrative expense will increase in absolute dollars, as we incur additional costs associated with growing our business and operating as a public company.
Stock-Based Compensation Expense
We grant stock options to employees and non-employee consultants and directors, and we accounts for those stock-based awards in accordance with Accounting Standards Codification, or ASC, Topic 718, Compensation—Stock Compensation and ASC Subtopic 505-50, Equity-Based Payments to Non-Employees, each as adopted by the Financial Accounting Standards Board, or FASB.
| • | Stock-based awards granted to employees are measured at the fair value of the awards on the grant date and are recognized as expenses either (a) immediately on grant, if no vesting conditions are required, or (b) using the graded vesting method, net of estimated forfeitures, over the requisite service period. The fair value of stock options is determined using the Black-Scholes valuation model. Stock-based compensation expense, when recognized, is charged to cost of revenue or to the category of operating expense corresponding to the employee’s service function. |
60
Table of Contents
| • | Stock-based awards granted to non-employees are accounted for at the fair value of the awards at the earlier of (a) the date at which a commitment for performance by the non-employee to earn the awards is reached and (b) the date at which the non-employee’s performance is complete. The fair value of such non-employee awards is re-measured at each reporting date using the fair value at each period end until the vesting date. Changes in fair value between the reporting dates are recognized by the graded vesting method. |
Cost of revenue and operating expenses during the periods presented below have included stock-based compensation as follows:
| Six Months Ended June 30, |
Year Ended December 31, |
|||||||||||||||
| 2017 | 2016 | 2016 | 2015 | |||||||||||||
| (in thousands) | ||||||||||||||||
| Stock-Based Compensation Expense: |
||||||||||||||||
| Cost of revenue |
$ | 10 | $ | 6 | $ | 11 | $ | 9 | ||||||||
| Sales and marketing expense |
18 | 2 | 5 | 4 | ||||||||||||
| Research and development expense |
26 | 2 | 5 | 4 | ||||||||||||
| General and administrative expense |
1,294 | 183 | 362 | 406 | ||||||||||||
|
|
|
|
|
|
|
|
|
|||||||||
| $ | 1,348 | $ | 193 | $ | 383 | $ | 423 | |||||||||
|
|
|
|
|
|
|
|
|
|||||||||
We recognized stock-based compensation expense to employees of $128,000 in the first half of 2017 (compared to $46,000 in the first half of 2016), $92,000 in 2016 and $73,000 in 2015. As of June 30, 2017 and December 31, 2016 and 2015, there was $788,000, $726,000 and $299,000 of total unrecognized employee share-based compensation expense, net of estimated forfeitures, related to unvested share-based awards, which are expected to be recognized over a weighted-average period of 2.12 years, 2.25 years and 1.24 years, respectively.
We recognized stock-based compensation expense to non-employees of $1.2 million in the first half of 2017 (compared to $148,000 in the first half of 2016), $291,000 in 2016 and $350,000 in 2015. The fair value of each option granted to a non-employee is re-measured at each period end until the vesting date.
PRC Government Research and Development Funding
ACM Shanghai has received three grants from local and central governmental authorities in the PRC. The first grant, which was awarded in 2008, relates to the development and commercialization of 65nm to 45nm stress-free polishing technology. The second grant was awarded in 2009 to fund interest expense on short-term borrowings. The most recent grant was made in 2014 and relates to the development of electro copper-plating technology. PRC governmental authorities provide the majority of the funding, although ACM Shanghai is also required to invest certain amounts in the projects.
The PRC governmental grants contain certain operating conditions, and we are required to go through a government due diligence process once the project is complete. The grants therefore are recorded as long-term liabilities upon receipt, although we are not required to return any funds we receive. Grant amounts are recognized in our statements of operations and comprehensive income as follows:
| • | Government subsidies relating to current expenses are reflected as reductions of those expenses in the periods in which they are reported. Those reductions totaled $2.1 million in the first half of 2017 (compared to $2.0 million in the first half of 2016), $6.2 million in 2016 and $3.8 million in 2015. |
| • | Government subsidies for interest on short-term borrowings are reported as reductions of interest expense in the periods the interest is accrued. Those reductions totaled $0 in the first half of 2017 (compared to $101,000 in the first half of 2016), $99,000 in 2016 and $303,000 in 2015. |
61
Table of Contents
| • | Government grants used to acquire depreciable assets are transferred from long-term liabilities to property, plant and equipment when the assets are acquired and then the recorded amounts of the assets are credited to other income over the useful lives of the assets. Related government subsidies recognized as other income totaled $65,000 in the first half of 2017 (compared to $63,000 in the first half of 2016), $127,000 in 2016 and $105,000 in 2015. |
Net Income Attributable to Non-Controlling Interests
Since 2006 we have conducted our business through our subsidiary ACM Shanghai, and we have financed our operations in part through sale of minority equity interests in ACM Shanghai. From January 1, 2015 to August 31, 2017, ACM Research owned 62.87% of the equity interests of ACM Shanghai and three non-controlling, unrelated investors held the remaining 37.13%. As described above under “—Our Company—Acquisition of Outstanding Minority Interests in Our Operating Company,” ACM Research (a) acquired an additional 18.77% equity interest from one of the minority investors as of August 31, 2017 and (b) entered into agreements with the other two minority investors pursuant to which it will acquire the remaining non-controlling interests in the fourth quarter of 2017.
How We Evaluate Our Operations
We present information below with respect to three measures of financial performance:
| • | We define “adjusted EBITDA” as our net income excluding interest expense (net), income tax benefit (expense), depreciation and amortization, and stock-based compensation. We define adjusted EBITDA to also exclude restructuring costs, although we have not incurred any such costs to date. |
| • | We define “free cash flow” as net cash provided by operating activities less purchases of property and equipment (net of proceeds from disposals) and of intangible assets. |
| • | We define “adjusted operating income (loss)” as our income (loss) from operations excluding stock-based compensation. |
These financial measures are not based on any standardized methodologies prescribed by accounting principles generally accepted in the United States, or GAAP, and are not necessarily comparable to similarly titled measures presented by other companies.
We have presented adjusted EBITDA, free cash flow and adjusted operating income (loss) because they are key measures used by our management and board of directors to understand and evaluate our operating performance, to establish budgets and to develop operational goals for managing our business. We believe that these financial measures help identify underlying trends in our business that could otherwise be masked by the effect of the expenses that we exclude. In particular, we believe that the exclusion of the expenses eliminated in calculating adjusted EBITDA and adjusted operating income (loss) can provide useful measures for period-to-period comparisons of our core operating performance and that the exclusion of property and equipment purchases from operating cash flow can provide a usual means to gauge our capability to generate cash. Accordingly, we believe that these financial measures provide useful information to investors and others in understanding and evaluating our operating results, enhancing the overall understanding of our past performance and future prospects, and allowing for greater transparency with respect to key financial metrics used by our management in its financial and operational decision-making.
Adjusted EBITDA, free cash flow and adjusted operating income (loss) are not prepared in accordance with GAAP, and should not be considered in isolation of, or as an alternative to, measures prepared in accordance with GAAP. There are a number of limitations related to the use of adjusted EBITDA rather than net income (loss), which is the nearest GAAP equivalent. Some of these limitations are:
| • | adjusted EBITDA excludes depreciation and amortization and, although these are non-cash expenses, the assets being depreciated or amortized may have to be replaced in the future; |
62
Table of Contents
| • | we exclude stock-based compensation expense from adjusted EBITDA and adjusted operating income (loss), although (a) it has been, and will continue to be for the foreseeable future, a significant recurring expense for our business and an important part of our compensation strategy and (b) if we did not pay out a portion of our compensation in the form of stock-based compensation, the cash salary expense included in operating expenses would be higher, which would affect our cash position; |
| • | the expenses and other items that we exclude in our calculation of adjusted EBITDA may differ from the expenses and other items, if any, that other companies may exclude from adjusted EBITDA when they report their operating results; |
| • | adjusted EBITDA does not reflect changes in, or cash requirements for, working capital needs; |
| • | adjusted EBITDA does not reflect interest expense, or the requirements necessary to service interest or principal payments on debt; |
| • | adjusted EBITDA does not reflect income tax expense (benefit) or the cash requirements to pay taxes; |
| • | adjusted EBITDA does not reflect historical cash expenditures or future requirements for capital expenditures or contractual commitments; |
| • | although depreciation and amortization charges are non-cash charges, the assets being depreciated and amortized will often have to be replaced in the future, and adjusted EBITDA does not reflect any cash requirements for such replacements; and |
| • | adjusted EBITDA includes expense reductions and non-operating other income attributable to PRC governmental grants, which may mask the effect of underlying developments in net income (loss), including trends in current expenses and interest expense, and free cash flow includes the PRC governmental grants, the amount and timing of which can be difficult to predict and are outside our control. |
The following table reconciles net income (loss), the most directly comparable GAAP financial measure, to adjusted EBITDA:
| Six Months Ended June 30, |
Year Ended December 31, |
|||||||||||||||
| 2017 | 2016 | 2016 | 2015 | |||||||||||||
| (in thousands) | ||||||||||||||||
| Adjusted EBITDA Data: |
||||||||||||||||
| Net income (loss) |
$ | (2,955 | ) | $ | (1,029 | ) | $ | 2,387 | $ | 7,915 | ||||||
| Interest expense, net |
159 | 45 | 165 | 105 | ||||||||||||
| Income tax expense (benefit) |
749 | (73 | ) | 595 | (2,525 | ) | ||||||||||
| Depreciation and amortization |
118 | 88 | 187 | 160 | ||||||||||||
| Stock-based compensation |
1,348 | 193 | 383 | 423 | ||||||||||||
|
|
|
|
|
|
|
|
|
|||||||||
| Adjusted EBITDA |
$ | (581 | ) | $ | (776 | ) | $ | 3,717 | $ | 6,078 | ||||||
|
|
|
|
|
|
|
|
|
|||||||||
Adjusted EBITDA in the six months ended June 30, 2017, as compared with the comparable period in 2016, reflected an increase of $3.2 million in net operating expenses, substantially offset by an increase of $3.0 million in gross profit. Adjusted EBITDA in 2016, as compared with 2016, reflected a decrease of $792,000 in gross profit and an increase of $582,000 in net operating expenses, in addition to the other factors driving net income. We do not exclude from adjusted EBITDA expense reductions and non-operating other income attributable to PRC governmental grants because we consider and incorporate the expected amounts and timing of those grants in incurring expenses and capital expenditures. If we did not receive the grants, our cash expenses therefore would be lower, and our cash position would not be affected, to the extent we have accurately anticipated the amounts of the grants. For additional information regarding our PRC grants, please see “—Key Components of Results of Operations—PRC Government Research and Development Funding.”
63
Table of Contents
The following table reconciles net cash provided by operating activities, the most directly comparable GAAP financial measure, to free cash flow:
| Six Months Ended June 30, |
Year Ended December 31, |
|||||||||||||||
| 2017 | 2016 | 2016 | 2015 | |||||||||||||
| (in thousands) | ||||||||||||||||
| Free Cash Flow Data: |
||||||||||||||||
| Net cash (used in) provided by operating activities |
$ | 2,983 | $ | 4,739 | $ | (3,702 | ) | $ | 2,702 | |||||||
| Purchases of property and equipment, net of proceeds from disposals |
(26 | ) | (95 | ) | (788 | ) | (1,371 | ) | ||||||||
| Purchases of intangible assets |
(36 | ) | (9 | ) | (22 | ) | — | |||||||||
|
|
|
|
|
|
|
|
|
|||||||||
| Free cash flow |
$ | 2,921 | $ | 4,635 | $ | (4,512 | ) | $ | 1,331 | |||||||
|
|
|
|
|
|
|
|
|
|||||||||
Free cash flow in the six months ended June 30, 2017, as compared with the comparable period in 2016, reflected, in addition to the factors driving net cash provided by operating activities, (a) decreases in accounts receivable offset by increases in accounts payable and (b) increases in stock-based compensation. Free cash flow in 2016, as compared with 2015, reflected, in addition to the factors driving net cash provided by operating activities, (a) increases in inventory and accounts receivable resulting from increased sales activities and (b) our continued expenditures on property and equipment. Consistent with our methodology for calculating adjusted EBITDA, we do not adjust free cash flow for the effects of PRC government subsidies, because we take those subsidies into account in incurring expenses and capital expenditures.
Adjusted operating income (loss) excludes stock-based compensation from income (loss) from operations. Although stock-based compensation is an important aspect of the compensation of our employees and executives, determining the fair value of certain of the stock-based instruments we utilize involves a high degree of judgment and estimation and the expense recorded may bear little resemblance to the actual value realized upon the vesting or future exercise of the related stock-based awards. Furthermore, unlike cash compensation, the value of stock options, which is an element of our ongoing stock-based compensation expense, is determined using a complex formula that incorporates factors, such as market volatility, that are beyond our control. Management believes it is useful to exclude stock-based compensation in order to better understand the long-term performance of our core business and to facilitate comparison of our results to those of peer companies. The use of non-GAAP financial measures excluding stock-based compensation has limitations, however. If we did not pay out a portion of our compensation in the form of stock-based compensation, the cash salary expense included in operating expenses would be higher, which would affect our cash position. The following tables reflect the exclusion of stock-based compensation from line items comprising income (loss) from operations:
| Six Months Ended June 30, | ||||||||||||||||||||||||
| 2017 | 2016 | |||||||||||||||||||||||
| Actual (GAAP) |
SBC | Adjusted (Non-GAAP) |
Actual (GAAP) |
SBC | Adjusted (Non-GAAP) |
|||||||||||||||||||
| (in thousands) | ||||||||||||||||||||||||
| Adjusted Operating Income (Loss): |
||||||||||||||||||||||||
| Revenue |
$ | 14,423 | $ | — | $ | 14,423 | $ | 8,122 | $ | — | $ | 8,122 | ||||||||||||
| Cost of revenue |
(8,570 | ) | (10 | ) | (8,560 | ) | $ | (5,292 | ) | (6 | ) | (5,286 | ) | |||||||||||
|
|
|
|
|
|
|
|
|
|||||||||||||||||
| Gross profit |
5,853 | 5,863 | 2,830 | 2,836 | ||||||||||||||||||||
| Operating expenses: |
||||||||||||||||||||||||
| Sales and marketing |
(2,583 | ) | (18 | ) | (2,565 | ) | (1,818 | ) | (2 | ) | (1,816 | ) | ||||||||||||
| Research and development |
(1,867 | ) | (26 | ) | (1,841 | ) | (1,486 | ) | (2 | ) | (1,484 | ) | ||||||||||||
| General and administrative |
(3,158 | ) | (1,294 | ) | (1,864 | ) | (1,089 | ) | (183 | ) | (906 | ) | ||||||||||||
|
|
|
|
|
|
|
|
|
|
|
|
|
|||||||||||||
| Income (loss) from operations |
$ | (1,755 | ) | $ | (1,348 | ) | $ | (407 | ) | $ | (1,563 | ) | (193 | ) | $ | (1,370 | ) | |||||||
|
|
|
|
|
|
|
|
|
|
|
|
|
|||||||||||||
64
Table of Contents
| Year Ended December 31, | ||||||||||||||||||||||||
| 2016 | 2015 | |||||||||||||||||||||||
| Actual (GAAP) |
SBC | Adjusted (Non-GAAP) |
Actual (GAAP) |
SBC | Adjusted (Non-GAAP) |
|||||||||||||||||||
| (in thousands) | ||||||||||||||||||||||||
| Adjusted Operating Income (Loss): |
||||||||||||||||||||||||
| Revenue |
$ | 27,371 | $ | — | $ | 27,371 | $ | 31,206 | $ | — | $ | 31,206 | ||||||||||||
| Cost of revenue |
(14,042 | ) | (11 | ) | (14,031 | ) | (17,085 | ) | (9 | ) | (17,076 | ) | ||||||||||||
|
|
|
|
|
|
|
|
|
|||||||||||||||||
| Gross profit |
13,329 | 13,340 | 14,121 | 14,130 | ||||||||||||||||||||
| Operating expenses: |
||||||||||||||||||||||||
| Sales and marketing |
(3,907 | ) | (5 | ) | (3,902 | ) | (4,213 | ) | (4 | ) | (4,209 | ) | ||||||||||||
| Research and development |
(3,259 | ) | (5 | ) | (3,254 | ) | (2,942 | ) | (4 | ) | (2,938 | ) | ||||||||||||
| General and administrative |
(2,673 | ) | (362 | ) | (2,311 | ) | (2,103 | ) | (406 | ) | (1,697 | ) | ||||||||||||
|
|
|
|
|
|
|
|
|
|
|
|
|
|||||||||||||
| Income (loss) from operations |
$ | 3,490 | $ | (383 | ) | $ | 3,873 | $ | 4,863 | $ | (423 | ) | $ | 5,286 | ||||||||||
|
|
|
|
|
|
|
|
|
|
|
|
|
|||||||||||||
Adjusted operating loss in the six months ended June 30, 2017, as compared with the comparable period in 2016, reflected an increase of $1.2 million in stock-based compensation expense. Adjusted operating income in 2016, as compared with 2015, reflected a decrease of $44,000 in stock based compensation expense.
Critical Accounting Policies and Significant Judgments and Estimates
The preparation of our consolidated financial statements in conformity with GAAP requires management to make estimates and assumptions in applying our accounting policies that affect the reported amounts of assets, liabilities, revenue and expenses, and related disclosures of contingent assets and liabilities. We base these estimates and assumptions on historical experience, and evaluate them on an on-going basis to ensure that they remain reasonable under current conditions. Actual results could differ from those estimates. The accounting policies that reflect our more significant estimates, judgments and assumptions and that we believe are the most critical to aid in fully understanding and evaluating our reported financial results include the following:
Revenue Recognition
We utilize the guidance set forth in the FASB’s ASC Topic 605, Revenue Recognition, regarding the recognition, presentation and disclosure of revenue in our financial statements. We recognize revenue when persuasive evidence of an arrangement exists; delivery has occurred and the major risks and remunerations of ownership have been transferred to the customer; collectability is probable; and the selling price is fixed or determinable.
In general, we recognize revenue when a tool has been demonstrated to meet the customer’s predetermined specifications and is accepted by the customer. If terms of the sale provide for a lapsing customer acceptance period, we recognize revenue as of the earlier of the expiration of the lapsing acceptance period and customer acceptance. In the following circumstances, however, we recognize revenue upon shipment or delivery, when legal title to the tool is passed to a customer as follows:
| • | when the customer has previously accepted the same type of tool with the same specifications and when we can objectively demonstrate that the tool meets all of the required acceptance criteria; |
| • | when the sales contract or purchase order does not contain an acceptance agreement or a lapsing acceptance provision and when we can objectively demonstrate that the tool meets all of the required acceptance criteria; |
| • | when the customer withholds acceptance due to issues unrelated to product performance, in which case revenue is recognized when the system is performing as intended and meets predetermined specifications; or |
| • | when our sales arrangements do not include a general right of return. |
65
Table of Contents
Customization, production, installation and delivery are essential elements of the functionality of our delivered tools, but the related services we offer, principally warranty services, are not essential to tool functionality. We treat the customization, production, installation and delivery of tools, together with the provision of related warranty and other services, as a single unit of accounting in accordance with the FASB’s ASC Subtopic 605-25, Revenue Recognition—Multiple Element Arrangements. In the first half of 2017 and in 2016 and 2015 all of our tools were sold in stand-alone arrangements.
We offer post-warranty period services, which consist principally of the installation and replacement of parts and small-scale modifications to the equipment. The related revenue and costs of revenue are recognized when parts have been delivered and installed, risk of loss has passed to the customer, and collection is probable. We do not expect revenue from extended maintenance service contracts to represent a material portion of our revenue in the future.
Stock-Based Compensation
We account for grants of stock options based on their grant date fair value and recognize compensation expense over the vesting periods. We estimate the fair value of stock options as of the date of grant using the Black-Scholes option pricing model. Stock options granted to non-employees are subject to periodic revaluation over their vesting terms.
Stock-based compensation expense represents the cost of the grant date fair value of employee stock option grants recognized over the requisite service period of the awards (usually the vesting period) on a straight-line basis, net of estimated forfeitures. We estimate the fair value of stock option grants using the Black-Scholes option pricing model, which requires the input of highly subjective assumptions, including (a) the risk-free interest rate, (b) the expected volatility of our stock, (c) the expected term of the award and (d) the expected dividend yield.
| • | The risk-free interest rates for periods within the expected life of the option are based on the yields of zero-coupon U.S. Treasury securities. |
| • | Due to the lack of a public market for the trading of the common stock and a lack of company-specific historical and implied volatility data, we have based our estimate of expected volatility on the historical volatility of a group of similar companies that are publicly traded. For these analyses, we have selected companies with comparable characteristics to ours including enterprise value, risk profile, position within the industry, and with historical share price information sufficient to meet the expected life of the stock-based awards. We compute the historical volatility data using the daily closing prices for the selected companies’ shares during the equivalent period of the calculated expected term of our stock-based awards. We will continue to apply this process until a sufficient amount of historical information regarding the volatility of our own stock price becomes available. |
| • | The expected term represents the period of time that options are expected to be outstanding. The expected term of stock options is based on the average between the vesting period and the contractual term for each grant according to Staff Accounting Bulletin No. 110. |
| • | The expected dividend yield is assumed to be 0%, based on the fact that we have never paid cash dividends and have no present intention to pay cash dividends. |
66
Table of Contents
No stock options were granted to employees during the six months ended June 30, 2016. For employee stock option grants made during the six months ended June 30, 2017 and the years ended December 31, 2016 and 2015, the weighted-average assumptions used in the Black-Scholes option pricing model to determine the fair value of those grants were as follows:
| Six Months Ended June 30, 2017 |
Year Ended December 31, | |||||
| 2016 | 2015 | |||||
| Risk-free interest rate |
2.22% | 2.02% - 2.32% | 1.87% | |||
| Expected volatility |
29.18% | 29.93% | 37.67% | |||
| Expected term (in years) |
6.25% | 5.75 - 6.25 | 6.25 | |||
| Expected dividend yield |
0% | 0% | 0% | |||
For non-employee stock option grants made during the six months ended June 30, 2017 and 2016 and the years ended December 31, 2016 and 2015, the weighted-average assumptions used in the Black-Scholes option pricing model to determine the fair value of those grants were as follows:
| Six Months Ended June 30, | Year Ended December 31, | |||||||
| 2017 | 2016 | 2016 | 2015 | |||||
| Risk-free interest rate |
1.85% - 2.33% | 0.71% - 1.21% | 1.00% - 2.25% | 1.31% - 1.76% | ||||
| Expected volatility |
28.87% - 29.41% | 30.59% - 31.43% | 29.93% | 33.21% | ||||
| Expected term |
4.08 - 6.19 | 2.62 - 5.69 | 2.11 - 6.24 | 3.12 - 5.94 | ||||
| Expected dividend yield |
0% | 0% | 0% | 0% | ||||
The following table summarizes by grant date the number of shares of common stock underlying stock options granted since January 1, 2015, as well as the associated per share exercise price and the estimated fair value per share of common stock on the grant date:
| Grant Dates |
Number of Common Shares Underlying Options Granted |
Exercise Price per Common Share |
Estimated Fair Value per Common Share |
|||||||||
| May 1, 2015 |
783,338 | $ | 1.50 | $ | 1.50 | |||||||
| September 8, 2015 |
263,335 | 1.50 | 1.50 | |||||||||
| December 28, 2016 |
1,424,596 | 3.00 | 2.28 | |||||||||
| March 9, 2017 |
33,334 | 7.50 | 7.50 | |||||||||
| May 9, 2017 |
183,335 | 7.50 | 7.50 | |||||||||
As of June 30, 2017, the unrecognized compensation cost related to outstanding options was $788,000 and is expected to be recognized as expense over a weighted-average of 2.12 years. As of December 31, 2016, the unrecognized compensation cost related to outstanding options was $726,000 and is expected to be recognized as expense over a weighted-average of 2.25 years. As of December 31, 2015, the unrecognized compensation cost related to outstanding options was $299,000 and is expected to be recognized as expense over a weighted-average of 1.24 years.
As of June 30, 2017, we had outstanding stock options to acquire an aggregate of 3,489,959 shares of Class A common stock with an intrinsic value of $21.7 million. Of those outstanding options, (a) 1,611,595 shares had vested as of June 30, 2017, representing an intrinsic value of $11.6 million and (b) 1,878,364 shares were unvested, representing an intrinsic value of $10.1 million.
67
Table of Contents
Determination of Fair Value of Common Stock
We are required to estimate the fair value of common stock underlying our stock-based awards when performing fair value calculations. All options to purchase shares of common stock are intended to be granted with an exercise price per share no less than the fair value per share of the common stock underlying those options on the date of grant, based on the information known to us on the date of grant. In the absence of a public trading market for the common stock, on each grant date we develop an estimate of the fair value of the common stock with the assistance of a third party valuation specialist to determine an exercise price for the option grants.
We historically have granted stock options at exercise prices equal to the fair value of the common stock as of the date of grant, as determined by the board of directors with input from management. Because there has been no public market for the common stock, the board determined the fair value of the common stock by considering a number of objective and subjective factors, including our financial performance and projections, the relative illiquidity of the common stock, the pricing of sales of convertible preferred stock to third parties, the preferences of our outstanding convertible preferred stock as compared to the common stock, including the liquidation preferences and dividend rights, peer group trading multiples, and trends in the broad semiconductor equipment market.
On December 28, 2016, the compensation committee of the board of directors, acting with the assistance of a third-party valuation specialist, considered the fair value of the common stock. In considering the fair value, the compensation committee took into account the methodologies, approaches and assumptions provided by the Audit and Accounting Practice Aid Series: Valuation of Privately Held Company Equity Securities Issued as Compensation of the American Institute of Certified Public Accountants, or the Practice Aid.
There are significant judgments and estimates inherent in the compensation committee’s determination of the fair value of the common stock. These judgments and estimates include assumptions regarding our future operating performance, the time to completing an IPO or other liquidity event, and the determination of the appropriate valuation methods. If we had made different assumptions, our stock-based compensation expense, net loss and net loss per common share could have been significantly different.
In accordance with the Practice Aid, the compensation committee considered the various methods for allocating the enterprise value across the classes and series of capital stock to determine the fair value of our common stock at each valuation date.
The compensation committee considered, but did not use, the following methods:
| • | The liquidation value method assumes the discontinuance of the business as a going concern. |
| • | The single period capitalization method is most appropriate when a company’s current and historical operations can reasonably be considered indicative of its future operations. The compensation committee determined that, since we are planning for higher annual growth than shown by our current and historical results, this method will not produce a value indicative of our growing company. |
| • | The excess earnings method estimates the value of a company’s intangible assets and assumes that earnings in excess of a reasonable return of the net tangible assets are a product of a company’s intangible assets. The compensation committee deemed this method not to be a meaningful indication of value for the same reasons it rejected the single period capitalization method and also because our actual investment in net tangible assets is minimal. |
| • | The comparative transaction method derives indications of fair value from actual merger and acquisition transactions in the markets. The purchase prices in merger and acquisition transactions may be a better reflection of investment value than fair value of a target. Given the stage of our growth, the compensation committee determined a comparative transaction would not adequately reflect our value. |
| • | The capital market method seeks valuation guidance from prices paid by shareholders for similarly situated publicly traded companies. With the capital market method, the compensation committee |
68
Table of Contents
| would determine an appropriate multiple to apply to our financial measures by dividing the price of a guideline company’s stock and, in some instances, the value of all invested capital, by some relative economic variable observed or calculated from such company’s financial statement. Given the stage of our growth, the compensation committee determined the application of value metrics fails to capture value that we have created but that has not yet been reflected in our operating results. |
| • | The discounted cash flow method is based on the assumed returns from a company’s assets, and converts this into an enterprise value. The present value of a stream of benefits is obtained by a discount rate that takes into account a company’s stage of development and risks involved. The compensation committee deemed this method not suitable in the instant case due to our then-recent transactions involving the sale of our securities. |
In light of our placement and sale of Series F preferred stock in December 2016, the compensation committee applied the company transaction method, which uses the most recent negotiated arm’s-length transactions involving the sale or transfer of stock or other equity interests. In applying the company transaction method, the compensation committee used the option-pricing model, or OPM, under which shares are valued by creating a series of call options with exercise prices based on the liquidation preferences and conversion terms of each equity class. The values of preferred stock and common stock are inferred by analyzing these options.
Under the company transaction method, the compensation committee analyzed equity value in the context of both an initial public offering and a sale or merger of our company. Using the OPM and the post-money value of the Series F preferred stock, it was possible to determine the implied equity value for all classes of stock. In applying the OPM, the compensation committee relied on the equity value of our company based upon the Series F preferred stock investment, which was completed at a price of $2.50 per share. This value was then used to determine the implied Class A common stock value using the OPM, considering (a) the applicable conversion rate of 0.3333 shares of Class A common stock for each share of Series F preferred stock and (b) the claims of the various classes of equity securities. The compensation committee then applied a discount for lack of marketability to obtain the value of Class A common stock on a minority/marketable basis. The assumptions used in calculating the fair value of option grants in 2016 were a risk-free rate based on the weighted average of the one year and two year Treasury Constant Maturity Rates, expected expiration at 1.25 years from the valuation date, and expected volatility estimated at 45%. These assumptions represented the best estimates of management and the compensation committee, but the estimates necessarily involve inherent uncertainties and the application of judgment.
Based on the foregoing, the compensation committee determined the fair value of Class A common stock for financial reporting purposes to be $2.28 as of December 28, 2016. As a result, the exercise price of $3.00 of the stock options granted on December 28, 2016 exceeded the fair value of Class A common stock on that date.
On March 9, 2017, the compensation committee of the board of directors considered the fair value of the common stock. In considering the fair value, the compensation committee took into account the methodologies, approaches and assumptions provided by the Practice Aid. In accordance with the Practice Aid, the compensation committee considered the various methods for allocating the enterprise value across the classes and series of capital stock to determine the fair value of our common stock at each valuation date. Consistent with its process and analysis on December 28, 2016, the compensation committee considered, but did not use, the liquidation value, single period capitalization, excess earnings, comparative transaction, capital market and discounted cash flow methods. The compensation committee determined that the terms of a share purchase agreement being negotiated and discussed at arm’s length in March 2017 and involving the transfer of Class A common stock provided the best evidence of the fair value of the Class A common stock. In the transaction, we expected to issue, and ultimately issued, 133,334 shares of Class A common stock at a purchase price of $7.50 per share. Because this direct evidence of the fair value of the Class A common stock was available, the compensation committee did not need to apply the company transaction method.
69
Table of Contents
Based on the foregoing, the compensation committee determined the fair value of Class A common stock for financial reporting purposes to be $7.50 as of March 9, 2017. As a result, the exercise price of $7.50 of the stock option granted on March 9, 2017 equaled the fair value of Class A common stock on that date.
On May 9, 2017, the compensation committee of the board of directors considered the fair value of the common stock. In considering the fair value, the compensation committee took into account the methodologies, approaches and assumptions provided by the Practice Aid. In accordance with the Practice Aid, the compensation committee considered the various methods for allocating the enterprise value across the classes and series of capital stock to determine the fair value of our common stock at each valuation date. Consistent with its process and analysis on December 28, 2016 and March 9, 2017, the compensation committee considered, but did not use, the liquidation value, single period capitalization, excess earnings, comparative transaction, capital market and discounted cash flow methods. The compensation committee determined that the terms of the share purchase agreement considered in connection with the option grants on March 9, 2017, but still being negotiated as of May 9, 2017, provided the best evidence of the fair value of the Class A common stock. Pursuant to this proposed agreement, we continued to contemplate the issuance and sale of 133,334 shares of Class A common stock at a purchase price of $7.50 per share. Because this direct evidence of the fair value of the Class A common stock was available, the compensation committee did not need to apply the company transaction method.
Based on the foregoing, the compensation committee determined the fair value of Class A common stock for financial reporting purposes to be $7.50 as of May 9, 2017. As a result, the exercise price of $7.50 of the stock option granted on May 9, 2017 equaled the fair value of Class A common stock on that date.
Since May 9, 2017, the compensation committee has not granted any options, but has allocated 120,002 shares of Class A common stock for options to be granted to employees on the date that this registration statement, of which this prospectus forms a part, is declared effective, at an exercise price per share equal to the initial public offering price of the offering made hereby.
Inventory
Inventories consist of finished goods, raw materials, work-in-process and consumable materials. Finished goods are comprised of direct materials, direct labor, depreciation and manufacturing overhead. Inventory is stated at the lower of cost and net recognizable value of the inventory at June 30, 2017 and at the lower of cost and market value of the inventory at December 31, 2016 and 2015. The cost of a general inventory item is determined using the weighted average method. The cost of an inventory item purchased specifically for a customized tool is determined using the specific identification method. Market value is determined as the lower of replacement cost and net realizable value, which is the estimated selling price, in the ordinary course of business, less estimated costs to complete or dispose.
We assess the recoverability of all inventories quarterly to determine if any adjustments are required. We write down excess or obsolete tool-related inventory based on management’s analysis of inventory levels and forecasted 12-month demand and technological obsolescence and spare parts inventory based on forecasted usage. These factors are affected by market and economic conditions, technology changes, new product introductions and changes in strategic direction, and they require estimates that may include uncertain elements. Actual demand may differ from forecasted demand, and those differences may have a material effect on recorded inventory values.
Our manufacturing overhead standards for product costs are calculated assuming full absorption of forecasted spending over projected volumes, adjusted for excess capacity. Abnormal inventory costs such as costs of idle facilities, excess freight and handling costs, and spoilage are recognized as current period charges.
Allowance for Doubtful Accounts
Accounts receivable are reflected in our consolidated balance sheets at their estimated collectible amounts. A substantial majority of our accounts receivable are derived from sales to large multinational semiconductor manufacturers in Asia. We follow the allowance method of recognizing uncollectible accounts receivable, pursuant to which we regularly assess our ability to collect outstanding customer invoices and make estimates of the collectability of accounts receivable. We provide an allowance for doubtful accounts when we determine that the collection of an outstanding customer receivable is not probable. The allowance for doubtful accounts is reviewed
70
Table of Contents
on a quarterly basis to assess the adequacy of the allowance. We take into consideration (a) accounts receivable and historical bad debts experience, (b) any circumstances of which we are aware of a customer’s inability to meet its financial obligations, (c) changes in our customer payment history, and (d) our judgments as to prevailing economic conditions in the industry and the impact of those conditions on our customers. If circumstances change, such that the financial conditions of our customers are adversely affected and they are unable to meet their financial obligations to us, we may need to record additional allowances, which would result in a reduction of our net income.
Deferred Initial Public Offering Costs
Direct costs attributable to this offering have been deferred and recorded in other current assets and will be offset against the gross proceeds received from this offering. At June 30, 2017 and December 30, 2016 and 2015, deferred costs attributable to this offering were $797,000, $41,000 and $0, respectively.
Property, Plant and Equipment
Assets comprising property, plant and equipment are recorded at cost. Depreciation is recorded on a straight-line basis over the estimated useful lives of the assets and begins when the assets are placed in service. Betterments or renewals are capitalized when incurred. Maintenance and repairs with respect to an asset are expensed as incurred if they neither materially add to the value of the asset nor appreciably prolong its life. Assets comprising plant, property and equipment are reviewed each year to determine whether any events or circumstances indicate that the carrying amount of the asset may not be recoverable.
Intangible Assets
Intangible assets represent the fair value of separately recognizable intangible assets acquired in connection with our business operations. We evaluate intangibles for impairment on an annual basis or whenever events or circumstances indicate that an impairment may have occurred.
Valuation of Long-Lived Assets
Long-lived assets are evaluated for impairment whenever events or changes in circumstance indicate that the carrying value of an asset may not be fully recoverable or that the useful life is shorter than we had originally estimated. When these events or changes occur, we evaluate the impairment of the long-lived assets by comparing the carrying value of the assets to an estimate of future undiscounted cash flows expected to be generated from the use of the assets and their eventual disposition. If the sum of the expected future undiscounted cash flow is less than the carrying value of the assets, we recognize an impairment loss based on the excess of the carrying value over the fair value. No impairment charge was recognized in 2015, 2016 and the six months ended June 30, 2017.
Income Taxes
Income taxes are accounted for using the liability method. Under this method, deferred income tax assets and liabilities are recognized for the future tax consequences attributable to temporary differences between the financial statement carrying amounts of existing assets and liabilities and their respective tax bases. Deferred income tax assets and liabilities are measured using enacted tax rates expected to apply to taxable income in the years in which these temporary differences are expected to be recovered or settled. The effect on deferred tax assets and liabilities of a change in tax rates is recognized in income in the period that includes the enactment date. A valuation allowance would be provided for the deferred tax assets if it is more likely than not that the related benefit will not be realized.
On a quarterly basis, we provide income tax provisions based upon an estimated annual effective income tax rate. The effective tax rate is highly dependent upon the geographic composition of worldwide earnings, tax regulations governing each region, availability of tax credits and the effectiveness of our tax planning strategies. We carefully monitor the changes in many factors and adjust our effective income tax rate on a timely basis. If actual results differ from these estimates, this could have a material effect on our financial condition and results of operations.
71
Table of Contents
We maintained a partial valuation allowance as of December 31, 2016 with respect to certain net deferred tax assets based on our estimates of recoverability. We determined that the partial valuation allowance was appropriate given our historical operating losses and uncertainty with respect to our ability to generate profits from our business model sufficient to take advantage of the deferred tax assets in all applicable tax jurisdictions.
The calculation of our tax liabilities involves dealing with uncertainties in the application of complex tax regulations. In accordance with the authoritative guidance on accounting for uncertainty in income taxes, we recognize liabilities for uncertain tax positions based on the two-step process. The first step is to evaluate the tax position for recognition by determining if the weight of available evidence indicates that it is more likely than not that the position will be sustained in audit, including resolution of related appeals or litigation processes, if any. The second step is to measure the tax benefit as the largest amount that is more than fifty-percent likely of being realized upon ultimate settlement. We reevaluate these uncertain tax positions on a quarterly basis. This evaluation is based on factors including changes in facts or circumstances, changes in tax law, effectively settled issues under audit and new audit activity. Any change in these factors could result in the recognition of a tax benefit or an additional charge to the tax provision.
Interest and penalties related to uncertain tax positions are recorded in the provision for income tax expense on the consolidated statements of operations.
Foreign Currency Translation
Our consolidated financial statements are presented in U.S. dollars, which is our reporting currency, while the functional currency of our subsidiaries in the PRC is RMB. Transactions in foreign currencies are initially recorded at the functional currency rate prevailing at the date of the transactions. Any difference between the initially recorded amount and the settlement amount is recorded as a gain or loss on foreign currency transaction in our consolidated statements of operations. Monetary assets and liabilities denominated in a foreign currency are translated at the functional currency rate of exchange as of the date of a consolidated balance sheet. Any difference is recorded as a gain or loss on foreign currency translation in the appropriate consolidated statement of operations. In accordance with the FASB’s ASC Topic 830, Foreign Currency Matters, we translate the assets and liabilities into U.S. dollars from RMB using the rate of exchange prevailing at the applicable balance sheet date and the consolidated statements of operations and cash flows are translated at an average rate during the reporting period. Adjustments resulting from the translation are recorded in stockholders’ equity as part of accumulated other comprehensive income.
The PRC government imposes significant exchange restrictions on fund transfers out of the PRC that are not related to business operations. To date these restrictions have not had a material impact on us because we have not engaged in any significant transactions that are subject to the restrictions.
Warranty
We have provided warranty coverage on our tools for 12 to 36 months, covering labor and parts necessary to repair a tool during the warranty period. We account for the estimated warranty cost as sales and marketing expense at the time revenue is recognized. Warranty obligations are affected by historical failure rates and associated replacement costs. Utilizing historical warranty cost records, we calculate a rate of warranty expenses to revenue to determine the estimated warranty charge. We update these estimated charges on a regular basis. The actual product performance and field expense profiles may differ, and in those cases we adjust our warranty accruals accordingly.
Recent Accounting Pronouncements
The following description summarizes recent accounting pronouncements that we have adopted or will be required to adopt in the future.
72
Table of Contents
In July 2017 the FASB issued Accounting Standards Update (“ASU”) ASU No. 2017-11, Earnings Per Share (Topic 260); Distinguishing Liabilities from Equity (Topic 480); Derivatives and Hedging (Topic 815): (Part I) Accounting for Certain Financial Instruments with Down Round Features, (Part II) Replacement of the Indefinite Deferral for Mandatorily Redeemable Financial Instruments of Certain Nonpublic Entities and Certain Mandatorily Redeemable Noncontrolling Interests with a Scope Exception, which addresses the complexity of accounting for certain financial instruments with down round features. Down round features are features of certain equity-linked instruments (or embedded features) that result in the strike price being reduced on the basis of the pricing of future equity offerings. Current accounting guidance creates cost and complexity for entities that issue financial instruments (such as warrants and convertible instruments) with down round features that require fair value measurement of the entire instrument or conversion option. For public business entities, the amendments in Part I of this update are effective for fiscal years, and interim periods within those fiscal years, beginning after December 15, 2018. For all other entities, the amendments in Part I of this update are effective for fiscal years beginning after December 15, 2019, and interim periods within fiscal years beginning after December 15, 2020. We are currently evaluating the impact of adoption of ASU 2017-11.
In May 2017 the FASB issued ASU No. 2017-09, Compensation – Stock Compensation (Topic 718): Scope of Modification Accounting, which provides guidance on determining which changes to the terms or conditions of share-based payment awards require an entity to apply modification accounting under Topic 718. The amendments in this ASU are effective for all entities for annual periods, and interim periods within those annual periods, beginning after December 15, 2017. Early adoption is permitted, including adoption in any interim period, for (a) public business entities for reporting periods for which financial statements have not yet been issued and (b) all other entities for reporting periods for which financial statements have not yet been made available for issuance. The amendments in this ASU should be applied prospectively to an award modified on or after the adoption date. We do not expect the adoption of ASU No. 2017-09 to have a material impact on our consolidated financial statements.
In February 2017 the FASB issued ASU No. 2017-05, Other Income —Gains and Losses from the Derecognition of Nonfinancial Assets (Subtopic 610-20): Clarifying the Scope of Asset Derecognition Guidance and Accounting for Partial Sales of Nonfinancial Assets, which clarifies the scope of nonfinancial asset guidance in Subtopic 610-20. This ASU also clarifies that derecognition of all businesses and nonprofit activities (except those related to conveyances of oil and gas mineral rights or contracts with customers) should be accounted for in accordance with the derecognition and deconsolidation guidance in Subtopic 810-10. The amendments in this ASU also provide guidance on the accounting for so-called “partial sales” of nonfinancial assets within the scope of Subtopic 610-20 and contributions of nonfinancial assets to a joint venture or other noncontrolled investee. The amendments in this ASU are effective for annual reporting reports beginning after December 15, 2017, including interim reporting periods within that reporting period. We do not expect the adoption of ASU No. 2017-05 to have a material impact on our consolidated financial statements.
In January 2017 the FASB issued ASU No. 2017-04, Intangibles – Goodwill and Other (Topic 350): Simplifying the Test for Goodwill Impairment, which removes Step 2 from the goodwill impairment test. An entity will apply a one-step quantitative test and record the amount of goodwill impairment as the excess of a reporting unit’s carrying amount over its fair value, not to exceed the total amount of goodwill allocated to the reporting unit. The new guidance does not amend the optional qualitative assessment of goodwill impairment. A business entity that is a U.S. Securities and Exchange Commission filer must adopt the amendments in this ASU for its annual or any interim goodwill impairment test in fiscal years beginning after December 15, 2019. Early adoption is permitted for interim or annual goodwill impairment tests performed on testing dates after January 1, 2017. We do not expect the adoption of ASU No. 2016-18 to have a material impact on our consolidated financial statements.
In November 2016 the FASB issued ASU No. 2016-18, Statement of Cash Flows (Topic 230): Restricted Cash, which requires that a statement of cash flows explain the change during the period in the total of cash, cash equivalents, and amounts generally described as restricted cash or restricted cash equivalents. Therefore, amounts generally described as restricted cash and restricted cash equivalents should be included with cash and cash
73
Table of Contents
equivalents when reconciling the beginning-of-period and end-of-period total amounts shown on the statement of cash flows. The amendments in this ASU do not provide a definition of restricted cash or restricted cash equivalents. The amendments in this ASU are effective for public business entities for fiscal years beginning after December 15, 2017, and interim periods within those fiscal years. Early adoption is permitted, including adoption in an interim period. We are currently evaluating the impact of the adoption of ASU No. 2016-18 on our consolidated financial statements.
In August 2016 the FASB issued Accounting Standards Update, or ASU, No. 2016-15, Statement of Cash Flows (Topic 230): Classification of Certain Cash Receipts and Cash Payments, which addresses the following cash flow issues: (a) debt prepayment or debt extinguishment costs; (b) settlement of zero-coupon debt instruments or other debt instruments with coupon interest rates that are insignificant in relation to the effective interest rate of the borrowing; (c) contingent consideration payments made after a business combination; (d) proceeds from the settlement of insurance claims; (e) proceeds from the settlement of corporate-owned life insurance policies, including bank-owned life insurance policies; (f) distributions received from equity method investees; (g) beneficial interests in securitization transactions; and (h) separately identifiable cash flows and application of the predominance principle. The amendments in this ASU are effective for public business entities for fiscal years beginning after December 15, 2017 and interim periods within those fiscal years and are effective for all other entities for fiscal years beginning after December 15, 2018 and interim periods within fiscal years beginning after December 15, 2019. Early adoption is permitted, including adoption in an interim period. We are currently evaluating the impact of the adoption of ASU No. 2016-15 on our consolidated financial statements.
In April 2016 the FASB issued ASU No. 2016-09, Compensation—Stock Compensation (Topic 718): Improvements to Employee Share-Based Payment Accounting, which simplifies several aspects of the accounting for employee stock-based payment transactions. The areas for simplification in ASU No. 2016-09 include the income tax consequences, classification of awards as either equity or liabilities, and classification on the statement of cash flows. The amendments in this ASU will be effective for annual periods beginning after December 15, 2016 and interim periods within those annual periods. The adoption of ASU No. 2016-09 did not have a material impact on our consolidated financial statements.
In February 2016 the FASB issued ASU No. 2016-02, Leases (Topic 842). The amendments in this update create Topic 842, Leases, and supersede the leases requirements in Topic 840, Leases. Topic 842 specifies the accounting for leases. The objective of Topic 842 is to establish the principles that lessees and lessors shall apply to report useful information to users of financial statements about the amount, timing and uncertainty of cash flows arising from a lease. The main difference between Topic 842 and Topic 840 is the recognition of lease assets and lease liabilities for those leases classified as operating leases under Topic 840. Topic 842 retains a distinction between finance leases and operating leases. The classification criteria for distinguishing between finance leases and operating leases are substantially similar to the classification criteria for distinguishing between capital leases and operating leases in the previous leases guidance. The result of retaining a distinction between finance leases and operating leases is that under the lessee accounting model in Topic 842, the effect of leases in the statement of comprehensive income and the statement of cash flows is largely unchanged from previous GAAP. The amendments in ASU No. 2016-02 are effective for fiscal years beginning after December 15, 2018, including interim periods within those fiscal years for public business entities. Early application of the amendments in ASU No. 2016-02 is permitted. We are currently evaluating the impact of the adoption of ASU No. 2016-02 on our consolidated financial statements.
In November 2015 the FASB issued ASU No. 2015-17, Income Taxes (Topic 740): Balance Sheet Classification of Deferred Taxes. Topic 740, Income Taxes, requires an entity to separate deferred income tax liabilities and assets into current and noncurrent amounts in a classified statement of financial position. Deferred tax liabilities and assets are classified as current or noncurrent based on the classification of the related asset or liability for financial reporting. Deferred tax liabilities and assets that are not related to an asset or liability for financial reporting are classified according to the expected reversal date of the temporary difference. To simplify the presentation of deferred income taxes, the amendments in ASU No. 2015-17 require that deferred income tax
74
Table of Contents
liabilities and assets be classified as noncurrent in a classified statement of financial position. For public business entities, the amendments in this update are effective for financial statements issued for annual periods beginning after December 15, 2016, and interim periods within those annual periods. The adoption of ASU No. 2015-17 did not have a material impact on our consolidated financial statements.
In July 2015 the FASB issued ASU No. 2015-11, Inventory (Topic 330): Simplifying the Measurement of Inventory. The amendments in this update require an entity to measure inventory within the scope of ASU No. 2015-11 (the amendments in ASU No. 2015-11 do not apply to inventory that is measured using last-in, first-out or the retail inventory method. The amendments apply to all other inventory, which includes inventory that is measured using first-in, first-out or average cost) at the lower of cost and net realizable value. Net realizable value is the estimated selling prices in the ordinary course of business, less reasonably predictable costs of completion, disposal and transportation. Subsequent measurement is uncharged for inventory measured using last-in, first-out or the retail inventory method. The amendments in ASU No. 2015-11 more closely align the measurement of inventory in GAAP with the measurement of inventory in International Financial Reporting Standards. ASU No. 2015-11 is effective for public business entities for fiscal years beginning after December 15, 2016, including interim periods within those fiscal years. The amendments in ASU No. 2015-11 should be applied prospectively with earlier application permitted as of the beginning of an interim or annual reporting period. The adoption of ASU No. 2015-11 did not have a material impact on our consolidated financial statements. The relevant descriptions have been included in the inventory accounting policy.
In August 2014, the FASB issued ASU No. 2014-15, Presentation of Financial Statements—Going Concern. The amendments in this update require management to evaluate whether there are conditions and events that raise substantial doubt about an entity’s ability to continue as a going concern for both annual and interim reporting. The guidance is effective for us for the annual period ended after December 15, 2016 and interim periods thereafter. Management performed an evaluation of the our ability to fund operations and to continue as a going concern according to ASC Topic 205-40, Presentation of Financial Statements—Going Concern. The adoption of ASU No. 2014-15 did not have a material impact on our consolidated financial statements.
In May 2014 the FASB issued ASU No. 2014-09, Revenue from Contracts with Customers (Topic 606), which ASU No. 2014-09 supersedes the revenue recognition requirements in Revenue Recognition (Topic 605) and requires entities to recognize revenue when it transfers promised goods or services to customers in an amount that reflects the consideration to which the entity expects to be entitled in exchange for those goods or services. The FASB issued ASU No. 2015-14, Revenue from Contracts with Customers (Topic 606): Deferral of the Effective Date, in August 2015. The amendments in ASU No. 2015-14 defer the effective date of ASU No. 2014-09. Public business entities, certain not-for-profit entities and certain employee benefit plans should apply the guidance in ASU No. 2014-09 to annual reporting periods beginning after December 15, 2017, including interim reporting periods within that reporting period. Earlier adoption is permitted only as of annual reporting periods beginning after December 15, 2016, including interim reporting periods within that reporting period. Further to ASU No. 2014-09 and ASU No. 2015-14, the FASB issued ASU No. 2016-08, Revenue from Contracts with Customers (Topic 606): Principal versus Agent Considerations (Reporting Revenue Gross versus Net), in March 2016, ASU No. 2016-10, Revenue from Contracts with Customers (Topic 606): Identifying Performance Obligations and Licensing in April 2016, ASU No. 2016-12, Revenue from Contracts with Customers (Topic 606): Narrow-Scope Improvements and Practical Expedients, and ASU No. 2016-20, Technical Corrections and Improvements to Topic 606, Revenue from Contracts with Customers, respectively. The amendments in ASU No. 2016-08 clarify the implementation guidance on principal versus agent considerations, including indicators to assist an entity in determining whether it controls a specified good or service before it is transferred to the customers. ASU No. 2016-10 clarifies guideline related to identifying performance obligations and licensing implementation guidance contained in the new revenue recognition standard. The updates in ASU No. 2016-10 include targeted improvements based on input the FASB received from the Transition Resource Group for Revenue Recognition and other stakeholders. It seeks to proactively address areas in which diversity in practice potentially could arise, as well as to reduce the cost and complexity
75
Table of Contents
of applying certain aspects of the guidance both at implementation and on an ongoing basis. ASU No. 2016-12 addresses narrow-scope improvements to the guidance on collectability, non-cash consideration and completed contracts at transition. Additionally, the amendments in this ASU provide a practical expedient for contract modifications at transition and an accounting policy election related to the presentation of sales taxes and other similar taxes collected from customers. The amendments in ASU No. 2016-20 represent changes to make minor corrections or minor improvements to the ASC that are not expected to have a significant effect on current accounting practice or create a significant administrative cost to most entities. The effective date and transition requirements for ASU No. 2016-08, ASU No. 2016-10, ASU No. 2016-12 and ASU No. 2016-20 are the same as ASU No. 2014-09. We will adopt ASU No. 2014-09, ASU No. 2016-08, ASU No. 2016-10, ASU No. 2016-12 and ASU No. 2016-20 at January 1, 2018 if this offering is completed by December 31, 2017. We are currently in the process of assessing the potential effects of these ASUs on our consolidated financial statements, business processes, systems and controls. While the assessment process is ongoing, we anticipate adopting ASC Topic 606, Revenue from Contracts with Customers, using the modified retrospective transition approach. Under this approach, ASC Topic 606 would apply to all new contracts initiated on or after January 1, 2018. For existing contracts that have remaining obligations as of January 1, 2018, any difference between the recognition criteria in these ASUs and our current revenue recognition practices would be recognized using a cumulative effect adjustment to the opening balance of accumulated deficit. We do not expect the adoption of these ASUs to have a material impact on our consolidated financial statements.
Results of Operations
The following table sets forth our results of operations for the periods presented, as percentages of revenue.
| Six Months Ended June 30, |
Year Ended December 31, |
|||||||||||||||
| 2017 | 2016 | 2016 | 2015 | |||||||||||||
| (percentage of revenue) | ||||||||||||||||
| Revenue |
100.0 | % | 100.0 | % | 100.0 | % | 100.0 | % | ||||||||
| Cost of revenue |
59.4 | 65.2 | 51.3 | 54.7 | ||||||||||||
|
|
|
|
|
|
|
|
|
|||||||||
| Gross margin |
40.6 | 34.8 | 48.7 | 45.3 | ||||||||||||
|
|
|
|
|
|
|
|
|
|||||||||
| Operating expenses: |
||||||||||||||||
| Sales and marketing |
17.9 | 22.4 | 14.3 | 13.5 | ||||||||||||
| Research and development |
13.0 | 18.3 | 11.9 | 9.4 | ||||||||||||
| General and administrative |
21.9 | 13.4 | 9.7 | 6.8 | ||||||||||||
|
|
|
|
|
|
|
|
|
|||||||||
| Total operating expenses, net |
52.8 | 54.1 | 35.9 | 29.7 | ||||||||||||
|
|
|
|
|
|
|
|
|
|||||||||
| Income (loss) from operations |
(12.2 | ) | (19.3 | ) | 12.8 | 15.6 | ||||||||||
| Interest expense, net |
(1.1 | ) | (0.6 | ) | (0.6 | ) | (0.3 | ) | ||||||||
| Other income (expense), net |
(2.0 | ) | 6.2 | (1.3 | ) | 2.0 | ||||||||||
|
|
|
|
|
|
|
|
|
|||||||||
| Income (loss) before income taxes |
(15.3 | ) | (13.7 | ) | 10.9 | 17.3 | ||||||||||
| Income tax (expense) benefit |
(5.2 | ) | 0.9 | (2.2 | ) | 8.1 | ||||||||||
|
|
|
|
|
|
|
|
|
|||||||||
| Net income (loss) |
(20.5 | ) | (12.8 | ) | 8.7 | 25.4 | ||||||||||
| Less: Net income (loss) attributable to non-controlling interests |
(1.4 | ) | (5.9 | ) | 4.9 | 8.2 | ||||||||||
|
|
|
|
|
|
|
|
|
|||||||||
| Net income (loss) attributable to ACM Research, Inc. |
(19.1 | )% | (6.9 | )% | 3.8 | % | 17.2 | % | ||||||||
|
|
|
|
|
|
|
|
|
|||||||||
76
Table of Contents
Comparison of Six Months Ended June 30, 2017 and 2016
Revenue
| Six Months Ended June 30, |
% Change | |||||||||||
| 2017 | 2016 | 2016 v 2017 | ||||||||||
| (in thousands) | ||||||||||||
| Revenue |
$ | 14,423 | $ | 8,122 | 77.6 | % | ||||||
The increase in revenue of $6.3 million in the six months ended June 30, 2017 reflected increases in revenue from single-wafer cleaning equipment of $5.0 million and from advanced packaging equipment of $1.1 million. Our revenue in the six months ended June 30, 2017 compared to the corresponding period of 2016 reflected sales of $4.5 million to two new customers and an increase of $1.8 million in sales to existing customers.
Cost of Revenue and Gross Margin
| Six Months Ended June 30, |
% Change | |||||||||||
| 2017 | 2016 | 2016 v 2017 | ||||||||||
| (in thousands) | ||||||||||||
| Cost of revenue |
$ | 8,570 | $ | 5,292 | 61.9 | % | ||||||
| Gross profit |
$ | 5,853 | $ | 2,830 | 106.8 | |||||||
| Gross margin |
40.6 | % | 34.8 | % | 16.5 | |||||||
Cost of revenue increased $3.3 million, and gross profit increased $3.0 million, from the six months ended June 30, 2016 to the comparable period in 2017, reflecting the growth in sales. Gross margin increased 5.8%, primarily due to sales of relatively lower-margin tools to new customers during the six months ended June 30, 2016.
Operating Expenses
| Six Months Ended June 30, |
% Change | |||||||||||
| 2017 | 2016 | 2016 v 2017 | ||||||||||
| (in thousands) | ||||||||||||
| Sales and marketing expense |
$ | 2,583 | $ | 1,818 | 42.1 | % | ||||||
| Research and development expense |
1,867 | 1,486 | 25.6 | |||||||||
| General and administrative expense |
3,158 | 1,089 | 190.0 | |||||||||
|
|
|
|
|
|||||||||
| Total operating expenses, net |
$ | 7,608 | $ | 4,393 | 73.2 | % | ||||||
|
|
|
|
|
|||||||||
Sales and marketing expense increased $765,000 in the six months ended June 30, 2017 as compared to the corresponding period in 2016, primarily due to an increase in employee salaries and sales services.
Research and development expense increased $381,000 in the six months ended June 30, 2017 as compared to the corresponding period in 2016, principally as a result of increases of in employee salaries and research and development parts. Research and development expense represented 12.9% and 18.3% of our revenue in the six months ended June 30, 2017 and 2016, respectively. Without reduction by grant amounts received from PRC governmental authorities (see “—Key Components of Results of Operations—PRC Government Research and Development Funding”), gross research and development expense totaled $5.0 million, or 34.8% of revenue, in the six months ended June 30, 2017 and $3.5 million, or 42.6% of revenue, in the six months ended June 30, 2016.
77
Table of Contents
General and administrative expense increased $2.1 million in the six months ended June 30, 2017 as compared to the corresponding period in 2016, principally resulting from preparations to become a public company. These costs reflected increases of $1.1 million in stock compensation expense, $511,000 in professional fees, $90,000 in consulting fees, $80,000 in personnel costs and $75,000 in tax expense.
Other Income and Expenses
| Six Months Ended June 30, |
% Change | |||||||||||
| 2017 | 2016 | 2016 v 2017 | ||||||||||
| (in thousands) | ||||||||||||
| Interest expense, net |
$ | (159 | ) | $ | (45 | ) | 253.3 | % | ||||
| Other income (expense), net |
(292 | ) | 506 | (157.7 | ) | |||||||
Interest expense consists of interest incurred from outstanding short-term borrowings and notes payable. Interest expense increased to $164,000 in the six months ended June 30, 2017 from $51,000 in the six months ended June 30, 2016, principally as a result of increased borrowings under short-term bank loans. We earn interest income from depositary accounts. Interest income was nominal in the six months ended June 30, 2017 and 2016.
Other income, net primarily reflects (a) gains or losses recognized from the effect of exchange rates on our foreign currency-denominated asset and liability balances, (b) depreciation of assets acquired with government subsidies, as described under “—Key Components of Results of Operations—PRC Government Research and Development Funding” above, and (c) losses we recognized upon dispositions of fixed assets.
Income Tax (Expense) Benefit
The following presents components of income tax (expense) benefit for the indicated periods:
| Six Months Ended June 30, |
||||||||
| 2017 | 2016 | |||||||
| (in thousands) | ||||||||
| Current: |
||||||||
| U.S. federal |
$ | — | $ | — | ||||
| U.S. state |
— | — | ||||||
| Foreign |
— | — | ||||||
|
|
|
|
|
|||||
| Total current income tax (expense) benefit |
— | — | ||||||
|
|
|
|
|
|||||
| Deferred: |
||||||||
| U.S. federal |
— | — | ||||||
| U.S. state |
— | — | ||||||
| Foreign |
(749 | ) | 73 | |||||
|
|
|
|
|
|||||
| Total deferred income tax (expense) benefit |
(749 | ) | 73 | |||||
|
|
|
|
|
|||||
| Total income tax (expense) benefit |
$ | (749 | ) | $ | 73 | |||
|
|
|
|
|
|||||
Our effective tax rate differs from statutory rates of 34% for U.S. federal income tax purposes and 15% to 25% for Chinese income tax purpose due to the effects of the valuation allowance and certain permanent differences as it pertains to book-tax differences in the value of client equity securities received for services. Our two PRC subsidiaries, ACM Shanghai and ACM Wuxi, are liable for PRC corporate income taxes at the rates of 15% and 25%, respectively. Pursuant to the Corporate Income Tax Law of the PRC, our PRC subsidiaries generally would be liable for PRC corporate income taxes as a rate of 25%. According to Guoshuihan 2009 No. 203, an entity certified as an “advanced and new technology enterprise” is entitled to a preferential income
78
Table of Contents
tax rate of 15%. ACM Shanghai was certified as an “advanced and new technology enterprise” in 2012 and again in 2016, with an effective period of three years.
We file income tax returns in the United States and state and foreign jurisdictions. Those federal, state and foreign income tax returns are under the statute of limitations subject to tax examinations for 2009 through 2016. To the extent we have tax attribute carryforwards, the tax years in which the attribute was generated may still be adjusted upon examination by the Internal Revenue Service or state or foreign tax authorities to the extent utilized in a future period.
We intend to reinvest indefinitely our PRC earnings as of June 30, 2017 outside of the United States, and we therefore have not provided for taxes with respect to the remissions of such earnings from the PRC to the United States.
Comparison of Years Ended 2016 and 2015
Revenue
| Year Ended December 31, |
% Change | |||||||||||
| 2016 | 2015 | 2015 v 2016 | ||||||||||
| (in thousands) | ||||||||||||
| Revenue |
$ | 27,371 | $ | 31,206 | (12.3 | )% | ||||||
The decrease in revenue in 2016 from 2015 reflected a decline in revenue from single-wafer wet cleaning equipment of $5.4 million, offset in part by a $1.5 million increase in revenue from advanced packaging equipment. Our revenue in 2016 compared to 2015 reflected a $20.2 million reduction in sales, from $26.8 million in 2015 to $6.6 million in 2016, to our largest customer in 2015, offset in part by (a) a $1.3 million increase from 2015 to 2016 in purchases by our second largest customer in 2015 and (b) $16.1 million in revenue in 2016 from initial purchases of our single-wafer wet cleaning equipment by two PRC foundries. Chip fabricators typically purchase types of tools in phases based on multi-year capital plans, and their purchases of specific types of tools therefore vary from year to year. We believe the decline in sales to our largest customer from 2015 to 2016 reflected the customer’s multi-year capital plan.
Cost of Revenue and Gross Margin
| Year Ended December 31, |
% of Change | |||||||||||
| 2016 | 2015 | 2015 v 2016 | ||||||||||
| (in thousands) | ||||||||||||
| Cost of revenue |
$ | 14,042 | $ | 17,085 | (17.8 | )% | ||||||
| Gross profit |
$ | 13,329 | $ | 14,121 | (5.6 | ) | ||||||
| Gross margin |
48.7 | % | 45.3 | % | 7.6 | % | ||||||
Cost of revenue decreased $3.0 million in 2016 from 2015, primarily due to decreases in component costs related to lower volume Gross margin increased 3.4%, reflecting a relative increase in sales of higher-margin products.
79
Table of Contents
Operating Expenses
| Year Ended December 31, |
% Change | |||||||||||
| 2016 | 2015 | 2015 v 2016 | ||||||||||
| (in thousands) | ||||||||||||
| Sales and marketing expense |
$ | 3,907 | $ | 4,213 | (7.3 | )% | ||||||
| Research and development expense |
3,259 | 2,942 | 10.8 | |||||||||
| General and administrative expense |
2,673 | 2,103 | 27.1 | |||||||||
|
|
|
|
|
|||||||||
| Total operating expenses, net |
$ | 9,839 | $ | 9,258 | 6.3 | |||||||
|
|
|
|
|
|||||||||
Sales and marketing expense decreased $306,000 in 2016 compared to 2015, primarily due to a decrease of $520,000 in sales commissions reflecting our lower level of sales in 2016, offset in part by a $385,000 increase in consulting fees.
Research and development expense increased $317,000 in 2016 from 2015, principally as a result of increases of $147,000 in personnel costs, $104,000 in material consumption expense and $57,000 in travel expense. Research and development expense represented 11.9% of revenue in 2016 and 9.4% of revenue in 2015. Without reduction by grant amounts received from PRC governmental authorities (see “—Key Components of Results of Operations—PRC Government Research and Development Funding”), gross research and development expense totaled $7.5 million, or 27.4% of revenue, in 2016 and $6.6 million, or 21.1% of revenue, in 2015.
General and administrative expense increased $571,000 in 2016 compared to 2015, principally resulting from preparations to become a public company. These costs reflected increases of $321,000 in professional fees, $84,000 in personnel costs and $77,000 in travel expense.
Other Income and Expenses
| Year Ended December 31, |
% Change | |||||||||||
| 2016 | 2015 | 2015 v 2016 | ||||||||||
| (in thousands) | ||||||||||||
| Interest expense, net |
$ | (165 | ) | $ | (105 | ) | 57.1 | % | ||||
| Other income, net |
(343 | ) | 632 | (154.3 | ) | |||||||
Interest expense consists of interest incurred from outstanding short-term borrowings and notes payable. Interest expense increased to $181,000 in 2016 from $122,000 in 2015, principally as a result of increased borrowings under short-term bank loans. We earn interest income from depositary accounts. Interest income totaled $16,000 in 2016 and $17,000 in 2015.
80
Table of Contents
Income Tax Benefit (Expense)
The following presents components of income tax benefit (expense) for the indicated periods:
| Year Ended December 31, |
||||||||
| 2016 | 2015 | |||||||
| (in thousands) | ||||||||
| Current: |
||||||||
| U.S. federal |
$ | — | (40 | ) | ||||
| U.S. state |
(1 | ) | 30 | |||||
| Foreign |
— | — | ||||||
|
|
|
|
|
|||||
| Total current income tax benefit (expense) |
(1 | ) | (10 | ) | ||||
|
|
|
|
|
|||||
| Deferred: |
||||||||
| U.S. federal |
— | — | ||||||
| U.S. state |
— | — | ||||||
| Foreign |
(594 | ) | 2,535 | |||||
|
|
|
|
|
|||||
| Total deferred income tax benefit |
(594 | ) | 2,535 | |||||
|
|
|
|
|
|||||
| Total income tax benefit |
$ | (595 | ) | $ | 2,525 | |||
|
|
|
|
|
|||||
Our effective tax rate differs from statutory rates of 34% for U.S. federal income tax purposes and 15% to 25% for PRC income tax purposes, due to the effects of the valuation allowance and permanent book-tax differences pertaining to the value of client equity securities received for services.
Liquidity and Capital Resources
Initially we funded our operations principally through issuances of four series of convertible preferred stock from our formation in 1998 through 2001 and issuances of convertible and term promissory notes in 2003 and 2004. We issued additional convertible and term promissory notes in 2005 and 2006 in anticipation of moving our operational center to Shanghai in 2006, and following that transition, our new subsidiary ACM Shanghai initially raised funds through sales of its non-controlling equity interests in 2007. Since 2008 we have funded our technology development and operations through:
| • | issuances of two additional series of convertible preferred stock in 2016 and the third quarter of 2017; |
| • | an investment deposit in 2016 made in connection with issuance of a Class A common stock warrant in March 2017; |
| • | additional issuances of ACM Shanghai equity interests in 2008 and 2009; |
| • | subsidies received from PRC governmental authorities pursuant to grants made in 2008, 2009 and 2014; |
| • | short-term borrowings by ACM Shanghai from local financial institutions in 2009 and each year since 2011; |
| • | additional issuances of term promissory notes in 2013, 2014 and 2015; and |
| • | operating cash flow in 2015 and the first half of 2017. |
We believe our existing cash and cash equivalents, our cash flow from operating activities, short-term bank borrowings by ACM Shanghai and our net proceeds of this offering and the concurrent private placement will be sufficient to meet our anticipated cash needs for at least the next twelve months. We do not expect that our anticipated cash needs for the next twelve months will require our receipt of any PRC government subsidies. Our future working capital needs will depend on many factors, including the rate of our business and revenue growth,
81
Table of Contents
the payment schedules of our customers, and the timing of investment in our research and development as well as sales and marketing. To the extent our cash and cash equivalents, cash flow from operating activities, short-term bank borrowings and net proceeds of this offering are insufficient to fund our future activities, we may need to raise additional funds through bank credit arrangements or public or private debt or equity financings. We also may need to raise additional funds in the event we determine in the future to effect one or more acquisitions of businesses, technologies and products. If additional funding is required, we may not be able to obtain bank credit arrangements or to effect an equity or debt financing on terms acceptable to us or at all.
Sources of Funds
Equity and Equity-Related Securities
Since 1998 we have received gross proceeds of $41.9 million from sales of common stock, convertible preferred stock, convertible preferred notes and a warrant of ACM Research Inc. and sales of equity securities of ACM Shanghai, as described below.
Common Stock. From 1998 through September 30, 2017 we sold common stock to founders, investors and exercising option holders for gross proceeds of $2.7 million.
Convertible Preferred Stock. We have sold convertible preferred stock to investors for gross proceeds of $23.7 million, as follows:
| Year Issued |
Convertible Preferred Stock |
Gross Proceeds |
||||||
| (in thousands) | ||||||||
| 1998 | Series A | $ | 288 | |||||
| 1998 | Series B | 1,572 | ||||||
| 1999 | Series C | 2,041 | ||||||
| 2001 | Series D | 4,975 | ||||||
| 2016 | Series F | 9,040 | ||||||
| 2017 | Series E | 5,800 | ||||||
|
|
|
|||||||
| $ | 23,716 | |||||||
|
|
|
|||||||
Convertible Promissory Notes. In the years following our issuance of Series D convertible preferred stock in 2001, we borrowed an aggregate of $1.6 million pursuant to promissory “bridge” notes that bore interest at the rate of 6% per annum and subsequently converted into equity securities.
| Year Issued |
Gross Proceeds |
|||
| (in thousands) | ||||
| 2003 | $ | 444 | ||
| 2004 | 292 | |||
| 2005 | 200 | |||
| 2006 | 616 | |||
|
|
|
|||
| $ | 1,552 | |||
|
|
|
|||
The convertible promissory notes were issued with common stock warrants, all of which expired unexercised. Upon the closing of our issuance of Series F convertible preferred stock in December 2016, the outstanding convertible promissory notes converted into 47,454 shares of Series F convertible preferred stock and 1,812,069 shares of Class A common stock.
82
Table of Contents
ACM Shanghai Equity. Three investors have paid a total of $11.0 million to purchase from ACM Shanghai equity interests currently representing 37.1% of ACM Shanghai’s outstanding equity.
| Year Issued |
Gross Proceeds | |||
| (in thousands) | ||||
| 2007 | $ | 5,252 | ||
| 2008 | 2,358 | |||
| 2009 | 3,365 | |||
|
|
|
|||
| $ | 10,975 | |||
|
|
|
|||
We have entered into agreements with the three minority investors pursuant to which ACM Research will acquire, before the closing of this offering, all of the minority equity interests in ACM Shanghai, as described under “—Recent Equity Transactions—Acquisitions of Outstanding Minority Interests in Our Operating Company.”
Warrant. In December 2016 SMC delivered to ACM Shanghai 20,123,500 RMB (approximately $3.0 million as of the date of funding) in cash for potential investment pursuant to terms to be subsequently negotiated. In March 2017 we issued to SMC a warrant exercisable to purchase 397,502 shares of Class A common stock at a price of $7.50 per share, for a total exercise price of approximately $3.0 million. ACM Shanghai may become obligated to repay to SMC an amount equal to approximately $3.0 million in the circumstances described under “—Recent Equity Transactions—Issuance of Warrant.”
Indebtedness
Promissory Notes. From 2003 through 2014 we borrowed an aggregate of $888,000 pursuant to non-convertible term notes as well as from convertible promissory notes that were repaid in cash. All of these notes bore interest at a rate of 6% per annum.
| Date Issued |
Gross Proceeds | |||
| (in thousands) | ||||
| 2003 | $ | 98 | ||
| 2004 | 162 | |||
| 2006 | 468 | |||
| 2013 | 100 | |||
| 2014 | 60 | |||
|
|
|
|||
| $ | 888 | |||
|
|
|
|||
ACM Shanghai Short-Term Loan Facilities. ACM Shanghai is a party to lines of credit with three banks, as follows:
| Lender |
Agreement Date |
Maturity Date | Annual Interest Rate |
Maximum Borrowing Amount(1) |
Amount Outstanding(1) |
|||||||||||||||
| Bank of China Pudong Branch |
August 2017 | March 2018 | 5.69 | % | RMB30,000 | RMB14,500 | ||||||||||||||
| $4,521 | $2,185 | |||||||||||||||||||
| Bank of Shanghai Pudong Branch |
August 2017 | September 2018 | 5.66 | RMB25,000 | RMB8,540 | |||||||||||||||
| $3,768 | $1,287 | |||||||||||||||||||
| Shanghai Rural Commercial Bank |
September 2017 | September 2018 | 5.44-5.66 | RMB5,000 | ||||||||||||||||
| $754 | — | |||||||||||||||||||
|
|
|
|
|
|||||||||||||||||
| RMB60,000 | RMB23,040 | |||||||||||||||||||
| $9,043 | $3,472 | |||||||||||||||||||
|
|
|
|
|
|||||||||||||||||
| (1) | Converted to dollars as of September 30, 2017 |
83
Table of Contents
All of the amounts owing under the line of credit with Bank of China Pudong Branch are secured by ACM Shanghai’s intellectual property. All of the amounts owing under the lines of credit with Bank of Shanghai Pudong Branch and Shanghai Rural Commercial Bank are guaranteed by David Wang, our Chair of the Board, Chief Executive Officer and President.
Cash Flow from Operating Activities
As we initiated and grew our business from our inception in 1998 through 2014, in 2016 and in the first half of 2017, our operating activities used cash flow. Our operations provided cash flow of $2.7 million in 2015, and used cash flow of $3.7 million in 2016 and provided cash flow of $3.0 million in the first half of 2017. Our cash flow from operating activities is influenced by (a) the amount of cash we invest in personnel and technology development to support anticipated future growth in our business, (b) increases in the number of customers using our products and services, and (c) the amount and timing of payments by customers.
Government Research and Development Grants
As described under “—Key Components of Results of Operations—PRC Government Research and Development Funding,” ACM Shanghai has received research and development grants from local and central PRC governmental authorities.
| Award Date |
Grant Amount | |||
| (in thousands) | ||||
| 2007-2010 |
$ | 4,288 | ||
| 2011 |
6,334 | |||
| 2012 |
3,278 | |||
| 2013 |
2,442 | |||
| 2014 |
6,256 | |||
| 2015 |
6,579 | |||
| 2016 |
6,620 | |||
| 2017 (through September 30) |
2,387 | |||
|
|
|
|||
| $ | 38,184 | |||
|
|
|
|||
Not all grant amounts are received in the year in which a grant is awarded. As of September 30, 2017, ACM Shanghai expected to receive an additional $2.9 million in the future. We currently estimate ACM Shanghai will receive between $1.6 and $2.7 million in 2017, $2.4 million of which had been received as of September 30, 2017. Because of the nature and terms of the grants, the amounts and timing of payments under the grants are difficult to predict and vary from period to period. In addition, we expect to apply for additional grants when available in the future, but the grant application process can extend for a significant period of time and we cannot predict whether, or when, we will determine to apply for any such grants.
Working Capital
The following table sets forth selected working capital information:
| June 30, 2017 |
||||
| (in thousands) | ||||
| Cash and cash equivalents |
$ | 13,206 | ||
| Accounts receivable, less allowance for doubtful amounts |
12,310 | |||
| Inventory |
14,106 | |||
| Working capital |
23,433 | |||
84
Table of Contents
Our cash and cash equivalents at June 30, 2017 were unrestricted and held for working capital purposes. ACM Shanghai, our only direct PRC subsidiary, is, however, subject to PRC restrictions on distributions to equity holders. We currently intend for ACM Shanghai to retain all available funds any future earnings for use in the operation of its business and do not anticipate its paying any cash dividends. See “Dividend Policy.”
We have not entered into, and do not expect to enter into, investments for trading or speculative purposes.
Our accounts receivable balance fluctuates from period to period, which affects our cash flow from operating activities. Fluctuations vary depending on cash collections, client mix, and the timing of shipment and acceptance of our tools.
Uses of Funds
Capital Expenditures
Our capital expenditures totaled $795,000 in 2016. Substantially all of the capital expenditures were made to purchase equipment or improve infrastructure for our research and development and manufacturing facilities.
During 2017 we are continuing to invest in equipment and infrastructure improvements for our manufacturing and research and development facilities and, to a lesser extent, leasehold improvements for our administrative facilities. The extent of these investments may be affected by the pace with which we add new customers and obtain additional purchase orders. Our capital expenditures totaled $26,000 in the six months ended June 30, 2017. We are not currently party to any purchase contracts related to future capital expenditures.
Contractual Obligations and Requirements
The following table sets forth sets forth our commitments to settle contractual obligations as of December 31, 2016:
| Less than 1 Year |
1 to 3 Years |
3 to 5 Years |
More than 5 Years |
Total | ||||||||||||||||
| (in thousands) | ||||||||||||||||||||
| Operating leases: |
$ | 2,538 | $ | 8 | $ | — | $ | — | $ | 2,546 | ||||||||||
|
|
|
|
|
|
|
|
|
|
|
|||||||||||
Operating lease obligations with respect to office space consisted of amounts arising under lease agreements for our headquarters in Fremont, California, our operation center in Shanghai, PRC, and other small regional office locations. For additional information about these lease agreements, see “Business—Facilities.” The commitment amounts in the table above are associated with contracts that are enforceable and legally binding and that specify all significant terms, including fixed or minimum services to be used, fixed, minimum or variable price provisions, and the approximate timing of the actions under the contracts. The table does not include obligations under agreements that we can cancel without a significant penalty.
As of June 30, 2017, we did not have any relationships with unconsolidated entities or financial partnerships, including entities sometimes referred to as structured finance or special purpose entities, that were established for the purpose of facilitating off-balance sheet arrangements or other contractually narrow or limited purposes. We do not engage in trading activities involving non-exchange traded contracts. We therefore believe we are not materially exposed to any financing, liquidity, market or credit risk that could arise if we had engaged in these relationships.
Effects of Inflation
Inflation and changing prices have not had a material effect on our business, and we do not expect that they will materially affect our business in the foreseeable future. Any impact of inflation on cost of revenue and operating expenses, especially employee compensation costs, may not be readily recoverable in the price of our product offerings.
85
Table of Contents
Off-Balance Sheet Arrangements
As of June 30, 2017, we did not have any significant off-balance sheet arrangements, as defined in Item 303(a)(4)(ii) of Regulation S-K of the Securities and Exchange Commission.
Quantitative and Qualitative Disclosures about Market Risks
Market risk represents the risk of loss that may impact our financial position due to adverse changes in financial market prices and rates. Our market risk exposure is primarily the result of fluctuations in foreign exchange rates and interest rates. We do not hold or issue financial instruments for trading purposes.
Foreign Exchange Risk
Although our financial statements are denominated in U.S. dollars, a sizable portion of our revenues and costs are denominated in other currencies, primarily the Renminbi. The Renminbi is not freely convertible into foreign currencies for capital account transactions. The value of the Renminbi against the U.S. dollar and other currencies is affected by changes in the PRC’s political and economic conditions and by the PRC’s foreign exchange policies, among other things. In July 2005, the PRC government changed its decades-old policy of pegging the value of the Renminbi to the U.S. dollar, and the Renminbi appreciated more than 20% against the U.S. dollar over the following three years. Between July 2008 and June 2010, this appreciation subsided and the exchange rate between the Renminbi and the U.S. dollar remained within a narrow band. Since June 2010, the Renminbi has fluctuated against the U.S. dollar, at times significantly and unpredictably. It is difficult to predict how market forces or PRC or U.S. government policy may impact the exchange rate between the Renminbi and the U.S. dollar in the future.
To date, we have not entered into any hedging transactions in an effort to reduce our exposure to foreign currency exchange risk. To the extent that we need to convert U.S. dollars we received from this offering and the concurrent private placement into Renminbi for our operations or capital expenditures, appreciation of the Renminbi against the U.S. dollar would have an adverse effect on the Renminbi amount we would receive from the conversion. Conversely, if we decide to convert our Renminbi into U.S. dollars for the purpose of making payments for dividends on our Class A common stock or for other business purposes, appreciation of the U.S. dollar against the Renminbi would have a negative effect on the U.S. dollar amount available to us.
We estimate that we will receive net proceeds from this offering and the concurrent private placement of $23.9 million, if the underwriters do not exercise their over-allotment option, assuming an initial public offering price of $8.50 per share, the midpoint of the initial public offering price range reflected on the cover page of this prospectus, and after deducting estimated underwriting discounts and commissions, private placement fees, and offering expenses. Assuming that we convert the full amount of the net proceeds from this offering and the concurrent private placement into Renminbi, a 10% appreciation of the U.S. dollar against Renminbi, from a rate of RMB6.6369 to $1.00 to a rate of RMB6.0335 to $1.00, will result in an increase of RMB3.7 million in our estimated net proceeds from this offering and the concurrent private placement. Conversely, a 10% depreciation of the U.S. dollar against the Renminbi, from a rate of RMB6.6369 to $1.00 to a rate of RMB7.3743 to $1.00, will result in a decrease of RMB3.7 million in our estimated net proceeds from this offering and the concurrent private placement.
Interest Rate Risk
At June 30, 2017, we had unrestricted cash and cash equivalents totaling $13.2 million. These amounts were held for working capital purposes and were primarily in checking accounts of various banks. We believe we do not have any material exposure to changes in our cash balance as a result of changes in interest rates. Declines in interest rates, however, would reduce future interest income.
86
Table of Contents
Overview
We develop, manufacture and sell single-wafer wet cleaning equipment, which semiconductor manufacturers can use in numerous manufacturing steps to remove particles, contaminants and other random defects, and thereby improve product yield, in fabricating advanced integrated circuits, or chips. Our Ultra C equipment is designed to remove random defects from a wafer surface effectively, without damaging a wafer or its features, even at an increasingly advanced process node (the minimum line width on a chip) of 22 nanometers, or nm, or less. Our equipment is based on our innovative, proprietary Space Alternated Phase Shift, or SAPS, and Timely Energized Bubble Oscillation, or TEBO, technologies. We developed our proprietary technologies to enable manufacturers to produce chips that reach their ultimate physical limitations while maintaining product yield, which is the percentage of chips on a wafer that meet manufacturing specifications.
Since 2007 we have focused our development efforts on developing single-wafer wet cleaning equipment based on differentiated proprietary technology:
| • | Our SAPS technology, which we introduced in 2009, employs alternating phases of megasonic waves to deliver megasonic energy to flat and patterned wafer surfaces in a highly uniform manner on a microscopic level. We have shown SAPS technology to be more effective than conventional megasonic and jet spray technologies in removing random defects across an entire wafer as node sizes shrink from 300nm to 45nm, including node sizes, for which jet spray technology has proven to be ineffective. |
| • | Our TEBO technology, which we introduced in March 2016, has been developed to provide effective, damage-free cleaning for both conventional two-dimensional, or 2D, and three-dimensional, or 3D, patterned wafers at advanced process nodes. We have demonstrated the damage-free cleaning capabilities of TEBO technology on 3D patterned wafers for feature nodes as small as 16nm. |
As of September 30, 2017, we had been issued more than 140 patents in the United States, the People’s Republic of China or the PRC, Japan, Korea, Singapore and Taiwan.
We seek to market our single-wafer wet processing equipment by first establishing a referenceable base of leading logic and memory chip makers, whose use of our products can influence decisions by other manufacturers. Our SAPS technology employs alternating phases of megasonic waves to deliver megasonic energy to flat and patterned wafer surfaces in a highly uniform manner on a microscopic level. We believe this process is helping us penetrate the mature integrated circuit manufacturing markets and build credibility with industry leaders. Since beginning to place evaluation SAPS equipment with a small number of selected customers in 2009, we have worked on equipment improvements and qualification with those customers, who include a leading Korean memory chip company and four leading PRC memory and logic chip foundries. Using a similar “demo-to-sales” process, we have placed TEBO evaluation equipment with a leading PRC foundry and a leading Taiwanese foundry and we recognized revenue from our initial sale of TEBO equipment in 2016. Our revenue from the selected customers’ purchases of single-wafer wet cleaning equipment totaled $10.6 million, or 73.6% of our revenue, in the first half of 2017, $21.5 million, or 78.4% of our total revenue, in 2016 and $26.8 million, or 86.0% of our total revenue, in 2015.
In 2006 we established our operational center in Shanghai, and we currently conduct substantially all of our development and manufacturing activities in the PRC. Our Shanghai operations position us near potential customers in not only the PRC but also Taiwan, Korea and throughout Asia, giving us increased access to those customers and reducing shipping and manufacturing costs for equipment they purchase. We continue to perform strategic planning and marketing activities in our corporate headquarters in Fremont, California, and we intend to increase the personnel and functions at our Fremont headquarters as part of our plan to expand our market presence in North America and Europe.
87
Table of Contents
Industry Background
Semiconductors are the foundation of the exponential growth of digital technologies and applications. For more than thirty years, strong demand for personal computers, tablet computers, mobile phones and other digital products has fueled the growth of the semiconductor industry. Today the migration of computing, networking and storage to the cloud and the proliferation of “smart” appliances, buildings, cars and devices—the “Internet of Things”—are driving semiconductor development and manufacturing. IC Insights, Inc. (March 2016) estimates that worldwide semiconductor shipments grew from 103.7 billion units in 1987 to 840.4 billion units in 2015 and will increase at a compound annual growth rate, or CAGR, of 6.7% to reach 1.0 trillion units in 2018.
Continuing Demand for Faster, Better, Cheaper Chips
New and enhanced digital applications and products have relied on the development and deployment of progressively faster and more powerful—but ever smaller and less costly—semiconductors known as integrated circuits, or chips. A chip is an array of transistors and other circuit elements built on a wafer of substrate material, typically silicon, with wiring and other interconnects that connect the circuit elements to each other and to outside devices. Chips store and manipulate data in binary form, with the two largest categories of integrated circuits being memory chips, for data storage and retrieval, and logic chips, for computer processing and control.
For a half century the number of transistors that can fit in a given area has roughly doubled every two years, a rate of improvement referred to as “Moore’s Law.” Chip feature sizes have been repeatedly scaled down to pack more transistors in smaller chips. The minimum line width on a chip, known as the node, shrank from 30,000nm in 1963 to 1,000nm in 1989, 90nm in 2003 and 14nm in 2014. A chip today may contain more than thirty billion transistors, with features finer than one ten-thousandth of the diameter of a human hair.
In recent years, however, the rate of chip improvement delivered solely by shrinking feature sizes has slowed. At the 22nm node, transistor and interconnect parameters for conventional chips, in which features are arrayed in 2D structures, begin to approach their critical performance limitations. For example, photolithography, a key chip manufacturing process that projects 193nm laser light through masks to print patterns on a wafer surface, may be unable to create patterning with sufficient resolution and selectivity. Moreover, the feature density and power levels of a 22nm chip may require additional circuit elements, such as special circuitry to correct errors or to track and adapt to performance variations, that occupy chip area and increase cost.
In order to extend Moore’s Law, chip designers and manufacturers are developing and implementing technologies and architectures to transition to advanced chips with 3D structures. Logic chip makers are rapidly adopting use of 3D, fin-shaped Fin Field Effect Transistors, or FinFET, which provide faster switching while consuming less power. For memory chip manufacturers, 3D NAND stacks memory cells to deliver greater capacity at lower cost and 3D cross point, a transistor-less memory cell architecture, is being developed to accelerate processing of massive data sets. EUV lithography is a promising manufacturing technology that could improve patterning capability and increase feature density at nodes of 5nm and beyond by extending photolithography to the extreme ultraviolet wavelength of 13.5nm.
Escalating Need for Advanced Chip Manufacturing Equipment
Manufacturing steps differ for logic and memory chips, but all chips are manufactured in two general processes:
| • | In the front-end fabrication process, hundreds of copies of functional circuitry are created on a 100–to 300–millimeter, or mm, silicon wafer over a period of 6 to 8 weeks. A sequence of a few hundred complex, repetitive steps forms transistors, other circuit elements and interconnects on the wafer through the deposit and selective removal of successive material layers, using photolithography to create a design, deposition to add layers of materials, etching to remove unwanted exposed materials, and chemical mechanical planarization or CMP to smooth the surface for the next cycle of process steps. |
88
Table of Contents
| • | In the back-end assembly and testing process, a completed wafer from the front-end process is cut into individual “dies.” Each die is tested against specifications and, if compliant, encapsulated in a package that protects the die and supports critical power and electrical connections. The resulting chip is then subjected to final electrical and reliability tests. |
Manufacturing advanced chips at smaller nodes requires a more complex process flow that incorporates enhanced, more expensive capital equipment, or tools, to perform increasingly complex process steps, as well as an increased number of tools to perform a greater number of process steps per wafer. A chip fabrication plant, or fab, may have more than 500 highly specialized tools representing more than 70 categories of equipment, all situated in an environmentally controlled “clean room.” As a result, construction of a new advanced fab can cost between $5 and $10 billion (Semiconductor Industry Association/Nathan Associates, May 2016). Semiconductor Equipment and Materials International or SEMI (August 2016) estimates that worldwide fab tool billings totaled $36.0 billion in 2015 and will reach $41.4 billion by 2017, a CAGR of 7.2%.
Because of the significant capital expenditures and manufacturing expenses, chip makers focus on improving their yield, which is the percentage of chips on a wafer that conform to specifications. Even with use of precision tools in a controlled manufacturing environment, a substantial number of chips may contain defects and be rejected, directly impacting cost-per-chip and profitability. We estimate that a 1% decrease in yield can reduce annual profits by $30 to $50 million for a fab producing dynamic random-access memory, or DRAM, chips on 100,000 wafers per month—and a 1% yield loss may decrease profits even more for a fab making logic chips, which typically have higher prices. Moreover, lower yield may necessitate greater fab capacity, increasing capital expenditures.
New technologies and architectures introduced in transitioning to more advanced nodes can lead to significant yield loss. We believe chip manufacturers with state-of-the-art, established fabs for process nodes of 22nm or more typically target a yield of 90% or more, but yield can drop to as low as 50% when, for example, a manufacturer migrates to chips incorporating FinFET. To reduce yield loss, a manufacturer transitioning to a more advanced node must implement additional fabrication steps and new process capabilities, which in turn require innovative, reliable front-end tool solutions.
Growing Influence of the PRC Across the Semiconductor Industry
The PRC is both the largest and the fastest-growing market for semiconductors. According to a study by PricewaterhouseCoopers (January 2017), during the ten-year period ending in 2015, the PRC’s semiconductor consumption grew at a CAGR of 14.3% while worldwide consumption increased by only 4.0%, and by 2015 the PRC consumed 58.5% of the world’s semiconductors. The PRC government is implementing focused policies, including state-led investment initiatives, that aim to create and support an independent domestic semiconductor supply chain spanning from design to final system production. The PRC has already made significant progress across the principal semiconductor industry sectors, as shown in the following market information compiled by PricewaterhouseCoopers:
| • | The chip design, or “fabless,” industry is the fastest growing segment of the PRC’s semiconductor industry, with revenue increasing from $1.5 billion in 2005 to $21.1 billion in 2015, a CAGR of 30.1%. |
| • | China’s share of worldwide semiconductor manufacturing capacity expanded from 7.3% in 2006 to 12.7% in 2015, and its semiconductor manufacturing revenue increased at a CAGR of 17.6% over the ten-year period ending in 2015. |
| • | China’s semiconductor packaging, assembly and test revenue also grew at a CAGR of 18% over the ten-year period ending in 2015. |
The PRC’s semiconductor tools industry produced less than 0.5% of the world’s semiconductor manufacturing equipment in 2014 (International Trade Association of U.S. Department of Commerce, July 2016). The PRC’s governmental goals anticipate significant growth in all segments of the domestic semiconductor industry, however, and tool manufacturers with a Chinese presence should experience support from both upstream and downstream Chinese companies in the semiconductor supply chain.
89
Table of Contents
Emerging Criticality of Wafer Cleaning
In the chip fabrication process, random defects such as particles, residual chemicals and other contaminants can lead directly to yield loss by distorting images for pattern formation in a lithographic step, obstructing deposition of a film, blocking an etch or otherwise impairing chip performance. Random defects can originate from substrate material, tools, fab personnel, clean room air and nearly every other aspect of the manufacturing process. Shapes and sizes of random defects vary widely, and with each decrease in process node, the dimension of the smallest random defect that can cause a chip to fail, known as the “killer defect” size, shrinks.
Chip fabrication includes steps designed to eliminate random defects without collapsing patterns, causing loss of materials or otherwise damaging features. The number of these steps has increased dramatically with chip complexity. Cleaning is now the most frequently repeated step in chip fabrication and may be performed in as many as 200 steps for each wafer. A sub-optimal cleaning process has repeated opportunities to reduce yield by being either insufficiently forceful, which leaves random defects behind, or overly aggressive, which damages the chip. Over the past decade, fabricators seeking to improve cleaning performance have switched from batch processes, in which several wafers are processed at the same time, to single-wafer cleaning tools.
There are two basic types of cleaning methods. Wet cleaning uses liquid chemistry by applying combinations of solvents, acids and water to spray, scrub, etch and dissolve random defects. Dry cleaning uses gas phase chemistry, relying on chemical reactions and techniques such as lasers, aerosols and ozonated chemistries. Wet cleaning typically outperforms dry cleaning in achieving wafer surface cleanliness and smoothness, and it is the standard method for single-wafer cleaning, constituting more than 90% of the cleaning steps in the fabrication process. RCA clean, a standardized process using hot alkaline and acidic hydrogen peroxide solutions, has been the industry standard for wet cleaning for a quarter century.
Wet cleaning’s chemistry has not changed appreciably over the past 25 years, but its implementation has shifted from simple immersion to increasingly sophisticated techniques such as jet spraying and megasonic vibration. Jet spray cleaning shoots high-velocity, tens of micron-sized water droplets at a wafer surface to remove random defects. Megasonic cleaning transmits acoustic waves through a fluid bath to produce, in a process known as transient cavitation, bubble oscillation that dislodges random defects. The cavitation can dislodge defects unreachable by jet spray, but the bubbles collapse quickly and can generate energy that damages wafer features.
As jet spray and megasonic cleaning techniques have continued to develop, chip makers have regularly upgraded from simple tanks with on-off switches to complex, specialized, expensive single-wafer cleaning tools. According to Transparency Market Research Pvt. Ltd, the global market for cleaning equipment for single-wafer processing systems totaled $2.6 billion in 2015 and is expected to increase to $3.7 billion in 2020, a CAGR of 6.8%.
Inadequacy of Traditional Single-Wafer Cleaning Technologies
At process nodes of 100nm or more, chips consisted of 2D features and architectures, which made wafer cleaning relatively straightforward. Cleaning was most commonly performed in batch processes using an immersion tool with megasonic energy. Megasonic vibrations transmit at relatively high frequencies and therefore create smaller bubbles that remove more-diminutive defects and that generate lower levels of destructive transient energy when they collapse.
As process nodes shrank below 100nm, equipment manufacturers introduced single-wafer megasonic cleaning tools, which processed wafers one by one, rather than in batches. Because these tools did not deliver energy uniformly across the wafer surface, manufacturers found the tools did not clean wafers thoroughly and evenly and, increasingly as process nodes continued to shrink, led to damage to patterned wafer structures. Equipment makers also began to offer single-wafer cleaning tools that used jet spraying rather than acoustic
90
Table of Contents
vibrations. The physical energy of jet spraying enabled these tools to be used with less assertive chemicals, which reduced wafer material loss. Once process nodes reach 45nm, however, the force of jet sprayed water droplets can damage finer chip features and jet spraying can fail to eliminate killer defect-sized contaminants due to its reduced lateral fluid speed as the fluid approaches the wafer surfaces.
As process nodes continue to shrink to 22nm and less, finer feature sizes and denser, more complex architectures make the cleaning process even more complicated and challenging:
| • | Random defects are harder to remove as the killer defect size decreases. Smaller random defects are denser and bind to a wafer more strongly than larger contaminants, and additional energy is required to deliver greater levels of necessary force to more minuscule sizes. |
| • | New 3D architectures are often more delicate or fragile than 2D conventional structures. FinFET structures, for example, are relatively tall, thin and deep, which makes them more susceptible to damage or destruction by the physical force of jet sprays and megasonic transient cavitation used in the cleaning process. |
| • | New chip technologies and architectures amplify cleaning challenges. It is, for example, progressively more difficult to remove random defects from the bottom of a chip structure, such as a via, as the “aspect ratio” of the structure’s depth to its width increases. While conventional 2D structures typically have aspect ratios of 3-to-1 or less, FinFET structures have aspect ratios of 10-to-1 currently and are expected to have aspect ratios in excess of 20-to-1 for future process nodes. Moreover, aspect ratios for 3D NAND, 3D cross point and other 3D structures may reach 60-to-1. |
Effective, damage-free cleaning poses a significant challenge for manufacturers seeking to fabricate chips in the advanced process nodes available today or introduced in the future, including the 10nm node announced for 2017 and the 7nm node announced for 2018. In order to extend Moore’s law, chip manufacturers must be able to remove ever smaller random defects from not only flat wafer surfaces but also progressively more intricate, finer-featured 3D chip architectures, in each case without incurring damage or material loss that curtails yield and profits. Because fabrication of chips at 22nm or less requires an increasingly complex, specialized process flow, a next-generation single-wafer cleaning tool solution should be designed to be easily tailored to meet a manufacturer’s unique process requirements. The single-wafer cleaning tools should produce less environmentally harmful chemical waste and should be easily accessible to manufacturers in the burgeoning Chinese market.
Our Solutions
We have developed single-wafer wet cleaning equipment that chip manufacturers can use in numerous steps of the fabrication process in order to avoid yield loss at existing and future process nodes. Using our proprietary technologies, we have designed our wet cleaning equipment to remove random defects from chip wafers with fine feature sizes, complex patterning, dense circuit architectures and high aspect ratios more effectively than traditional jet spray and transient megasonic technologies. Key elements of our solutions include:
Differentiated technologies for advanced chips. Our proprietary single-wafer wet cleaning technologies control the power intensity and distribution of megasonic cleaning in order to remove random defects from a wafer surface effectively, without damaging the wafer or its features, even at process nodes of 22nm or less. We developed these technologies to help semiconductor manufacturers produce chips that reach their ultimate physical limitations.
| • | Flat and patterned wafer surfaces. Our Space Alternated Phase Shift, or SAPS, technology, which we introduced in 2009, employs alternating phases of megasonic waves to deliver megasonic energy to flat and patterned wafer surfaces in a highly uniform manner on a microscopic level. We have shown SAPS technology to be more effective than conventional megasonic and jet spray technologies in removing random defects across an entire wafer as node sizes shrink from 300nm to 45nm, including node sizes |
91
Table of Contents
| less than 50nm in size, for which jet spray technology has proven to be ineffective. Based on their initial mass production experience with SAPS equipment, customers have increased their use of SAPS equipment by adding cleaning steps to the manufacturing processes for advanced chips in order to achieve higher yields and reduce chemical usage. |
| • | High-aspect ratio conventional 2D and advanced 3D patterned wafer surfaces. Our Timely Energized Bubble Oscillation, or TEBO, technology, which we introduced in March 2016, has been developed to provide effective, damage-free cleaning for both conventional 2D and 3D patterned wafers at advanced process nodes. TEBO technology provides multi-parameter control of bubble cavitation during megasonic cleaning by using a sequence of rapid pressure changes to force bubbles to oscillate at controlled sizes, shapes and temperatures. Because the bubbles oscillate instead of imploding or collapsing, TEBO technology avoids the pattern damage caused by transient cavitation in traditional megasonic cleaning processes. We have demonstrated the damage-free cleaning capabilities of TEBO technology on patterned wafers for feature nodes as small as 1xnm (16nm to 19nm), and we have shown that TEBO technology can be applied in manufacturing processes for patterned chips with 3D architectures such as FinFET, DRAM, 3D NAND and 3D cross point memory having aspect ratios as high as 60-to-1. We believe TEBO technology can be applied for even smaller process nodes. TEBO tools are currently being evaluated by a selected group of leading memory and logic chip manufacturers. |
China-based operations. In 2006 we established our operational center in Shanghai, and currently we conduct substantially all of our development and manufacturing activities in the PRC. This strategy positions us near potential customers throughout Asia, giving us increased access to those customers and reducing shipping and manufacturing costs for equipment they purchase. An estimated 78% of new front-end facilities and production lines starting operation from 2017 through 2020 are projected to be constructed in Asia, with 42% expected to be built in the PRC. Our Shanghai location also gives us access to a large pool of highly qualified potential employees.
Extensive intellectual property protection. Since our formation in 1998, we have focused on building a strategic portfolio of intellectual property to support and protect our key innovations, including most recently our SAPS and TEBO technologies. As of September 30, 2017, we had been issued more than 140 patents in the United States, the PRC, Japan, Korea, Singapore and Taiwan.
Custom-made wafer assembly packaging solutions. In addition to our product offerings for single-wafer cleaning in the front-end wafer fabrication process, we leverage our technology and expertise to provide a wide range of advanced packaging equipment, such as coaters, developers, photoresist strippers, scrubbers, wet etchers and copper-plating tools, to back-end wafer assembly and packaging factories, particularly in the PRC. For these offerings, we focus on providing customized equipment with competitive performance, service and pricing.
Our Strategy
Our objective is to be the leading global provider of a full range of wet cleaning equipment for the manufacture of advanced integrated circuits. To achieve this goal, we are pursuing the following strategies:
Extend technology leadership. We intend to build upon our technology leadership in wet processing by continuing to develop and refine our differentiated SAPS and TEBO technologies and equipment designed to address cleaning challenges presented by the manufacture of increasingly advanced chip nodes. To continue to build our strategic intellectual property portfolio, which included more than 140 patents as of September 30, 2017. Our investment in research and development totaled $1.9 million, or 12.9% of our revenue, in the first half of 2017 and $3.3 million, or 11.9% of our revenue, in 2016. We will continue to invest in product development and to strengthen our global patent portfolio in strategic jurisdictions.
Establish referenceable customer base. Semiconductors fall into two principal product categories, memory and logic, and the processes associated with manufacturing products in those two categories differ. In
92
Table of Contents
commercializing our SAPS equipment, we placed evaluation equipment with selected customers, who subsequently purchased additional SAPS equipment to enable them to add more cleaning steps during their manufacturing processes. We have initiated a similar process for TEBO equipment, and have placed TEBO evaluation equipment with two leading memory and logic chip customers, whose use of our products can influence decisions by other manufacturers.
Leverage local presence to address growing PRC market. The market for semiconductor manufacturing equipment in the PRC is expected to grow markedly in the upcoming years. Our experience has shown that chip manufacturers in the PRC demand equipment meeting their specific technical requirements and prefer building relationships with local suppliers. Since establishing our operations in Shanghai a decade ago, we have leveraged our local presence to begin displacing some incumbent providers of wet cleaning equipment. We will continue to work closely with PRC-based chip manufacturers to understand their specific requirements, encourage them to adopt our SAPS and TEBO technologies, and enable us to design innovative products and solutions to address their needs.
Continue to improve performance through operational excellence. As we increase the breadth of our product offerings and the size of our operations and customer base, we must continually improve the efficiency and quality of our operations in order to satisfy our customers’ needs and meet our financial goals. We actively manage our business through principles of operational excellence designed to ensure continuous improvement of our key operational and financial metrics. We will continue to develop and implement these principles to, for example, identify key quantifiable annual goals for all aspects of our business, implement factory constraint management, change control and inventory management systems, and enhance our risk management system.
Pursue strategic acquisitions and relationships. To complement and accelerate our internal growth, we may pursue acquisitions of businesses, technologies and products that will expand the functionality of our products, provide access to new markets or customers, or otherwise complement our existing operations. We also may seek to expand our product and service offerings by entering into business relationships involving additional distribution channels, investments in other enterprises and joint ventures, or similar arrangements. On September 11, 2017, we acquired 20% of the outstanding equity of Ninebell, one of our key subassembly providers, as described under “Management’s Discussion and Analysis of Financial Condition and Results of Operations—Recent Equity Transactions—Strategic Investment in Key Supplier.”
Our Products and Technologies
We develop, manufacture and sell single-wafer wet cleaning equipment usable at numerous steps of the chip manufacturing process flow to improve product yield for conventional 2D and advanced 3D patterned chips at small process nodes. Our equipment, which we market and sell under the brand name “Ultra C,” is designed to remove random defects from a wafer surface effectively, without damaging the wafer or its features, even at increasingly advanced process nodes.
After incorporating in 1998, we initially focused on developing tools for manufacturing process steps involving the integration of ultra-low-K materials and copper. Ultra-low-K materials, which insulate better than silicon, presented opportunities for size scaling and performance improvement, and higher conductivity copper had begun to replace aluminum in forming interconnects. Our early efforts focused in particular on stress-free copper-polishing technology, and we sold tools based on that technology in the early 2000s.
In 2006 we established our operational center in Shanghai. This strategic decision was made to help us establish and build relationships with chip manufacturers in China and throughout Asia, which helps us to understand their requirements and to develop innovative technologies and tools addressing their needs.
In 2007 we began to focus our development efforts on single-wafer wet-cleaning solutions for the front-end fabrication process. We have developed innovative, proprietary technologies that reintroduce megasonic
93
Table of Contents
technology to the wafer cleaning process. Our approach is based on our understanding of the shortfalls and limitations of previously existing megasonic cleaning technologies that led to ineffective cleaning and damaged chip features. In 2009 we introduced our proprietary Space Alternated Phase Shift, or SAPS, megasonic technology, which can be applied in flat patterned wafer cleaning at numerous steps during the chip fabrication process. By delivering megasonic energy uniformly across a wafer, SAPS technology eliminates the particle removal inefficiencies that characterized traditional megasonic cleaning technologies. In March 2016 we introduced our proprietary Timely Energized Bubble Oscillation, or TEBO, technology, which can be applied at numerous steps during the fabrication of small node conventional 2D and 3D patterned wafers. By providing multi-parameter control of bubble cavitation during megasonic cleaning, TEBO technology avoids the fine-pattern damage caused by previously existing megasonic cleaning processes.
We have designed our equipment models for SAPS and TEBO solutions using a modular configuration that enables us to create a wet-cleaning tool meeting the specific requirements of a customer, while using pre-existing designs for chamber, electrical, chemical delivery and other modules. Our modular approach supports a wide range of customer needs and facilitates the adaptation of our model tools for use with the optimal chemicals selected to meet a customer’s requirements. Our tools are offered principally for use in manufacturing chips from 300mm silicon wafers, but we also offer solutions for 150mm and 200mm wafers and for nonstandard substrates, including quartz, sapphire and glass.
In addition to our SAPS and TEBO tool offerings, we offer a range of custom-made equipment, such as cleaners, coaters, developers, photoresist strippers, wet etchers and copper-plating tools, to back-end wafer assembly and packaging factories, principally in the PRC.
Space Alternated Phase Shift Cleaning
SAPS Technology
SAPS technology delivers megasonic energy uniformly to every point on an entire wafer by alternating phases of megasonic waves in the gap between a megasonic transducer and the wafer. Radicals for removing random defects are generated in dilute solution, and the radical generation is promoted by megasonic energy. Unlike “stationary” megasonic transducers used by conventional megasonic cleaning methods, SAPS technology moves or tilts a transducer while a wafer rotates, enabling megasonic energy to be delivered uniformly across all points on the wafer, even if the wafer is warped. The mechanical force of cavitations generated by megasonic energy enhances the mass transfer rate of dislodged random defects and improves particle removal efficiency.
By delivering megasonic energy in a highly uniform manner on a microscopic level, SAPS technology can precisely control the intensity of megasonic energy and can effectively remove random defects of all sizes across the entire wafer in less total cleaning time than conventional megasonic cleaning products, without loss of material or roughing of wafer surfaces. We have conducted trials demonstrating SAPS technology to be more effective than conventional megasonic and jet spray cleaning technologies as defect sizes shrink from 300nm to 45nm. These trials show that SAPs technology has an even greater relative advantage over conventional jet spray technology when cleaning defects between 50 and 65nm in size and that SAPs technology continues to be effective for defects of sizes between 45 nm and 50nm, for which jet spray technology has proven to be ineffective.
SAPS Applications
SAPS megasonic cleaning technology can be applied during the chip fabrication process to clean wafer surfaces and interconnects. It also can be used to clean, and lengthen the lifetime of, recycled test wafers.
Wafer Surfaces. SAPS technology can enhance removal of random defects following planarization and deposition, which are among the most important, and most repeated, steps in the fabrication process:
| • | Post CMP: Chemical mechanical planarization, or CMP, uses an abrasive chemical slurry following other fabrication processes, such as deposition and etching, in order to achieve a smooth wafer surface |
94
Table of Contents
| in preparation for subsequent processing steps. SAPS technology can be applied following each CMP process to remove residual random defects deposited or formed during CMP. |
| • | Post Hard Mask Deposition: As part of the photolithographical patterning process, a mask is applied with each deposition of a material layer to prevent etching of material intended to be retained. Hard masks have been developed to etch high aspect-ratio features of advanced chips that traditional masks cannot tolerate. SAPS technology can be applied following each deposition step involving hard masks that use nitride, oxide or carbon based materials to achieve higher etch selectivity and resolution. |
For these purposes, SAPS technology uses environmentally friendly dilute chemicals, reducing chemical consumption. Chemical types include dilute solutions of chemicals used in RCA cleaning, such as dilute hydrofluoric acid and RCA SC-1 solutions, and, for higher quality wafer cleaning, functional de-ionized water produced by dissolving hydrogen, nitrogen or carbon dioxide in water containing a small amount of chemicals, such as ammonia. Functional water removes random defects by generating radicals, and megasonic excitation can be used in conjunction with functional water to further increase the generation of radicals. Functional water has a lower cost and environmental impact than RCA solutions, and using functional water is more efficient in eliminating random defects than using dilute chemicals or de-ionized water alone. We have shown that SAPS megasonic technology using functional water exhibits high efficiency in removing random defects, especially particles smaller than 65nm, with minimal damage to structures.
Interconnects and Barrier Metals. Each successive advanced process node has led to finer feature sizes of interconnects such as contacts, which form electrical pathways between a transistor and the first metal layer, and vias, which form electrical pathways between two metal layers. Advanced nodes have also resulted in higher aspect ratios for interconnect structures, with thinner, redesigned metal barriers being used to prevent diffusion. SAPS technology can improve the removal of residues and other random defects from interconnects during the chip fabrication process:
| • | Post Contact/Via Etch: Wet etching processes are commonly used to create patterns of high-density contacts and vias. SAPS technology can be applied after each such etching process to remove random defects that could otherwise lead to electrical shorts. |
| • | Pre Barrier Metal Deposition: Copper wiring requires metal diffusion barriers at the top of via holes to prevent electrical leakage. SAPS technology can be applied prior to deposition of barrier metal to remove residual oxidized copper, which otherwise would adhere poorly to the barrier and impair performance. |
For these applications, SAPS technology uses environmentally friendly dilute chemicals such as dilute hydrofluoric acid, RCA SC-1 solution, ozonated de-ionized water and functional de-ionized water with dissolved hydrogen. These chemical solutions take the place of piranha solution, a high-temperature mixture of sulfuric acid and hydrogen peroxide used by conventional wet wafer cleaning processes. We have shown that SAPS technology exhibits greater efficiency in removing random defects, and lower levels of material loss, than conventional processes, and our chemical solutions are less expensive and more environmentally conscious than piranha solution.
Recycled Test Wafers. In addition to using silicon wafers for chip production, chip manufacturers routinely process wafers through a limited portion of the front-end fabrication steps in order to evaluate the health, performance and reliability of those steps. Manufacturers also use wafers for non-product purposes such as inline monitoring. Wafers used for purposes other than manufacturing revenue products are known as test wafers, and it is typical for twenty to thirty percent of the wafers circulating in a fab to be test wafers. In light of the significant cost of wafers, manufacturers seek to re-use a test wafer for more than one test. As test wafers are recycled, surface roughness and other defects progressively impair the ability of a wafer to complete tests accurately. SAPS technology can be applied to reduce random defect levels of a recycled wafer, enabling the test wafer to be reclaimed for use in additional testing processes. For these purposes, SAPS technology includes improved fan
95
Table of Contents
filter units that balances intake and exhaust flows, precise temperature and concentration controls that ensure better handling of concentrated acid processes, and two-chemical recycle capability that reduces chemical consumption.
SAPS Equipment
We currently offer two models of wet wafer cleaning equipment based on our SAPS technology, Ultra C SAPS II and Ultra C SAPS V. Each of these models is a single-wafer, serial-processing tool that can be
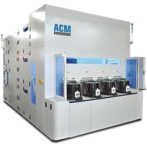
|
configured to customer specifications and, in conjunction with appropriate dilute chemicals, used to remove random defects from wafer surfaces or interconnects and barrier metals as part of the chip front-end fabrication process or for purposes of recycling test wafers. By combining our megasonic and chemical cleaning technologies, we have designed these tools to remove random defects with greater efficacy and efficiency than conventional wafer cleaning processes, with enhanced process flexibility and reduced quantities of chemicals. Each of our SAPS models was initially built to meet specific requirements of a key customer. We expect the sales prices of our SAPS tools generally to range between $2.5 million and $5.0 million, although the sales price of a particular tool will vary depending upon the required specifications. |
SAPS II was released in 2011. Its key features include:
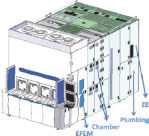
|
• compact design, with footprint of 2.65m x 4.10m x 2.85m (WxDxH), requiring limited clean room floor space; | |
|
• up to 8 chambers, providing throughput of up to 225 wafers per hour; | ||
|
• double-sided cleaning capability, with up to 5 cleaning chemicals for process flexibility; | ||
|
• 2-chemical recycling capability for reduced chemical consumption; | ||
|
• image wafer detection method for lowering wafer breakage rates; and | ||
|
• chemical delivery module for delivery of dilute hydrofluoric acid, RCA SC-1 solution, functional de-ionized water and carbon dioxide to each of the chambers. |
SAPS V, which was released in 2014, offers increased productivity for chip manufacturers moving to advanced nodes. SAPS V provides all of the features and functionality of SAPS II, upgraded as follows:
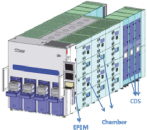
|
• compact design, with footprint of 2.55m x 5.1m x 2.85m (WxDxH); | |
|
• up to 12 chambers, providing throughput of up to 375 wafers per hour; | ||
|
• chemical supply system integrated into mainframe; | ||
|
• inline mixing method replaces tank auto-changing, reducing process time; and | ||
|
• improved drying technology using hot isopropyl alcohol and de-ionized water.
|
96
Table of Contents
Timely Energized Bubble Oscillation Cleaning
TEBO Technology
We developed TEBO technology for application in wet wafer cleaning during the fabrication of both conventional 2D and 3D patterned wafers with fine feature sizes. TEBO technology facilitates effective cleaning even with patterned features too small or fragile to be addressed by conventional jet spray and megasonic cleaning technologies.
TEBO technology solves the problems created by transient cavitation in conventional megasonic cleaning processes. Cavitation is the formation of bubbles in a liquid, and transient cavitation is a process in which a bubble in fluid implodes or collapses. In conventional megasonic cleaning processes, megasonic energy forms bubbles and then causes those bubbles to implode or collapse, blasting destructive high-pressure, high-temperature micro jets toward the wafer surface. Our internal testing has confirmed that at any level of megasonic energy capable of removing random defects, the sonic energy and mechanical force generated by transient cavitation are sufficiently strong to damage fragile patterned structures with features less than 70nm.
TEBO technology provides multi-parameter control of cavitation by using a sequence of rapid changes in pressure to force a bubble in liquid to oscillate at controlled sizes, shapes and temperatures, rather than implode or collapse. As a result, cavitation remains stable during TEBO megasonic cleaning processes, and a chip fabricator can, using TEBO technology, apply the level of megasonic energy needed to remove random defects without incurring the pattern damage created by transient cavitation in conventional megasonic cleaning.
We have demonstrated the damage-free cleaning capabilities of TEBO technology on customers’ patterned wafers as small as 1xnm (16nm to 19nm), and we believe TEBO technology will be applicable in even smaller fabrication process nodes. TEBO technology can be applied in manufacturing processes for conventional 2D chips with fine features and advanced chips with 3D structures, including FinFET, DRAM, 3D NAND and 3D cross point memory as well as other 3D architectures that may be developed in the future, such as carbon nanotubes and quantum devices. As a result of the thorough, controlled nature of TEBO processes, cleaning time for TEBO-based solutions may take longer than conventional megasonic cleaning processes. Conventional processes have proven ineffective, however, for process nodes of 20nm or less, and we believe the increased yield that can be achieved by using TEBO technology for nodes up to 70nm can more than offset the cost of the additional time in utilizing TEBO technology.
TEBO Applications
At process nodes of 28nm and less, chip makers face escalating challenges in eliminating nanometric particles and maintaining the condition of inside pattern surfaces. In order to maintain chip quality and avoid yield loss, cleaning technologies must control random defects of diminishing killer defect sizes, without roughing or otherwise damaging surfaces of transistors, interconnects or other wafer features. TEBO technology can be applied in numerous steps throughout the manufacturing process flow for effective, damage-free cleaning:
| • | Memory Chips: TEBO technology can be applied in up to a total of 47 steps in the fabrication of a dynamic random-access memory, or DRAM, chip, consisting of 8 steps in cleaning ISO structures, 19 steps in cleaning buried gates, and 20 steps in cleaning high aspect-ratio storage nodes and stacked films. |
| • | Logic Chips: In the fabrication process for a logic chip with a FinFET structure, TEBO technology can be used in 15 or more cleaning steps. |
For purposes of solving inside pattern surface conditions for memory or logic chips, TEBO technology uses environmentally friendly dilute chemicals such as RCA SC-1 and hydrogen gas doped functional water.
97
Table of Contents
TEBO Equipment
We currently offer two models of wet wafer cleaning equipment based on our TEBO technology, Ultra C TEBO II and Ultra C TEBO V. Each of these models is a single-wafer, serial-processing tool that can be configured to customer specifications and, in conjunction with appropriate dilute chemicals, used at numerous manufacturing processing steps for effective, damage-free cleaning of chips at process nodes 28nm or less. TEBO equipment solves the problem of pattern damage caused by transient cavitation in conventional jet spray and megasonic cleaning processes, providing better particle removal efficiency with limited material loss or roughing. TEBO equipment currently is being evaluated by a select group of leading memory and logic chip customers, some of which recently have indicated an intent to move to production. We expect the sales prices of our TEBO tools generally to range between $3.5 million and $6.5 million, although the sales price of a particular tool will vary depending upon the required specifications.
Each model of TEBO equipment includes:
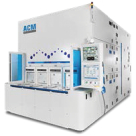
|
• an equipment front-end module, or EFEM, which moves wafers from chamber to chamber;
• one or more chamber modules, each equipped with a TEBO megasonic generator system;
• an electrical module to provide power for the tool; and
• a chemical delivery module. |
|
Ultra C TEBO II was released in 2016. Its key features include:
| ||
|
|
• compact design, with footprint of 2.25m x 2.25m x 2.85m (WxDxH); | |
|
• up to 8 chambers with an upgraded transport system and optimized robotic scheduler, providing throughput of up to 300 wafers per hour; | ||
|
• EFEM module consisting of 4 load ports, transfer robot and 1 process robot; and | ||
|
• focus on dilute chemicals contributes to environmental sustainability and lower cost of ownership. | ||
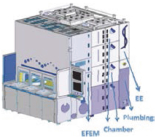
Ultra C TEBO V also was introduced in 2016, and its key features include:
|
|
• footprint of 2.45m x 5.30m x 2.85m (WxDxH); | |
|
• up to 12 chamber modules, providing throughput of up to 300 wafers per hour; | ||
|
• EFEM module consisting of 4 load ports, 1 transfer robot and 1 process robot; and | ||
|
• chemical delivery module for delivery of isopropyl alcohol, dilute hydrofluoric acid, RCA SC-1 solution, functional de-ionized water and carbon dioxide to each of the chambers. |
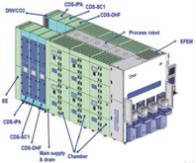
Custom-Made Wafer Assembly and Packaging Equipment
We leverage our technology and expertise to provide a range of single-wafer tools for back-end wafer assembly and packaging factories, principally in the PRC. We focus on providing custom-made, differentiated
98
Table of Contents
equipment that incorporates customer-requested features, at a competitive price. The sales prices for these tools generally range between $500,000 and $1.0 million, and these offerings generated $5.7 million, or 20.9%, of our revenue in 2016 and $4.2 million, or 13.5%, of our revenue in 2015.
| For example, our Ultra C Coater is used in applying photoresist, a light-sensitive material used in photolithography to transfer a pattern from a mask onto a wafer. Coaters typically provide input and output elevators, shuttle systems and other devices to handle and transport wafers during the coating process. Unlike most coaters, the Ultra C Coater is fully automated. In addition, based on requests from customers, we developed and incorporated the special function of chamber auto-clean module into the Ultra C Coater, which further differentiates it from other products in the market. The Ultra C Coater is designed to deliver improved throughput and more efficient tool utilization while eliminating particle generation. |
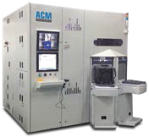
|
Our other advanced packaging tools include: Ultra C Developer, which applies liquid developer to selected parts of photoresist to resolve an image; Ultra C PR Megasonic-Assisted Stripper, which removes photoresist; Ultra C Scrubber, which scrubs and cleans wafers; and Ultra C Thin Wafer Scrubber, which addresses a sub-market of cleaning very thin wafers for certain Asian assembly factories; and Ultra C Wet Etcher, which etches silicon wafers and copper and titanium interconnects.
Our Customers
As of June 30, 2017, customers had purchased and deployed more than 30 Ultra C SAPS and TEBO cleaning tools. All of our sales in 2015, 2016 and the first half of 2017 were to customers located in Asia, and we anticipate that a substantial majority of our revenue will continue to come from customers located in this region for the near future. We have increased our efforts to penetrate the markets in North America and Western Europe, and we believe we are well positioned to begin generating sales in those regions.
We generate most of our revenue from a limited number of customers as the result of our strategy of initially placing SAPS- and TEBO-based equipment with a small number of leading chip manufacturers that are driving technology trends and key capability implementation. In the first half of 2017, 62.8% of our revenue was derived from three customers: SK Hynix Inc., a leading Korean memory chip company that accounted for 22.8% of our revenue; Shanghai Huali Microelectronics Corporation, a leading PRC foundry that accounted for 20.6% of our revenue; and Yangtze Memory Technologies Co., Ltd., a leading PRC memory chip company that, together with one of its subsidiaries, accounted 19.4% of our revenue. In 2016 99.3% of our revenue was derived from four customers: Shanghai Huali Microelectronics Corporation accounted for 33.7% of our revenue; Semiconductor Manufacturing International Corporation, a leading PRC foundry that accounted for 25.0% of our revenue; SK Hynix Inc. accounted for 24.0% of our revenue; and JiangYin ChangDian Advanced Packaging Co. Ltd., a leading PRC foundry that accounted for 16.6% of our revenue. In 2015 all of our revenue was derived from three customers, including SK Hynix Inc., which accounted for 86.0% of our revenue, and JiangYin ChangDian Advanced Packaging Co., Ltd., which accounted for 10.1% of our revenue.
Based on our market experience, we believe that implementation of our equipment by one of our selected leading companies will attract and encourage other manufacturers to evaluate our equipment, because the leading company’s implementation will serve as validation of our equipment and will enable the other manufacturers to shorten their evaluation processes. We placed our first SAPS-based tool in 2009 as a prototype. We worked closely with the customer for two years in debugging and modifying the tool, and the customer then spent two more years of qualification and running pilot production before beginning volume manufacturing. Our revenue in 2015 included sales of SAPS-based tools following the customer’s completion of its qualification process. We expect that the period from new product introduction to high volume manufacturing will be three years or less in the future. Please see “Risk Factors—Business—We depend on a small number of customers for a substantial portion of our revenue, and the loss of, or a significant reduction in orders from, one or more of our major customers could have a material adverse effect on our revenue and operating results. There are also a limited number of potential customers for our products.”
99
Table of Contents
Customers continue to establish joint ventures, alliances and licensing arrangements that have the potential to positively or negatively impact our competitive position and market opportunities. A material reduction in orders from our large customers could adversely affect our results of operations and projected financial condition. Our business depends upon the expenditures of semiconductor manufacturers. Semiconductor manufacturers’ businesses, in turn, depend on many factors, including their financial capability, the current and anticipated market demand for integrated circuits, the global economy and the availability of equipment capacity to support that demand.
Sales and Marketing
We market and sell our products worldwide using a combination of our direct sales force and third-party representatives. We employ direct sales teams in Asia, Europe and North America, and have located these teams near our customers, primarily in the PRC, Korea, Taiwan and the United States. Each sales person has specific local market expertise. We also employ field application engineers, who are typically co-located with our direct sales teams, to provide technical pre- and post-sale support tours and other assistance to existing and potential customers throughout the customers’ fab planning and production line qualification and fab expansion phases. Our field application engineers are organized by end markets as well as core competencies in hardware, control system, software and process development to support our customers.
To supplement our direct sales teams, we have contacts with several independent sales representatives in the PRC, Taiwan and Korea. We select these independent representatives based on their ability to provide effective field sales, marketing forecast and technical support for our products. In the case of representatives, our customers place purchase orders with us directly rather than with the representatives.
Our sales have historically been made using purchase orders with agreed technical specifications. Our sales terms and conditions are generally consistent with industry practice, but may vary from customer to customer. We seek to obtain a purchase order three to four months ahead of the customer’s desired delivery date. For some customers, we receive a letter of intent three weeks ahead, followed by the corresponding purchase order five weeks ahead, of the customer’s desired delivery date. Consistent with industry practice, we allow customers to reschedule or cancel orders on relatively short notice. Because of our relatively short delivery period and our practice of permitting rescheduling or cancellation, we believe that backlog is not a reliable indicator of our future revenue.
Our marketing team focuses on our product strategy and technology road maps, product marketing, new product introduction processes, demand assessment and competitive analysis, customer requirement communication and public relations. Our marketing team also has the responsibility to conduct environmental scans, study industry trends and arrange our participation at major trade shows.
Manufacturing
All of our products are built to order at our facility in Shanghai. Our manufacturing facility has a total of 36,000 square feet, with 8,000 square feet of class 10,000 clean room space for product assembly and testing, plus 800 square feet of class 1 clean room space for product demonstration purposes. The rest of the area is used for product sub-assembly, component inventory and manufacturing related offices. A class designation for a clean room denotes the number of particles of size 0.5mm or larger permitted per cubic foot of air. Our manufacturing facility is ISO-9000 certified, and we have implemented certain manufacturing science-based factory practices such as constraint management, statistical process control and failure mode and effect analysis methodology.
In each of 2015, 2016 and the first half of 2017, we sourced approximately one-third of the parts and components (by value) for our products from Chinese suppliers and the remaining parts and components were sourced from suppliers in the United States and, to a lesser extent, Japan and Korea. We employ sub-contractors
100
Table of Contents
to make certain sub-systems and software algorithms. Depending upon the nature of a customer’s specifications, the lead time for production of a tool generally will extend from two to four months, but can be as long as six months. We plan our production capacity to be about twice the average orders to ensure we can respond to demand fluctuations. Currently we estimate that our production capacity is close to plan, namely sufficient to produce two tools for each tool shipped to a customer.
We purchase some of the components and assemblies that we include in our products from single source suppliers. We believe that we could obtain and qualify alternative sources to supply these components. Nevertheless, any prolonged inability to obtain these components could have an adverse effect on our operating results and could unfavorably impact our customer relationships. Please see “Risk Factors—Risks Related to Our Business and Our Industry—We depend on a limited number of suppliers, including single source suppliers, for critical components and assemblies, and our business could be disrupted if they are unable to meet our needs.”
Research and Development
We believe that our success depends in part on our ability to develop and deliver breakthrough technologies and capabilities to meet our customers’ ever-more challenging technical requirements. For this reason, we devote significant financial and personnel resources to research and development. Our research and development team is comprised of highly skilled engineers and technologists with extensive experience in megasonic technology, cleaning processes and chemistry, mechanical design, and control system design. As of September 30, 2017, approximately one half of our research and development personnel held advanced technical degrees. To supplement our internal expertise, we also collaborate with external research and development entities such as International SEMATECH, a global consortium of computer chip manufacturers, on specific areas of interests and retain, as technical advisors, several experts in semiconductor technology.
For the foreseeable future we are focusing on enhancing our existing Ultra C SAPS and TEBO tools and integrating additional capabilities to meet and anticipate requirements from our existing and potential customers. Our particular areas of focus include development of the following:
| • | new cleaning steps for Ultra C SAPS cleaners for application in logic chips and for DRAM, 3D NAND and 3D cross point memory technologies; |
| • | new cleaning steps for Ultra C TEBO cleaners for FinFET in logic chips, gates in DRAM, and deep vias in both 3D NAND and 3D cross point memory technologies; |
| • | new hardware, including new system platforms, new chamber structures and new chemical blending systems; and |
| • | new software to integrate new functionalities to improve tool performance. |
Longer term, we are working on new proprietary process capabilities based on our existing tool hardware platforms. We are also working to integrate our tools with third-party tools in adjacent process areas in the chip manufacturing flow.
Our research and development expense was $1.9 million, or 13.0% of revenue, in the first half of 2017, $3.3 million, or 11.9% of revenue, in 2016 and $2.9 million, or 9.0% of revenue, in 2015. Without reduction by grant amounts received from PRC governmental authorities (see “—Key Components of Results of Operations—PRC Government Research and Development Funding”), our gross research and development expense totaled $5.0 million, or 34.8% of revenue, in the first half of 2017, $7.5 million, or 27.4% of revenue, in 2016 and $6.6 million, or 21.0% of revenue, in 2015. We intend to continue to invest in research and development to support and enhance our existing cleaning products and to develop future product offerings to build and maintain our technology leadership position.
101
Table of Contents
Intellectual Property
Our success and future revenue growth depend, in part, on our ability to protect our intellectual property. We control access to and use of our proprietary technologies, software and other confidential information through the use of internal and external controls, including contractual protections with employees, consultants, advisors, customers, partners and suppliers. We rely primarily on patent, copyright, trademark and trade secret laws, as well as confidentiality procedures, to protect our proprietary technologies and processes. All employees and consultants are required to execute confidentiality agreements in connection with their employment and consulting relationships with us. We also require them to agree to disclose and assign to us all inventions conceived or made in connection with the employment or consulting relationship.
We have aggressively pursued intellectual property since our founding in 1998. We focus our patent efforts in the United States, and, when justified by cost and strategic importance, we file corresponding foreign patent applications in strategic jurisdictions such as the European Union, the PRC, Japan, Korea, Singapore, and Taiwan. Our patent strategy is designed to provide a balance between the need for coverage in our strategic markets and the need to maintain costs at a reasonable level.
As of September 30, 2017, we had 20 issued patents and numerous pending applications in the United States. These patents carry expiration dates from 2018 through 2027. Many of the US patents and applications have also been filed internationally, in one or more of the European Union, PRC, Japan, Korea, Singapore and Taiwan.
Specifically, we own patents in wafer cleaning, electro-polishing and plating, wafer preparation, and other semiconductor processing technologies.
We currently manufacture advanced single-wafer cleaning systems equipped with our SAPS and TEBO technologies. Our wafer cleaning technologies are protected by US Patent Numbers 8580042, 8671961, 9070723 and 9281177, as well as their corresponding international patents. We have 22 patents granted internationally protecting our SAPS technologies. We also have filed four international patent applications for key TEBO technologies in accordance with the Patent Cooperation Treaty, in anticipation of filing in the U.S. national phase.
In addition to the above core technologies, we have patents reflecting innovations in other aspects of wafer cleaning systems, such as cleaning solution recycling and wafer holding and positioning. During a wafer cleaning cycle, multiple cleaning solutions may be sequentially used. Our cleaning solution recycling technology prevents cross-contamination and allows recycling of the cleaning solutions. These innovations are protected by US Patent Numbers 6248222, 6495007, 6749728, 6726823, 6447668 and 7136173, as well as their corresponding international patents.
We have technologies for stress-free polishing, or SFP, and electrochemical plating, or ECP, that are used in certain of our tools. SFP is an integral part of the CMP process. Our technology was a breakthrough in electro-chemical-copper-planarization technology when it was first introduced, because it can polish, stress-free, oxidizing tantalum barrier layers used in copper low-K interconnects. Our innovations in SFP and ECP are reflected in US Patent Numbers 6395152, 6837984, 6440295, 6638863, 6391166 and 8518224, and their corresponding international counterparts.
We also have technologies in other semiconductor processing areas, such as wafer preparation and some specific processing steps. The wafer preparation technology is covered by US Patent Numbers 8383429 and 9295167. The specific processing steps include US Patent Number 7119008 titled “Integrating metal layers with ultra-low-K dielectrics,” and US Patent Number 8598039 titled “Barrier layer removal method and apparatus.”
To date we have not granted licenses to third parties under the patents described above. Not all of these patents have been implemented in products. We may enter into licensing or cross-licensing arrangements with other companies in the future.
102
Table of Contents
We cannot assure you that any patents will issue from any of our pending applications. Any rights granted under any of our existing or future patents may not provide meaningful protection or any commercial advantage to us. With respect to our other proprietary rights, it may be possible for third parties to copy or otherwise obtain and use our proprietary technology or marks without authorization or to develop similar technology independently.
The semiconductor equipment industry is characterized by vigorous protection and pursuit of intellectual property rights or positions, which have resulted in often protracted and expensive litigation. We may in the future initiate claims or litigation against third parties to determine the validity and scope of proprietary rights of others. In addition, we may in the future initiate litigation to enforce our intellectual property rights or the rights of our customers or to protect our trade secrets.
Our customers could become the target of litigation relating to the patent or other intellectual property rights of others. This could trigger technical support and indemnification obligations in some of our customer agreements. These obligations could result in substantial expenses, including the payment by us of costs and damages related to claims of patent infringement. In addition to the time and expense required for us to provide support or indemnification to our customers, any such litigation could disrupt the businesses of our customers, which in turn could hurt our relations with our customers and cause the sale of our products to decrease. We do not have any insurance coverage for intellectual property infringement claims for which we may be obligated to provide indemnification.
Additional information about the risks relating to our intellectual property is provided under “Risk Factors—Risks Relating to Our Intellectual Property.”
Competition
The chip equipment industry is characterized by rapid change and is highly competitive throughout the world. We compete with semiconductor equipment companies located around the world, and we may also face competition from new and emerging companies, including new competitors from the PRC. We consider our principal competitors to be those companies that provide single-wafer cleaning products to the market, including Lam Research Corp., DNS Electronics LLC, Tokyo Electron Ltd., SEMES Co. Ltd., Mujin Electronics Co., Ltd. and Beijing Sevenstar Science & Technology Co., Ltd.
Compared to our company, our current and potential competitors may have:
| • | better established credibility and market reputations, longer operating histories, and broader product offerings; |
| • | significantly greater financial, technical, marketing and other resources, which may allow them to pursue design, development, manufacturing, sales, marketing, distribution and service support of their products; |
| • | more extensive customer and partner relationships, which may position them to identify and respond more successfully to market developments and changes in customer demands; and |
| • | multiple product offerings, which may enable them to offer bundled discounts for customers purchasing multiple products or other incentives that we cannot match or offer. |
The principal competitive factors in our market include:
| • | performance of products, including particle removal efficiency, rate of damage to wafer structures, high temperature chemistry, throughput, tool uptime and reliability, safety, chemical waste treatment, and environmental impact; |
| • | service support capability and spare parts delivery time; |
103
Table of Contents
| • | innovation and development of functionality and features that are must-haves for advanced fabrication nodes; |
| • | ability to anticipate customer requirements, especially for advanced process nodes of less than 45nm; |
| • | ability to identify new process applications; |
| • | brand recognition and reputation; and |
| • | skill and capability of personnel, including design engineers, manufacturing engineers and technicians, application engineers, and service engineers. |
In addition, semiconductor manufacturers must make a substantial investment to qualify and integrate new equipment into semiconductor production lines. Some manufacturers have announced they will fabricate chips for the 10nm node beginning in 2017 and the 7nm node commencing in 2018, and we have one customer that currently is evaluating implementation of our equipment for both the 10nm and 7nm nodes. Once a semiconductor manufacturer has selected a particular supplier’s equipment and qualified it for production, the manufacturer generally maintains that selection for that specific production application and technology node as long as the supplier’s products demonstrate performance to specification in the installed base. Accordingly, we may experience difficulty in selling to a given manufacturer if that manufacturer has qualified a competitor’s equipment. If, however, that cleaning equipment constrains chip yield, we expect, based on our experience to date, that the manufacturer will evaluate implementing new equipment that cleans more effectively.
We focus on the high-end fabrication market with advanced nodes, and we believe we compete favorably with respect to the factors described above. Most of our competitors offer single-wafer cleaning products using jet spray technology, which has relatively poor particle removal efficiency for random defects less than 30nm in size and presents increased risk of damage to the fragile patterned architectures of wafers at advanced process nodes. Certain of our competitors offer single-wafer cleaning products with megasonic cleaning capability, but we believe these products, which use conventional megasonic technology, are unable to maintain energy dose uniformity on the entire wafer and often lack the ability to repeat the requisite uniform energy dose wafer to wafer in production, resulting in poor efficiency in removing random defects, longer processing time and greater loss of material. In addition, these conventional megasonic products generate transient cavitation, which results in more incidents of damage to wafer structures with feature sizes of 70nm or less. We design our cleaning tools equipped with our proprietary SAPS and TEBO technologies, which we believe offer better performance, including at advanced process nodes of 22nm or less. Moreover, with our operations based in Shanghai, we are well positioned to take advantage of the Chinese government’s policies to develop an independent domestic semiconductor supply chain.
Employees
As of September 30, 2017, we had 187 full-time employees, of whom 23 were in administration, 46 were in manufacturing, 80 were in research and development, and 38 were in sales and marketing and customer services. Of these employees, 179 were located in the PRC, 4 were located in Korea and 4 were based in the United States.
We have never had a work stoppage, and none of our employees are represented by a labor organization or subject to any collective bargaining arrangements. We consider our employee relations to be good.
Facilities
We have occupied our current corporate headquarters in Fremont, California, since February 2008, under a lease that, as amended in March 2017, extends through March 2018. We conduct our research and development and manufacturing and service support operations in a facility of approximately 60,000 square feet, of which 36,000 square feet is dedicated to manufacturing, located in the Zhangjiang Hi-Tech Park in Shanghai, PRC; we have leased this facility since 2007, and our lease, as amended in September 2016, expires in December 2017. In addition, we provide sales support and customer service operations from leased office space in Jiangying, PRC, Wuxi, PRC, and Icheon, Korea.
104
Table of Contents
We believe we can extend or replace our existing lease agreements for our Fremont, California, and Shanghai, PRC, facilities, in each case on acceptable, commercially reasonable terms. We intend to expand our existing facilities as we grow our business and add resources, and we believe that we will be able to obtain, on acceptable, commercially reasonably terms, additional space to accommodate the foreseeable expansion of our operations.
Legal Proceedings
From time to time we may become involved in legal proceedings or may be subject to claims arising in the ordinary course of our business. Although the results of litigation and claims cannot be predicted with certainty, we currently believe that the final outcome of these ordinary course matters will not have a material adverse effect on our business, operating results, financial condition or cash flows. Regardless of the outcome, litigation can have an adverse impact on us because of defense and settlement costs, diversion of management resources and other factors.
105
Table of Contents
Executive Officers, Directors, Director-Elect and Key Advisors
Our executive officers, directors, director-elect and key advisors, and their ages and positions as of September 30, 2017, are set forth below:
| Name |
Age |
Position | ||
| Executive officers: |
||||
| David H. Wang |
55 | Chair of the Board, Chief Executive Officer and President | ||
| Min Xu |
43 | Chief Financial Officer | ||
| Fufa Chen |
56 | Vice President, Sale | ||
| Jian Wang |
52 | Vice President, Research and Development | ||
| Sotheara Cheav |
65 | Vice President, Manufacturing | ||
| Non-employee directors: |
||||
| Haiping Dun(2)(3) |
67 | Lead Director | ||
| Chenming Hu(1)(3) |
70 | Director | ||
| Tracy Liu (1)(2) |
52 | Director | ||
| Director-elect: |
||||
| Yinan Xiang(4) |
42 |
Director-Elect | ||
| Key advisors: |
||||
| Stephen Chiao |
70 |
Member of Advisory Board | ||
| Chenming Hu(1)(3) |
70 | Member of Advisory Board | ||
| Srini Raghavan |
69 |
Member of Advisory Board | ||
| Lip-Bu Tan |
67 |
Member of Advisory Board | ||
| Chiang Yang |
57 |
Member of Advisory Board | ||
| (1) | Member of Audit Committee. |
| (2) | Member of Compensation Committee. |
| (3) | Member of Nominating and Governance Committee. |
| (4) | Yinan Xiang has been appointed as a member of our board of directors effective upon the earlier of the completion of this offering and November 15, 2017. |
Executive Officers
Each executive officer serves at the discretion of the board of directors and holds office until his successor is duly elected and qualified or until his earlier resignation or removal. Jian Wang, the Vice President, Research and Development of ACM Shanghai is the brother of David H. Wang, our Chair of the Board, Chief Executive Officer and President.
David H. Wang is our founder and has served as Chief Executive Officer, President and one of our directors since 1998. Dr. Wang has served as the Chair of the Board since October 2017. Dr. Wang received a Ph.D. and a Master of Engineering from Osaka University in precision engineering and a Bachelor of Science in precision instruments from Tsinghua University. We believe Dr. Wang is qualified to serve as a director due to his extensive experience with semiconductor equipment and manufacturing processes, including as the result of his studies and work at Osaka University, Cincinnati University and CNS Technology, and his extensive knowledge of our company and markets based on his founding and leadership of our company since 1998.
Min Xu has served as our Chief Financial Officer and Treasurer since November 2016. From August 2014 to November 2016 Mr. Xu served as the Chief Financial Officer of UTStarcom Holding Corp., a global telecom infrastructure provider. From April 2014 to June 2014, Mr. Xu was a senior equity research analyst at Roth Capital Partners, LLC. Roth Capital Partners, LLC is the representative of the several underwriters of this offering. From February 2013 to April 2014, Mr. Xu was an equity research analyst with Wedbush Securities and
106
Table of Contents
from 2010 to 2012, Mr. Xu was an equity research analyst with Jeffries & Co. Mr. Xu received a Master of Business Administration from The Fuqua School of Business at Duke University, a Master of Science in electrical engineering from Purdue University, a Master of Science in physics from Colorado State University and a Bachelor of Science in physics from Peking University.
Fufa Chen has served as the Vice President, Sales of ACM Shanghai since 2007. Dr. Chen received a Ph.D. in electrical engineering from the State University of New York, Stony Brook.
Jian Wang has served as the Vice President, Research and Development of ACM Shanghai since January 2015. From January 2011 to January 2015, Mr. Wang was the Director of Research and Development of ACM Shanghai, focusing on the research and development of SFP and ECP technologies. Mr. Wang received a Master of Science in computer science from Northwestern Polytechnic University, a Master of Science in marine engineering from Kobe University and a Bachelor of Science in mechanical engineering from Southeast University.
Sotheara Cheav has served as the Vice President, Manufacturing of ACM Shanghai since January 2015. From 2011 to December 2014, Mr. Cheav served as the Director of Manufacturing of ACM Shanghai. Mr. Cheav received a Bachelor of Science in science and technology from the University of Cambodia and an Associate of Science in electronics from Bay Valley Technical Institute.
Non-employee Directors
Haiping Dun has served as one of our directors since 2003 and Lead Director since October 2017. Dr. Dun retired as a Senior Director from Intel Corporation in 2004, where he had been employed since 1983. In April 2016, Dr. Dun was appointed as the President of Champion Microelectronic Corp, a public company in Taiwan. Dr. Dun has served as a member of the executive board of directors of Champion Microelectronic Corp. since 2004. Dr. Dun received his Ph.D. in material science and engineering from Stanford University, a Master of Science in physics from the University of Washington and a Bachelor of Science in physics from National Taiwan University. We believe Dr. Dun is qualified to serve as a director due to his extensive experience with technology companies, his deep knowledge of our company, and his academic background in physics and material science.
Chenming C. Hu has served as one of our directors since January 2017. Dr. Hu has also served as a member of the board of advisors since May 2016. Since 1976, Dr. Hu has been a professor in electrical engineering and computer sciences at the University of California, Berkeley, where he has been the Taiwan Semiconductor Manufacturing Company Distinguished Chair Professor Emeritus and Professor of the Graduate School since 2010. Dr. Hu also serves on the board of directors of Ambrella, Inc., developer of semiconductor processing solutions for video, and Inphi Corporation, a fabless semiconductor company. Dr. Hu is a member of the U.S. National Academy of Engineering and the Chinese Academy of Sciences, and Taiwan’s Academia Sinica. Dr. Hu received his Master of Science degree and Ph.D. from the University of California, Berkeley and his Bachelor of Science degree from National Taiwan University, all in electrical engineering. We believe Dr. Hu is qualified to serve as a director due to his experience and expertise in semiconductors and related technologies (including FinFET, which he developed in 1999), his experience as the Chief Technology Officer of Taiwan Semiconductor Manufacturing Company Ltd. from 2001 to 2007, and his current and past directorships at other public companies.
Tracy Liu has served as one of our directors since September 2016. Ms. Liu has been the founder and owner of H&M Financial Consulting since 2006, where she provides international accounting and tax solutions to high-technology companies. Ms. Liu has a Bachelor of Science from Nankai University and a Master of Accounting and Tax from Golden Gate University. Ms. Liu is a Certified Public Accountant and is a member of the American Institute of Certified Public Accountants. We believe Ms. Liu is qualified to serve as a director of our company due to her accounting expertise and her extensive experience with our company, including our accounting and finance operations.
107
Table of Contents
Director-Elect
Pursuant to a voting agreement with SSTVC, SSTVC designated Yinan Xiang to our board of directors. Yinan Xiang was appointed as a member of our board effective upon the earlier of the completion of this offering and November 15, 2017. Ms. Xiang has been a General Manager of Shanghai S&T Venture Capital (Group) Co. Ltd. since October 2016, after serving as Manager of the Project Investment Department of Shanghai S&T Venture Capital (Group) Co. Ltd. from September 2014 to September 2016. From February 2012 to August 2014, Ms. Xiang was a Manager of Invest Department II of Shanghai Science and Technology Venture Capital Co., Ltd. Ms. Xiang received a Bachelor degree from Shanghai University of Finance and Economics.
Advisory Board
Our Advisory Board provides management with advice on strategy, industrial trends, organization policies, fundraising, technologies and its related applications.
Stephen Chiao has served as a member of our Advisory Board since December 2016. Since 2009, Dr. Chiao has served as Managing Partner at Sycamore Ventures Inc. Dr. Chiao has a Bachelor of Science degree from the National Cheng Kung University, a Masters in Science from the University of Southern California and a Ph.D. in Materials Science and Engineering from Stanford University.
Chenming C. Hu has served as a member of our Advisory Board since May 2016. For biographical information regarding Dr. Hu, see “—Non-employee Directors” above.
Srini Raghavan has served as a member of our Advisory Board since May 2016. Since 1988 Dr. Raghavan has been a Professor of Materials Science and Engineering at the University of Arizona, Tucson. Also at the University of Arizona, Tucson, Dr. Raghavan has been a Professor of Chemical and Environmental Engineering since 2006 and a Professor of Pharmacy Practice and Science since August 2015. Dr. Raghavan was a member of the Visiting Faculty at the Research and Development Lab of Micron Technology in Boise, Idaho. Dr. Raghavan was a Visiting Professor in the International College of Semiconductor Technology at the National Chiao-Tung University in Hsinchu, Taiwan in August 2015. In July 2014 Dr. Raghavan was an Honorary Professor at the Hebei University of Technology in Tianjin, PRC. Since January 2013 Dr. Raghavan has been a member of the Technical Advisory Board at Product Systems, Inc., specializing in Megasonic Technology for Cleaning and Stripping. Dr. Raghavan received a Bachelor of Science degree in chemistry for the University of Madras, a Bachelor of Education degree in Metallurgy at the Indian Institute of Science in Bangalore, a Master of Science degree in Materials Science and Mineral Engineering from the University of California, Berkeley and a Ph.D. from the University of California, Berkeley.
Lip-Bu Tan has served as a member of our Advisory Board since January 2017. Since 1987 Mr. Tan has served as the founder and Chairman of Walden International, an international venture capital firm. He has also served as President and Chief Executive Officer of Cadence Design Systems, Inc., an electronic design automation software and engineering services company, since 2009. Mr. Tan currently serves on the boards of directors of Cadence Design Systems, Inc., Hewlett Packard Enterprise Company, an information technology enterprise company, Semiconductor Manufacturing International Corporation, a semiconductor manufacturer, and Quantenna Communications, Inc., a wireless communication designer, developer and manufacturer. Mr. Tan holds a B.S. in physics from Nanyang University in Singapore, an M.S. in nuclear engineering from the Massachusetts Institute of Technology, and an M.B.A. from the University of San Francisco.
Chiang Yang has served as a member of our Advisory Board since August 2017, after having served as Senior Strategic Adviser to the President since January 2015. Dr. Yang has worked in the semiconductor industry for 32 years and has significant experience in semiconductor equipment, process development, manufacturing, fab operation, technology transfer and general management. Dr. Yang retired as the General Manager of Intel Mask Operation and Vice President of Technology & Manufacturing Group of Intel Corporation in 2014, where he had been employed since 1984. Dr. Yang’s prior experience included semiconductor equipment development
108
Table of Contents
at Applied Materials, Inc. and research on energy storage devices at Brookhaven National Laboratory. He received a Ph.D. in materials science from Massachusetts Institute of Technology, a Master of Science in physics from Northwestern University, and a Bachelor of Science in physics from the National Taiwan University.
Board of Directors
Our business and affairs are managed under the direction of the board of directors, which is currently composed of four members. Our current directors will continue to serve as directors until their resignations or until their successors are duly elected by the holders of common stock.
Director Nomination Rights
In connection with our sale and issuance of capital stock described in “Management’s Discussion and Analysis of Financial Condition and Results of Operations—Recent Equity Transactions—Acquisition of Outstanding Minority Interests in Our Operating Company” and our sale and issuance of Class A common stock in the concurrent private placement described in “Concurrent Private Placement,” we, and certain other shareholders, have entered into (a) a voting agreement with SSTVC and (b) a nomination and voting agreement with Xinxin (Hongkong) Capital Co., Limited, which agreements will remain in effect after the completion of this offering. Pursuant to these agreements, each of SSTVC and Xinxin (Hongkong) Capital Co., Limited will have the right to designate one individual for nomination to our board of directors. In addition, holders who will have 51.2% of the voting power of common stock immediately after this offering and the concurrent private placement, including David H. Wang, our Chair of the Board, Chief Executive Officer and President, and Haiping Dun, our Lead Director, have agreed to vote their shares for the election of the nominee designated by Xinxin (Hongkong) Capital Co. Limited.
The rights and obligations of the parties under the agreement with:
| • | SSTVC will be in effect as long as SSTVC continues to beneficially own all of the 1,666,170 shares of Class A common stock issued to SSTVC; and |
| • | Xinxin (Hongkong) Capital Co., Limited and its affiliates continue to hold at least 625,000 shares of Class A common stock issued to Xinxin (Hongkong) Capital Co., Limited in the concurrent private placement. |
SSTVC designated Yinan Xiang, who has been appointed as a member of our board of directors effective upon the earlier of the completion of this offering and November 15, 2017. We expect Xinxin (Hongkong) Capital Co., Limited to designate an individual for nomination to our board shortly after the consummation of this offering and the concurrent private placement.
Independent Directors
We have applied to list Class A common stock on the NASDAQ Global Market. Under NASDAQ rules, independent directors must comprise a majority of a listed company’s board of directors within twelve months from the date of listing. In addition, NASDAQ rules require that, subject to specified exceptions, each member of a listed company’s audit, compensation and nominating and governance committees be independent within twelve months from the date of listing. Audit committee members must also satisfy additional independence criteria, including those set forth in Rule 10A-3 under the Securities Exchange Act, and compensation committee members must also satisfy additional independence criteria, including those set forth in Rule 10C-1 of the Securities Exchange Act. Under NASDAQ rules, a director will qualify as an “independent director” only if, in the opinion of that company’s board of directors, that person does not have a relationship that would interfere with the exercise of independent judgment in carrying out the responsibilities of a director. In order to be considered independent for purposes of Rule 10A-3 under the Securities Exchange Act, a member of an audit committee of a listed company may not, other than in his or her capacity as a member of the audit committee, the board of directors or any other board committee: (a) accept, directly or indirectly, any consulting, advisory or
109
Table of Contents
other compensatory fee from the listed company or any of its subsidiaries, other than compensation for board service; or (b) be an affiliated person of the listed company or any of its subsidiaries. In order to be considered independent for purposes of Rule 10C-1 under the Securities Exchange Act, each member of the compensation committee must be a member of the board of directors of the listed company, and must otherwise be independent. In determining independence requirements for members of compensation committees, the national securities exchanges and national securities associations shall consider relevant factors, including: (x) the source of compensation of a member of the board of a listed company, including any consulting, advisory or other compensatory fee paid by the listed company to such member of the board; and (y) whether a member of the board of a listed company is affiliated with the listed company, a subsidiary of the listed company or an affiliate of a subsidiary of the listed company.
In October 2017 the board undertook a review of its composition and that of its committees, as well as the independence of each director that will serve following the consummation of this offering. Based upon information requested from and provided by each director concerning his background, employment and affiliations, including family relationships, the board has determined that each of Chenming Hu, Haiping Dun and Tracy Liu qualify as independent directors in accordance with the rules of NASDAQ and Rules 10C-1 and 10A-3 under the Securities Exchange Act. The independent members of the board will hold separate regularly scheduled executive session meetings at which only independent directors are present.
Board of Directors
So long as the outstanding shares of Class B common stock represent a majority of the combined voting power of common stock, we will not have a classified board of directors, and all directors will be elected for annual terms. If outstanding shares of Class B common stock represent less than a majority of the combined voting power of common stock at any time, we thereafter would have a classified board consisting of three classes of approximately equal size, each serving staggered three-year terms. Our directors would be assigned by the then-current board of directors to a class.
If and when the board is classified, upon expiration of the term of a class of directors, directors for that class would be elected for three-year terms at the annual meeting of stockholders in the year in which that term expires. As a result, only one class of directors would be elected at each annual meeting of our stockholders, with the other classes continuing for the remainder of their respective three-year terms. Each director’s term would continue until the election and qualification of his or her successor or his or her earlier death, resignation, or removal. Our restated charter provides that our directors may be removed with or without cause only by the affirmative vote of the holders of at least two-thirds of the votes that all of the stockholders would be entitled to cast in any annual election of directors.
So long as the board is classified, only the board could fill vacancies on the board. Any additional directorships resulting from an increase in the number of directors would be distributed among the three classes so that, as nearly as possible, each class would consist of one-third of the total number of directors.
The classification of the board might have the effect of delaying or preventing changes in our control or management. See “Description of Capital Stock—Anti-Takeover Provisions—Restated Charter and Bylaw Provisions.”
Board Leadership Structure
The board of directors recognizes that it is important to determine an optimal board leadership structure to ensure the independent oversight of management as the company continues to grow. We do not have a policy on whether the offices of Chair of the Board and Chief Executive Officer should be separate and, if they are to be separate, whether the Chair of the Board should be selected from among the independent directors or should be
110
Table of Contents
an employee. Our board has determined that it is in our best interests to have both a Chair of the Board and a Lead Director. Our board has appointed David H. Wang, our Chief Executive Officer and President, to serve as Chair of the Board and Haiping Dun, an independent director, to serve as Lead Director. Among other things, the Chair of the Board shall prepare agendas for, and preside over, meetings of the board and the Lead Director shall assist the Chair of the Board in preparing agendas and shall serve as the principal liaison between the Chair of the Board and the other directors. Our board believes that this is the appropriate leadership structure for us at this time and will allow the board to fulfill its role with appropriate independence.
The board has concluded that our current leadership structure is appropriate at this time. However, the board will continue to periodically review our leadership structure and may make such changes in the future as it deems appropriate.
Board Oversight of Risk
The board of directors has responsibility for the oversight of our risk management processes and, either as a whole or through its committees, regularly discusses with management our major risk exposures, their potential impact on our business and the steps we take to manage them. The risk oversight process includes receiving regular reports from board committees and members of senior management to enable the board to understand our risk identification, risk management and risk mitigation strategies with respect to areas of potential material risk, including operations, finance, legal, regulatory, strategic and reputational risk.
The audit committee of the board reviews information regarding liquidity and operations, and oversees our management of financial risks. Periodically, the audit committee reviews our policies with respect to risk assessment, risk management, loss prevention and regulatory compliance. Oversight by the audit committee includes direct communication with our external auditors, and discussions with management regarding significant risk exposures and the actions management has taken to limit, monitor or control such exposures. The compensation committee is responsible for assessing whether any of our compensation policies or programs has the potential to encourage excessive risk-taking. The nominating and governance committee of the board manages risks associated with the independence of the board, corporate disclosure practices and potential conflicts of interest. While each committee is responsible for evaluating certain risks and overseeing the management of such risks, the entire board is regularly informed through committee reports about such risks. Matters of significant strategic risk are considered by the board as a whole.
Code of Business Conduct
The board of directors adopted a code of business conduct that applies to each of our directors, officers and employees, including our principal executive officer, principal financial officer, principal accounting officer or controller and persons performing similar functions. The code addresses various topics, including:
| • | compliance with applicable laws, rules and regulations; |
| • | conflicts of interest; |
| • | public disclosure of information; |
| • | insider trading; |
| • | corporate opportunities; |
| • | competition and fair dealing; |
| • | discrimination, harassment and retaliation; |
| • | record-keeping; |
| • | confidentiality; |
111
Table of Contents
| • | protection and proper use of company assets; and |
| • | reporting illegal and unethical behavior. |
Prior to the completion of this offering, the code of business conduct will be posted on the Investor Relations section of our website, which is located at www.acmrcsh.com. Any waiver of the code of business conduct for an executive officer or director may be granted only by the board or a committee thereof and must be timely disclosed as required by applicable law. We intend to disclose future amendments to certain provisions of our code of business conduct, or waivers of those provisions, applicable to any principal executive officer, principal financial officer, principal accounting officer or controller, or persons performing similar functions on our website, www.acmrcsh.com.
We have implemented whistleblower procedures, which establish format protocols for receiving and handling complaints from employees. Any concerns regarding accounting or auditing matters reported under these procedures will be communicated promptly to the audit committee.
Board Committees
We have established an audit committee, a compensation committee and a nominating and governance committee. Prior to the completion of this offering, the composition of these committees will meet the criteria for independence under, and the functioning of these committees will comply with the applicable requirements of the rules of NASDAQ and SEC rules and regulations. We intend to comply with future requirements as they become applicable to us.
Each committee operates under a charter that has been approved by the board of directors. Prior to the completion of this offering, copies of each committee’s charter will be posted on the Investor Relations section of our website, which is located at www.acmrcsh.com. Each committee has the composition and responsibilities described below. The board may from time to time establish other committees.
Audit Committee
The members of the audit committee are Chenming Hu and Tracy Liu, each of whom is a non-employee member of the board of directors. Tracy Liu serves as the chair of the audit committee. It is expected that Yinan Xiang may be elected to the audit committee upon joining the board. The audit committee’s main function is to oversee our accounting and financial reporting processes, internal systems of control, independent registered public accounting firm relationships and the audits of our consolidated financial statements. Pursuant to the audit committee charter, the functions of the committee include, among other things:
| • | appointing, approving the compensation of, and assessing the independence of our registered public accounting firm; |
| • | overseeing the work of our registered public accounting firm, including through the receipt and consideration of reports from such firm; |
| • | reviewing and discussing with management and the registered public accounting firm our annual and quarterly financial statements and related disclosures; |
| • | monitoring our internal control over financial reporting and our disclosure controls and procedures; |
| • | meeting independently with our registered public accounting firm and management; |
| • | furnishing the audit committee report required by SEC rules; |
| • | reviewing and reassessing the adequacy of our conflict of interest policy; and |
| • | overseeing our risk assessment and risk management policies. |
112
Table of Contents
All members of the audit committee meet the requirements for financial literacy under the applicable rules and regulations of the SEC and NASDAQ. The board has determined that Tracy Liu is an “audit committee financial expert” as defined by applicable SEC rules and has the requisite financial sophistication as defined under the applicable NASDAQ rules and regulations.
The board has determined that each of Chenming Hu and Tracy Liu is independent under the applicable rules and regulations of NASDAQ, is a “non-employee director” as defined in Rule 16b-3 promulgated under the Securities Exchange Act and is an “outside director” as that term is defined in Internal Revenue Code Section 162(m).
Compensation Committee
The members of the compensation committee are Haiping Dun and Tracy Liu. Haiping Dun serves as the chair of the compensation committee. The compensation committee reviews and recommends policies relating to compensation and benefits of our officers and employees. Pursuant to the compensation committee charter, the functions of this committee include, among other things:
| • | evaluating the performance of our chief executive officer and determining the chief executive officer’s salary and contingent compensation based on his or her performance and other relevant criteria; |
| • | identifying the corporate and individual objectives governing the chief executive officer’s compensation; |
| • | approving the compensation of our other executive officers; |
| • | making recommendations to the board of directors with respect to director compensation; |
| • | reviewing and approving the terms of certain material agreements; |
| • | overseeing and administering our equity incentive plans and employee benefit plans; |
| • | preparing the annual compensation committee report required by SEC rules; and |
| • | conducting a review of executive officer succession planning, as necessary, reporting its findings and recommendations to the board, and working with the board in evaluating potential successors to executive officer positions. |
In accordance with NASDAQ listing standards, the board has granted the compensation committee the authority and responsibility required under Rules 10C-1(b)(2), (3) and (4) of the Securities Exchange Act, relating to the authority to retain or obtain the advice of compensation consultants, legal counsel and other compensation advisers, the authority to fund such advisers, and the responsibility to consider the independence factors specified under Rules 10C-1(b)(4)(i) through (vi) and any additional factors the compensation committee deems relevant.
The board has determined that each of Haiping Dun and Tracy Liu is independent under the applicable rules and regulations of NASDAQ, is a “non-employee director” as defined in Rule 16b-3 promulgated under the Securities Exchange Act and is an “outside director” as that term is defined in Internal Revenue Code Section 162(m).
Nominating and Governance Committee
The members of the nominating and governance committee are Chenming Hu and Haiping Dun. Chenming Hu serves as the chair of the nominating and governance committee. Pursuant to the nominating and governance committee charter, the functions of this committee include, among other things:
| • | identifying, evaluating, and making recommendations to the board of directors and our stockholders concerning nominees for election to the board, to each of the board’s committees and as committee chairs; |
113
Table of Contents
| • | annually reviewing the performance and effectiveness of the board and developing and overseeing a performance evaluation process; |
| • | annually evaluating the performance of management, the board and each board committee against their duties and responsibilities relating to corporate governance; |
| • | annually evaluating adequacy of our corporate governance structure, policies and procedures; and |
| • | providing reports to the board regarding the committee’s nominations for election to the board and its committees. |
Compensation Committee Interlocks and Insider Participation
None of the members of the compensation committee is or has in the past served as an officer or employee of our company. None of our executive officers currently serves, or in the past year has served, as a member of the board of directors or compensation committee of any entity that has one or more executive officers serving on the board of directors or compensation committee.
Limitations on Liability and Indemnification Matters
Insofar as indemnification for liabilities arising under the Securities Act may be permitted to our directors, officers or controlling persons, we have been informed that in the opinion of the SEC such indemnification is against public policy as expressed in the Securities Act and is therefore unenforceable.
114
Table of Contents
Fiscal Year 2016 Director Compensation
In 2016 we did not have an established policy with regard to cash or equity-based compensation of non-employee members of the board of directors. Under our 2016 Omnibus Incentive Plan, or the 2016 Plan, pursuant to which we intend to issue awards beginning with the effective date of this offering, the maximum number of shares subject to equity awards, and the maximum size of performance cash awards, that may be granted or paid to participants in any calendar year is limited, as set forth in more detail under “Executive Compensation—Equity Plans” below.
During 2016, our non-employee directors did not receive any cash compensation or stock awards for their service on the board or committees of the board, except that Tracy Liu was granted the option to purchase 50,000 shares of the Class A common stock in December 2016. The following table presents certain information with respect to the compensation of our non-employee directors in 2016:
| Name |
Option Awards($)(1) | Total($)(1) | ||||||
| Haiping Dun |
$ | — | $ | — | ||||
| Tracy Liu |
114,000 | 114,000 | ||||||
| (1) | Amounts represent the aggregate grant date fair value of option awards granted during the year ended December 31, 2016, computed in accordance with FASB ASC Topic 718. See note 2 to our consolidated financial statements included at the end of this prospectus for a discussion of the assumptions made by us in determining the grant date fair value of our equity awards. |
David H. Wang, our sole executive officer who served as a member of the board during 2016, did not receive any additional compensation for such service as a director.
Director Compensation Policy
In October 2017 we adopted a policy with respect to the compensation payable to certain of our non-employee directors, which will become effective upon the completion of this offering. Under this policy, each qualifying non-employee director will be eligible to receive compensation for his or her board and committee service consisting of annual cash retainers and equity awards. Our qualifying non-employee directors will receive the following annual retainers for their service:
| Position |
Retainer | |||
| Lead Director |
$ | 20,000 | ||
| Other Directors |
15,000 | |||
| Audit Committee Chair |
4,000 | |||
| Other Audit Committee Members |
3,000 | |||
| Compensation Committee Chair |
4,000 | |||
| Other Compensation Committee Members |
3,000 | |||
| Nominating and Governance Committee Chair |
4,000 | |||
| Other Nominating and Governance Committee Members |
3,000 | |||
Equity awards for qualifying non-employee directors will consist of (i) an initial equity award with a value of $75,000, upon initial election to our board of directors, subject to vesting and to such director’s continued service on our board of directors, and (ii) annual equity awards with a value of $35,000, subject to vesting and to such director’s continued service on our board of directors.
Directors may be reimbursed for reasonable out-of-pocket expenses incurred in attending board and committee meetings.
115
Table of Contents
Summary Compensation Table
The following table provides information concerning the compensation paid for 2016 and 2015 to our “named executive officers,” who consist of our Chief Executive Officer and President, our Treasurer and Chief Financial Officer and Treasurer and our other most highly compensated executive officer during 2016.
| Name and Principal Position |
Year | Salary ($)(1) |
Bonus ($)(1) |
Option Awards ($)(2) |
All Other Compensation ($)(1)(3) |
Total ($) |
||||||||||||||||||
| David H. Wang |
2016 | $ | 171,364 | (4) | $ | 7,837 | $ | 760,000 | $ | 10,840 | $ | 950,041 | ||||||||||||
| Chief Executive Officer and President |
2015 | 176,008 | (5) | 51,974 | 600,000 | 7,707 | 835,689 | |||||||||||||||||
| Min Xu(6) |
2016 | 19,696 | — | 228,000 | 13,555 | 261,251 | ||||||||||||||||||
| Chief Financial Officer and Treasurer |
2015 | — | — | — | — | — | ||||||||||||||||||
| Fufa Chen |
2016 | 153,600 | (7) | 7,516 | — | 10,840 | 171,956 | |||||||||||||||||
| Vice President, Sales of ACM Shanghai |
2015 | 160,339 | (8) | 25,530 | 50,000 | 7,707 | 243,276 | |||||||||||||||||
| (1) | Except as otherwise indicated, compensation amounts were paid in RMB and have been converted to U.S. dollars for purposes of the table. The RMB per U.S. dollar exchange rate used for such conversion reflects the average exchange rate during 2016 and 2015, as appropriate. |
| (2) | Represents the aggregate grant date fair value of option awards granted during 2016 and 2015, computed in accordance with FASB ASC Topic 718, Compensation—Stock Compensation. See note 2 to our consolidated financial statements included at the end of this prospectus for a discussion of the assumptions we made in determining the grant date fair value of our equity awards. |
| (3) | Amounts reflect a housing subsidy paid by us. |
| (4) | Reflects a base salary of 1,138,248 RMB. |
| (5) | Reflects a base salary of 1,096,248 RMB. |
| (6) | Mr. Xu was appointed effective November 14, 2016. |
| (7) | Reflects a base salary of 1,020,252 RMB. |
| (8) | Reflects a base salary of 998,652 RMB. |
Narrative Explanation of Certain Aspects of the Summary Compensation Table
The compensation paid to our named executive officers consists of the following components:
| • | base salary; |
| • | performance-based cash bonuses; |
| • | long-term incentive compensation in the form of stock options; and |
| • | benefits consisting of housing subsidies paid by us. |
Base Salaries
Annual base salaries of our named executive officers in 2017 were as follows: David H. Wang, $169,192 (1,156,260 RMB); Fufa Chen, $151,879 (1,038,264 RMB); and Min Xu, $150,000. Annual base salaries of our named executive officers in 2016 were as follows: David H. Wang, $171,364 (1,138,248 RMB); Fufa Chen, $153,600 (1,020,252 RMB); and Min Xu, $115,000. For 2015, the annual base salaries for our named executive officers were as follows: David H. Wang, $176,008 (1,096,248 RMB); and Fufa Chen, $160,339 (998,652 RMB).
116
Table of Contents
Performance-Based Bonuses
We do not have any established policy with regard cash incentive bonuses for our executive officers. The compensation committee may decide to pay cash incentive bonuses to compensate executive officers for the achievement of specific business objectives, profitability, and individual performance and objectives established by the compensation committee.
Stock Options
We offer stock options to our employees, including our named executive officers, as the long-term incentive component of our compensation program. Our stock options allow our employees to purchase shares of the Class A common stock at a price equal to the fair market value of the Class A common stock on the date of grant. Our stock options granted to newly hired employees generally vest as to 25% of the total number of option shares on the first anniversary of the award and in equal monthly installments over the following 36 months.
For information regarding the vesting acceleration provisions applicable to the options held by our named executive officers, please see “—Severance Benefits” and “—Change in Control Benefits” below.
Grants of Plan-Based Awards
The following table sets forth information regarding grants of compensation in the form of plan-based awards made during 2016 to our named executive officers who were granted plan-based awards in 2016:
| Name |
Grant Date | All Other Option Awards: Number of Securities Underlying Options(#) |
Exercise or Base Price of Option Awards ($/share) |
Grant Date Fair Value of Option Awards($) |
||||||||||||
| David H. Wang |
12/28/2016 | 333,334 | $ | 3.00 | $ | 2.28 | ||||||||||
| Min Xu |
12/28/2016 | 100,000 | 3.00 | 2.28 | ||||||||||||
Outstanding Equity Awards at 2016 Fiscal Year-End
The following table sets forth information regarding each unexercised option held by each of our named executive officers as of December 31, 2016:
| Option Awards | ||||||||||||||||
| Number of Securities Underlying Unexercised Options |
Option | |||||||||||||||
| Name |
Exercisable(#) | Unexercisable(#) | Exercise Price($) | Expiration Date | ||||||||||||
| David H. Wang |
166,667 | — | $ | 0.75 | 09/21/2017 | |||||||||||
| 166,667 | — | 0.75 | 05/01/2021 | |||||||||||||
| 133,334 | — | 0.75 | 05/01/2021 | |||||||||||||
| 158,333 | 241,667 | 1.50 | 05/01/2025 | |||||||||||||
| — | 333,334 | 3.00 | 12/27/2026 | |||||||||||||
| Min Xu |
100,000 | — | 3.00 | 11/14/2026 | ||||||||||||
| Fufa Chen |
33,334 | — | 0.75 | 05/01/2021 | ||||||||||||
| 13,195 | 20,139 | 1.50 | 05/01/2025 | |||||||||||||
For information regarding the vesting acceleration provisions applicable to the options held by our named executive officers, please see “—Severance Benefits” and “—Change in Control Benefits” below.
Employee Benefits and Perquisites
Our named executive officers are eligible to participate in our health and welfare plans to the same extent as all full-time employees would be eligible generally. We do not provide our named executive officers with perquisites or other personal benefits.
117
Table of Contents
Executive Retention Agreement
We entered into an executive retention agreement with Min Xu upon his hiring in November 2016. The executive retention agreement generally provides that if we terminate Mr. Xu’s employment without cause or if he terminates his employment for good reason, he will be entitled to receive, within thirty days after the date of termination, a cash payment equal to the sum of:
| • | accrued base salary, commission and vacation pay; and |
| • | an amount equal to his then-current annual base salary. |
The executive retention agreement provides that Mr. Xu will be entitled to continue to receive specified benefits for 12 months after the termination date.
The executive retention agreement contains provisions applicable in the event payments due under the agreement would result in tax penalties under Sections 280G and 4999 of the U.S. Internal Revenue Code. Those sections may impose tax penalties on our company or Mr. Xu if the amount of severance payments due to him following a Change in Ownership or Control (as defined in the Internal Revenue Code) exceeds certain limits. Under the provisions of the executive retention agreement, the amount of the benefits that Mr. Xu will be entitled to receive under the executive retention agreement will be reduced by an amount necessary to avoid triggering any penalty taxes if, and only if, the reduction would result in greater net after-tax benefits to Mr. Xu.
Equity Plans
2016 Omnibus Incentive Plan
The board of directors adopted the 2016 Plan on December 28, 2016, and we expect our stockholders to approve the 2016 Plan prior to the completion of this offering. The 2016 Plan became effective immediately on adoption.
Share Reserve. Initially a total of 2,333,334 shares of Class A common stock were available for issuance under the 2016 Plan. As of September 30, 2017, options exercisable for an aggregate of 1,606,064 shares of Class A common stock had been granted under the 2016 Plan and were outstanding, 21,887 shares of Class A common stock had been issued upon exercises of options granted under the 2016 Plan, and 705,383 shares of Class A common stock remained available for issuance under the 2016 Plan. The number of shares of Class A common stock reserved for issuance under the 2016 Plan will be increased automatically on the first business day of each of our fiscal years during the term of the plan, commencing in 2018, by a number equal to the smallest of:
| • | 4% of the number of shares of Class A and Class B common stock outstanding on December 31 of the prior year; and |
| • | the number of shares Class A common stock determined by the board. |
In general, to the extent that any awards under the 2016 Plan are settled in cash or are forfeited, terminate, expire or lapse without the issuance of shares, or if we repurchase the shares subject to awards granted under the 2016 Plan, those shares will again become available for issuance under the 2016 Plan, as will shares applied to pay the exercise or purchase price of an award or to satisfy tax withholding obligations related to any award. All share numbers described in this summary of the 2016 Plan will automatically adjust in the event of a stock split, a stock dividend or a reverse stock split.
Administration. The 2016 Plan may be administered by the board or its compensation committee. The compensation committee, in its discretion, selects the individuals to whom awards may be granted, the time or times at which such awards are granted, and the terms of such awards.
118
Table of Contents
Eligibility. Awards may be granted under the 2016 Plan to officers, employees, consultants and advisors of our company and our affiliates and to non-employee directors of our company. Incentive stock options may be granted only to employees of our company or our subsidiaries.
Adjustments. We will equitably adjust the number and kind of securities for which stock options and other stock-based awards may be made under the 2016 Plan, including any individual award limits under the 2016 Plan, if certain changes in Class A common stock occur by reason of any recapitalization, reclassification, stock split, reverse split, combination of shares, exchange of shares, stock dividend or other distribution payable in stock, or other increase or decrease in the common stock without receipt of consideration by us, or if there occurs any spin-off, split-up, extraordinary cash dividend or other distribution of our assets. In addition, we will equitably adjust the number and kind of securities subject to any outstanding awards and the exercise price of any outstanding stock options or SARs if there occurs any spin-off, split-up, extraordinary cash dividend or other distribution of our assets.
Types of Awards. The 2016 Plan permits the granting of any or all of the following types of awards:
| • | Stock Options. Stock options entitle the holder to purchase a specified number of shares of Class A common stock at a specified price (the exercise price), subject to the terms and conditions of the stock option grant. The compensation committee may grant either incentive stock options, which must comply with Internal Revenue Code Section 422, or nonqualified stock options. The compensation committee sets exercise prices and terms, except that stock options must be granted with an exercise price not less than 100% of the fair market value of the common stock on the date of grant (excluding stock options granted in connection with assuming or substituting stock options in acquisition transactions). Unless the compensation committee determines otherwise, fair market value means, as of a given date, the closing price of the Class A common stock on that date. At the time of grant, the compensation committee determines the terms and conditions of stock options, including the quantity, exercise price, vesting periods, term (which cannot exceed ten years) and other conditions on exercise. |
| • | Stock Appreciation Rights. The compensation committee may grant SARs, as a right in tandem with the number of shares underlying stock options granted under the 2016 Plan or as a freestanding award. Upon exercise, SARs entitle the holder to receive payment per share in stock or cash, or in a combination of stock and cash, equal to the excess of the share’s fair market value on the date of exercise over the grant price of the SAR. The grant price of a tandem SAR is equal to the exercise price of the related stock option and the grant price for a freestanding SAR is determined by the compensation committee in accordance with the procedures described above for stock options. Exercise of a SAR issued in tandem with a stock option will reduce the number of shares underlying the related stock option to the extent of the SAR exercised. The term of a freestanding SAR cannot exceed ten years, and the term of a tandem SAR cannot exceed the term of the related stock option. |
| • | Restricted Stock, RSUs and Other Stock-Based Awards. The compensation committee may grant awards of restricted stock, which are shares of Class A common stock subject to specified restrictions, and RSUs, which represent the right to receive shares of the Class A common stock in the future. These awards may be made subject to repurchase, forfeiture or vesting restrictions at the compensation committee’s discretion. The restrictions may be based on continuous service with our company or the attainment of specified performance goals, as determined by the compensation committee. RSUs may be paid in stock, cash, or a combination of stock and cash, as determined by the compensation committee. The compensation committee may also grant other types of equity or equity-based awards subject to the terms of the 2016 Plan and any other terms and conditions determined by the compensation committee. |
Performance Awards. The compensation committee may grant performance awards, which entitle participants to receive a payment from us, the amount of which is based on the attainment of performance goals established by the compensation committee over a specified award period. Performance awards may be
119
Table of Contents
denominated in shares of Class A common stock or in cash, and may be paid in stock, cash, or a combination of stock and cash, as determined by the compensation committee. Cash-based performance awards include annual incentive awards.
Clawback. All cash and equity awards granted under the 2016 Plan will be subject to the requirements of all applicable laws and any company policy regarding the recovery of erroneously awarded compensation, including under Section 954 of the Dodd-Frank Wall Street Reform and Consumer Protection Act, and the implementing rules and regulations under such Act. Awards granted under the 2016 Plan may also be subject to forfeiture or repayment if a recipient breaches a non-competition, non-solicitation, non-disclosure, non-disparagement or other restrictive covenant set forth in an award agreement or any other agreement, between the recipient and our company.
Performance-Based Compensation Under Section 162(m). Under Internal Revenue Code Section 162(m), we generally are prohibited from deducting compensation paid to our principal executive officer and our three other most highly compensated executive officers (other than our principal financial officer) in excess of $1 million per person in any year. However, compensation that qualifies as “performance-based” is not subject to the $1 million limit.
| • | If the compensation committee intends to qualify an award under the 2016 Plan as “performance-based” compensation under Internal Revenue Code Section 162(m), the performance goals selected by the compensation committee may be based on the attainment of specified levels of one, or any combination, of the following performance criteria: (a) cash flow; (b) earnings per share, as adjusted for any stock split, stock dividend or other recapitalization; (c) earnings measures; (d) return on equity; (e) total stockholder return; (f) share price performance, as adjusted for any stock split, stock dividend or other recapitalization; (g) return on capital; (h) revenue; (i) income; (j) profit margin; (k) return on operating revenue; (l) brand recognition or acceptance; (m) customer satisfaction; (n) productivity; (o) expense targets; (p) market share; (q) cost control measures; (r) balance sheet metrics; (s) strategic initiatives; (t) implementation, completion or attainment of measurable objectives with respect to recruitment or retention of personnel or employee satisfaction; or (u) any other business criteria established by the board. The compensation committee can also select any derivations of these business criteria (for example, income may include pre-tax income, net income or operating income). |
| • | Performance goals may, in the discretion of the compensation committee, be established on a company-wide basis, or with respect to one or more business units, divisions, subsidiaries or business segments, as applicable. Performance goals may be absolute or relative to the performance of one or more comparable companies or indices or based on year-over-year growth. |
| • | The compensation committee may determine at the time that the performance goals are established the extent to which measurement of performance goals may exclude the impact of charges for restructuring, discontinued operations and other extraordinary, unusual or non-recurring items, and the cumulative effects of tax or accounting changes. |
| • | In addition, compensation realized from the exercise of options and SARs granted under the 2016 Plan is intended to meet the requirements of the performance-based compensation exception under Internal Revenue Code Section 162(m). These awards must have an exercise price equal at least to fair market value at the date of grant and be granted to covered individuals by a compensation committee consisting of at least two outside directors, and the 2016 Plan must (and does) limit the number of shares that may be the subject of awards granted to any individual during any calendar year. |
Transferability. Awards are not transferable other than by will or the laws of descent and distribution, except that in certain instances transfers may be made to or for the benefit of designated family members of the participant for no value.
120
Table of Contents
Changes in Control. Under the 2016 Plan, in the event of a change in control, except as provided for in an individual award agreement, the board of directors may provide for any one or more of the following actions, which may not be the same for all participants:
| • | The board may provide for the acceleration of the exercisability, vesting and/or settlement of each or any outstanding award or portion thereof upon such terms and conditions as determined by the board, including a participant’s termination of employment in connection with or following a change in control. |
| • | The surviving, continuing, successor or purchasing corporation may either assume or continue our company’s rights and obligations under each or any award or substitute for each or any such outstanding award. The board may cancel any award that is neither assumed or continued by the acquiror in connection with the change in control nor exercised or settled as of the time of consummation of the change in control. |
| • | The board may provide that each or any outstanding award shall be canceled in exchange for a payment with respect to each vested share subject to such canceled award in (a) cash, (b) stock of our company or of a corporation or other business entity a party to the change in control or (c) other property. The payment shall be in an amount having a fair market value equal to the fair market value of the consideration to be paid per share in the change in control, reduced by the exercise or purchase price per share, if any, under such award. |
“Change in control” is defined under the 2016 Plan and requires consummation of the applicable transaction.
Term, Termination and Amendment of 2016 Plan. Unless terminated earlier by the board of directors, the 2016 Plan will terminate, and no further awards may be granted, ten years after the date on which it is approved by our stockholders. The board may amend, suspend or terminate the 2016 Plan at any time, except that, if required by applicable law, regulation or stock exchange rule, stockholder approval will be required for any amendment. The amendment, suspension or termination of the 2016 Plan or the amendment of an outstanding award generally may not, without a participant’s consent, materially impair the participant’s rights under an outstanding award.
Non-Qualified Stock Option Agreements
The board of directors or its compensation committee issued stock options pursuant to non-qualified stock option agreements between 2007 and 2015.
Shares Issued. As of September 30, 2017, options to purchase 1,603,342 shares of Class A common stock were outstanding pursuant to such non-qualified stock option agreements.
Administration. The board of directors or its compensation committee selected the individuals to whom options pursuant to such non-qualified stock option agreements were granted, the time or times at which such options were granted, and the terms of such options.
Eligibility. Officers, employees, consultants and advisors of our company and our affiliates and to non-employee directors of our company were eligible to receive stock option grants pursuant to such non-qualified stock option agreements.
Adjustments. We will equitably adjust the number and kind of securities for which options may be made under pursuant to such non-qualified stock option agreements if certain changes in the common stock occur by reason of any merger, consolidation, reorganization, recapitalization, stock dividend, non-cash dividend, stock split, liquidating dividend, combination of shares, exchange or shares, or other change in corporate structure.
121
Table of Contents
Types of Awards. The board of directors or its compensation committee set the terms of such non-qualified stock option agreements, including the quantity, exercise price, vesting periods, term (which does not exceed ten years) and other conditions on exercise.
Transferability. Nonqualified stock options may be transferred pursuant to a qualified domestic relations order.
Corporate Transaction. In the event of a corporate transaction (such as a merger, consolidation, or a sale or transfer of all or substantially all of our assets), the surviving company must assume or substitute new awards for any outstanding options. If the surviving company refuses to do so, outstanding options shall terminate if not exercised before the corporate transaction.
Amendment. The amendment of an outstanding non-qualified stock option generally may not, without a participant’s consent, alter or impair the participant’s rights under an outstanding option.
1998 Stock Option Plan
The board of directors adopted our 1998 Stock Option Plan, or the 1998 Plan, in April 1998. The 1998 Plan was amended by the board in May 1999, December 2001 and March 2004, and those amendments were approved by our stockholders. The 1998 Plan expired by its terms in March 2014. No additional options may be granted pursuant to the 1998 Plan, but the 1998 Plan will continue to govern the terms and conditions of the outstanding options previously granted thereunder.
Share Reserve. At the time of the 1998 Plan’s expiration, a total of 766,667 shares of common stock had been authorized. As of September 30, 2017, options to purchase 66,668 shares of Class A common stock remained outstanding under the 1998 Plan.
Administration. The 1998 Plan may be administered by the board of directors or its compensation committee (the plan administrator). The plan administrator, in its discretion, selected the individuals to whom options may be granted, the time or times at which such options are granted, and the terms of such options.
Eligibility. Officers, employees, consultants and advisors of our company and our affiliates and to non-employee directors of our company were eligible to receive stock option grants under the 1998 Plan.
Adjustments. We will equitably adjust the number and kind of securities for which options may be made under the 1998 Plan if certain changes in the common stock occur by reason of any merger, consolidation, reorganization, recapitalization, stock dividend, non-cash dividend, stock split, liquidating dividend, combination of shares, exchange or shares, or other change in corporate structure.
Types of Awards. The 1998 Plan permits the granting of stock options, which entitle the holder to purchase a specified number of shares of common stock at a specified price (the exercise price), subject to the terms and conditions of the stock option grant. The plan administrator sets exercise prices and terms. At the time of grant, the plan administrator determines the terms and conditions of stock options, including the quantity, exercise price, vesting periods, term (which cannot exceed ten years) and other conditions on exercise.
Transferability. Incentive stock options are not transferable other than by will or the laws of descent and distribution. Nonqualified stock options may be transferred pursuant to a qualified domestic relations order.
Corporate Transaction. Under the 1998 Plan, in the event of a corporate transaction (such as a merger, consolidation, or a sale or transfer of all or substantially all of our assets), the surviving company must assume or substitute new awards for any outstanding options. If the surviving company refuses to do so, outstanding options shall terminate if not exercised before the corporate transaction.
122
Table of Contents
Term, Termination and Amendment. By its terms, the 1998 Plan terminated in March 2014, and no further options have been granted under the 1998 Plan since that time. The 1998 Plan will continue to govern the terms and conditions of the outstanding options previously granted thereunder. The amendment of an outstanding option generally may not, without a participant’s consent, alter or impair the participant’s rights under an outstanding option.
123
Table of Contents
The following is a description of transactions since January 1, 2014 to which we have been a party, in which the amount involved exceeded or will exceed $120,000, and in which any of our directors, executive officers or beneficial owners of more than 5% of any series or class of our preferred or common stock, or an affiliate or immediate family member thereof, had or will have a direct or indirect material interest, other than compensation, termination and change-in-control arrangements.
All of the transactions set forth below were approved by a majority of the board of directors, including a majority of the independent and disinterested members of the board. We believe we have executed all of the transactions set forth below on terms no less favorable to us than we could have obtained from unaffiliated third parties. It is our intention to ensure that all future transactions between us and our officers, directors and principal stockholders and their affiliates are approved by the audit committee and a majority of the members of the board, including a majority of the independent and disinterested members of the board, and are on terms no less favorable to us than those that we could obtain from unaffiliated third parties.
Issuance of Warrant
In December 2016 Shengxin (Shanghai) Management Consulting Limited Partnership, or SMC, paid 20,123,500 RMB (approximately $3.0 million as of the date of funding) to ACM Shanghai for potential investment pursuant to terms to be subsequently negotiated. SMC is a PRC limited partnership owned by Jian Wang, our Vice President, Research and Development and the brother of our Chief Executive Officer and President, David H. Wang, and other employees of ACM Shanghai. Jian Wang is also the general partner of SMC. In March 2017 we issued to SMC a warrant exercisable to purchase 397,502 shares of Class A common stock at a price of $7.50 per share, for a total exercise price of approximately $3.0 million. The warrant may be exercised for cash or on a cashless basis, at the option of SMC, at any time on or before May 17, 2023 to acquire all, but not less than all, of the shares of Class A common stock subject to the warrant. For more information, see “Management’s Discussion and Analysis of Financial Condition and Results of Operations—Recent Equity Transactions—Issuance of Warrant,” “Principal Stockholders,” and “Description of Capital Stock—Warrant.”
Loans and Stock Issuances
In December 2016 we issued (a) 285,221 shares of Class A common stock to David H. Wang, who is our Chair of the Board, Chief Executive Officer and President, and a 5% stockholder, as well as certain immediate family members of Dr. Wang and certain trusts of which Dr. Wang is a trustee, pursuant to the conversion of convertible promissory notes with an aggregate value of $417,722 issued to such parties in 2003, 2004, 2005 and 2006 and (b) 419,728 shares of Class A common stock to H.L. Hsieh, a 5% stockholder, pursuant to the conversion of convertible promissory notes with an aggregate value of $574,735 issued to Mr. Hsieh in 2004, 2005 and 2006.
Director and Executive Compensation
Please see “Director Compensation” and “Executive Compensation” for a discussion regarding the compensation of our non-employee directors and our executive officers.
Indemnification Agreements
In April 2017 we entered enter into indemnification agreements with our directors and executive officers. Under these agreements, we agree to indemnify, to the fullest extent permitted by Delaware law (subject to certain limitations), each of our directors and executive officers against any and all expenses incurred by the director or officer in connection with proceedings because of his or her status as one of our directors or executive officers. In addition, these indemnification agreements provide that, to the fullest extent permitted by Delaware law, we will pay for all expenses incurred by our directors and executive officers in connection with a legal proceeding arising out of their service to us.
124
Table of Contents
Policies and Procedures for Related-Party Transactions
In October 2017 the board of directors adopted a conflict of interest policy which covers related-party transactions and will become effective upon the completion of this offering. Among other things, this policy requires each director and executive officer, including their immediate family members, to provide written notice of any potential related-party transaction, defined by the policy to mirror the definition of Item 404 of Regulation S-K (with the exception that the policy includes a monetary threshold of $100,000 as opposed to the threshold of $120,000 set by Item 404 of Regulation S-K) to the Chair of the Board (or to the Chief Executive Officer if such transaction involves the Chair of the Board, or to the Chief Financial Officer if such transaction involves the Chief Executive Officer) including all information that the Chair of the Board, the Chief Executive Officer or the Chief Financial Officer may request. Upon receiving all relevant information, the board of directors may approve the transaction if they determine that the transaction is in the best interests of, and fair to, us, may require modifications to the transaction to make it acceptable for approval, or may reject it. The board may also establish guidelines for ongoing management of a specific related-party transaction. The policy requires that continuing related-party transactions are reviewed on at least an annual basis. Additionally, the policy requires that all directors and executive officers complete a directors and officers questionnaire in connection with each of our annual proxy statements, in which they are asked to disclose family relationships and other related-party transactions.
125
Table of Contents
The following table provides information concerning beneficial ownership of our capital stock as of September 30, 2017, and as adjusted to reflect the sale of the Class A common stock being sold in this offering, by:
| • | each person, or group of affiliated persons, who is known by us to beneficially own more than five percent of the outstanding Class A common stock (on an as-converted basis) or the outstanding Class B common stock; |
| • | each of our named executive officers; |
| • | each of our directors; and |
| • | all of our current directors and executive officers as a group. |
Beneficial ownership is determined in accordance with the rules of the SEC, and thus it represents sole or shared voting or investment power with respect to our securities. Shares of common stock subject to options currently exercisable or exercisable by November 29, 2017 (sixty days after September 30, 2017) are deemed outstanding and beneficially owned by the person holding such options for purposes of computing the number of shares and percentage beneficially owned by such person, but are not deemed outstanding for purposes of computing the percentage beneficially owned by any other person. Except as indicated in the footnotes to the below table, and subject to applicable community property laws, the persons or entities named have sole voting and investment power with respect to all shares of common stock shown as beneficially owned by them.
The following table lists the percentage of shares beneficially owned before this offering and the concurrent private placement based on 9,369,212 shares of Class A common stock outstanding, which includes (a) 4,627,577 shares of Class A common stock issuable upon the automatic conversion of all shares of convertible preferred stock upon completion of this offering, as if the conversion had occurred as of September 30, 2017, and (b) 2,409,738 shares of Class B common stock outstanding as of September 30, 2017.
The table also lists the percentage of shares beneficially owned after this offering and the concurrent private placement based on 12,702,546 shares of Class A common stock outstanding immediately after the completion of this offering, assuming no exercise of the underwriters’ over-allotment option to purchase up to an additional 300,000 shares of Class A common stock.
Unless otherwise indicated, the principal address of each of the stockholders below is c/o ACM Research, Inc., 42307 Osgood Road, Suite I, Fremont, California 94539.
| Shares Beneficially Owned Before the Offering |
Shares Beneficially Owned After the Offering |
|||||||||||||||||||||||||||||||||||||||
| Class A | Class B | % Total Voting Power(1) |
Class A | Class B | % Total Voting Power(1) |
|||||||||||||||||||||||||||||||||||
| Name of Beneficial Owner |
Shares | % | Shares | % | Shares | % | Shares | % | ||||||||||||||||||||||||||||||||
| Named Executive Officers, Directors and Director-Elect |
||||||||||||||||||||||||||||||||||||||||
| David H. Wang(2) |
2,415,281 | 21.3 | 1,422,270 | 59.0 | 50.6 | 2,415,281 | 16.4 | 1,422,270 | 59.0 | 50.2 | ||||||||||||||||||||||||||||||
| Haiping Dun(3) |
517,857 | 5.4 | 100,000 | 4.1 | 4.2 | 517,857 | 4.0 | 100,000 | 4.1 | 4.1 | ||||||||||||||||||||||||||||||
| Yinan Xiang(4) |
1,666,170 | 17.8 | — | — | 2.9 | 1,666,170 | 13.1 | — | — | 2.7 | ||||||||||||||||||||||||||||||
| Fufa Chen(5) |
127,501 | 1.4 | — | — | * | 127,501 | * | — | — | * | ||||||||||||||||||||||||||||||
| Chenming Hu(6) |
39,584 | * | — | — | * | 39,584 | * | — | — | * | ||||||||||||||||||||||||||||||
| Tracy Liu(7) |
28,095 | * | — | — | * | 28,095 | * | — | — | * | ||||||||||||||||||||||||||||||
| Min Xu(8) |
33,333 | * | — | — | * | 33,333 | * | — | — | * | ||||||||||||||||||||||||||||||
| All executive officers, directors and director-elect as a group (9 persons)(9) |
5,468,044 | 44.6 | 1,572,271 | 65.2 | 60.0 | 5,468,044 | 35.1 | 1,572,271 | 65.2 | 59.4 | ||||||||||||||||||||||||||||||
| Other 5% Stockholders |
||||||||||||||||||||||||||||||||||||||||
| Shanghai Science and Technology Venture Capital Co., Ltd.(10) |
1,666,170 | 17.8 | — | — | 2.9 | 1,666,170 | 13.1 | — | — | 2.7 | ||||||||||||||||||||||||||||||
| Pudong Science and Technology (Cayman) Co., Ltd.(11) |
1,119,576 | 11.9 | — | — | 1.9 | 1,119,576 | 8.8 | — | — | 1.8 | ||||||||||||||||||||||||||||||
| H.L. Hsieh(12) |
1,019,211 | 10.7 | 133,334 | 5.5 | 6.2 | 1,019,211 | 7.9 | 133,334 | 5.5 | 6.1 | ||||||||||||||||||||||||||||||
| Zhangjiang AJ Company Limited(13) |
787,098 | 8.4 | — | — | 1.4 | 787,098 | 6.2 | — | — | 1.3 | ||||||||||||||||||||||||||||||
| Jian Wang(14) |
552,722 | 5.6 | 50,001 | 2.1 | 2.6 | 552,722 | 4.3 | 50,001 | 2.1 | 2.5 | ||||||||||||||||||||||||||||||
| Xinxin (Hongkong) Capital Co., Limited(15) |
— | — | — | — | — | 833,334 | 6.6 | — | — | 1.4 | ||||||||||||||||||||||||||||||
[footnotes appear on following page]
126
Table of Contents
| * | Less than 1%. |
| (1) | Percentage of total voting power represents voting power with respect to all shares of Class A and Class B common stock, voting as a single class. Holders are entitled to one vote per share of Class A common stock and twenty votes per share of Class B common stock. For more information about the voting rights of Class A and Class B common stock, see “Description of Capital Stock—Common Stock.” |
| (2) | Includes (a) 206,667 shares of Class A common stock held by Dr. Wang and Jing Chen, as Trustees for the Wang-Chen Family Living Trust; (b) 60,000 shares of Class A common stock held by Dr. Wang and Jing Chen, as Trustees for The David Hui Wang and Jing Chen Family Irrevocable Trust for Wang Children; (c) 1,422,270 shares of Class A common stock issuable upon conversion of Class B common stock, of which shares of Class B common stock a total of 117,334 are held by Dr. Wang’s son, Brian Wang, 117,334 are held by Dr. Wang s daughter, Sophia Wang, 33,334 are held by Dr. Wang’s spouse, Jing Chen, and 7,334 are held by Dr. Wang and Jing Chen, as Trustees for The David Hui Wang and Jing Chen Family Irrevocable Trust for Wang Children; and (d) 559,677 shares of Class A common stock issuable upon the exercise of options exercisable by November 29, 2017, including 9,676 shares of Class A common stock issuable upon the exercise of an option issued to Dr. Wang’s daughter, Sophia Wang. |
| (3) | Includes 100,000 shares of Class A common stock issuable upon conversion of Class B common stock and 104,166 shares of Class A common stock issuable under options exercisable by November 29, 2017. |
| (4) | Consists of shares owned by Shanghai Science and Technology Venture Co., Ltd., or SSTVC (see note (10) below). As described under “Management—Board of Directors—Director Nomination Rights,” SSTVC has exercised a contractual right by designating Ms. Xiang for nomination to the board of directors and the board has elected Ms. Xiang to the board effective upon the earlier of the consummation of the offering made hereby and November 15, 2017. Ms. Xiang disclaims beneficial ownership of the shares owned by SSTVC except to the extent of her pecuniary interest therein. |
| (5) | Includes 54,167 shares of Class A common stock issuable under options exercisable by November 29, 2017. |
| (6) | Consists of shares issuable under options exercisable by November 29, 2017. |
| (7) | Includes 25,695 shares of Class A common stock issuable under options exercisable by November 29, 2017. |
| (8) | Consists of shares issuable under options exercisable by November 29, 2017. |
| (9) | Includes (a) 1,597,938 shares of Class A common stock issuable upon conversion of Class B common stock, (b) 891,622 shares of Class A common stock issuable under options exercisable by November 29, 2017, and (c) 397,502 shares of Class A common stock issuable upon the exercise of an outstanding warrant. See notes (2) through (8). |
| (10) | Weiguo Shen is the Chairman and General Manager of SSTVC and may be deemed to beneficially own the shares held by SSTVC. The address of SSTVC and Mr. Shen is 1634 Huaihai Road, Shanghai, PRC. |
| (11) | Pudong Science and Technology (Cayman) Co., Ltd., or PST, is a wholly owned subsidiary of Shanghai Pudong High-TechInvestment Co., Ltd. Long Ji is the Corporate Representative of Shanghai Pudong High-Tech Investment Co., Ltd. and may be deemed to beneficially own the shares held by PST. The address of PST, its parent and Mr. Ji is 1158 Zhangdong Road, Building 3, 8th Floor, Zhangjiang Hi-tech Park, Pudong District, Shanghai, PRC. |
| (12) | Includes 133,334 shares of Class A common stock issuable upon conversion of Class B common stock. |
| (13) | Zhangjiang AJ Company Limited is a wholly owned subsidiary of Shanghai Zhangjiang Science & Technology Venture Capital Co., Ltd. Weiwei Chen is the Chairman, General Manager and Corporate Representative of Shanghai Zhangjiang Science & Technology Venture Capital Co., Ltd. and may be deemed to beneficially own the shares held by Zhangjiang AJ Company Limited. The address of Zhangjiang AJ Company Limited and its parent and Ms. Chen is 1387 Zhangdong Road, Building 16, Room C305, Zhangjiang Hi-tech Park, Shanghai, PRC. |
| (14) | Includes (a) 50,001 shares of Class A common stock issuable upon conversion of Class B common stock, (b) 20,833 shares of Class A common stock issuable under options exercisable by November 29, 2017 and (c) 397,502 shares of Class A common stock issuable upon the exercise of an outstanding warrant held by Shengxin (Shanghai) Management Consulting Limited Partnership, or SMC. Mr. Wang is the general partner of SMC and may be deemed to beneficially own the warrant and any shares of Class A common stock acquired by SMC upon exercise of the warrant. Mr. Wang is our Vice President, Research and Development and the brother of David H. Wang, our Chair of the Board, Chief Executive Officer and President. |
| (15) | Xinxin (Hongkong) Capital Co., Limited has, but has not yet exercised, a right to designate one individual for nomination and election to the board of directors, as described under “Management—Board of Directors—Director Nomination Rights.” Xinxin (Hongkong) Capital Co., Limited is a wholly owned subsidiary of Xunxin (Shanghai) Capital Co., Ltd., which is a wholly owned subsidiary of China IC Industry Investment Fund. Sino IC Capital Co., Limited is the management company of China IC Industry Investment Fund and Kai Ren is the Vice President of Sino IC Capital Co., Limited and may be deemed to beneficially own the shares held by Xinxin (Hongkong) Capital Co., Limited. The address of Xinxin (Hongkong) Capital Co., Limited, Xunxin (Shanghai) Capital Co., Limited, Sino IC Capital Co., Limited, China IC Industry Investment Fund and Kai Ren is 3rd Floor North, No. 7 Financial Street, Xicheng District, Beijing 100033, P. R. China. |
127
Table of Contents
General
Following completion of this offering, our authorized capital stock will consist of 50,000,000 shares of Class A common stock, $0.0001 par value per share, 2,409,738 shares of Class B common stock, $0.0001 par value per share, and 10,000,000 shares of preferred stock, $0.0001 par value per share. The following description summarizes some of the terms of our restated charter and restated bylaws that will be in effect upon completion of this offering. This description does not purport to be complete and is qualified in its entirety by the provisions of our restated charter and restated bylaws, copies of which have been filed as exhibits to the registration statement of which this prospectus is a part.
As of September 30, 2017, assuming conversion of all outstanding shares of preferred stock into shares of Class A common stock immediately prior to completion of this offering there were outstanding:
| • | 9,369,212 shares of Class A common stock outstanding, held of record by 136 stockholders; |
| • | 2,409,738 shares of Class B common stock outstanding, held of record by 62 stockholders; |
| • | 397,502 shares of Class A common stock issuable upon exercise of an outstanding warrant; and |
| • | 3,276,074 shares of Class A common stock issuable upon exercise of outstanding stock options. |
Common Stock
Voting Rights. Except as otherwise required by Delaware law, at every annual or special meeting of stockholders, holders of Class B common stock are entitled to twenty votes per share and holders of Class A common stock are entitled to one vote per share. The holders of Class A common stock and Class B common stock vote together as a single class, unless otherwise required by law. Delaware law could require either holders of Class A common stock or Class B common stock to vote separately as a single class in the following circumstances:
| • | if we were to seek to amend our charter to increase the authorized number of shares of a class of stock, or to increase or decrease the per share par value of a class of stock, then that class would be required to vote separately to approve the proposed amendment; |
| • | if we were to seek to amend our charter in a manner that alters or changes the powers, preferences or special rights of a class of stock in a manner that affected its holders adversely, then that class would be required to vote separately to approve the proposed amendment; and |
| • | if we were to seek to declare a dividend or distribution that would be disparate as between the two classes. |
Stockholders do not have the ability to cumulate votes for the election of directors. Our restated charter and restated bylaws that will be in effect upon completion of this offering will provide for a classified board of directors consisting of three classes of approximately equal size, each serving staggered three-year terms, when the outstanding shares of Class B common stock represent less than a majority of the combined voting power of the common stock. Our directors will be assigned by the then-current board to a class when the outstanding shares of Class B common stock represent less than a majority of the combined voting power of the common stock.
Dividends. Subject to preferences that may be applicable to any then outstanding preferred stock, the holders of our outstanding shares of common stock are entitled to receive dividends, if any, as may be declared from time to time by the board of directors out of legally available funds. The holders of Class A common stock and Class B common stock will be entitled to share equally, identically and ratably, on a per share basis, with respect to any dividend or distribution unless different treatment of the shares of each such class is approved by the
128
Table of Contents
affirmative vote of the holders of a majority of the outstanding shares of Class A common stock and Class B common stock, each voting separately as a class. At present, we have no plans to issue dividends. See “Dividend Policy.”
Liquidation. In the event of our liquidation, dissolution or winding up, holders of common stock will be entitled to share ratably in the net assets legally available for distribution to stockholders after the payment of all of our debts and other liabilities, subject to the satisfaction of any liquidation preference granted to the holders of any outstanding shares of preferred stock.
Conversion. Each outstanding share of Class B common stock is convertible into one share of Class A common stock (a) at any time, at the option of the holder, or (b) upon any transfer of such share of Class B common stock, whether or not for value, except for certain transfers described in our restated charter, including transfers to family members, trusts solely for the benefit of the stockholder or their family members, and partnerships, corporations, and other entities exclusively owned by the stockholder or their family members. In addition, on or after the date of this prospectus, all outstanding shares of Class B common stock will convert automatically into shares of Class A common stock, on a one for one basis, upon (a) the election of the holders of a majority of the then outstanding shares of Class B common stock or (b) on the first December 31 that occurs more than five years after the date of this prospectus if the October Market Cap with respect to the month of October immediately preceding such December 31 exceeds $1.0 billion, provided that the conversion provided by this clause (b) shall not apply and no automatic conversion of Class B common stock into Class A common stock will ever occur pursuant to this clause (b) if the October Market Cap for the month of October immediately preceding a December 31 exceeds $1.0 billion prior to the fifth anniversary of the date of this prospectus. For purposes of this paragraph, “October Market Cap” means, with respect to any October throughout which Class A common stock is traded on a registered securities exchange, the product of the average of the daily volume weighted average trading prices of Class A common stock for each of the days in such month of October multiplied by the number of shares of common stock outstanding on the last trading day of such month of October.
Once converted or transferred and converted into Class A common stock, the Class B common stock will not be reissued.
Other Rights and Preferences. Other than as described above, holders of common stock have no preemptive, conversion or subscription rights, and there are no redemption or sinking fund provisions applicable to common stock. The rights, preferences and privileges of the holders of common stock are subject to, and may be adversely affected by, the rights of the holders of shares of any series of preferred stock that we may designate and issue in the future.
Fully Paid and Nonassessable. All of our outstanding shares of common stock are, and the shares of Class A common stock to be issued in this offering and the concurrent private placement will be, fully paid and nonassessable.
Preferred Stock
Upon completion of this offering, we will have no shares of preferred stock outstanding. Our shares of preferred stock outstanding immediately prior to the completion of this offering will convert automatically into 4,627,577 shares of Class A common stock.
Under the terms of our restated charter, the board of directors is authorized to issue preferred stock in one or more series, to establish the number of shares to be included in each such series and to fix the designation, powers, preferences and rights of such shares and any qualifications, limitations or restrictions thereof. The issuance of preferred stock may have the effect of delaying, deferring or preventing a change in control of our company without further action by the stockholders and may adversely affect the voting and other rights of the
129
Table of Contents
holders of common stock. The issuance of preferred stock with voting and conversion rights may adversely affect the voting power of the holders of common stock, including the loss of voting control to others. At present, we have no plans to issue any preferred stock.
Options
As of September 30, 2017, options to purchase 1,606,064 shares of Class A common stock were outstanding pursuant under the 2016 Plan at a weighted-average exercise price of $3.61 per share, of which 324,171 were vested and exercisable.
As of September 30, 2017, options to purchase 66,668 shares of Class A common stock were outstanding under our 1998 Plan at an exercise price of $0.75 per share, all of which were vested and exercisable.
As of September 30, 2017, options to purchase 1,603,342 shares of Class A common stock were outstanding pursuant to certain stand-alone option agreements at a weighted-average exercise price of $1.23 per share, of which 1,150,275 were vested and exercisable.
In total, as of September 30, 2017, options to purchase 3,276,074 shares of Class A common stock were outstanding at a weighted-average exercise price of $2.39 per share, of which 1,541,114 were vested and exercisable at a weighted-average exercise price of $1.51 per share.
Warrant
In December 2016, Shengxin (Shanghai) Management Consulting Limited Partnership, or SMC, delivered to our subsidiary ACM Shanghai 20,123,500 RMB (approximately $3.0 million as of the date of funding) in cash, which we refer to as the SMC Investment, for potential investment pursuant to terms to be subsequently negotiated. In March 2017, we, ACM Shanghai and SMC entered into a securities purchase agreement pursuant to which, in exchange for the SMC Investment, we issued to SMC a warrant exercisable, for cash or on a cashless basis, to purchase, at any time on or before May 17, 2023, all, but not less than all, of 397,502 shares of Class A common stock at a price of $2.50 per share, for a total exercise price of approximately $3.0 million. Under the securities purchase agreement, if SMC does not exercise the warrant by May 17, 2023, ACM Shanghai will be obligated, subject to approval of governmental authorities and ACM Shanghai’s equity holders, to deliver an equity interest of 3.6394% (subject to dilution) in satisfaction of the SMC Investment. If SMC exercises the warrant or if SMC does not exercise the warrant and the issuance of the equity interest in ACM Shanghai is not completed by August 17, 2023 due to the inability of the parties to obtain required governmental or equity holder approvals, then ACM Shanghai will be obligated to pay to SMC, in satisfaction of the SMC Investment, an amount equal to approximately $3.0 million. We have granted SMC certain registration rights with respect to Class A common stock issued upon exercise of the warrant, as described under “—Registration Rights” below.
Registration Rights
We entered into a registration rights agreement with the following holders:
| • | SMC in connection with the warrant described in “—Warrant” above; |
| • | Ninebell Co., Ltd. in connection with its purchase of 133,334 shares of Class A common stock described in “Management’s Discussion and Analysis of Financial Condition and Results of Operations—Recent Equity Transactions—Strategic Investment in Key Supplier”; |
| • | Shanghai Science and Technology Venture Capital Co., Ltd., Shanghai Pudong High-Tech Investment Co., Ltd. and Zhangjiang AJ Company Limited in connection with the agreements described in “Management’s Discussion and Analysis of Financial Condition and Results of Operations—Recent Equity Transactions —Acquisition of Outstanding Minority Interests in Our Operating Company”; |
130
Table of Contents
| • | Xinxin (Hongkong) Capital Co., Limited and Victorious Way Limited in connection with the concurrent private placement described in “Concurrent Private Placement”; and |
| • | holders of convertible preferred stock, convertible into 4,627,577 shares of Class A common stock. |
In total, all of the intended parties to the registration rights agreement would have the right, under specified circumstances, to require us to register from time to time under the Securities Act up to 8,398,421 shares of Class A common stock.
The following description of the terms of the registration rights agreement is intended as a summary only and is qualified in its entirety by reference to the registration rights agreement filed as an exhibit to the registration statement of which this prospectus forms a part.
| • | Demand Registration Rights. Any time after at least 180 days after the contractual 180-day lockup period described under “Shares Eligible for Future Sale—Lock-up Agreements”, on no more than four occasions and no more than one occasion in any six-month period, the private placement investors will have the right to request that we register with the SEC (a) on a registration statement on Form S-1, (i) all or a portion of the shares registrable under the registration rights agreement reasonably anticipated to have an aggregate offering price of at least $7,500,000 or (ii) all of the registrable shares then held by a private placement investor or (b) on a registration statement on Form S-3, (i) all or a portion of the shares registrable under the registration rights agreement reasonably anticipated to have an aggregate offering price of at least $3,750,000 or (ii) all of the registrable shares then held by a private placement investor. Following such a request, the other holders of registrable shares will have the right to request that we include in such registration statement all or a portion of their registrable shares. Such demand registration rights are held by the private placement investors and granting demand registration rights to any other holders will require the consent of the private placement investors. |
| • | Incidental Registration Rights. If we propose to register shares of Class A common stock under the Securities Act on a form that may be used for the registration of eligible shares, the holders may request that we register all or a portion of the eligible shares they held by them. |
In the event that any registration in which the holders of eligible shares participate pursuant to the registration rights agreement is an underwritten public offering, the number of eligible shares to be included may, in specified circumstances, be limited due to market conditions. If the underwriter determines that less than all of the eligible shares proposed to be sold can be included in such offering, then eligible shares held by executive officers shall only be included in such offering if all the holders that are not executive officers are able to register all of the eligible shares proposed to be sold in such registration.
Under the registration rights agreement, we generally are required to pay all registration expenses other than underwriting discounts and selling commissions and we are required to indemnify each participating holder with respect to each registration of eligible shares that is effected.
Anti-Takeover Provision
So long as the outstanding shares of Class B common stock represent a majority of the combined voting power of common stock, the holders of Class B common stock will effectively control all matters submitted to our stockholders for a vote, as well as the overall management and direction of our company, which will have the effect of delaying, deferring or discouraging another person from acquiring control of our company.
After such time as the shares of Class B common stock no longer represent a majority of the combined voting power of common stock, the provisions of Delaware law, our restated charter and our restated bylaws may have the effect of delaying, deferring or discouraging another person from acquiring control of our company.
131
Table of Contents
Delaware Law
Section 203 of the Delaware General Corporation Law prevents some Delaware corporations from engaging, under some circumstances, in a business combination, which includes a merger or sale of at least 10% of the corporation’s assets with any interested stockholder, meaning a stockholder who, together with affiliates and associates, owns or, within three years prior to the determination of interested stockholder status, did own 15% or more of the corporation’s outstanding voting stock, unless:
| • | the transaction is approved by the board of directors prior to the time that the interested stockholder became an interested stockholder; |
| • | upon consummation of the transaction, which resulted in the stockholder’s becoming an interested stockholder, the interested stockholder owned at least 85% of the voting stock of the corporation outstanding at the time the transaction commenced, excluding stock owned by directors who are also officers of the corporation; or |
| • | subsequent to such time that the stockholder became an interested stockholder the business combination is approved by the board and authorized at an annual or special meeting of stockholders by at least two-thirds of the outstanding voting stock that is not owned by the interested stockholder. |
A Delaware corporation may “opt out” of these provisions with an express provision in its original charter or an express provision in its charter or bylaws resulting from a stockholders’ amendment approved by at least a majority of the outstanding voting shares. We have not opted out of these provisions. As a result, mergers or other takeover or change in control attempts of us may be discouraged or prevented.
Restated Charter and Bylaw Provisions
Our restated charter and our restated bylaws will include a number of provisions that may have the effect of deterring hostile takeovers or delaying or preventing changes in control of our company, even after such time as the shares of Class B common stock no longer represent a majority of the combined voting power of common stock, including the following:
| • | Separate Class B Vote for Certain Transactions. Until the first date on which the outstanding shares of Class B common stock represent less than 35% of the combined voting power of common stock, any transaction that would result in a change in control of our company will require the approval of a majority of our outstanding Class B common stock voting as a separate class. This provision could delay or prevent the approval of a change in control that might otherwise be approved by a majority of outstanding shares of Class A and Class B common stock voting together on a combined basis. |
| • | Dual Class Stock. As described above in “—Common Stock—Voting Rights,” our restated charter provides for a dual class common stock structure, which provides certain members of our senior management with the ability to control the outcome of matters requiring stockholder approval, even if they collectively own significantly less than a majority of the shares of our outstanding Class A and Class B common stock, including the election of directors and significant corporate transactions, such as a merger or other sale of our company or its assets. |
| • | Supermajority Approvals. Our restated charter and restated bylaws do not provide that amendments to our restated charter or restated bylaws by stockholders will require the approval of two-thirds of the combined vote of then-outstanding shares of Class A and Class B common stock. However, when the outstanding shares of Class B common stock represent less than a majority of the combined voting power of common stock, certain amendments to our restated charter or restated bylaws by stockholders will require the approval of two-thirds of the combined vote of our then-outstanding shares of Class A and Class B common stock. This will have the effect of making it more difficult to amend our charter or bylaws to remove or modify certain provisions. |
| • | Board of Directors Vacancies. Our restated charter and restated bylaws provide that stockholders may fill vacant directorships. When the outstanding shares of Class B common stock represent less than a |
132
Table of Contents
| majority of the combined voting power of common stock, our restated charter and restated bylaws authorize only the board of directors to fill vacant directorships. In addition, the number of directors constituting the board is set only by resolution adopted by a majority vote of our entire board. These provisions restricting the filling of vacancies will prevent a stockholder from increasing the size of the board and gaining control of the board by filling the resulting vacancies with its own nominees. Our restated charter provides that directors may be removed with or without cause only by the affirmative vote of the holders of at least two-thirds of the votes that all of the stockholders would be entitled to cast in any annual election of directors. |
| • | Classified Board. The board of directors will not initially be classified. Our restated charter and restated bylaws provide that when the outstanding shares of Class B common stock represent less than a majority of the combined voting power of common stock, the board will be classified into three classes of directors each of which will hold office for a three-year term. In addition, thereafter, directors may be removed from the board with our without cause only by the affirmative vote of the holders of at least two-thirds of the voting power of the then outstanding shares of Class A and Class B common stock. The existence of a classified board could delay a successful tender offeror from obtaining majority control of the board, and the prospect of that delay might deter a potential offeror. |
| • | Stockholder Action; Special Meeting of Stockholders. Our restated charter provides that stockholders will be able to take action by written consent. When the outstanding shares of Class B common stock represent less than a majority of the combined voting power of common stock, our stockholders will no longer be able to take action by written consent, and will only be able to take action at annual or special meetings of our stockholders. Stockholders will not be permitted to cumulate their votes for the election of directors. The absence of cumulative voting may make it more difficult for stockholders who own less than a majority in voting power to elect any directors to the board of directors. Our restated bylaws further provide that special meetings of our stockholders may be called only by the board, the chair of the board or our chief executive officer. A stockholder may not call a special meeting, which may delay the ability of our stockholders to force consideration of a proposal or for holders controlling a majority in voting power of our capital stock to take any action, including the removal of director. |
| • | Advance Notice Requirements for Stockholder Proposals and Director Nominations. Our restated bylaws provide advance notice procedures for stockholders seeking to bring business before our annual meeting of stockholders, or to nominate candidates for election as directors at any meeting of stockholders. Our restated bylaws also specify certain requirements regarding the form and content of a stockholder’s notice. These provisions may preclude our stockholders from bringing matters before our annual meeting of stockholders or from making nominations for directors at our meetings of stockholders. |
| • | Issuance of Undesignated Preferred Stock. The board of directors has the authority, without further action by the stockholders, to issue shares of undesignated preferred stock with rights and preferences, including voting rights, designated from time to time by the board. The existence of authorized but unissued shares of preferred stock enables the board to render more difficult or to discourage an attempt to obtain control of us by means of a merger, tender offer, proxy contest or otherwise. |
Choice of Forum
Our restated charter provides that the Court of Chancery of the State of Delaware will be the exclusive forum for any derivative action or proceeding brought on our behalf; any action asserting a breach of fiduciary duty; any action asserting a claim against us arising pursuant to the Delaware General Corporation Law, our restated charter or our restated bylaws; any action to interpret, apply, enforce, or determine the validity of our restated charter or restated bylaws; or any action asserting a claim against us that is governed by the internal affairs doctrine. The enforceability of similar choice of forum provisions in other companies’ certificates of incorporation has been challenged in legal proceedings, and it is possible that a court could find these types of provisions to be inapplicable or unenforceable.
133
Table of Contents
Transfer Agent and Registrar
The transfer agent and registrar for the Class A common stock will be Computershare Trust Company, N.A.
NASDAQ Global Market
We have applied to list the Class A common stock on the NASDAQ Global Market under the symbol “ACMR.”
134
Table of Contents
SHARES ELIGIBLE FOR FUTURE SALE
Before this offering, there has not been a public market for shares of Class A common stock. Future sales of substantial numbers of shares of common stock, including shares issued upon the exercise of outstanding options, in the public market after this offering, or the possibility of these sales occurring, could cause the prevailing market price for the common stock to fall or impair our ability to raise equity capital in the future.
After this offering and the concurrent private placement, we will have outstanding 12,702,546 shares of Class A common stock and 2,409,738 shares of Class B common stock, based on the number of shares outstanding as of September 30, 2017 and 1,333,334 shares we are selling in the concurrent private placement. This includes 2,000,000 shares of Class A common stock that we are selling in this offering, which shares may be resold in the public market immediately following this offering, and assumes no additional exercise of outstanding options. Shares of Class B common stock are convertible into an equivalent number of shares of Class A common stock and generally convert into shares of Class A common stock upon transfer.
The 13,112,284 shares of common stock that were not offered and sold in this offering will be upon issuance, “restricted securities,” as that term is defined in Rule 144 under the Securities Act. These restricted securities are eligible for public sale only if they are registered under the Securities Act or if they qualify for an exemption from registration under Rule 144 under the Securities Act, which are summarized below.
As a result of the contractual 180-day lock-up period described below and the provisions of Rule 144, these shares will be available for sale in the public market as follows:
| • | 523,210 restricted shares will be eligible for sale in the public market immediately upon completion of this offering; and |
| • | up to 12,589,074 shares will be eligible for sale in the public market beginning 180 days from the date of this prospectus, 8,770,975 of which are held by directors, executive officers and other affiliates and will be subject to volume and other limitations under Rule 144 under the Securities Act. |
Lock-up Agreements
We, all of our directors and officers, the purchasers of Class A common stock in the private placement and certain of our other stockholders have agreed not to sell or otherwise transfer or dispose of any of our securities for a period of 180 days from the date of this prospectus, subject to certain exceptions. Roth Capital Partners, as representative of the several underwriters, may permit early releases of shares subject to the lock-up agreements. See “Underwriting” for a description of the lock-up provisions.
Rule 144
In general, a person who has beneficially owned our restricted common shares for at least six months would be entitled to sell their securities subject only to the availability of current public information about us and subject to the lock-up agreements described above, provided that (a) such person is not deemed to have been one of our affiliates at the time of, or at any time during the ninety days preceding, a sale, and (b) we are subject to the Securities Exchange Act periodic reporting requirements for at least ninety days before the sale. In addition, under Rule 144, any person who is not an affiliate of ours and has beneficially owned their shares for at least one year, including the holding period of any prior owner other than one of our affiliates, would be entitled to sell such shares immediately upon completion of this offering without regard to whether current public information about us is available. Persons who have beneficially owned restricted common shares for at least six months but who are our affiliates at the time of, or any time during the ninety days preceding, a sale, would be subject to additional restrictions, by which such person would be entitled to sell, upon expiration of the lock-up agreements
135
Table of Contents
described above, within any three-month period only a number of shares that does not exceed the greater of either of the following:
| • | one percent of the number of common shares then outstanding, which will equal approximately 151,122 shares immediately after this offering assuming no exercise of the underwriters’ option to purchase additional shares, based on the number of common shares outstanding as of September 30, 2017; or |
| • | the average weekly trading volume of common shares during the four calendar weeks preceding the filing of a notice on Form 144 with respect to the sale; |
provided, in each case, that we are subject to the Securities Exchange Act periodic reporting requirements for at least ninety days before the sale. Such sales both by affiliates and by a person selling shares on behalf of our affiliates must also comply with the manner of sale, current public information and notice provisions of Rule 144.
Rule 701
In general, Rule 701 permits resales of shares in reliance upon Rule 144 but without compliance with certain restrictions, including the holding period requirement, of Rule 144. Any employee, officer or director of or consultant to us who purchased shares under a written compensatory plan or contract before the date of this prospectus may be entitled to rely on the resale provisions of Rule 701. Rule 701 permits affiliates to sell their shares acquired pursuant to Rule 701 under Rule 144 without complying with the holding period requirements of Rule 144. Rule 701 further provides that non-affiliates may sell such shares in reliance on Rule 144 without having to comply with the holding period, public information, volume limitation or notice provisions of Rule 144. All holders of shares issued under Rule 701 are required to wait until ninety days after the date of this prospectus before selling such shares. All Rule 701 shares are, however, subject to lock-up agreements and will only become eligible for sale upon the expiration of the lock-up agreements.
Registration Rights
Upon completion of this offering, certain holders of shares of Class A common stock (including shares of Class A common stock issuable upon conversion of Class B common stock) will be entitled to incidental, or piggyback, rights with respect to the registration of the sale of these shares under the Securities Act. Upon completion of the private placement, the private placement investors, in addition to the piggyback, registration rights, will have the right, under certain circumstances, to require us to file a registration statement under the Securities Act to register the shares of Class A common stock sold in the private placement. Registration of the sale of these shares under the Securities Act would result in these shares becoming fully tradable without restriction under the Securities Act immediately upon the effectiveness of the registration, except for shares purchased by affiliates. See “Description of Capital Stock—Registration Rights” for additional information.
Equity Plan
We intend to file with the SEC one or more registration statements on Form S-8 under the Securities Act to register all shares of common stock subject to outstanding stock options and common stock issued or issuable under our stock plan. We expect to file the registration statement covering shares offered pursuant to our stock plan shortly after the date of this prospectus, permitting the resale of such shares by non-affiliates in the public market without restriction under the Securities Act and the sale by affiliates in the public market subject to compliance with the resale provisions of Rule 144.
136
Table of Contents
MATERIAL U.S. FEDERAL INCOME TAX CONSIDERATIONS
The following is a summary of the material U.S. federal income tax consequences of the ownership and disposition of Class A common stock to non-U.S. holders, as defined below, but does not purport to be a complete analysis of all the potential tax considerations relating thereto. This summary is based upon the provisions of the Internal Revenue Code, Treasury regulations promulgated thereunder, administrative rulings, and judicial decisions, all as of the date hereof. These authorities may be changed, possibly retroactively, so as to result in U.S. federal income tax consequences different from those set forth below. We have not sought any ruling from the Internal Revenue Service, or the IRS, with respect to the statements made and the conclusions reached in the following summary, and there can be no assurance the IRS will agree with such statements and conclusions. This discussion assumes that the non-U.S. holder holds Class A common stock as a “capital asset” within the meaning of Internal Revenue Code Section 1221 (generally, property held for investment).
This summary also does not address the tax considerations arising under the laws of any foreign, state or local jurisdiction or any U.S. federal non-income tax laws other than U.S. federal estate tax laws to the limited extent described below. In addition, this discussion does not address tax considerations applicable to an investor’s particular circumstances or to investors that may be subject to special tax rules, including:
| • | banks, insurance companies, or other financial institutions; |
| • | persons subject to the alternative minimum or net investment income tax; |
| • | tax-exempt organizations; |
| • | controlled foreign corporations, passive foreign investment companies and corporations that accumulate earnings to avoid U.S. federal income tax; |
| • | dealers in securities or currencies; |
| • | traders in securities that elect to use a mark-to-market method of accounting for their securities holdings; |
| • | persons that own, or are deemed to own, more than five percent of the common stock (except to the extent specifically set forth below); |
| • | certain former citizens or long-term residents of the U.S.; |
| • | persons who hold Class A common stock as a position in a “hedging transaction,” “straddle” “conversion transaction” or other risk reduction transaction; |
| • | persons who do not hold Class A common stock as a capital asset within the meaning of Internal Revenue Code Section 1221; or |
| • | persons deemed to sell Class A common stock under the constructive sale provisions of the Internal Revenue Code. |
In addition, if a partnership or entity classified as a partnership for U.S. federal income tax purposes holds Class A common stock, the tax treatment of a partner generally will depend on the status of the partner and upon the activities of the partnership. Accordingly, partnerships that hold Class A common stock, and partners in such partnerships, should consult their tax advisors.
YOU ARE URGED TO CONSULT YOUR TAX ADVISOR WITH RESPECT TO THE APPLICATION OF THE U.S. FEDERAL INCOME TAX LAWS TO YOUR PARTICULAR SITUATION, AS WELL AS ANY TAX CONSEQUENCES OF THE PURCHASE, OWNERSHIP AND DISPOSITION OF CLASS A COMMON STOCK ARISING UNDER THE U.S. FEDERAL ESTATE OR GIFT TAX RULES OR UNDER THE LAWS OF ANY STATE, LOCAL, FOREIGN OR OTHER TAXING JURISDICTION OR UNDER ANY APPLICABLE TAX TREATY.
137
Table of Contents
Non-U.S. Holder Defined
For purposes of this discussion, you are a non-U.S. holder if you are a holder other than a partnership or other entity classified as such for U.S. federal income tax purposes that, for U.S. federal income tax purposes, is not a U.S. person. For purposes of this discussion, you are a U.S. person if you are:
| • | an individual citizen or resident of the U.S.; |
| • | a corporation or other entity taxable as a corporation created or organized in the U.S. or under the laws of the U.S. or any political subdivision thereof or otherwise treated as such for U.S. federal income tax purposes; |
| • | an estate whose income is subject to U.S. federal income tax regardless of its source; or |
| • | a trust (a) whose administration is subject to the primary supervision of a U.S. court and that has one or more U.S. persons who have the authority to control all substantial decisions of the trust or (b) that has made an election to continue to be treated as a U.S. person. |
Distributions
We do not plan to make any distributions on Class A common stock in the foreseeable future. If we do make future distributions on Class A common stock (other than certain pro rata distributions of Class A common stock), however, those payments will constitute dividends for U.S. tax purposes to the extent paid from our current or accumulated earnings and profits, as determined under U.S. federal income tax principles. To the extent those distributions exceed both our current and our accumulated earnings and profits, they will constitute a return of capital and will first reduce your basis in Class A common stock, but not below zero, and then will be treated as gain from the sale of stock.
Any dividend paid to you generally will be subject to U.S. withholding tax either at a rate of 30% of the gross amount of the dividend or such lower rate as may be specified by an applicable income tax treaty. In order to receive a reduced treaty rate, you must provide us with an IRS Form W-8BEN, IRS Form W-8BEN-E or other appropriate version of IRS Form W-8 certifying qualification for the reduced rate.
Dividends received by you that are effectively connected with your conduct of a U.S. trade or business (and, if an income tax treaty applies, that are attributable to a permanent establishment (or, if you are an individual, a fixed base) maintained by you in the U.S.) are exempt from such withholding tax. In order to obtain this exemption, you must provide us with an IRS Form W-8ECI or other applicable IRS Form W-8 properly certifying such exemption. Such effectively connected dividends, although not subject to withholding tax, are taxed at the same graduated rates applicable to U.S. persons, net of certain deductions and credits. In addition, if you are a corporate non-U.S. holder, dividends you receive that are effectively connected with your conduct of a U.S. trade or business may also be subject to a branch profits tax at a rate of 30% or such lower rate as may be specified by an applicable income tax treaty.
If you are eligible for a reduced rate of withholding tax pursuant to a tax treaty, you may generally obtain a refund of any excess amounts currently withheld if you timely file an appropriate claim for refund with the IRS. If you hold stock through a financial institution or other agent acting on your behalf, you will be required to provide appropriate documentation to the agent, which then will be required to provide certification to us or our paying agent, either directly or through other intermediaries.
Dispositions
You generally will not be required to pay U.S. federal income tax on any gain realized upon the sale or other disposition of Class A common stock unless:
| • | the gain is effectively connected with your conduct of a U.S. trade or business (and, if an income tax treaty applies, the gain is attributable to a permanent establishment (or, if you are an individual, a fixed base) maintained by you in the U.S.); |
138
Table of Contents
| • | you are an individual who is present in the U.S. for a period or periods aggregating 183 days or more during the calendar year in which the sale or disposition occurs and certain other conditions are met; or |
| • | Class A common stock constitutes a U.S. real property interest by reason of our status as a U.S. real property holding corporation, or a USRPHC, for U.S. federal income tax purposes at any time within the shorter of the five-year period preceding the disposition or your holding period for Class A common stock. |
We believe that we are not currently and will not become a USRPHC. Because the determination of whether we are a USRPHC depends on the fair market value of our U.S. real property relative to the fair market value of our other business assets, however, there can be no assurance we will not become a USRPHC if we acquire real property in the future. Even if we become a USRPHC, however, as long as Class A common stock is regularly traded on an established securities market, Class A common stock will be treated as U.S. real property interests only if you actually or constructively hold more than five percent of such regularly traded common stock. Even if we become a USRPHC, however, as long as Class A common stock is regularly traded on an established securities market, Class A common stock will be treated as U.S. real property interests only if you actually or constructively hold more than five percent of such regularly traded Class A common stock.
If you are a non-U.S. holder described in the first bullet above, you will be required to pay tax on the net gain derived from the sale under regular graduated U.S. federal income tax rates, and corporate non-U.S. holders described in the first bullet above may also be subject to the branch profits tax at a 30% rate or such lower rate as may be specified by an applicable income tax treaty. If you are an individual non-U.S. holder described in the second bullet above, you will be required to pay a flat 30% tax (or such lower rate specified by an applicable tax treaty) on the gain derived from the sale, which tax may be offset by U.S. source capital losses (even though you are not considered a resident of the U.S.). You should consult any applicable income tax treaties that may provide for different rules.
Backup Withholding and Information Reporting
Generally, we must report annually to the IRS the amount of dividends paid to you, your name and address, and the amount of tax withheld, if any, regardless of whether withholding was required. A similar report is sent to you. Pursuant to applicable income tax treaties or other agreements, the IRS may make these reports available to tax authorities in your country of residence. Payments of dividends or of proceeds on the disposition of stock made to you may be subject to information reporting and backup withholding unless you establish an exemption, for example by properly certifying your non-U.S. status on an IRS Form W-8BEN or another appropriate version of IRS Form W-8. Notwithstanding the foregoing, backup withholding and information reporting may apply if either we or our paying agent has actual knowledge, or reason to know, that you are a U.S. person.
Backup withholding is not an additional tax; rather, the U.S. income tax liability of persons subject to backup withholding will be reduced by the amount of tax withheld. If withholding results in an overpayment of taxes, a refund or credit may generally be obtained from the IRS, provided that the required information is furnished to the IRS in a timely manner.
U.S. Federal Estate Taxes
Class A common stock owned or treated as owned by an individual who is a non-U.S. person (as specifically defined for U.S. federal estate tax purposes) at the time of death will be included in the individual’s gross estate for U.S. federal estate tax purposes and may be subject to U.S. federal estate tax, unless an applicable estate tax treaty provides otherwise.
Additional Withholding Tax on Payments Made to Foreign Accounts
Withholding taxes may be imposed under Internal Revenue Code Sections 1471 to 1474, which are commonly referred to as the Foreign Account Tax Compliance Act or FATCA, on certain types of payments
139
Table of Contents
made to non-U.S. financial institutions and certain other non-U.S. entities. Specifically, a thirty-percent withholding tax may be imposed on dividends on, or gross proceeds from the sale or other disposition of, Class A common stock paid to a “foreign financial institution” or a “non-financial foreign entity” (each as defined in the Internal Revenue Code), unless (a) the foreign financial institution undertakes certain diligence and reporting obligations, (b) the non-financial foreign entity either certifies it does not have any “substantial United States owners” (as defined in the Internal Revenue Code) or furnishes identifying information regarding each substantial United States owner, or (c) the foreign financial institution or non-financial foreign entity otherwise qualifies for an exemption from these rules. Such certification or exemption must typically be evidenced by a non-U.S. holder’s delivery of a properly executed IRS Form W-8BEN-E. If the payee is a foreign financial institution and is subject to the diligence and reporting requirements in (a) above, it must enter into an agreement with the U.S. Department of the Treasury requiring, among other things, that it undertake to identify accounts held by certain “specified United States persons” or “United States-owned foreign entities” (each as defined in the Internal Revenue Code), annually report certain information about such accounts, and withhold 30% on certain payments to non-compliant foreign financial institutions and certain other account holders. Foreign financial institutions located in jurisdictions that have an intergovernmental agreement with the United States governing FATCA may be subject to different rules.
Under applicable Treasury Regulations and administrative guidance, withholding under FATCA generally applies to payments of dividends on Class A common stock and will apply to payments of gross proceeds from the sale or other disposition of Class A common stock on or after January 1, 2019.
Prospective investors should consult their tax advisors regarding the potential application of withholding under FATCA to their investment in Class A common stock.
Each prospective investor should consult its own tax advisor regarding the particular U.S. federal, state and local and foreign tax consequences of purchasing, holding and disposing of Class A common stock, including the consequences of any proposed change in applicable laws.
140
Table of Contents
We have entered into an underwriting agreement with Roth Capital Partners, LLC, acting as the representative of the several underwriters named below, with respect to the shares of Class A common stock subject to this offering. Subject to certain conditions, we have agreed to sell to the underwriters, and the underwriters have severally agreed to purchase, the number of shares of Class A common stock provided below opposite their respective names.
| Underwriter |
Number of Shares | |||
| Roth Capital Partners, LLC |
||||
| Craig-Hallum Capital Group LLC |
||||
| The Benchmark Company, LLC |
||||
|
|
|
|||
| Total |
||||
|
|
|
|||
The underwriters are offering the shares subject to their acceptance of the shares from us and subject to prior sale. The underwriting agreement provides that the obligations of the several underwriters to pay for and accept delivery of the shares offered by this prospectus are subject to the approval of certain legal matters by their counsel and to certain other conditions. The underwriters are obligated to take and pay for all of the shares if any such shares are taken. However, the underwriters are not required to take or pay for the shares covered by the underwriters’ over-allotment option described below.
Over-Allotment Option
We have granted the underwriters an option, exercisable for thirty days from the date of this prospectus, to purchase up to an aggregate of 300,000 additional shares of Class A common stock to cover over-allotments, if any, at the public offering price set forth on the cover page of this prospectus, less the underwriting discounts and commissions. The underwriters may exercise this option solely for the purpose of covering over-allotments, if any, made in connection with the offering of the shares offered by this prospectus. If the underwriters exercise this option, each underwriter will be obligated, subject to certain conditions, to purchase a number of additional shares proportionate to that underwriter’s initial purchase commitment as indicated in the table above for which the option has been exercised.
Discounts, Commissions and Expenses
The underwriters have advised us that they propose to offer the shares of Class A common stock to the public at the initial public offering price set forth on the cover page of this prospectus and to certain dealers at that price less a concession not in excess of $ per share. The underwriters may allow, and certain dealers may reallow, a discount from the concession not in excess of $ per share to certain brokers and dealers. After this offering, the initial public offering price, concession and reallowance to dealers may be changed by the representative. No such change shall change the amount of proceeds to be received by us as set forth on the cover page of this prospectus. The shares are offered by the underwriters as stated herein, subject to receipt and acceptance by them and subject to their right to reject any order in whole or in part. The underwriters have informed us that they do not intend to confirm sales to any accounts over which they exercise discretionary authority.
The following table shows the underwriting discounts and commissions payable to the underwriters by us in connection with this offering (assuming both the exercise and non-exercise of the over-allotment option that we have granted to the underwriters):
| Per Share | Total Without Exercise of Over- Allotment Option |
Total With Exercise of Over- Allotment Option |
||||||||||
| Public offering price |
$ | $ | $ | |||||||||
| Underwriting discounts and commissions(1) |
$ | $ | $ | |||||||||
141
Table of Contents
| (1) | Does not include the warrants to purchase shares of Class A common stock equal to 4.0% of the number of shares sold in the offering, excluding any shares purchased by PRC-based investors identified by us and the option to purchase additional shares, to be issued to the underwriters at the closing. |
In addition, we have agreed to pay a placement fee of 3.5% of the gross proceeds of the concurrent private placement to the placement agents, who are the same firms as are serving as underwriters of the offering made hereby.
We estimate that expenses payable by us in connection with this offering, other than the underwriting discounts and commissions referred to above, will be approximately $2.8 million. We have agreed to reimburse the underwriters at closing for (a) all reasonable attorneys’ fees and expenses not to exceed $100,000 and (b) all other reasonable out-of-pocket fees and expenses.
In addition, we have agreed to issue warrants to the underwriters to purchase a number of shares of Class A common stock equal to 4.0% of the number of shares sold in this offering, excluding any shares purchased by PRC-based investors identified by us and the option to purchase additional shares. These warrants will be exercisable upon issuance, will have an exercise price equal to 110% of the initial public offering price and will terminate on the fifth anniversary of the effective date of the registration statement of which this prospectus is a part. The warrants and the underlying shares of Class A common stock have been deemed compensation by the Financial Industry Regulatory Authority, Inc., or FINRA, and are therefore subject to FINRA Rule 5110(g)(1). In accordance with FINRA Rule 5110(g)(1), neither the underwriter warrants nor any of our shares issued upon exercise of the underwriter warrants may be sold, transferred, assigned, pledged or hypothecated, or be the subject of any hedging, short sale, derivative, put or call transaction that would result in the effective economic disposition of such securities by any person, for a period of 180 days immediately following the date of effectiveness or commencement of sales of the offering pursuant to which the underwriter warrants are being issued, subject to certain exceptions.
We have also agreed to give Roth Capital Partners, LLC a right of first refusal to act as our lead underwriter or lead financial advisor or placement agent in any subsequent equity or equity-related financing for six months following the date of this prospectus.
Indemnification
We have agreed to indemnify the underwriters against certain liabilities, including liabilities under the Securities Act and liabilities arising from breaches of representations and warranties contained in the underwriting agreement, or to contribute to payments that the underwriters may be required to make in respect of those liabilities.
Lock-Up Agreements
We, our officers and directors and holders of substantially all of our capital stock have agreed, subject to certain exceptions, for a period of 180 days after the date of the underwriting agreement, not to offer, sell, contract to sell, pledge, grant any option to purchase, make any short sale or otherwise dispose of, directly or indirectly any shares of common stock or any option, warrant, right or other security exercisable or exchangeable for, convertible into or otherwise giving the holder thereof the right to obtain shares of common stock, except with the prior written consent of the representative. This agreement does not apply to any existing employee benefit plans.
Price Stabilization, Short Positions and Penalty Bids
In connection with the offering the underwriters may engage in stabilizing transactions, over-allotment transactions, syndicate covering transactions and penalty bids in accordance with Regulation M under the Securities Exchange Act:
| • | Stabilizing transactions permit bids to purchase the underlying security so long as the stabilizing bids do not exceed a specified maximum. |
142
Table of Contents
| • | Over-allotment involves sales by the underwriters of shares in excess of the number of shares the underwriters are obligated to purchase, which creates a syndicate short position. The short position may be either a covered short position or a naked short position. In a covered short position, the number of shares over-allotted by the underwriters is not greater than the number of shares that they may purchase in the over-allotment option. In a naked short position, the number of shares involved is greater than the number of shares in the over-allotment option. The underwriters may close out any covered short position by either exercising their over-allotment option and/or purchasing shares in the open market. |
| • | Syndicate covering transactions involve purchases of shares of Class A common stock in the open market after the distribution has been completed in order to cover syndicate short positions. In determining the source of shares to close out the short position, the underwriters will consider, among other things, the price of shares available for purchase in the open market as compared to the price at which it may purchase shares through the over-allotment option. If the underwriters sell more shares than could be covered by the over-allotment option, a naked short position, the position can only be closed out by buying shares in the open market. A naked short position is more likely to be created if the underwriters are concerned that there could be downward pressure on the price of the shares in the open market after pricing that could adversely affect investors who purchase in the offering. |
| • | Penalty bids permit the representative to reclaim a selling concession from a syndicate member when the shares of Class A common stock originally sold by the syndicate member is purchased in a stabilizing or syndicate covering transaction to cover syndicate short positions. |
These stabilizing transactions, syndicate covering transactions and penalty bids may have the effect of raising or maintaining the market price of the Class A common stock or preventing or retarding a decline in the market price of the Class A common stock. As a result, the price of the Class A common stock may be higher than the price that might otherwise exist in the open market. Neither we nor the underwriters make any representation or prediction as to the direction or magnitude of any effect that the transactions described above may have on the price of the Class A common stock. In addition, neither we nor the underwriters make any representations that the underwriters will engage in these stabilizing transactions or that any transaction, once commenced, will not be discontinued without notice.
Passive Market Making
In connection with this offering, the underwriters and any selling group members may engage in passive market making transactions in the Class A common stock on The NASDAQ Stock Market in accordance with Rule 103 of Regulation M under the Securities Exchange Act, during a period before the commencement of offers or sales of Class A common stock and extending through the completion of the distribution. A passive market maker must display its bid at a price not in excess of the highest independent bid of that security. However, if all independent bids are lowered below the passive market maker’s bid that bid must then be lowered when specified purchase limits are exceeded.
Listing
We have applied to list the Class A common stock on the Nasdaq Global Market under the symbol “ACMR.”
Selling Restrictions
Other than in the United States, no action has been taken by us or the underwriters that would permit a public offering of the securities offered by this prospectus in any jurisdiction where action for that purpose is required. The securities offered by this prospectus may not be offered or sold, directly or indirectly, nor may this prospectus or any other offering material or advertisements in connection with the offer and sale of any such securities be distributed or published in any jurisdiction, except under circumstances that will result in
143
Table of Contents
compliance with the applicable rules and regulations of that jurisdiction. Outside of the United States, persons into whose possession this prospectus comes are advised to inform themselves about and to observe any restrictions imposed by any applicable laws and regulations outside of the United States relating to the offering and the distribution of this prospectus. This prospectus does not constitute an offer to sell or a solicitation of an offer to buy any securities offered by this prospectus in any jurisdiction in which such an offer or a solicitation is unlawful.
European Economic Area
This prospectus does not constitute an approved prospectus under the Prospectus Directive and no such prospectus is intended to be prepared and approved in connection with this offering. Accordingly, in relation to each Member State of the European Economic Area which has implemented the Prospectus Directive (each, a “Relevant Member State”), an offer to the public of any shares of common stock which are the subject of the offering contemplated by this prospectus may not be made in that Relevant Member State except that an offer to the public in that Relevant Member State of any shares of Class A common stock may be made at any time under the following exemptions under the Prospectus Directive, if and to the extent that they have been implemented in that Relevant Member State:
| • | to any legal entity which is a qualified investor as defined in the Prospectus Directive; |
| • | to fewer than 100 or, if the Relevant Member State has implemented the relevant provision of the 2010 PD Amending Directive, 150, natural or legal persons (other than qualified investors as defined in the Prospectus Directive), subject to obtaining the prior consent of the representative of the underwriters for any such offer; or |
| • | in any other circumstances which do not require any person to publish a prospectus pursuant to Article 3 of the Prospectus Directive. |
For the purposes of this provision, the expression an “offer to the public” in relation to any shares of Class A common stock in any Relevant Member State means the communication in any form and by any means of sufficient information on the terms of the offer and any shares of Class A common stock to be offered so as to enable an investor to decide to purchase any shares of Class A common stock, as the expression may be varied in that Member State by any measure implementing the Prospectus Directive in that Member State, and the expression “Prospectus Directive” means Directive 2003/71/EC (and any amendments thereto including the 2010 PD Amending Directive to the extent implemented in each Relevant Member State) and includes any relevant implementing measure in each Relevant Member State and the expression “2010 PD Amending Directive” means Directive 2010/73/EU.
Israel
This document does not constitute a prospectus under the Israeli Securities Law, 5728-1968, and has not been filed with, or approved by, the Israel Securities Authority. In Israel, this prospectus is being distributed only to, and is directed only at, investors listed in the first addendum (the “Addendum”) to the Israeli Securities Law, consisting primarily of joint investment in trust funds, provident funds, insurance companies, banks, portfolio managers, investment advisors, members of the Tel Aviv Stock Exchange, underwriters purchasing for their own account, venture capital funds, entities with equity in excess of NIS 50 million and “qualified individuals,” each as defined in the Addendum, as it may be amended from time to time. These investors may be required to submit written confirmation that they fall within the scope of the Addendum.
United Kingdom
This prospectus is not an approved prospectus for purposes of the UK Prospectus Rules, as implemented under the Prospectus Directive, and has not been approved under section 21 of the UK Financial Services and
144
Table of Contents
Markets Act 2000, as amended, or FSMA, by a person authorized under FSMA. The financial promotions contained in this prospectus are directed at, and this prospectus is only being distributed to, (a) persons who receive this prospectus outside of the United Kingdom, (b) persons in the United Kingdom who fall within the exemptions under articles 19 (investment professionals) and 49(2)(a) to (d) (high net worth companies, unincorporated associations, etc.) of the Financial Services and Markets Act 2000 (Financial Promotion) Order 2005 (the “Order”), and (c) persons in the United Kingdom who fall within the exemption under article 49(2)(e) of the Order to whom this prospectus may otherwise be lawfully distributed (all such persons together being referred to as “Relevant Persons”). This prospectus must not be acted upon or relied upon by any person who is not a Relevant Person. Any investment or investment activity to which this prospectus relates is available only to Relevant Persons and will be engaged in only with Relevant Persons. This prospectus and its contents are confidential and should not be distributed, published or reproduced (in whole or in part) or disclosed by recipients to any other person that is not a Relevant Person.
Each underwriter has represented, warranted and agreed that:
| • | it has only communicated or caused to be communicated and will only communicate or cause to be communicated any invitation or inducement to engage in investment activity (within the meaning of section 21 of FSMA) in connection with the issue or sale of any of the shares of Class A common stock in circumstances in which section 21(1) of FSMA does not apply; and |
| • | it has complied with and will comply with all applicable provisions of FSMA with respect to anything done by it in relation to the shares of Class A common stock in, from or otherwise involving the United Kingdom. |
Hong Kong
The underwriters and each of their affiliates have not (1) offered or sold, and will not offer or sell, in Hong Kong, by means of any document, any shares of Class A common stock other than (a) to “professional investors” within the meaning of the Securities and Futures Ordinance (Cap. 571) of Hong Kong and any rules made under that Ordinance or (b) in other circumstances which do not result in the document being a “prospectus” as defined in the Companies Ordinance (Cap. 32) of Hong Kong or which do not constitute an offer to the public within the meaning of that Ordinance; and (2) issued or had in its possession for the purposes of issue, and will not issue or have in its possession for the purposes of issue, whether in Hong Kong or elsewhere any advertisement, invitation or document relating to the shares of Class A common stock which is directed at, or the contents of which are likely to be accessed or read by, the public in Hong Kong (except if permitted to do so under the securities laws of Hong Kong) other than with respect to the shares of Class A common stock which are or are intended to be disposed of only to persons outside Hong Kong or only to “professional investors” within the meaning of the Securities and Futures Ordinance and any rules made under that Ordinance. The contents of this document have not been reviewed by any regulatory authority in Hong Kong. You are advised to exercise caution in relation to the offer. If you are in any doubt about any of the contents of this document, you should obtain independent professional advice.
The People’s Republic of China
This prospectus may not be circulated or distributed in China and the Class A common stock may not be offered or sold, and will not offer or sell to any person for re-offering or resale directly or indirectly to any resident of China except pursuant to applicable laws, rules and regulations of China. For the purpose of this paragraph only, China does not include Taiwan and the special administrative regions of Hong Kong and Macau.
Electronic Distribution
This prospectus in electronic format may be made available on websites or through other online services maintained by one or more of the underwriters, or by their affiliates. Other than this prospectus in electronic
145
Table of Contents
format, the information on any underwriter’s website and any information contained in any other website maintained by an underwriter is not part of this prospectus or the registration statement of which this prospectus forms a part, has not been approved and/or endorsed by us or any underwriter in its capacity as underwriter, and should not be relied upon by investors.
Other
From time to time, certain of the underwriters and/or their affiliates have provided, and may in the future provide, various investment banking and other financial services for us for which services they have received and, may in the future receive, customary fees. In the course of their businesses, the underwriters and their affiliates may actively trade our securities or loans for their own account or for the accounts of customers, and, accordingly, the underwriters and their affiliates may at any time hold long or short positions in such securities or loans. Except for services provided in connection with this offering, no underwriter has provided any investment banking or other financial services to us during the 180-day period preceding the date of this prospectus and we do not expect to retain any underwriter to perform any investment banking or other financial services for at least 90 days after the date of this prospectus.
146
Table of Contents
The validity of the Class A common stock being offered will be passed upon for us by K&L Gates LLP, Boston, Massachusetts. Certain legal matters in connection with this offering will be passed upon for the underwriters by Goodwin Procter LLP, New York, New York.
BDO China Shu Lun Pan Certified Public Accountants LLP, our independent registered public accounting firm in the PRC, has audited our consolidated financial statements at, and for the years ended, December 31, 2016 and 2015, as set forth in their report included elsewhere herein. We have included our consolidated financial statements in this prospectus and the registration statement in reliance on said firm’s report, given on their authority as experts in accounting and auditing.
WHERE YOU CAN FIND ADDITIONAL INFORMATION
We have filed with the SEC a registration statement on Form S-1 under the Securities Act with respect to the Class A common stock we are offering. This prospectus, which constitutes a part of the registration statement, does not contain all of the information set forth in the registration statement, some items of which are contained in exhibits to the registration statement as permitted by the rules and regulations of the SEC. For further information with respect to us and Class A common stock, we refer you to the registration statement, including the exhibits and the consolidated financial statements and notes filed as a part of the registration statement. Statements contained in this prospectus concerning the contents of any contract or any other document are not necessarily complete. If a contract or document has been filed as an exhibit to the registration statement, please see the copy of the contract or document that has been filed. Each statement in this prospectus relating to a contract or document filed as an exhibit is qualified in all respects by the filed exhibit. The exhibits to the registration statement should be reviewed for the complete contents of these contracts and documents.
A copy of the registration statement, including the exhibits and the consolidated financial statements and notes filed as a part of the registration statement, may be inspected without charge at the SEC’s Public Reference Room at 100 F Street, N.E., Washington, D.C. 20549, and copies of all or any part of the registration statement may be obtained from the SEC upon the payment of fees prescribed by it. You may call the SEC at 1-800-SEC-0330 for more information on the operation of the public reference facilities. The SEC maintains a website at http://www.sec.gov that contains reports, proxy and information statements and other information regarding companies, including ACM, that file electronically with it.
Upon completion of this offering, we will be subject to the information reporting requirements of the Securities Act and we will file reports, proxy statements and other information with the SEC. These reports, proxy statements and other information will be available for inspection and copying at the public reference room and website of the SEC referred to above. We also maintain a website at www.acmrcsh.com, at which you may access these materials free of charge as soon as reasonably practicable after they are electronically filed with, or furnished to, the SEC. Information contained on our website is not incorporated by reference into this prospectus, and you should not consider information contained on our website to be part of this prospectus or in deciding whether to purchase shares of Class A common stock.
147
Table of Contents
ACM RESEARCH, INC.
Index to Consolidated Financial Statements
| Page | ||||
| F-2 | ||||
| Consolidated Balance Sheets as of June 30, 2017 (unaudited) and December 31, 2016 and 2015 |
F-3 | |||
| F-4 | ||||
| F-5 | ||||
| F-6 | ||||
| F-7 | ||||
F-1
Table of Contents
Report of Independent Registered Public Accounting Firm
The Board of Directors and Stockholders of
ACM Research, Inc.
We have audited the accompanying consolidated balance sheets of ACM Research, Inc. and its subsidiaries (the “Company”) as of December 31, 2016 and 2015, and the related consolidated statements of operations and comprehensive income, changes in redeemable convertible preferred stock and stockholders’ equity (deficit), and cash flows for the years then ended. These consolidated financial statements are the responsibility of the Company’s management. Our responsibility is to express an opinion on these consolidated financial statements based on our audit.
We conducted our audit in accordance with the standards of the Public Company Accounting Oversight Board (United States). Those standards require that we plan and perform the audit to obtain reasonable assurance about whether the financial statements are free of material misstatement. The Company is not required to have, nor were we engaged to perform, an audit of its internal control over financial reporting. Our audit included consideration of internal control over financial reporting as a basis for designing audit procedures that are appropriate in the circumstances, but not for the purpose of expressing an opinion on the effectiveness of the Company’s internal control over financial reporting. Accordingly, we express no such opinion. An audit also includes examining, on a test basis, evidence supporting the amounts and disclosures in the financial statements, assessing the accounting principles used and significant estimates made by management, as well as evaluating the overall financial statement presentation. We believe that our audit provides a reasonable basis for our opinion.
In our opinion, the consolidated financial statements referred to above present fairly, in all material respects, the financial position of the Company at December 31, 2016 and 2015, and the results of its operations and its cash flows for the years then ended, in conformity with accounting principles generally accepted in the United States of America.
/s/ BDO China Shu Lun Pan Certified Public Accountants LLP
Shenzhen, the People’s Republic of China
September 13, 2017
F-2
Table of Contents
ACM RESEARCH, INC.
| June 30, 2017 |
December 31, | Pro Forma June 30, 2017 |
||||||||||||||
| 2016 | 2015 | |||||||||||||||
| (unaudited) | (unaudited) | |||||||||||||||
| (in thousands, except share and per share data) |
||||||||||||||||
| Assets | ||||||||||||||||
| Current assets: |
||||||||||||||||
| Cash and cash equivalents |
$ | 13,206 | $ | 10,119 | $ | 4,401 | $ | 13,206 | ||||||||
| Accounts receivable, less allowance for doubtful accounts of $0 (unaudited), $0 and $116 as of June 30, 2017 and December 31, 2016 and 2015, respectively (note 3) |
12,310 | 16,026 | 12,070 | 12,310 | ||||||||||||
| Other receivables |
2,220 | 1,763 | 1,224 | 2,220 | ||||||||||||
| Inventory (note 4) |
14,106 | 11,666 | 9,146 | 14,106 | ||||||||||||
| Prepaid expenses |
1,382 | 720 | 1,100 | 1,382 | ||||||||||||
| Other current assets |
816 | 53 | 7 | 816 | ||||||||||||
|
|
|
|
|
|
|
|
|
|||||||||
| Total current assets |
44,040 | 40,347 | 27,948 | 44,040 | ||||||||||||
| Property, plant and equipment, net (note 5) |
2,233 | 2,262 | 1,770 | 2,233 | ||||||||||||
| Intangible assets, net |
41 | 17 | 1 | 41 | ||||||||||||
| Deferred tax assets (note 17) |
1,123 | 1,841 | 2,432 | 1,123 | ||||||||||||
|
|
|
|
|
|
|
|
|
|||||||||
| Total assets |
$ | 47,437 | $ | 44,467 | $ | 32,151 | $ | 47,437 | ||||||||
|
|
|
|
|
|
|
|
|
|||||||||
| Liabilities, Redeemable Convertible Preferred Stock and Stockholders’ Equity (Deficit) |
||||||||||||||||
| Current liabilities: |
||||||||||||||||
| Short-term borrowings (note 6) |
$ | 4,584 | $ | 4,761 | $ | 6,854 | $ | 4,584 | ||||||||
| Notes payable (including related-party notes of $4 (unaudited), $4 and $768 as of June 30, 2017 and December 31, 2016 and 2015, respectively (note 12)) (note 8) |
11 | 11 | 2,837 | 11 | ||||||||||||
| Investors’ deposits (note 9) |
— | 2,902 | — | — | ||||||||||||
| Warrant liability (note 10) |
2,970 | — | — | 2,970 | ||||||||||||
| Accounts payable |
8,225 | 5,173 | 2,094 | 8,225 | ||||||||||||
| Advances from customers |
— | 215 | 4,635 | — | ||||||||||||
| Income taxes payable |
44 | 44 | 44 | 44 | ||||||||||||
| Other payables and accrued expenses (including amounts due to a related-party of $1,982 (unaudited), $1,883 and $2,070 as of June 30, 2017 and December 31, 2016 and 2015, respectively (note 12)) (note 7) |
4,773 | 3,963 | 4,103 | 4,773 | ||||||||||||
|
|
|
|
|
|
|
|
|
|||||||||
| Total current liabilities |
20,607 | 17,069 | 20,567 | 20,607 | ||||||||||||
| Other long-term liabilities (note 11) |
7,276 | 6,879 | 7,187 | 7,276 | ||||||||||||
|
|
|
|
|
|
|
|
|
|||||||||
| Total liabilities |
27,883 | 23,948 | 27,754 | 27,883 | ||||||||||||
|
|
|
|
|
|
|
|
|
|||||||||
| Commitments and contingencies (Note 18) |
||||||||||||||||
| Redeemable convertible preferred stock, with par value $0.0001 as of June 30, 2017 and December 31, 2016 and without par value as of December 31, 2015: |
||||||||||||||||
| Series A: 385,000 shares authorized, issued and outstanding as of June 30, 2017 (unaudited) and December 31, 2016 and 2015 (liquidation value of $308 at June 30, 2017 (unaudited) and December 31, 2016 and 2015); and no shares authorized, issued or outstanding pro forma as of June 30, 2017 (unaudited) |
288 | 288 | 288 | — | ||||||||||||
| Series B: 1,572,000 shares authorized, issued and outstanding as of June 30, 2017 (unaudited) and December 31, 2016 and 2015 (liquidation value of $1,572 at June 30, 2017 (unaudited) and December 31, 2016 and 2015) and no shares authorized, issued or outstanding pro forma as of June 30, 2017 (unaudited) |
1,572 | 1,572 | 1,572 | — | ||||||||||||
| Series C: 1,360,962 shares authorized, issued and outstanding as of June 30, 2017 (unaudited) and December 31, 2016 (liquidation value of $2,041 at June 30, 2017 (unaudited) and December 31, 2016); 1,400,000 shares authorized and 1,360,962 shares issued and outstanding as of December 31, 2015 (liquidation value of $2,041); and no shares authorized, issued or outstanding, pro forma as of June 30, 2017 (unaudited) |
2,041 | 2,041 | 2,041 | — | ||||||||||||
| Series D: 2,659,975 shares authorized and 1,326,642 shares issued and outstanding as of June 30, 2017 (unaudited) and December 31, 2016 (liquidation value of $4,975 at June 30, 2017 (unaudited) and December 31, 2016); 4,800,000 shares authorized and 1,326,642 shares issued and outstanding as of December 31, 2015 (liquidation value of $4,975); and no shares authorized, issued or outstanding, pro forma as of June 30, 2017 (unaudited) |
4,975 | 4,975 | 4,975 | — | ||||||||||||
| Series E: 10,718,530 shares authorized and no shares issued or outstanding as of June 30, 2017 (unaudited) and December 31, 2016; and no shares authorized, issued or outstanding as of December 31, 2015 and pro forma as of June 30, 2017 (unaudited) |
— | — | — | — | ||||||||||||
| Series F: 6,000,000 shares authorized and 3,663,254 shares issued and outstanding as of June 30, 2017 (unaudited) and December 31, 2016 (liquidation value of $9,158 at June 30, 2017 (unaudited) and December 31, 2016); and no shares authorized, issued or outstanding as of December 31, 2015 and pro forma as of June 30, 2017 (unaudited) |
9,158 | 9,158 | — | — | ||||||||||||
|
|
|
|
|
|
|
|
|
|||||||||
| Total redeemable convertible preferred stock (note 15) |
18,034 | 18,034 | 8,876 | — | ||||||||||||
|
|
|
|
|
|
|
|
|
|||||||||
| Stockholders’ equity (deficit): |
||||||||||||||||
| Common stock (before redomestication), without par value: no shares authorized, issued or outstanding as of June 30, 2017 (unaudited) and December 31, 2016; 100,000,000 shares authorized and 2,047,403 shares issued and outstanding as of December 31, 2015; and no shares authorized, issued or outstanding pro forma as of June 30, 2017 (unaudited) (note 14) |
— | — | 280 | — | ||||||||||||
| Common stock – Class A (after redomestication), with par value $0.0001: 100,000,000 shares authorized and 2,627,293 shares issued and outstanding as of June 30, 2017 (unaudited); 100,000,000 shares authorized and 2,228,740 shares issued and outstanding as of December 31, 2016; no shares authorized, issued or outstanding as of December 31, 2015; 100,000,000 shares authorized and 5,595,928 shares issued and outstanding pro forma as of June 30, 2017 (unaudited) (note 14) |
1 | 1 | — | 1 | ||||||||||||
| Common stock – Class B (after redomestication), with par value $0.0001: 7,303,533 shares authorized and 2,409,738 shares issued and outstanding as of June 30, 2017 (unaudited) and December 31, 2016; no shares authorized, issued or outstanding as of December 31, 2015; and 7,303,533 shares authorized and 2,409,738 shares issued and outstanding pro forma as of June 30, 2017 (unaudited) (note 14) |
1 | 1 | — | 1 | ||||||||||||
| Additional paid in capital |
9,346 | 7,620 | 2,243 | 27,380 | ||||||||||||
| Accumulated deficit |
(12,390 | ) | (9,643 | ) | (10,675 | ) | (12,390 | ) | ||||||||
| Accumulated other comprehensive loss |
(247 | ) | (413 | ) | (84 | ) | (247 | ) | ||||||||
|
|
|
|
|
|
|
|
|
|||||||||
| Total ACM Research, Inc. stockholders’ (deficit) equity |
(3,289 | ) | (2,434 | ) | (8,236 | ) | 14,745 | |||||||||
| Non-controlling interests |
4,809 | 4,919 | 3,757 | 4,809 | ||||||||||||
|
|
|
|
|
|
|
|
|
|||||||||
| Total stockholders’ equity (deficit) |
1,520 | 2,485 | (4,479 | ) | 19,554 | |||||||||||
|
|
|
|
|
|
|
|
|
|||||||||
| Total liabilities, redeemable convertible preferred stock and stockholders’ equity |
$ | 47,437 | $ | 44,467 | $ | 32,151 | $ | 47,437 | ||||||||
|
|
|
|
|
|
|
|
|
|||||||||
The accompanying notes are an integral part of these consolidated financial statements.
F-3
Table of Contents
ACM RESEARCH, INC.
Consolidated Statements of Operations and Comprehensive Income (Loss)
| Six Months Ended June 30, | Year Ended December 31, | |||||||||||||||
| 2017 | 2016 | 2016 | 2015 | |||||||||||||
| (unaudited) | ||||||||||||||||
| (in thousands, except share and per share data) | ||||||||||||||||
| Revenue |
$ | 14,423 | $ | 8,122 | $ | 27,371 | $ | 31,206 | ||||||||
| Cost of revenue |
8,570 | 5,292 | 14,042 | 17,085 | ||||||||||||
|
|
|
|
|
|
|
|
|
|||||||||
| Gross profit |
5,853 | 2,830 | 13,329 | 14,121 | ||||||||||||
|
|
|
|
|
|
|
|
|
|||||||||
| Operating expenses: |
||||||||||||||||
| Sales and marketing |
2,583 | 1,818 | 3,907 | 4,213 | ||||||||||||
| Research and development |
1,867 | 1,486 | 3,259 | 2,942 | ||||||||||||
| General and administrative |
3,158 | 1,089 | 2,673 | 2,103 | ||||||||||||
|
|
|
|
|
|
|
|
|
|||||||||
| Total operating expenses, net |
7,608 | 4,393 | 9,839 | 9,258 | ||||||||||||
|
|
|
|
|
|
|
|
|
|||||||||
| Income (loss) from operations |
(1,755 | ) | (1,563 | ) | 3,490 | 4,863 | ||||||||||
| Interest income |
5 | 6 | 16 | 17 | ||||||||||||
| Interest expense |
(164 | ) | (51 | ) | (181 | ) | (122 | ) | ||||||||
| Other income (expense), net |
(292 | ) | 506 | (343 | ) | 632 | ||||||||||
|
|
|
|
|
|
|
|
|
|||||||||
| Income (loss) before income taxes |
(2,206 | ) | (1,102 | ) | 2,982 | 5,390 | ||||||||||
| Income tax (expense) benefit (note 17) |
(749 | ) | 73 | (595 | ) | 2,525 | ||||||||||
|
|
|
|
|
|
|
|
|
|||||||||
| Net income (loss) |
(2,955 | ) | (1,029 | ) | 2,387 | 7,915 | ||||||||||
| Less: Net income (loss) attributable to non-controlling interests |
(208 | ) | (476 | ) | 1,356 | 2,535 | ||||||||||
|
|
|
|
|
|
|
|
|
|||||||||
| Net income (loss) attributable to ACM Research, Inc. |
$ | (2,747 | ) | $ | (553 | ) | $ | 1,031 | $ | 5,380 | ||||||
|
|
|
|
|
|
|
|
|
|||||||||
| Comprehensive income (loss): |
||||||||||||||||
| Net income (loss) |
$ | (2,955 | ) | $ | (1,029 | ) | $ | 2,387 | $ | 7,915 | ||||||
| Foreign currency translation adjustment |
264 | (133 | ) | (522 | ) | (283 | ) | |||||||||
|
|
|
|
|
|
|
|
|
|||||||||
| Comprehensive income (loss) |
(2,691 | ) | (1,162 | ) | 1,865 | 7,632 | ||||||||||
| Less: Comprehensive income (loss) attributable to non-controlling interests |
(110 | ) | (526 | ) | 1,161 | 2,430 | ||||||||||
|
|
|
|
|
|
|
|
|
|||||||||
| Total comprehensive income (loss) attributable to ACM Research, Inc. (note 2) |
$ |
(2,581 |
) |
$ | (636 | ) | $ | 704 | $ | 5,202 | ||||||
|
|
|
|
|
|
|
|
|
|||||||||
| Net income (loss) per common share (note 2): |
||||||||||||||||
| Basic |
$ | (0.56 | ) | $ | (0.27 | ) | $ | 0.30 | $ | 1.50 | ||||||
|
|
|
|
|
|
|
|
|
|||||||||
| Diluted |
$ | (0.56 | ) | $ | (0.27 | ) | $ | 0.18 | $ | 0.97 | ||||||
|
|
|
|
|
|
|
|
|
|||||||||
| Weighted-average common shares outstanding used in computing per share amounts (note 2): |
||||||||||||||||
| Basic |
4,927,973 | 2,061,339 | 2,176,315 | 2,047,383 | ||||||||||||
|
|
|
|
|
|
|
|
|
|||||||||
| Diluted |
4,927,973 | 2,061,339 | 3,792,137 | 3,144,120 | ||||||||||||
|
|
|
|
|
|
|
|
|
|||||||||
| Pro forma net income (loss) per common share (note 2): |
||||||||||||||||
| Basic |
$ | (0.35 | ) | $ | 0.20 | |||||||||||
|
|
|
|
|
|||||||||||||
| Diluted |
$ | (0.35 | ) | $ | 0.15 | |||||||||||
|
|
|
|
|
|||||||||||||
| Pro forma weighted-average common shares outstanding used in computing per share amounts (note 2): |
||||||||||||||||
| Basic |
7,889,818 | 5,137,211 | ||||||||||||||
|
|
|
|
|
|||||||||||||
| Diluted |
7,889,818 | 6,753,033 | ||||||||||||||
|
|
|
|
|
|||||||||||||
The accompanying notes are an integral part of these consolidated financial statements.
F-4
Table of Contents
ACM RESEARCH, INC.
Consolidated Statement of Changes in Redeemable Convertible Preferred Stock and Stockholders’ Equity (Deficit)
| Redeemable Convertible Preferred Stock | Common Stock |
Common Stock Class A |
Common Stock Class B |
Additional Paid-in Capital |
Accumulated Deficit |
Accumulated Other Comprehensive Income |
Non- controlling Interest |
Total Stockholders’ Deficit |
||||||||||||||||||||||||||||||||||||||||||||||||||||||||||||||||||||||||||||||||
| Series A | Series B | Series C | Series D | Series F | Total Amount |
|||||||||||||||||||||||||||||||||||||||||||||||||||||||||||||||||||||||||||||||||||
| Shares | Amount | Shares | Amount | Shares | Amount | Shares | Amount | Shares | Amount | Shares | Amount | Shares | Amount | Shares | Amount | |||||||||||||||||||||||||||||||||||||||||||||||||||||||||||||||||||||||||
| (in thousands, except share data) | ||||||||||||||||||||||||||||||||||||||||||||||||||||||||||||||||||||||||||||||||||||||||
| Balance at January 1, 2015 |
385,000 | $ | 288 | 1,572,000 | $ | 1,572 | 1,360,962 | $ | 2,041 | 1,326,642 | $ | 4,975 | — | $ | — | $ | 8,876 | 2,047,403 | $ | 280 | — | $ | — | — | $ | — | $ | 1,820 | $ | (16,055 | ) | $ | 94 | $ | 1,327 | $ | (12,534 | ) | ||||||||||||||||||||||||||||||||||||||||||||||||||
| Net income |
— | — | — | — | — | — | — | — | — | — | — | — | — | — | — | — | 5,380 | — | 2,535 | 7,915 | ||||||||||||||||||||||||||||||||||||||||||||||||||||||||||||||||||||
| Foreign currency translation adjustment |
— | — | — | — | — | — | — | — | — | — | — | — | — | — | — | — | — | — | — | (178 | ) | (105 | ) | (283 | ) | |||||||||||||||||||||||||||||||||||||||||||||||||||||||||||||||
| Stock-based compensation |
— | — | — | — | — | — | — | — | — | — | — | — | — | — | — | — | — | 423 | — | — | — | 423 | ||||||||||||||||||||||||||||||||||||||||||||||||||||||||||||||||||
|
|
|
|
|
|
|
|
|
|
|
|
|
|
|
|
|
|
|
|
|
|
|
|
|
|
|
|
|
|
|
|
|
|
|
|
|
|
|
|
|
|
|
|
|
|||||||||||||||||||||||||||||||||||||||||||||
| Balance at December 31, 2015 |
385,000 | 288 | 1,572,000 | 1,572 | 1,360,962 | 2,041 | 1,326,642 | 4,975 | — | — | 8,876 | 2,047,403 | 280 | — | — | — | — | 2,243 | (10,675 | ) | (84 | ) | 3,757 | (4,479 | ) | |||||||||||||||||||||||||||||||||||||||||||||||||||||||||||||||
| Net loss |
— | — | — | — | — | — | — | — | — | — | — | — | — | — | — | — | — | — | 1,031 | — | 1,356 | 2,387 | ||||||||||||||||||||||||||||||||||||||||||||||||||||||||||||||||||
| Foreign currency translation adjustment |
— | — | — | — | — | — | — | — | — | — | — | — | — | — | — | — | — | — | — | (329 | ) | (193 | ) | (522 | ) | |||||||||||||||||||||||||||||||||||||||||||||||||||||||||||||||
| Redomestication |
— | — | — | — | — | — | — | — | — | — | — | (2,047,403 | ) | (280 | ) | — | — | 2,047,403 | 1 | 279 | — | — | — | — | ||||||||||||||||||||||||||||||||||||||||||||||||||||||||||||||||
| Issuance of stock |
— | — | — | — | — | — | — | — | 3,615,800 | 9,039 | 9,039 | — | — | — | — | — | — | — | — | — | — | — | ||||||||||||||||||||||||||||||||||||||||||||||||||||||||||||||||||
| Debt conversion |
— | — | — | — | — | — | — | — | 47,454 | 119 | 119 | — | — | 1,812,069 | 1 | — | — | 4,131 | — | — | — | 4,132 | ||||||||||||||||||||||||||||||||||||||||||||||||||||||||||||||||||
| Exercise of stock option |
— | — | — | — | — | — | — | — | — | — | — | — | — | 416,671 | — | 362,335 | — | 584 | — | — | — | 584 | ||||||||||||||||||||||||||||||||||||||||||||||||||||||||||||||||||
| Stock-based compensation |
— | — | — | — | — | — | — | — | — | — | — | — | — | — | — | — | — | 383 | — | — | — | 383 | ||||||||||||||||||||||||||||||||||||||||||||||||||||||||||||||||||
|
|
|
|
|
|
|
|
|
|
|
|
|
|
|
|
|
|
|
|
|
|
|
|
|
|
|
|
|
|
|
|
|
|
|
|
|
|
|
|
|
|
|
|
|
|||||||||||||||||||||||||||||||||||||||||||||
| Balance at December 31, 2016 |
385,000 | $ | 288 | 1,572,000 | $ | 1,572 | 1,360,962 | $ | 2,041 | 1,326,642 | $ | 4,975 | 3,663,254 | $ | 9,158 | $ | 18,034 | — | $ | — | 2,228,740 | $ | 1 | 2,409,738 | $ | 1 | $ | 7,620 | $ | (9,643 | ) | $ | (413 | ) | $ | 4,919 | $ | 2,485 | ||||||||||||||||||||||||||||||||||||||||||||||||||
| Net loss (unaudited) |
— | — | — | — | — | — | — | — | — | — | — | — | — | — | — | — | — | — | (2,747 | ) | — | (208 | ) | (2,955 | ) | |||||||||||||||||||||||||||||||||||||||||||||||||||||||||||||||
| Foreign currency translation adjustment (unaudited) |
— | — | — | — | — | — | — | — | — | — | — | — | — | — | — | |
— |
|
— | — | — | 166 | 98 | 264 | ||||||||||||||||||||||||||||||||||||||||||||||||||||||||||||||||
| Exercise of stock option (unaudited) |
— | — | — | — | — | — | — | — | — | — | — | — | — | 398,553 | 0 | — | — | 378 | — | — | — | 378 | ||||||||||||||||||||||||||||||||||||||||||||||||||||||||||||||||||
| Stock-based compensation (unaudited) |
— | — | — | — | — | — | — | — | — | — | — | — | — | — | — | — | — | 1,348 | — | — | — | 1,348 | ||||||||||||||||||||||||||||||||||||||||||||||||||||||||||||||||||
|
|
|
|
|
|
|
|
|
|
|
|
|
|
|
|
|
|
|
|
|
|
|
|
|
|
|
|
|
|
|
|
|
|
|
|
|
|
|
|
|
|
|
|
|
|||||||||||||||||||||||||||||||||||||||||||||
| Balance at June 30, 2017 (unaudited) |
385,000 | $ | 288 | 1,572,000 | $ | 1,572 | 1,360,962 | $ | 2,041 | 1,326,642 | $ | 4,975 | 3,663,254 | $ | 9,158 | $ | 18,034 | — | — | 2,627,293 | $ | 1 | 2,409,738 | $ | 1 | $ | 9,346 | $ | (12,390 | ) | $ | (247 | ) | $ | 4,809 | $ | 1,520 | |||||||||||||||||||||||||||||||||||||||||||||||||||
|
|
|
|
|
|
|
|
|
|
|
|
|
|
|
|
|
|
|
|
|
|
|
|
|
|
|
|
|
|
|
|
|
|
|
|
|
|
|
|
|
|
|
|
|
|||||||||||||||||||||||||||||||||||||||||||||
The accompanying notes are an integral part of these consolidated financial statements.
F-5
Table of Contents
ACM RESEARCH, INC.
Consolidated Statements of Cash Flows
| Six Months Ended June 30, |
Year Ended December 31, |
|||||||||||||||
| 2017 | 2016 | 2016 | 2015 | |||||||||||||
| (unaudited) |
||||||||||||||||
| (in thousands) | ||||||||||||||||
| Cash flows from operating activities: |
||||||||||||||||
| Net income (loss) |
$ | (2,955 | ) | $ | (1,029 | ) | $ | 2,387 | $ | 7,915 | ||||||
| Adjustments to reconcile net income (loss) from operations to net cash provided by operating activities: |
||||||||||||||||
| Depreciation and amortization |
118 | 88 | 187 | 160 | ||||||||||||
| Loss on disposals of fixed assets, intangible assets and other long-term assets |
— | 3 | 3 | — | ||||||||||||
| Net loss from debt conversion and interest waiver |
— | — | 1,608 | — | ||||||||||||
| Deferred income taxes |
747 | (74 | ) | 436 | (2,432 | ) | ||||||||||
| Stock-based compensation |
1,348 | 193 | 383 | 423 | ||||||||||||
| Net changes in operating assets and liabilities: |
||||||||||||||||
| Accounts receivable |
4,095 | 11,441 | (4,724 | ) | (7,429 | ) | ||||||||||
| Other receivables |
(413 | ) | (181 | ) | (621 | ) | 365 | |||||||||
| Inventory |
(2,189 | ) | (1,771 | ) | (3,055 | ) | (2,097 | ) | ||||||||
| Prepaid expenses |
(631 | ) | 339 | 219 | (530 | ) | ||||||||||
| Other current assets |
(762 | ) | (5 | ) | (47 | ) | (35 | ) | ||||||||
| Accounts payable |
2,921 | 970 | 3,177 | (2,618 | ) | |||||||||||
| Advances from customers |
(236 | ) | (4,521 | ) | (4,078 | ) | 4,599 | |||||||||
| Income taxes payable |
— | — | — | 44 | ||||||||||||
| Other payables and accrued expenses |
704 | (432 | ) | 276 | 1,110 | |||||||||||
| Other long-term liabilities |
236 | (282 | ) | 147 | 3,227 | |||||||||||
|
|
|
|
|
|
|
|
|
|||||||||
| Net cash provided by operating activities |
2,983 | 4,739 | (3,702 | ) | 2,702 | |||||||||||
|
|
|
|
|
|
|
|
|
|||||||||
| Cash flows from investing activities: |
||||||||||||||||
| Purchase of property and equipment |
(26 | ) | (102 | ) | (795 | ) | (1,371 | ) | ||||||||
| Purchase of intangible assets |
(36 | ) | (9 | ) | (22 | ) | — | |||||||||
| Proceed from disposal of property and equipment |
— | 7 | 7 | — | ||||||||||||
|
|
|
|
|
|
|
|
|
|||||||||
| Net cash used in investing activities |
(62 | ) | (104 | ) | (810 | ) | (1,371 | ) | ||||||||
|
|
|
|
|
|
|
|
|
|||||||||
| Cash flows from financing activities: |
||||||||||||||||
| Proceeds from short-term borrowings |
4,584 | 739 | 5,918 | 11,879 | ||||||||||||
| Repayments of short-term borrowings |
(4,861 | ) | (3,770 | ) | (7,575 | ) | (9,605 | ) | ||||||||
| Investors’ deposit |
— | — | 2,902 | — | ||||||||||||
| Proceeds from potential future investment from related party |
|
— |
|
3,318 | — | — | ||||||||||
| Proceeds from stock option exercise to common stock |
378 | 28 | 410 | — | ||||||||||||
| Proceeds from issuance of Series F convertible preferred stock |
— | — | 9,040 | — | ||||||||||||
| Repayments of notes payable |
— | — | (141 | ) | — | |||||||||||
|
|
|
|
|
|
|
|
|
|||||||||
| Net cash provided by financing activities |
|
101 |
|
315 | 10,554 | 2,274 | ||||||||||
|
|
|
|
|
|
|
|
|
|||||||||
| Effect of exchange rate changes on cash and cash equivalents |
65 | 238 | (324 | ) | (378 | ) | ||||||||||
|
|
|
|
|
|
|
|
|
|||||||||
| Net increase in cash and cash equivalents |
3,087 | 5,188 | 5,718 | 3,227 | ||||||||||||
| Cash and cash equivalents at beginning of period |
10,119 | 4,401 | 4,401 | 1,174 | ||||||||||||
|
|
|
|
|
|
|
|
|
|||||||||
| Cash and cash equivalents at end of period |
$ | 13,206 | $ | 9,589 | $ | 10,119 | $ | 4,401 | ||||||||
|
|
|
|
|
|
|
|
|
|||||||||
| Supplemental disclosure of cash flow information: |
||||||||||||||||
| Interest paid |
$ | 164 | $ | 111 | $ | 181 | $ | 290 | ||||||||
| Income taxes refund |
$ | — | $ | — | $ | — | $ | 33 | ||||||||
| Non-cash financing activities: |
||||||||||||||||
| Debt conversion to Class A common stock |
— | — | $ | 1,486 | $ | — | ||||||||||
| Debt conversion to Series F convertible preferred stock |
$ | — | $ | — | $ | 119 | $ | — | ||||||||
| Exercise of stock option in lieu of the cash repayment of notes payable |
— | — | $ | 174 | $ | — | ||||||||||
The accompanying notes are an integral part of these consolidated financial statements.
F-6
Table of Contents
ACM RESEARCH, INC.
Notes to Consolidated Financial Statements
(Information as of June 30, 2017 and for the six months ended
June 30, 2017 and 2016 is unaudited)
(in thousands, except share and per share data)
NOTE 1 – DESCRIPTION OF BUSINESS
ACM Research, Inc. (“ACM”) and its subsidiaries (ACM and such subsidiaries collectively, the “Company”) develop, manufacture and sell single-wafer wet cleaning equipment used to improve the manufacturing process and yield for advanced integrated chips. The Company markets and sells, under the brand name “Ultra C,” lines of equipment based on the Company’s proprietary Space Alternated Phase Shift (“SAPS”) and Timely Energized Bubble Oscillation (“TEBO”) technologies. These tools are designed to remove random defects from a wafer surface efficiently, without damaging the wafer or its features, even at increasingly advanced process nodes.
ACM was incorporated in California in 1998, and it initially focused on developing tools for manufacturing process steps involving the integration of ultra low-K materials and copper. The Company’s early efforts focused on stress-free copper-polishing technology, and it sold tools based on that technology in the early 2000s.
In 2006, the Company established its operational center in Shanghai in the People’s Republic of China (the “PRC”), where it operates through ACM’s subsidiary ACM Research (Shanghai), Inc. (“ACM Shanghai”). The establishment of ACM Shanghai was made to help the Company establish and build relationships with integrated circuit manufacturers in the PRC, and the Company financed its Shanghai operations in part through sales of a non-controlling equity interest in ACM Shanghai.
In 2007, the Company began to focus its development efforts on single-wafer wet-cleaning solutions for the front-end chip fabrication process. The Company introduced its SAPS megasonic technology, which can be applied in wet wafer cleaning at numerous steps during the chip fabrication process, in 2009. It introduced its TEBO technology, which can be applied at numerous steps during the fabrication of small node two-dimensional conventional and three-dimensional patterned wafers, in March 2016.
In 2011, ACM Shanghai formed a wholly owned subsidiary in the PRC, ACM Research (Wuxi), Inc. (“ACM Wuxi”), to manage sales and service operations.
In November 2016, ACM redomesticated from California to Delaware pursuant to a merger (the “Merger”) in which ACM Research, Inc., a California corporation, was merged into a newly formed, wholly owned Delaware subsidiary, also named ACM Research, Inc.
In June 2017, ACM Research, Inc. formed a wholly owned subsidiary in Hong Kong, CleanChip Technologies Limited (“CleanChip”), to act on the Company’s behalf in Asian markets outside the PRC by, for example, serving as a trading partner between ACM Shanghai and its customers, procuring raw materials and components, performing sales and marketing activities, and making strategic investments.
The Company has designed its equipment models for SAPS and TEBO solutions using a modular configuration that enables it to create a wet-cleaning tool meeting the specific requirements of a customer, while using pre-existing designs for chamber, electrical, chemical delivery and other modules. The Company also offers a range of custom-made equipment, including cleaners, coaters and developers, to back-end wafer assembly and packaging factories, principally in the PRC.
As of June 30, 2017 and December 31, 2016 and 2015, ACM owned 62.9% of the outstanding equity interests of ACM Shanghai. As a result, ACM, indirectly through ACM Shanghai, owned 62.9% of the outstanding equity interests of ACM Wuxi as of June 30, 2017 and December 31, 2016 and 2015.
F-7
Table of Contents
ACM RESEARCH, INC.
Notes to Consolidated Financial Statements
(Information as of June 30, 2017 and for the six months ended
June 30, 2017 and 2016 is unaudited)
(in thousands, except share and per share data)
NOTE 2 – SUMMARY OF SIGNIFICANT ACCOUNTING POLICIES
Basis of Presentation
The consolidated financial statements of the Company have been prepared in accordance with accounting principles generally accepted in the United States of America (“GAAP”). Significant accounting policies followed by the Company in the preparation of the accompanying consolidated financial statements are summarized below.
Principles of Consolidation
The consolidated financial statements include the financial statements of ACM and its subsidiaries, ACM Shanghai, ACM Wuxi and CleanChip. Subsidiaries are those entities in which ACM, directly and indirectly, controls more than one half of the voting power. All significant intercompany transactions and balances have been eliminated upon consolidation.
Use of Estimates
The preparation of consolidated financial statements in conformity with GAAP requires management to make estimates and assumptions that affect the reported amounts of assets and liabilities and disclosure of contingent assets and liabilities at the balance sheet date and the reported revenues and expenses during the reported period in the consolidated financial statements and accompanying notes. The Company’s significant accounting estimates and assumptions include, but are not limited to, those used for the valuation and recognition of stock-based compensation arrangements and warrant liability, realization of deferred tax assets, assessment for impairment of long-lived assets, allowance for doubtful accounts, inventory valuation for excess and obsolete inventories, lower of cost and market value or net realizable value of inventories, depreciable lives of property and equipment, and useful life of intangible assets.
Management evaluates these estimates and assumptions on a regular basis. Actual results could differ from those estimates and assumptions.
Unaudited Interim Consolidated Financial Statements
The unaudited interim consolidated financial statements consist of an unaudited consolidated balance sheet as of June 30, 2017, unaudited consolidated statements of operations and comprehensive loss and cash flows for the six months ended June 30, 2017 and 2016, unaudited consolidated statement of changes in redeemable convertible preferred stock and stockholders’ equity for the six months ended June 30, 2017, and the related unaudited footnote disclosures. The unaudited interim consolidated financial statements have been prepared on the same basis as the annual consolidated financial statements and, in the opinion of management, contain all adjustments, consisting only of normal recurring adjustments, necessary to present fairly the financial position, operating results and cash flows of the Company for each of the periods presented. It does not include all the information and footnotes required by GAAP for complete financial statements. The balance sheet as of June 30, 2017 and the operating results for the six months ended June 30, 2017 are not necessarily indicative of the results of operations that may be expected for the year ending December 31, 2017 or any other future period.
Reverse Stock Split
On September 13, 2017, ACM effected a 1-for-3 reverse stock split (the “Reverse Split”) of Class A and Class B common stock (note 20). Unless otherwise indicated, all share numbers, per share amount, share prices,
F-8
Table of Contents
ACM RESEARCH, INC.
Notes to Consolidated Financial Statements
(Information as of June 30, 2017 and for the six months ended
June 30, 2017 and 2016 is unaudited)
(in thousands, except share and per share data)
exercise prices and conversion rates set forth in those notes and the accompanying consolidated financial statements have been adjusted retrospectively to reflect the Reverse Split.
Cash and Cash Equivalents
Cash and cash equivalents consist of cash on hand, bank deposits that are unrestricted as to withdrawal and use, and highly liquid investments with an original maturity date of three months or less at the date of purchase. At times, cash deposits may exceed government-insured limits.
Accounts Receivable
Accounts receivable are presented net of an allowance for doubtful accounts. The Company reviews its accounts receivable on a periodic basis and makes general and specific allowances when there is doubt as to the collectability of individual balances. In evaluating the collectability of individual receivable balances, the Company considers many factors, including the age of the balance, a customer’s historical payment history and credit worthiness, and current economic trends. Accounts are written off after all collection efforts have been exhausted. At June 30, 2017 and December 31, 2016 and 2015, the Company had established, based on a review of its outstanding balances, an allowance for doubtful accounts in the amounts of $0, $0 and $116, respectively.
Inventory
Inventory consists of raw materials and related goods, work-in-progress, finished goods, and other consumable materials such as spare parts. Finished goods typically are shipped from the Company’s warehouse within one month of completion.
Inventory was recorded at the lower of cost or net realizable value at June 30, 2017 and at the lower of cost or market value at December 31, 2016 and 2015.
| • | The cost of a general inventory item is determined using the weighted moving average method. Under the weighted moving average method, the Company calculates the new average price of all items of a particular inventory stock each time one or more items of that stock are purchased. The then-current average price of the stock is used for purposes of determining cost of inventory or cost of revenue. The cost of an inventory item purchased specifically for a customized product is determined using the specific identification method. Low-cost consumable materials and packaging materials are expensed as incurred. |
| • | Market value is determined as the lower of replacement cost or net realizable value. |
| • | Net realizable value is the estimated selling price, in the ordinary course of business, less estimated costs to complete or dispose. |
The Company assesses the recoverability of all inventories quarterly to determine if any adjustments are required. Potential excess or obsolete inventory is written off based on management’s analysis of inventory levels and estimates of future 12-month demand and market conditions.
F-9
Table of Contents
ACM RESEARCH, INC.
Notes to Consolidated Financial Statements
(Information as of June 30, 2017 and for the six months ended
June 30, 2017 and 2016 is unaudited)
(in thousands, except share and per share data)
Deferred Initial Public Offering (“IPO”) Costs
Direct costs incurred by the Company attributable to its proposed IPO of Class A common stock in the United States have been deferred and recorded in other current assets and will be offset against the gross proceeds received from the IPO. At June 30, 2017 and December 30, 2016 and 2015, deferred IPO costs were $797, $41 and $0, respectively.
Property, Plant and Equipment, Net
Property, plant and equipment are recorded at cost less accumulated depreciation and any provision for impairment in value. Depreciation begins when the asset is placed in service and is calculated by using the straight-line method over the estimated useful life of an asset (or, if shorter, over the lease term). Betterments or renewals are capitalized when incurred. Plant, property and equipment is reviewed each year to determine whether any events or circumstances indicate that the carrying amount of the assets may not be recoverable.
Estimated useful lives of assets in the United States are as follows:
| Computer and office equipment |
3 to 5 years | |
| Furniture and fixtures |
5 years | |
| Leasehold improvements |
shorter of lease term or estimated useful life |
ACM’s subsidiaries follow regulations for depreciation of fixed assets implemented under the PRC’s Enterprise Income Tax Law, which state that the minimum useful lives used for calculating depreciation for fixed assets are as follows:
| Manufacturing equipment |
for small to medium-sized equipment, 5 years; for large equipment, estimated by purchasing department at time of acceptance | |
| Furniture and fixtures |
5 years | |
| Transportation equipment |
4 to 5 years | |
| Electronic equipment |
3 years | |
| Leasehold improvements |
remaining lease term for improvements on leased fixed assets or, for large improvements, estimated useful life; not less than 3 years for non-fixed asset repairs |
Expenditures for maintenance and repairs that neither materially add to the value of the property nor appreciably prolong the life of the property are charged to expense as incurred. Upon retirement or sale of an asset, the cost of the asset and the related accumulated depreciation are eliminated from the accounts and any resulting gain or loss is credited or charged to income.
Intangible Assets, Net
Intangible assets consist of software used for finance, manufacturing, and research and development purposes. Assets are valued at cost at the time of acquisition and are amortized over their beneficial periods. If a contract specifies a beneficial period, then the intangible asset is amortized over a term not exceeding the beneficial period. If the contract does not specify a beneficial period, then the intangible asset is amortized over a term not exceeding the valid period specified by local law. If neither the contract nor local law specifies a beneficial period, then the intangible asset is amortized over a period of up to 10 years. Currently, the software that the Company uses is amortized over a two-year period in accordance with the policy described above.
F-10
Table of Contents
ACM RESEARCH, INC.
Notes to Consolidated Financial Statements
(Information as of June 30, 2017 and for the six months ended
June 30, 2017 and 2016 is unaudited)
(in thousands, except share and per share data)
Valuation of Long-Lived Assets
Long-lived assets are evaluated for impairment whenever events or changes in circumstance indicate that the carrying value of the assets may not be fully recoverable or that the useful life of the assets is shorter than the Company had originally estimated. When these events or changes occur, the Company evaluates the impairment of the long-lived assets by comparing the carrying value of the assets to an estimate of future undiscounted cash flows expected to be generated from the use of the assets and their eventual disposition. If the sum of the expected future undiscounted cash flow is less than the carrying value of the assets, the Company recognizes an impairment loss based on the excess of the carrying value over the fair value. No impairment charge was recognized for either of the periods presented.
Leases
Each lease is classified at the inception date as either a capital lease or an operating lease. For the lessee, a lease is a capital lease if any of the following conditions exist: (a) ownership is transferred to the lessee by the end of the lease term; (b) there is a bargain purchase option; (c) the lease term is at least 75% of the property’s estimated remaining economic life; or (d) the present value of the minimum lease payments at the beginning of the lease term is 90% or more of the fair value of the leased property to the leasor at the inception date. A capital lease is accounted for as if there was an acquisition of an asset and an incurrence of an obligation at the inception of the lease. All other leases are accounted for as operating leases. Payments made under operating leases are charged to the consolidated statements of operations and comprehensive income on a straight-line basis over the terms of underlying lease. The Company had no capital lease for either of the periods presented.
Redeemable Convertible Preferred Stock
The Company recorded each series of convertible preferred stock at fair value on the date of issuance, net of issuance costs. The convertible preferred stock is recorded outside of stockholders’ equity (deficit) because, in the event of certain deemed liquidation events considered not solely within the Company’s control (such as a merger, acquisition, or sale of all or substantially all of the Company’s assets), the convertible preferred stock will become redeemable at the option of the holders. The Company has not adjusted the carrying value of any series of convertible preferred stock to the liquidation preference of such series because it is uncertain whether or when an event would occur that would obligate the Company to pay the liquidation preferences to holders of convertible preferred stock. Subsequent adjustments to the carrying values to the liquidation preferences will be made only when it becomes probable that such a liquidation event will occur.
Revenue Recognition
The Company recognizes revenue when all the following conditions are met:
| • | there is persuasive evidence of an arrangement; |
| • | the product delivery has occurred and the Company has transferred major risks and remunerations over the ownership of the product to the buyer or a service has been fully rendered and completed; |
| • | the collection of the receivable is probable; and |
| • | the amount of the payment is fixed or determinable. |
The Company derives revenue principally from sales of semiconductor capital equipment. In general, the Company recognizes revenue when the product has been demonstrated to meet the predetermined specifications
F-11
Table of Contents
ACM RESEARCH, INC.
Notes to Consolidated Financial Statements
(Information as of June 30, 2017 and for the six months ended
June 30, 2017 and 2016 is unaudited)
(in thousands, except share and per share data)
and is accepted by the customer. If terms of the sale provide for a lapsing customer acceptance period, the Company recognizes revenue upon the earlier of the expiration of the lapsing acceptance period and customer acceptance. In the following circumstances, however, the Company recognizes revenue upon shipment or delivery, when the legal title of the product is passed to a customer:
| • | when the customer has previously accepted the same tool with the same specifications and when the Company can objectively demonstrate that the tool meets all of the required acceptance criteria; |
| • | when the sales contract or purchase order contains no acceptance agreement or no lapsing acceptance provision and when the Company can objectively demonstrate that the tool meets all of the required acceptance criteria; |
| • | when the customer withholds acceptance due to issues unrelated to product performance, in which case revenue is recognized when the system is performing as intended and meets predetermined specifications; or |
| • | the Company’s sales arrangements do not include a general right of return. |
Customization, production, installation and delivery are essential elements of the functionality of a delivered machine; the services offered, principally the warranty, are not essential to the functionality of the machine. The Company treats the customization, production, installation and delivery of machines, together with the provision of related warranty and other services, as a single unit of accounting in accordance with Financial Accounting Standards Board (“FASB”) Accounting Standards Codification (“ASC”) Subtopic 605-25, Revenue Recognition – Multiple-Element Arrangements. All of the Company’s products were sold in stand-alone arrangements during the six months ended June 30, 2017 and the years ended December 31, 2016 and 2015.
After the warranty period has expired, the Company will also provide customers with post-warranty services, which mainly include the installation and replacement of parts and small-scale modifications to the existing products. The related revenue and costs are recognized as revenue and cost of revenue, respectively, when the parts have been delivered and installed, risk of loss has passed to the customer, and collection of the resulting receivable is probable.
Cost of Revenue
Cost of revenue primarily consists of: direct materials, comprised principally of parts used in assembling equipment, together with crating and shipping costs; direct labor, including salaries and other labor related expenses attributable to the Company’s manufacturing department; and allocated overhead cost, such as personnel cost, depreciation expense, and allocated administrative costs associated with supply chain management and quality assurance activities, as well as shipping insurance premiums.
Research and Development Costs
Research and development costs relating to the development of new products and processes, including significant improvements and refinements to existing products or to the process of supporting customer evaluations of tools, including the development of new tools for evaluation by customers during the product demonstration process, are expensed as incurred.
Shipping and Handling Costs
Shipping and handling costs, which relate to transportation of products to customer locations, are charged to selling and marketing expense. For the six months ended June 30, 2017 and 2016 and the years ended
F-12
Table of Contents
ACM RESEARCH, INC.
Notes to Consolidated Financial Statements
(Information as of June 30, 2017 and for the six months ended
June 30, 2017 and 2016 is unaudited)
(in thousands, except share and per share data)
December 31, 2016 and 2015, shipping and handling costs included in sales and marketing expense were $48, $16, $75 and $15, respectively.
Borrowing Costs
Borrowing costs attributable directly to the acquisition, construction or production of qualifying assets that require a substantial period of time to be ready for their intended use or sale are capitalized as part of the cost of those assets. Income earned on temporary investments of specific borrowings pending their expenditure on those assets is deducted from borrowing costs capitalized. All other borrowing costs are recognized in interest expenses in the consolidated statements of operations and comprehensive income in the period in which they are incurred. No borrowing costs were capitalized for the six months ended June 30, 2017 or the years ended December 31, 2016 and 2015.
Warranty
For each of its products, the Company generally provides a warranty ranging from 12 to 36 months and covering replacement of the product during the warranty period. The Company accounts for the estimated warranty costs as sales and marketing expenses at the time revenue is recognized. Warranty obligations are affected by historical failure rates and associated replacement costs. Utilizing historical warranty cost records, the Company calculates a rate of warranty expenses to revenue to determine the estimated warranty charge. The Company updates these estimated charges on a regular basis. The following table shows changes in the Company’s warranty obligations for the six months ended June 30, 2017 and 2016 and the years ended December 31, 2016 and 2015.
| Six Months Ended June 30, |
Year Ended December 31, |
|||||||||||||||
| 2017 | 2016 | 2016 | 2015 | |||||||||||||
| Balance at beginning of period |
$ | 290 | $ | 459 | $ | 459 | $ | 141 | ||||||||
| Additions |
283 | 161 | 544 | 595 | ||||||||||||
| Utilized |
(154 | ) | (260 | ) | (713 | ) | (277 | ) | ||||||||
|
|
|
|
|
|
|
|
|
|||||||||
| Balance at end of period |
$ | 419 | $ | 360 | $ | 290 | $ | 459 | ||||||||
|
|
|
|
|
|
|
|
|
|||||||||
Government Subsidies
ACM Shanghai has been awarded three subsidies from local and central governmental authorities in the PRC. The first subsidy, which was awarded in October 2008, relates to the development and commercialization of 65-45 nanometer Stress Free Polishing technology. The second subsidy was awarded in April 2009 to fund interest expenses for short-term borrowings. The third subsidy was awarded in January 2014 and relates to the development of Electro Copper Plating technology. The PRC governmental authorities will provide the majority of the funding, although ACM Shanghai is also required to invest certain amounts in the projects.
The government subsidies contain certain operating conditions and therefore are recorded as long-term liabilities upon receipt. The grant amounts are recognized in the statements of operations and comprehensive income:
| • | Government subsidies relating to current expenses are recorded as reductions of those expenses in the periods in which the current expenses are recorded. For the six months ended June 30, 2017 and 2016 |
F-13
Table of Contents
ACM RESEARCH, INC.
Notes to Consolidated Financial Statements
(Information as of June 30, 2017 and for the six months ended
June 30, 2017 and 2016 is unaudited)
(in thousands, except share and per share data)
| and the years ended December 31, 2016 and 2015, related government subsidies recognized as reductions of relevant expenses in the consolidated statements of operations and comprehensive income were $2,090, $1,976, $6,244 and $3,799, respectively. |
| • | Government subsidies for short-term borrowings’ interest expenses are reported as reductions of interest expenses in the period the interest is accrued, which were $0, $101, $99 and $303, respectively, for the six months ended June 30, 2017 and 2016 and years ended December 31, 2016 and 2015. |
| • | Government subsidies related to depreciable |
| • | assets are credited to income over the useful lives of the related assets for which the grant was received. For the six months ended June 30, 2017 and 2016 and the years ended December 31, 2016 and 2015, related government subsidies recognized as other income in the consolidated statements of operations and comprehensive income were $65, $63, $127 and $105, respectively. |
Unearned government subsidies received are deferred for recognition and recorded as other long-term liabilities (note 11) in the balance sheet until the criteria for such recognition are satisfied.
Stock-based Compensation
ACM grants stock options to employees and non-employee consultants and directors and accounts for those stock-based awards in accordance with FASB ASC Topic 718, Compensation – Stock Compensation, and FASB ASC Subtopic 505-50, Equity-Based Payments to Non-Employees.
Stock-based awards granted to employees are measured at the fair value of the awards on the grant date and are recognized as expenses either (a) immediately on grant, if no vesting conditions are required or (b) using the graded vesting method, net of estimated forfeitures, over the requisite service period. The fair value of stock options is determined using the Black-Scholes valuation model. Stock-based compensation expense, when recognized, is charged to the category of operating expense corresponding to the employee’s service function.
Stock-based awards granted to non-employees are accounted for at the fair value of the awards at the earlier of (a) the date at which a commitment for performance by the non-employee to earn the awards is reached and (b) the date at which the non-employee’s performance is complete. The fair value of such non-employee awards is re-measured at each reporting date using the fair value at each period end until the vesting date. Changes in fair value between the reporting dates are recognized by the graded vesting method.
Operating and Financial Risks
Concentration of Credit Risk
Financial instruments that potentially subject to credit risk consist principally of cash and cash equivalents and accounts receivable. The Company deposits and invests its cash with financial institutions that management believes are creditworthy.
F-14
Table of Contents
ACM RESEARCH, INC.
Notes to Consolidated Financial Statements
(Information as of June 30, 2017 and for the six months ended
June 30, 2017 and 2016 is unaudited)
(in thousands, except share and per share data)
The Company is potentially subject to concentrations of credit risks in its accounts receivable. Four customers individually accounted for greater than ten percent of the Company’s revenue for the year ended 2016 and two of those customers individually accounted for greater than ten percent of the Company’s revenue in 2015:
| Year Ended December 31 | ||||||||
| 2016 | 2015 | |||||||
| Customer A |
33.7 | % | * | |||||
| Customer B |
25.0 | * | ||||||
| Customer C |
24.0 | 86.0 | % | |||||
| Customer D |
16.6 | 10.1 | ||||||
| * | Customer accounted for less than 10% of revenue in the period. |
Interest Rate Risk
As of June 30, 2017 and December 31, 2016 and 2015, the balance of bank borrowings (note 6) and notes payable (note 8) were short-term in nature, matured at various dates within the following year and did not expose the Company to interest rate risk.
Liquidity Risk
The Company’s working capital at June 30, 2017 and December 31, 2016 was sufficient to meet its then-current requirements. The Company may, however, require additional cash due to changing business conditions or other future developments, including any investments or acquisitions the Company decides to pursue. In the long run, the Company intends to rely primarily on cash flows from operations and additional borrowings from financial institutions in order to meet its cash needs. If those sources are insufficient to meet cash requirements, the Company may seek to issue additional debt or equity.
Country Risk
The Company has significant investments in the PRC. The operating results of the Company may be adversely affected by changes in the political and social conditions in the PRC and by changes in Chinese government policies with respect to laws and regulations, anti-inflationary measures, currency conversion and remittance abroad, and rates and methods of taxation, among other things.
Foreign Currency Risk and Translation
The Company’s consolidated financial statements are presented in U.S. dollars, which is the Company’s reporting currency, while the functional currency of ACM’s subsidiaries is the Chinese Renminbi (“RMB”). Changes in the relative values of U.S. dollars and Chinese RMB affect the Company’s reported levels of revenues and profitability as the results of its operations are translated from RMB into U.S. dollars for reporting purposes. Because the Company has not engaged in any hedging activities, it cannot predict the impact of future exchange rate fluctuations on the results of its operations and it may experience economic losses as a result of foreign currency exchange rate fluctuations.
Transactions of ACM’s subsidiaries involving foreign currencies are recorded in functional currency according to the rate of exchange prevailing on the date when the transaction occurs. The ending balances of the
F-15
Table of Contents
ACM RESEARCH, INC.
Notes to Consolidated Financial Statements
(Information as of June 30, 2017 and for the six months ended
June 30, 2017 and 2016 is unaudited)
(in thousands, except share and per share data)
Company’s foreign currency accounts are converted into functional currency using the rate of exchange prevailing at the end of each reporting period. Net gains and losses resulting from foreign exchange transactions are included in the consolidated statements of operations and comprehensive income. Total exchange gain was, respectively, $408 and $383 for the six months ended June 30, 2017 and 2016 and $746 and $659 for the years ended December 31, 2016 and 2015.
In accordance with FASB ASC Topic 830, Foreign Currency Matters, the Company translates assets and liabilities into U.S. dollars from RMB using the rate of exchange prevailing at the applicable balance sheet date and the consolidated statements of operations and comprehensive income and consolidated statements of cash flows are translated at an average rate during the reporting period. Adjustments resulting from the translation are recorded in stockholders’ (deficit) equity as part of accumulated other comprehensive income (loss). Any differences between the initially recorded amount and the settlement amount are recorded as a gain or loss on foreign currency transaction in the consolidated statements of operations and comprehensive income.
Translations of amounts from RMB into U.S. dollars were made at the following exchange rates for the respective dates and periods:
| Consolidated balance sheets: |
||||
| At June 30, 2017 |
RMB 6.7751 to $1.00 | |||
| At December 31, 2016 |
RMB 6.9348 to $1.00 | |||
| At December 31, 2015 |
RMB 6.4936 to $1.00 | |||
| Consolidated statements of operations and comprehensive income: |
||||
| Six months ended June 30, 2017 |
RMB 6.8681 to $1.00 | |||
| Six months ended June 30, 2016 |
RMB 6.5317 to $1.00 | |||
| Year ended December 31, 2016 |
RMB 6.6401 to $1.00 | |||
| Year ended December 31, 2015 |
RMB 6.2284 to $1.00 | |||
Income Taxes
The Company accounts for income taxes using the liability method whereby deferred tax asset and liability account balances are determined based on differences between the financial reporting and tax bases of assets and liabilities and are measured using the enacted tax rates and laws that will be in effect when the differences are expected to reverse. The Company provides a valuation allowance, if necessary, to reduce deferred tax assets to their estimated realizable values.
In evaluating the ability to recover its deferred income tax assets, the Company considers all available positive and negative evidence, including its operating results, ongoing tax planning and forecasts of future taxable income on a jurisdiction-by-jurisdiction basis. In the event the Company determines that it would be able to realize its deferred income tax assets in the future in excess of their net recorded amount, it would make an adjustment to the valuation allowance that would reduce the provision for income taxes. Conversely, in the event that all or part of the net deferred tax assets are determined not to be realizable in the future, an adjustment to the valuation allowance would be charged to earnings in the period such determination is made.
Tax benefits related to uncertain tax positions are recognized when it is more likely than not that a tax position will be sustained during an audit. Interest and penalties related to unrecognized tax benefits are included within the provision for income tax.
F-16
Table of Contents
ACM RESEARCH, INC.
Notes to Consolidated Financial Statements
(Information as of June 30, 2017 and for the six months ended
June 30, 2017 and 2016 is unaudited)
(in thousands, except share and per share data)
Basic and Diluted Net Income (Loss) per Common Share
Basic and diluted net income (loss) per common share are calculated as follows:
| Six Months Ended June 30, | Year Ended December 31, | |||||||||||||||
| 2017 | 2016 | 2016 | 2015 | |||||||||||||
| Numerator: |
||||||||||||||||
| Net income (loss) |
$ | (2,955 | ) | $ | (1,029 | ) | $ | 2,387 | $ | 7,915 | ||||||
| Net income (loss) attributable to non-controlling interest |
(208 | ) | (476 | ) | 1,356 | 2,535 | ||||||||||
| Net income allocated to participating securities |
— | — | 386 | 2,317 | ||||||||||||
|
|
|
|
|
|
|
|
|
|||||||||
| Net income (loss) available to common stockholders, basic and diluted |
$ | (2,747 | ) | $ | (553 | ) | $ | 645 | $ | 3,063 | ||||||
|
|
|
|
|
|
|
|
|
|||||||||
| Denominator: |
||||||||||||||||
| Weighted average shares outstanding, basic |
4,927,973 | 2,061,339 | 2,176,315 | 2,047,383 | ||||||||||||
| Effect of dilutive securities: Stock options |
— | — | 1,615,822 | |
1,096,737 |
| ||||||||||
|
|
|
|
|
|
|
|
|
|||||||||
| Weighted average shares outstanding, diluted |
4,927,973 | 2,061,339 | 3,792,137 | 3,144,120 | ||||||||||||
|
|
|
|
|
|
|
|
|
|||||||||
| Net income (loss) per common share: |
||||||||||||||||
| Basic |
$ | (0.56 | ) | $ | (0.27 | ) | $ | 0.30 | $ | 1.50 | ||||||
| Diluted |
$ | (0.56 | ) | $ | (0.27 | ) | $ | 0.18 | $ | 0.97 | ||||||
Basic and diluted net income (loss) per common share is presented using the two-class method, which allocates undistributed earnings to common stock and any participating securities according to dividend rights and participation rights on a proportionate basis. Under the two-class method, basic net income (loss) per common share is computed by dividing the sum of distributed and undistributed earnings attributable to common stockholders by the weighted average number of shares of common stock outstanding during the period. Shares of ACM’s Series A, B, C, D and F convertible preferred stock are participating securities, as the holders are entitled to participate in and receive the same dividends as may be declared for common stockholders on a pro-rata, if-converted basis.
ACM has been authorized to issue Class A and Class B common stock since redomesticating in Delaware in November 2016. The two classes of common stock are substantially identical in all material respects, except for voting rights. Since ACM did not declare any dividends for the six months ended June 30, 2017 or the year ended December 31, 2016, the net income (loss) per common share attributable to each class is the same under the “two-class” method. As such, the two classes of common stock have been presented on a combined basis in the consolidated statements of operations and comprehensive (loss) income and in the above computation of net income (loss) per common share.
Diluted net income (loss) per common share reflects the potential dilution from securities that could share in ACM’s earnings. All potential dilutive securities, including potentially dilutive convertible preferred stocks and stock options, if any, were excluded from the computation of dilutive net loss per common share for the six
F-17
Table of Contents
ACM RESEARCH, INC.
Notes to Consolidated Financial Statements
(Information as of June 30, 2017 and for the six months ended
June 30, 2017 and 2016 is unaudited)
(in thousands, except share and per share data)
months ended June 30, 2017 and 2016, as their effects are antidilutive due to our net loss for those periods. The potentially dilutive securities that were not included in the calculation of diluted net income per share in the periods presented where their inclusion would be anti-dilutive are as follows:
| Six Months Ended June 30, | Year Ended December 31, | |||||||||||||||
| 2017 | 2016 | 2016 | 2015 | |||||||||||||
| Series A convertible preferred stock |
128,334 | 128,334 | 128,334 | 128,334 | ||||||||||||
| Series B convertible preferred stock |
524,003 | 524,003 | 524,003 | 524,003 | ||||||||||||
| Series C convertible preferred stock |
482,288 | 482,288 | 482,288 | 453,666 | ||||||||||||
| Series D convertible preferred stock |
605,244 | 605,244 | 605,244 | 442,226 | ||||||||||||
| Series F convertible preferred stock |
1,221,099 | — | 1,221,099 | — | ||||||||||||
| Stock options |
3,489,959 | 2,996,686 | 1,424,596 | — | ||||||||||||
| Warrant |
397,502 | — | — | — | ||||||||||||
|
|
|
|
|
|
|
|
|
|||||||||
| 6,848,429 | 4,736,555 | 4,385,564 | 1,548,229 | |||||||||||||
|
|
|
|
|
|
|
|
|
|||||||||
Comprehensive Income (Loss) Attributable to the Company
The Company applies FASB ASC Topic 220, Comprehensive Income, which establishes standards for the reporting and display of comprehensive income or loss, requiring its components to be reported in a financial statement with the same prominence as other financial statements. The comprehensive income (loss) attributable to the Company was $(2,581), $(636), $704 and $5,202 for the six months ended June 30, 2017 and 2016 and the years ended December 31, 2016 and 2015, respectively.
Appropriated Retained Earnings
The income of ACM’s PRC subsidiaries is distributable to their shareholders after transfers to reserves as required under relevant PRC laws and regulations and the subsidiaries’ Articles of Association. As stipulated by the relevant laws and regulations in the PRC, the PRC subsidiaries are required to maintain reserves, including reserves for statutory surpluses and public welfare funds that are not distributable to shareholders. A PRC subsidiary’s appropriations to the reserves are approved by its board of directors. At least 10% of annual statutory after-tax profits, as determined in accordance with PRC accounting standards and regulations, is required to be allocated to the statutory surplus reserves. If the cumulative total of the statutory surplus reserves reaches 50% of a PRC subsidiary’s registered capital, any further appropriation is optional.
Statutory surplus reserves may be used to offset accumulated losses or to increase the registered capital of a PRC subsidiary, subject to approval from the relevant PRC authorities, and are not available for dividend distribution to the subsidiary’s shareholders. The PRC subsidiaries are prohibited from distributing dividends unless any losses from prior years have been offset. Except for offsetting prior years’ losses, however, statutory surplus reserves must be maintained at a minimum of 25% of share capital after such usage. No retained earnings of either PRC subsidiary had been appropriated to statutory surplus reserves as the PRC subsidiaries recorded accumulated losses as of June 30, 2017 and December 31, 2016 and 2015.
Unaudited Pro Forma Balance Sheet and Basic and Diluted Net Income (Loss) per Common Share
The unaudited pro forma consolidated balance sheet as of June 30, 2017 gives effect to the automatic conversion of all of the Company’s outstanding redeemable convertible preferred stock into shares of Class A
F-18
Table of Contents
ACM RESEARCH, INC.
Notes to Consolidated Financial Statements
(Information as of June 30, 2017 and for the six months ended
June 30, 2017 and 2016 is unaudited)
(in thousands, except share and per share data)
common stock, which will occur upon completion of an IPO of common stock with aggregate proceeds of at least $20,000 and a per share price of at least $15.00. The unaudited pro forma consolidated balance sheet was prepared as though the completion of the IPO had occurred on June 30, 2017.
Pro forma net income per share applicable to common stockholders is computed using the weighted-average number of common shares outstanding after giving effect to the conversion of all the outstanding convertible redeemable preferred stock into shares of Class A common stock as if such conversion had occurred at the beginning of the period presented, or the date of original issuance, if later.
Fair Value of Financial Instruments
Under the FASB’s authoritative guidance on fair value measurements, fair value is the price that would be received to sell an asset or paid to transfer a liability in an orderly transaction between market participants at the measurement date. In determining the fair value, the Company uses various methods including market, income and cost approaches. Based on these approaches, the Company often utilizes certain assumptions that market participants would use in pricing the asset or liability, including assumptions about risk and the risks inherent in the inputs to the valuation technique. These inputs can be readily observable, market corroborated or generally unobservable inputs. The Company uses valuation techniques that maximize the use of observable inputs and minimize the use of unobservable inputs. Based on observability of the inputs used in the valuation techniques, the Company is required to provide the following information according to the fair value hierarchy. The fair value hierarchy ranks the quality and reliability of the information used to determine fair values. Financial assets and liabilities carried at fair value are classified and disclosed in one of the following three categories:
Level 1: Valuations for assets and liabilities traded in active exchange markets. Valuations are obtained from readily available pricing sources for market transactions involving identical assets or liabilities.
Level 2: Valuations for assets and liabilities traded in less active dealer or broker markets. Valuations are obtained from third party pricing services for identical or similar assets or liabilities.
Level 3: Valuations for assets and liabilities that are derived from other valuation methodologies, including option pricing models, discounted cash flow models and similar techniques, and not based on market exchange, dealer or broker traded transactions. Level 3 valuations incorporate certain unobservable assumptions and projections in determining the fair value assigned to such assets.
All transfers between fair value hierarchy levels are recognized by the Company at the end of each reporting period. In certain cases, the inputs used to measure fair value may fall into different levels of the fair value hierarchy. In such cases, an investment’s level within the fair value hierarchy is based on the lowest level of input that is significant to the fair value measurement in its entirety requires judgment, and considers factors specific to the investment. The inputs or methodology used for valuing financial instruments are not necessarily an indication of the risks associated with investment in those instruments.
Fair Value Measured or Disclosed on a Recurring Basis
Short-term borrowings—Interest rates under the borrowing agreements with the lending parties were determined based on the prevailing interest rates in the market. The Company classifies the valuation techniques that use these inputs as Level 2 fair value measurement.
F-19
Table of Contents
ACM RESEARCH, INC.
Notes to Consolidated Financial Statements
(Information as of June 30, 2017 and for the six months ended
June 30, 2017 and 2016 is unaudited)
(in thousands, except share and per share data)
Warrant liability—The fair value of the warrant liability derives from the Black-Scholes valuation model which incorporates certain unobservable assumptions (note 10). The Company classifies the valuation techniques that use these inputs as Level 3 fair value measurement.
Other financial items for disclosure purpose—The fair value of other financial items of the Company for disclosure purpose, including cash and cash equivalents, accounts receivable, other receivables, prepaid expenses, other current assets, notes payable, investors’ deposits, accounts payable, advances from customers, income taxes payable, and other payables and accrued expenses, approximate their carrying value due to their short-term nature.
As of June 30, 2017 and December 31, 2016 and 2015, information about inputs into the fair value measurement of the Company’s liabilities that are measured and recorded at fair value on a recurring basis in periods subsequent to their initial recognition is as follows:
| Fair Value Measurement at Reporting Date Using | ||||||||||||||||
| Quoted Prices in Active Markets for Identical Liabilities (Level 1) |
Significant Other Observable Inputs (Level 2) |
Significant Unobservable Inputs (Level 3) |
Total | |||||||||||||
| (in thousands) | ||||||||||||||||
| As of June 30, 2017 (unaudited): |
||||||||||||||||
| Liabilities: |
||||||||||||||||
| Short-term borrowings (unaudited) |
$ | — | $ | 4,584 | $ | — | $ | 4,584 | ||||||||
| Warrant liability (unaudited) |
— | — | 2,970 | 2,970 | ||||||||||||
|
|
|
|
|
|
|
|
|
|||||||||
| — | 4,584 | 2,970 | 7,554 | |||||||||||||
|
|
|
|
|
|
|
|
|
|||||||||
| As of December 31, 2016: |
||||||||||||||||
| Liabilities: |
||||||||||||||||
| Short-term borrowings |
$ | — | $ | 4,761 | $ | — | $ | 4,761 | ||||||||
|
|
|
|
|
|
|
|
|
|||||||||
| As of December 31, 2015: |
||||||||||||||||
| Liabilities: |
||||||||||||||||
| Short-term borrowings |
$ | — | $ | 6,854 | $ | — | $ | 6,854 | ||||||||
|
|
|
|
|
|
|
|
|
|||||||||
Fair Value Measured on a Non-Recurring Basis
The Company reviews long-lived assets for impairment annually or more frequently if events or changes in circumstances indicate the possibility of impairment. Long-lived assets are measured at fair value on a nonrecurring basis when there is an indicator of impairment, and they are recorded at fair value only when impairment is recognized. In determining the fair value, the Company used projections of cash flows directly associated with, and which are expected to arise as a direct result of, the use and eventual disposition of the assets. This approach required significant judgments including the Company’s projected net cash flows, which were derived using the most recent available estimate for the reporting unit containing the assets tested. Several key assumptions included periods of operation, projections of product pricing, production levels, product costs, market supply and demand, and inflation.
F-20
Table of Contents
ACM RESEARCH, INC.
Notes to Consolidated Financial Statements
(Information as of June 30, 2017 and for the six months ended
June 30, 2017 and 2016 is unaudited)
(in thousands, except share and per share data)
Reclassification of Accounts
Certain prior year’s amounts have been reclassified to conform to current year presentations. There was no change to previously reported stockholders’ deficit or net income.
Recent Accounting Pronouncements
Accounting Pronouncements Recently Adopted in the Consolidated Financial Statements for the Six Months Ended June 30, 2017
In April 2016, the FASB issued Accounting Standards Update (“ASU”) No. 2016-09, Compensation—Stock Compensation (Topic 718): Improvements to Employee Share-Based Payment Accounting, which simplifies several aspects of the accounting for employee stock-based payment transactions. The areas for simplification in ASU No. 2016-09 include the income tax consequences, classification of awards as either equity or liabilities, and classification on the statement of cash flows. The amendments in this ASU were effective for annual periods beginning after December 15, 2016 and interim periods within those annual periods. The adoption of ASU No. 2016-09 did not have a material impact on the Company’s consolidated financial statements.
In November 2015, the FASB issued ASU No. 2015-17, Income Taxes (Topic 740): Balance Sheet Classification of Deferred Taxes. Topic 740, Income Taxes, requires an entity to separate deferred income tax liabilities and assets into current and noncurrent amounts in a classified statement of financial position. Deferred tax liabilities and assets are classified as current or noncurrent based on the classification of the related asset or liability for financial reporting. Deferred tax liabilities and assets that are not related to an asset or liability for financial reporting are classified according to the expected reversal date of the temporary difference. To simplify the presentation of deferred income taxes, the amendments in ASU No. 2015-17 require that deferred income tax liabilities and assets be classified as noncurrent in a classified statement of financial position. For public business entities, the amendments in this update are effective for financial statements issued for annual periods beginning after December 15, 2016, and interim periods within those annual periods. The adoption of ASU No. 2015-17 did not have a material impact on the Company’s consolidated financial statements.
In July 2015, the FASB issued ASU No. 2015-11, Inventory (Topic 330): Simplifying the Measurement of Inventory. The amendments in this update require an entity to measure inventory within the scope of ASU No. 2015-11 (the amendments in ASU No. 2015-11 do not apply to inventory that is measured using last-in, first-out or the retail inventory method. The amendments apply to all other inventory, which includes inventory that is measured using first-in, first-out or average cost) at the lower of cost and net realizable value. Net realizable value is the estimated selling prices in the ordinary course of business, less reasonably predictable costs of completion, disposal, and transportation. Subsequent measurement is uncharged for inventory measured using last-in, first-out or the retail inventory method. The amendments in ASU No. 2015-11 more closely align the measurement of inventory in GAAP with the measurement of inventory in International Financial Reporting Standards. ASU No. 2015-11 is effective for public business entities for fiscal years beginning after December 15, 2016, including interim periods within those fiscal years. The amendments in ASU No. 2015-11 should be applied prospectively with earlier application permitted as of the beginning of an interim or annual reporting period. The adoption of ASU No. 2015-11 did not have a material impact on the Company’s consolidated financial statements. The relevant descriptions have been included in the inventory accounting policy.
In August 2014, the FASB issued ASU No. 2014-15, Presentation of Financial Statements—Going Concern. The amendments in this update require management to evaluate whether there are conditions and
F-21
Table of Contents
ACM RESEARCH, INC.
Notes to Consolidated Financial Statements
(Information as of June 30, 2017 and for the six months ended
June 30, 2017 and 2016 is unaudited)
(in thousands, except share and per share data)
events that raise substantial doubt about an entity’s ability to continue as a going concern for both annual and interim reporting. The guidance is effective for the Company for the annual period ended after December 15, 2016 and interim periods thereafter. Management performed an evaluation of the Company’s ability to fund operations and to continue as a going concern according to ASC Topic 205-40, Presentation of Financial Statements—Going Concern. The adoption of ASU No. 2014-15 did not have a material impact on the Company’s consolidated financial statements.
Recent Accounting Pronouncements Not Yet Adopted
In July 2017, the FASB issued ASU No. 2017-11, Earnings Per Share (Topic 260); Distinguishing Liabilities from Equity (Topic 480); Derivatives and Hedging (Topic 815): (Part I) Accounting for Certain Financial Instruments with Down Round Features, (Part II) Replacement of the Indefinite Deferral for Mandatorily Redeemable Financial Instruments of Certain Nonpublic Entities and Certain Mandatorily Redeemable Noncontrolling Interests with a Scope Exception, which addresses the complexity of accounting for certain financial instruments with down round features. Down round features are features of certain equity-linked instruments (or embedded features) that result in the strike price being reduced on the basis of the pricing of future equity offerings. Current accounting guidance creates cost and complexity for entities that issue financial instruments (such as warrants and convertible instruments) with down round features that require fair value measurement of the entire instrument or conversion option. For public business entities, the amendments in Part I of this Update are effective for fiscal years, and interim periods within those fiscal years, beginning after December 15, 2018. For all other entities, the amendments in Part I of this Update are effective for fiscal years beginning after December 15, 2019, and interim periods within fiscal years beginning after December 15, 2020. The Company is currently evaluating the impact of the adoption of ASU No. 2017-11 on its consolidated financial statements.
In May 2017, the FASB issued ASU No. 2017-09, Compensation—Stock Compensation (Topic 718): Scope of Modification Accounting, which provides guidance on determining which changes to the terms and conditions of share-based payment awards require an entity to apply modification accounting under Topic 718. The amendments in this ASU are effective for all entities for annual periods, and interim periods within those annual periods, beginning after December 15, 2017. Early adoption is permitted, including adoption in any interim period, for (1) public business entities for reporting periods for which financial statements have not yet been issued and (2) all other entities for reporting periods for which financial statements have not yet been made available for issuance. The amendments in this ASU should be applied prospectively to an award modified on or after the adoption date. The Company does not expect the adoption of ASU No. 2017-09 to have a material impact on its consolidated financial statements.
In February 2017, the FASB issued ASU No. 2017-05, Other Income—Gains and Losses from the Derecognition of Nonfinancial Assets (Subtopic 610-20): Clarifying the Scope of Asset Derecognition Guidance and Accounting for Partial Sales of Nonfinancial Assets, which clarifies the scope of nonfinancial asset guidance in Subtopic 610-20. This ASU also clarifies that derecognition of all businesses and nonprofit activities (except those related to conveyances of oil and gas mineral rights or contracts with customers) should be accounted for in accordance with the derecognition and deconsolidation guidance in Subtopic 810-10. The amendments in this ASU also provide guidance on the accounting for so-called “partial sales” of nonfinancial assets within the scope of Subtopic 610-20 and contributions of nonfinancial assets to a joint venture or other noncontrolled investee. The amendments in this ASU are effective for annual reporting reports beginning after December 15, 2017, including interim reporting periods within that reporting period. The Company does not expect the adoption of ASU No. 2017-05 to have a material impact on its consolidated financial statements.
F-22
Table of Contents
ACM RESEARCH, INC.
Notes to Consolidated Financial Statements
(Information as of June 30, 2017 and for the six months ended
June 30, 2017 and 2016 is unaudited)
(in thousands, except share and per share data)
In January 2017, the FASB issued ASU No. 2017-04, Intangibles—Goodwill and Other (Topic 350): Simplifying the Test for Goodwill Impairment, which removes Step 2 from the goodwill impairment test. An entity will apply a one-step quantitative test and record the amount of goodwill impairment as the excess of a reporting unit’s carrying amount over its fair value, not to exceed the total amount of goodwill allocated to the reporting unit. The new guidance does not amend the optional qualitative assessment of goodwill impairment. A business entity that is a U.S. Securities and Exchange Commission filer must adopt the amendments in this ASU for its annual or any interim goodwill impairment test in fiscal years beginning after December 15, 2019. Early adoption is permitted for interim or annual goodwill impairment tests performed on testing dates after January 1, 2017. The Company is currently evaluating the impact of the adoption of ASU 2017-04 on its consolidated financial statements.
In November 2016, the FASB issued ASU No. 2016-18, Statement of Cash Flows (Topic 230): Restricted Cash, which requires that a statement of cash flows explain the change during the period in the total of cash, cash equivalents, and amounts generally described as restricted cash or restricted cash equivalents. Therefore, amounts generally described as restricted cash and restricted cash equivalents should be included with cash and cash equivalents when reconciling the beginning-of-period and end-of-period total amounts shown on the statement of cash flows. The amendments in this ASU do not provide a definition of restricted cash or restricted cash equivalents. The amendments in this ASU are effective for public business entities for fiscal years beginning after December 15, 2017, and interim periods within those fiscal years. Early adoption is permitted, including adoption in an interim period. The Company does not expect the adoption of ASU No. 2016-18 to have a material impact on its consolidated financial statements.
In August 2016, the FASB issued ASU No. 2016-15, Statement of Cash Flows (Topic 230): Classification of Certain Cash Receipts and Cash Payments, which addresses the following cash flow issues: (1) debt prepayment or debt extinguishment costs; (2) settlement of zero-coupon debt instruments or other debt instruments with coupon interest rates that are insignificant in relation to the effective interest rate of the borrowing; (3) contingent consideration payments made after a business combination; (4) proceeds from the settlement of insurance claims; (5) proceeds from the settlement of corporate-owned life insurance policies, including bank-owned life insurance policies; (6) distributions received from equity method investees; (7) beneficial interests in securitization transactions; and (8) separately identifiable cash flows and application of the predominance principle. The amendments in this ASU are effective for public business entities for fiscal years beginning after December 15, 2017 and interim periods within those fiscal years and are effective for all other entities for fiscal years beginning after December 15, 2018 and interim periods within fiscal years beginning after December 15, 2019. Early adoption is permitted, including adoption in an interim period. The Company is currently evaluating the impact of the adoption of ASU No. 2016-15 on its consolidated financial statements.
In February 2016, the FASB issued ASU No. 2016-02, Leases (Topic 842). The amendments in this update create Topic 842, Leases, and supersede the leases requirements in Topic 840, Leases. Topic 842 specifies the accounting for leases. The objective of Topic 842 is to establish the principles that lessees and lessors shall apply to report useful information to users of financial statements about the amount, timing, and uncertainty of cash flows arising from a lease. The main difference between Topic 842 and Topic 840 is the recognition of lease assets and lease liabilities for those leases classified as operating leases under Topic 840. Topic 842 retains a distinction between finance leases and operating leases. The classification criteria for distinguishing between finance leases and operating leases are substantially similar to the classification criteria for distinguishing between capital leases and operating leases in the previous leases guidance. The result of retaining a distinction
F-23
Table of Contents
ACM RESEARCH, INC.
Notes to Consolidated Financial Statements
(Information as of June 30, 2017 and for the six months ended
June 30, 2017 and 2016 is unaudited)
(in thousands, except share and per share data)
between finance leases and operating leases is that under the lessee accounting model in Topic 842, the effect of leases in the statement of comprehensive income and the statement of cash flows is largely unchanged from previous GAAP. The amendments in ASU No. 2016-02 are effective for fiscal years beginning after December 15, 2018, including interim periods within those fiscal years for public business entities. Early application of the amendments in ASU No. 2016-02 is permitted. The Company is currently in the process of evaluating the impact of the adoption of ASU No. 2016-02 on its consolidated financial statements.
In May 2014, the FASB issued ASU No. 2014-09, Revenue from Contracts with Customers (Topic 606). ASU No. 2014-09 supersedes the revenue recognition requirements in “Revenue Recognition (Topic 605)”, and requires entities to recognize revenue when it transfers promised goods or services to customers in an amount that reflects the consideration to which the entity expects to be entitled to in exchange for those goods or services. The FASB issued ASU No. 2015-14, Revenue from Contracts with Customers (Topic 606): Deferral of the Effective Date in August 2015. The amendments in ASU No. 2015-14 defer the effective date of ASU No. 2014-09. Public business entities, certain not-for-profit entities, and certain employee benefit plans should apply the guidance in ASU No. 2014-09 to annual reporting periods beginning after December 15, 2017, including interim reporting periods within that reporting period. Earlier adoption is permitted only as of annual reporting periods beginning after December 15, 2016, including interim reporting periods within that reporting period. Further to ASU No. 2014-09 and ASU No. 2015-14, the FASB issued ASU No. 2016-08, Revenue from Contracts with Customers (Topic 606): Principal versus Agent Considerations (Reporting Revenue Gross versus Net) in March 2016, ASU No. 2016-10, Revenue from Contracts with Customers (Topic 606): Identifying Performance Obligations and Licensing in April 2016, ASU No. 2016-12, Revenue from Contracts with Customers (Topic 606): Narrow-Scope Improvements and Practical Expedients, and ASU No. 2016-20, Technical Corrections and Improvements to Topic 606, Revenue from Contracts with Customers, respectively. The amendments in ASU No. 2016-08 clarify the implementation guidance on principal versus agent considerations, including indicators to assist an entity in determining whether it controls a specified good or service before it is transferred to the customers. ASU No. 2016-10 clarifies guideline related to identifying performance obligations and licensing implementation guidance contained in the new revenue recognition standard. The updates in ASU No. 2016-10 include targeted improvements based on input the FASB received from the Transition Resource Group for Revenue Recognition and other stakeholders. It seeks to proactively address areas in which diversity in practice potentially could arise, as well as to reduce the cost and complexity of applying certain aspects of the guidance both at implementation and on an ongoing basis. ASU No. 2016-12 addresses narrow-scope improvements to the guidance on collectability, non-cash consideration, and completed contracts at transition. Additionally, the amendments in this ASU provide a practical expedient for contract modifications at transition and an accounting policy election related to the presentation of sales taxes and other similar taxes collected from customers. The amendments in ASU No. 2016-20 represents changes to make minor corrections or minor improvements to the Codification that are not expected to have a significant effect on current accounting practice or create a significant administrative cost to most entities. The effective date and transition requirements for ASU No. 2016-08, ASU No. 2016-10, ASU No. 2016-12 and ASU No. 2016-20 are the same as ASU No. 2014-09. The Company will adopt ASU No. 2014-09, ASU No. 2016-08, ASU No. 2016-10, ASU No. 2016-12 and ASU No. 2016-20 at January 1, 2018 if the IPO is completed by December 31, 2017. The Company is currently in the process of assessing the potential effects of these ASUs on its consolidated financial statements, business processes, systems and controls. While the assessment process is ongoing, the Company anticipates adopting ASC Topic 606, Revenue from Contracts with Customers, using the modified retrospective transition approach. Under this approach, ASC Topic 606 would apply to all new contracts initiated on or after January 1, 2018. For existing contracts that have remaining obligations as of January 1, 2018, any difference between the recognition criteria in these ASUs and the Company’s current revenue recognition
F-24
Table of Contents
ACM RESEARCH, INC.
Notes to Consolidated Financial Statements
(Information as of June 30, 2017 and for the six months ended
June 30, 2017 and 2016 is unaudited)
(in thousands, except share and per share data)
practices would be recognized using a cumulative effect adjustment to the opening balance of accumulated deficit. The Company does not expect the adoption of these ASUs to have a material impact on its consolidated financial statements.
NOTE 3 – ACCOUNTS RECEIVABLE
At June 30, 2017 and December 31, 2016 and 2015, accounts receivable consisted of the following:
| June 30, 2017 |
December 31, | |||||||||||
| 2016 | 2015 | |||||||||||
| Accounts receivable |
$ | 12,310 | $ | 16,026 | $ | 12,186 | ||||||
| Less: Allowance for doubtful accounts |
|
— |
|
— | (116 | ) | ||||||
|
|
|
|
|
|
|
|||||||
| Total |
$ | 12,310 | $ | 16,026 | $ | 12,070 | ||||||
|
|
|
|
|
|
|
|||||||
The Company reviews accounts receivable on a periodic basis and makes general and specific allowances when there is doubt as to the collectability of individual balances. The movements of allowance for doubtful accounts for the six months ended June 30, 2017 and the years ended December 31, 2016 and 2015 are as follows:
| Six Months Ended June 30, |
Year Ended December 31, |
|||||||||||||||
| 2017 | 2016 | 2016 | 2015 | |||||||||||||
| Balance at beginning of period |
$ | — | $ | 116 | $ | 116 | $ | 116 | ||||||||
| Additions |
— | — | — | — | ||||||||||||
| Write-off |
— | — | (116 | ) | — | |||||||||||
|
|
|
|
|
|
|
|
|
|||||||||
| Balance at end of period |
$ | — | $ | 116 | $ | — | $ | 116 | ||||||||
|
|
|
|
|
|
|
|
|
|||||||||
As of December 31, 2015, the Company had pledged its accounts receivable of $6,670 as security under a short-term bank loan, which was paid during the year ended December 31, 2016 (note 6). As of June 30, 2017 and December 31, 2016, no accounts receivable were pledged as collateral for borrowings from financial institutions.
NOTE 4 – INVENTORY
At June 30, 2017 and December 31, 2016 and 2015, inventory consisted of the following:
| June 30, 2017 |
December 31, | |||||||||||
| 2016 | 2015 | |||||||||||
| Raw materials |
$ | 7,662 | $ | 7,698 | $ | 4,454 | ||||||
| Work in process |
3,307 | 1,260 | 878 | |||||||||
| Finished goods |
3,137 | 2,708 | 3,814 | |||||||||
|
|
|
|
|
|
|
|||||||
| Total inventory, gross |
14,106 | 11,666 | 9,146 | |||||||||
| Inventory reserve |
— | — | — | |||||||||
|
|
|
|
|
|
|
|||||||
| Total inventory, net |
$ | 14,106 | $ | 11,666 | $ | 9,146 | ||||||
|
|
|
|
|
|
|
|||||||
F-25
Table of Contents
ACM RESEARCH, INC.
Notes to Consolidated Financial Statements
(Information as of June 30, 2017 and for the six months ended
June 30, 2017 and 2016 is unaudited)
(in thousands, except share and per share data)
The Company did not set up any inventory reserve as of June 30, 2017 or December 31, 2016 or 2015. As of June 30, 2017 and December 31, 2016 and 2015, no inventory was pledged as collateral for borrowings from financial institutions.
NOTE 5 – PROPERTY, PLANT AND EQUIPMENT, NET
At June 30, 2017 and December 31, 2016 and 2015, property, plant and equipment consisted of the following:
| June 30, 2017 |
December 31, | |||||||||||
| 2016 | 2015 | |||||||||||
| Manufacturing equipment |
$ | 8,768 | $ | 8,566 | $ | 9,810 | ||||||
| Office equipment |
439 | 410 | 549 | |||||||||
| Transportation equipment |
196 | 191 | 181 | |||||||||
| Leasehold improvement |
235 | 224 | 79 | |||||||||
|
|
|
|
|
|
|
|||||||
| Total cost |
9,638 | 9,391 | 10,619 | |||||||||
| Less: Total accumulated depreciation |
(7,849 | ) | (7,562 | ) | (8,857 | ) | ||||||
| Construction in progress |
444 | 433 | 8 | |||||||||
|
|
|
|
|
|
|
|||||||
| Total property, plant and equipment, net |
$ | 2,233 | $ | 2,262 | $ | 1,770 | ||||||
|
|
|
|
|
|
|
|||||||
Depreciation expense was $107, $88, $180 and $140 for the six months ended June 30, 2017 and 2016 and the years ended December 31, 2016 and 2015, respectively.
F-26
Table of Contents
ACM RESEARCH, INC.
Notes to Consolidated Financial Statements
(Information as of June 30, 2017 and for the six months ended
June 30, 2017 and 2016 is unaudited)
(in thousands, except share and per share data)
NOTE 6 – SHORT-TERM BORROWINGS
At June 30, 2017 and December 31, 2016 and 2015, short-term borrowings consisted of the following:
| June 30, 2017 |
December 31, | |||||||||||
| 2016 | 2015 | |||||||||||
| Line of credit up to $3,850 from Bank of Shanghai Pudong Branch, due on August 6, 2016 with annual interest rate of 5.35%, guaranteed by David H. Wang, the chief executive officer and a director of ACM (“Wang”) and fully repaid on February 3, 2016 |
$ | — | $ | — | $ | 3,850 | ||||||
| Borrowings from Shanghai Rural Commercial Bank Co., Ltd., due on September 14, 2016 with annual interest rate of 5.52%, guaranteed by Wang and secured by the Company’s accounts receivable of $6,760 and fully repaid on September 12, 2016 |
— | — | 3,004 | |||||||||
| Borrowings from Bank of China, due on February 10, 2017 with annual interest rate of 4.8%, secured by certain of the Company’s intellectual property and fully repaid on February 13, 2017 |
— | 1,222 | — | |||||||||
| Borrowings from Bank of Shanghai Pudong Branch, due on June 24, 2017 with an annual interest rate of 5.66%, guaranteed by Wang and fully repaid on June 25, 2017 |
— | 281 | — | |||||||||
| Line of credit up to $3,605 from Bank of Shanghai Pudong Branch, due on July 3, 2017 with an annual interest rate of 5.66%, guaranteed by Wang and fully repaid on May 18, 2017 |
— | 1,455 | — | |||||||||
| Line of credit up to $3,670 from Bank of Shanghai Pudong Branch, due on July 3, 2017 with an annual interest rate of 3.2%, guaranteed by Wang and fully repaid on June 7, 2017 |
— | 1,803 | — | |||||||||
| Borrowings from Bank of China, due on July 2, 2017 with annual interest rate of 4.8%, secured by the Company’s intellectual property and fully repaid on July 3, 2017 |
3,173 | — | — | |||||||||
| Line of credit up to RMB 25,000 or equivalent US dollars from Bank of Shanghai Pudong Branch, due on September 19, 2017 with an annual interest rate of 5.66%, guaranteed by Wang |
714 | — | — | |||||||||
| Line of credit up to RMB 25,000 or equivalent US dollars from Bank of Shanghai Pudong Branch, due on October 5, 2017 with an annual interest rate of 5.66%, guaranteed by Wang |
697 | — | — | |||||||||
|
|
|
|
|
|
|
|||||||
| Total |
$ | 4,584 | $ | 4,761 | $ | 6,854 | ||||||
|
|
|
|
|
|
|
|||||||
For the six months ended June 30, 2017 and 2016 and the years ended December 31, 2016 and 2015, interest expense related to short-term borrowings amounted to $164, $111, $179 and $316, respectively.
F-27
Table of Contents
ACM RESEARCH, INC.
Notes to Consolidated Financial Statements
(Information as of June 30, 2017 and for the six months ended
June 30, 2017 and 2016 is unaudited)
(in thousands, except share and per share data)
NOTE 7 – OTHER PAYABLE AND ACCRUED EXPENSES
At June 30, 2017 and December 31, 2016 and 2015, other payable and accrued expenses consisted of the following:
| June 30, 2017 |
December 31, | |||||||||||
| 2016 | 2015 | |||||||||||
| Lease expenses and payable for leasehold improvement due to a related party (note 12) |
$ | 1,982 | $ | 1,883 | $ | 2,070 | ||||||
| Commissions |
766 | 757 | 737 | |||||||||
| Accrued warranty |
419 | 290 | 459 | |||||||||
| Accrued payroll |
— | 398 | 398 | |||||||||
| Accrued professional fees |
752 | 46 | — | |||||||||
| Others |
854 | 589 | 439 | |||||||||
|
|
|
|
|
|
|
|||||||
| Total |
$ | 4,773 | $ | 3,963 | $ | 4,103 | ||||||
|
|
|
|
|
|
|
|||||||
NOTE 8 – NOTES PAYABLE
Notes payable consists of convertible promissory notes and term loans. As of June 30, 2017 and December 31, 2016 and 2015, the outstanding principal and accrued interest with respect to the convertible promissory notes and the term notes consisted of the following:
| June 30, 2017 |
December 31, | |||||||||||
| 2016 | 2015 | |||||||||||
| Convertible promissory notes: |
||||||||||||
| Issued in 2003 and due on October 10, 2008 |
$ | — | $ | — | $ | 780 | ||||||
| Issued in 2004 and due on June 10, 2009 |
— | — | 498 | |||||||||
| Issued in 2006 and due on November 8, 2011 |
11 | 11 | 1,291 | |||||||||
|
|
|
|
|
|
|
|||||||
| Total principal and accrued interest of convertible promissory notes |
11 | 11 | 2,569 | |||||||||
|
|
|
|
|
|
|
|||||||
| Term notes: |
||||||||||||
| Issued in 2004 and due on March 31, 2004 |
— | — | 92 | |||||||||
| Issued in 2013 and due on March 26, 2014 |
— | — | 112 | |||||||||
| Issued in 2014 and due in March 2015 |
— | — | 64 | |||||||||
|
|
|
|
|
|
|
|||||||
| Total principal and accrued interest of term notes |
— | — | 268 | |||||||||
|
|
|
|
|
|
|
|||||||
| Total |
$ | 11 | $ | 11 | $ | 2,837 | ||||||
|
|
|
|
|
|
|
|||||||
F-28
Table of Contents
ACM RESEARCH, INC.
Notes to Consolidated Financial Statements
(Information as of June 30, 2017 and for the six months ended
June 30, 2017 and 2016 is unaudited)
(in thousands, except share and per share data)
Of the outstanding promissory notes described in the preceding table, the following amounts of principal and accrued interest pertain to notes held by related parties of the Company:
| June 30, 2017 |
December 31, | |||||||||||
| 2016 | 2015 | |||||||||||
| Convertible promissory notes: |
||||||||||||
| Issued in 2003 and due on October 10, 2008 |
$ | — | $ | — | $ | 158 | ||||||
| Issued in 2004 and due on June 10, 2009 |
— | — | 80 | |||||||||
| Issued in 2006 and due on November 8, 2011 |
4 | 4 | 262 | |||||||||
|
|
|
|
|
|
|
|||||||
| Total principal and accrued interest of convertible promissory notes |
4 | 4 | 500 | |||||||||
|
|
|
|
|
|
|
|||||||
| Term notes: |
||||||||||||
| Issued in 2004 and due on March 31, 2004 |
— | — | 92 | |||||||||
| Issued in 2013 and due on March 26, 2014 |
— | — | 112 | |||||||||
| Issued in 2014 and due in March 2015 |
— | — | 64 | |||||||||
|
|
|
|
|
|
|
|||||||
| Total principal and accrued interest of term notes |
— | — | 268 | |||||||||
|
|
|
|
|
|
|
|||||||
| Total |
$ | 4 | $ | 4 | $ | 768 | ||||||
|
|
|
|
|
|
|
|||||||
During 2003, 2004 and 2006, ACM issued convertible promissory notes in the principal amount of $542, $401 and $1,084, respectively. The convertible promissory notes bare interest at the rate of 6% per annum computed on the basis of a 360-day year and the actual number of days elapsed until maturity, which is five years after issuance. Upon ACM’s issuance and sale of a new series of preferred stock, principal and accrued interest on the notes were to automatically convert into shares of the new series of preferred stock at a conversion price equal to the price per share of the new preferred stock to new investors.
In conjunction with the convertible promissory notes, each convertible promissory noteholder was granted, for every dollar of principal amount of convertible promissory notes, one warrant to purchase two to four shares of common stock at an exercise price of $0.72 to $ 0.75 per share. The warrants are exercisable until the earlier of (1) five years after the warrant issue date and (2) the occurrence of a merger or consolidation of ACM or ACM’s sale, transfer or other disposition of all or substantially all of ACM’s assets.
The Company accounted for the convertible promissory notes and warrants in accordance with FASB ASC paragraph 470-20-25, Debt – Debt With Conversion and Other Options. Proceeds from the issuance of promissory notes and warrants were allocated to the two elements based on the relative fair values of the convertible promissory notes without the warrants and of the warrants themselves at time of issuance. The Company did not identify any derivative liabilities and beneficial conversion features.
During 2004, 2005, 2013 and 2014, ACM issued term notes in the aggregate principal amounts of $53, $200, $100 and $60, respectively. All of such term notes were issued to Wang and one other director, except that $140 in principal amount of the term notes issued in 2005 were issued to third parties. The term notes bore interest at 6% per annum and became due three months after the note issuance date. The $200 in principal amount of term notes issued in 2005, together with $4 in accrued interest, were exchanged for convertible promissory notes in 2006.
F-29
Table of Contents
ACM RESEARCH, INC.
Notes to Consolidated Financial Statements
(Information as of June 30, 2017 and for the six months ended
June 30, 2017 and 2016 is unaudited)
(in thousands, except share and per share data)
As of December 31, 2015, no convertible promissory notes had been converted into preferred stock as no new series of preferred stock had been issued and sold and all warrants expired as no warrant holder exercised the warrants.
During 2016, the Company modified the terms of the convertible promissory notes and provided the note holders with the option of converting the principal amount of their convertible promissory notes into Class A common stock at $0.75 or $1.50 per share on the condition that they agree to waive all accrued interest. For those holders who did not elect to convert their notes into Class A common stock, the principal of, and accrued interest on, their convertible promissory notes were converted into Series F convertible preferred stock at $2.50 per share. The convertible promissory notes converted into 1,812,069 shares of Class A common stock and 47,454 shares of Series F convertible preferred stock on December 30, 2016. Net loss due to extinguishment of debt from these conversions totaled $1,670 during 2016. The balance of $11 of notes payable at June 30, 2017 and December 31, 2016 represented accrued interest that ACM was liable to pay to convertible promissory note holders.
NOTE 9 – INVESTORS’ DEPOSITS
On December 9, 2016, Shengxin (Shanghai) Management Consulting Limited Partnership (“SMC”), a related party (note 12), delivered RMB 20,124 (approximately $2,981 as of the close of business on such date) in cash (the “SMC Investment”) to ACM Shanghai for potential investment pursuant to terms to be subsequently negotiated. On March 14, 2017, ACM, ACM Shanghai and SMC entered into a securities purchase agreement pursuant to which, in exchange for the SMC Investment, ACM issued to SMC a warrant exercisable to purchase 397,502 shares of ACM’s Class A common stock at a price of $7.50 per share. (note 10).
NOTE 10 – WARRANT LIABILITY
On December 9, 2016, SMC delivered the SMC Investment to ACM Shanghai for potential investment pursuant to terms to be subsequently negotiated. As of December 31, 2016, the terms of the SMC Investment had not yet been negotiated and the SMC Investment was recorded as investors’ deposit.
On March 14, 2017, ACM, ACM Shanghai and SMC entered into a securities purchase agreement (the “SMC Agreement”) pursuant to which, in exchange for the SMC Investment, ACM issued to SMC a warrant exercisable, for cash or on a cashless basis, to purchase, at any time on or before May 17, 2023, all, but not less than all, of 397,502 shares of ACM’s Class A common stock at a price of $7.50 per share. Under the SMC Agreement, if SMC does not exercise the warrant by May 17, 2023, ACM Shanghai will be obligated, subject to approval of governmental authorities and ACM Shanghai’s equity holders, to deliver an equity interest of 3.6394% (subject to dilution) in satisfaction of the SMC Investment. If SMC exercises the warrant or if SMC does not exercise the warrant and the issuance of the equity interest in ACM Shanghai is not completed by August 17, 2023 due to the inability of the parties to obtain required governmental or equity holder approvals, then ACM Shanghai will be obligated to pay to SMC, in satisfaction of the SMC Investment, an amount equal to $2,981, converted into RMB at the lesser of 6.75 and the then-current RMB-to- US dollar exchange rate.
In accordance with FASB ASC 480, Distinguishing Liabilities from Equity, the warrant is classified as a liability as the warrant is conditional puttable. The fair value of the warrant is adjusted for changes in fair value at each reporting period but cannot be lower than the proceeds of the SMC Investment. The corresponding
F-30
Table of Contents
ACM RESEARCH, INC.
Notes to Consolidated Financial Statements
(Information as of June 30, 2017 and for the six months ended
June 30, 2017 and 2016 is unaudited)
(in thousands, except share and per share data)
non-cash gain or loss of the changes in fair value is recorded in earnings. The methodology used to value the warrant was the Black-Scholes valuation model with the following assumptions:
| June 30, | ||||
| 2017 | ||||
| Fair value of common share (1) |
$ | 7.59 | ||
| Expected term in years (2) |
5.88 | |||
| Volatility (3) |
28.31 | % | ||
| Risk-free interest rate (4) |
1.85 | % | ||
| Expected dividend (5) |
0 | % | ||
| (1) | As the common stock was not publicly traded, the Company used an independent third-party valuation firm to value the common stock for the six months ended June 30, 2017. |
| (2) | Expected term of the warrant represents the period from the current balance sheet date to the warrant expiration date. |
| (3) | Volatility is calculated based on the historical volatility of ACM’s comparable companies in the period equal to the expected term of the warrant. |
| (4) | Risk-free interest rate is based on the yields of U.S. Treasury securities with maturities similar to the expected term of the warrant. |
| (5) | Expected dividend is assumed to be 0% as ACM has no history or expectation of paying a dividend on its common stock. |
NOTE 11 – OTHER LONG-TERM LIABILITIES
Other long-term liabilities represent government subsidies received from PRC governmental authorities for development and commercialization of certain technology but not yet recognized (note 2). As of June 30, 2017 and December 31, 2016 and 2015, other long-term liabilities consisted of the following unearned government subsidies:
| June 30, 2017 |
December 31, | |||||||||||
| 2016 | 2015 | |||||||||||
| Subsidies to Stress Free Polishing project, commenced in 2008 |
$ | 1,938 | $ | 1,958 | $ | 1,836 | ||||||
| Subsidies to Electro Copper Plating project, commenced in 2014 |
5,338 | 4,921 | 5,250 | |||||||||
| Subsidies to short-term borrowings’ interest expenses |
— | — | 101 | |||||||||
|
|
|
|
|
|
|
|||||||
| Total |
$ | 7,276 | $ | 6,879 | $ | 7,187 | ||||||
|
|
|
|
|
|
|
|||||||
NOTE 12 – RELATED PARTY BALANCES AND TRANSACTIONS
In 2007, ACM Shanghai entered into an operating lease agreement with Shanghai Zhangjiang Group Co., Ltd. (“Zhangjiang Group”), one of whose affiliates then held non-controlling interests in ACM Shanghai, to lease manufacturing and office space located in Shanghai, China. Pursuant to the lease agreement, Zhangjiang Group provided $771 to ACM Shanghai for leasehold improvements. In September 2016, the lease agreement was amended to modify payment terms and extend the lease through December 31, 2017. During the six months ended June 30, 2017 and 2016 and the years ended December 31, 2016 and 2015, the Company incurred leasing expenses under the lease agreement of $321, $330, $640 and $692, respectively. As of June 30, 2017 and
F-31
Table of Contents
ACM RESEARCH, INC.
Notes to Consolidated Financial Statements
(Information as of June 30, 2017 and for the six months ended
June 30, 2017 and 2016 is unaudited)
(in thousands, except share and per share data)
December 31, 2016 and 2015, payables to Zhangjiang Group for lease expenses and leasehold improvements recorded as other payables and accrued expenses, amounted to $1,982, $1,883 and $2,070, respectively (note 7).
Prior to 2015, the Company issued convertible promissory notes and term loans to Wang (note 8).
On December 9, 2016, ACM Shanghai received the SMC Investment from SMC for potential investment pursuant to terms to be subsequently negotiated (notes 9, 10 and 20). SMC is a limited partnership incorporated in the PRC, whose partners consist of employees of ACM Shanghai. As of June 30, 2017 and December 31, 2016 and 2015, investors’ deposits from SMC amounted to $0, $2,902 and $0, respectively. On March 14, 2017, ACM, ACM Shanghai and SMC entered into a securities purchase agreement (the “SMC Agreement”) pursuant to which, in exchange for the SMC Investment, ACM issued to SMC a warrant exercisable, for cash or on a cashless basis, to purchase, at any time on or before May 17, 2023, all, but not less than all, of 397,502 shares of ACM’s Class A common stock at a price of $7.50 per share, for a total exercise price of $2,981. Under the SMC Agreement, if SMC does not exercise the warrant by May 17, 2023, ACM Shanghai will be obligated, subject to approval of governmental authorities and ACM Shanghai’s equity holders, to deliver an equity interest of 3.6394% (subject to dilution) in satisfaction of the SMC Investment. If SMC exercises the warrant or if SMC does not exercise the warrant and the issuance of the equity interest in ACM Shanghai is not completed by August 17, 2023 due to the inability of the parties to obtain required governmental or equity holder approvals, then ACM Shanghai will be obligated to pay to SMC, in satisfaction of the SMC Investment, an amount equal to $2,981, converted into RMB at the lesser of 6.75 and the then-current RMB-to-US dollar exchange rate.
NOTE 13 – LEASES
ACM entered into a two-year lease agreement in March 2015 for office and warehouse space of approximately 3,000 square feet for its headquarters in Fremont, California, at a rate of $2 per month. On March 22, 2017, ACM amended the lease agreement to extend the lease term through March 31, 2018 and increase the base rent to $3 per month.
ACM Shanghai entered into an operating lease agreement with Zhangjiang Group (a related party, see note 12) in 2007 for manufacturing and office space of approximately 63,510 square feet in Shanghai, China. The lease agreement has been amended several times to modify payment terms and extend the lease term, most recently through December 31, 2017. Monthly rent is $58 during 2017 and 2016.
ACM Wuxi leases office space in Wuxi, China, at a rate of less than $1 per month.
Future minimum lease payments under non-cancelable lease agreements as of June 30, 2017 and December 31, 2016 were as follows:
| June 30, 2017 |
December 31, 2016 |
|||||||
| 2017 |
$ | 2,318 | $ | 2,538 | ||||
| 2018 |
8 | 8 | ||||||
|
|
|
|
|
|||||
| Total |
$ | 2,326 | $ | 2,546 | ||||
|
|
|
|
|
|||||
Rent expense was $336, $342, $675 and $718 for the six months ended June 30, 2017 and 2016 and the years ended December 31, 2016 and 2015, respectively.
F-32
Table of Contents
ACM RESEARCH, INC.
Notes to Consolidated Financial Statements
(Information as of June 30, 2017 and for the six months ended
June 30, 2017 and 2016 is unaudited)
(in thousands, except share and per share data)
NOTE 14 – COMMON STOCK
Prior to the Merger in November 2016, ACM was authorized to issue 100,000,000 shares of common stock, without par value. Each share of common stock entitled the holder to one vote on all matters submitted to a vote by ACM’s stockholders. Common stockholders were entitled to dividends when and if declared by the Board of Directors. At December 31, 2015, there were 2,047,403 shares issued and outstanding.
Upon the Merger, ACM became authorized to issue 100,000,000 shares of Class A common stock and 7,303,533 shares of Class B common stock, each with a par value of $0.0001. Each share of Class A common stock is entitled to one vote, and each share of Class B common stock is entitled to twenty votes and is convertible at any time into one share of Class A common stock. Shares of Class A common stock and Class B common stock are treated equally, identically and ratably with respect to any dividends if declared by the Board of Directors unless the Board of Directors declares different dividends to the Class A common stock and Class B common stock by getting approval from a majority of common stock holders. Each share of ACM’s common stock outstanding immediately prior to the Merger was converted into one share of Class B common stock as a result of the Merger.
At June 30, 2017 and December 31, 2016, the number of shares of Class A common stock issued and outstanding was 2,627,293 and 2,228,740, respectively, of which 1,812,069 and 1,812,069 aggregated shares derived from conversion of convertible promissory notes, and 815,224 and 416,671 aggregated shares derived from exercises of stock options, respectively. At June 30, 2017 and December 31, 2016, the number of shares of Class B common stock issued and outstanding was 2,409,738, of which 2,047,403 aggregated shares derived from conversion of the original common stock upon the Merger and 362,335 aggregated shares derived from exercises of stock options.
NOTE 15 – REDEEMABLE CONVERTIBLE PREFERRED STOCK
As of December 31, 2015, ACM had 8,157,000 authorized shares of preferred stock, of which 385,000, 1,572,000, 1,400,000 and 4,800,000 shares were designated as Series A, Series B, Series C and Series D preferred stock, respectively. On August 1, 2016, the Company amended the Articles of Incorporation and was further authorized to issue 10,718,530 shares of Series E preferred stock and 6,000,000 shares of Series F preferred stock. Upon the Merger in November 2016, the numbers of authorized shares of Series C and Series D were reduced to 1,360,962 and 2,659,975, respectively. Each share of ACM’s convertible preferred stock outstanding immediately prior to the Merger was converted into one share of the same series of convertible preferred stock as a result of the Merger. Accordingly, as of December 31, 2016 and June 30, 2017, ACM had 22,696,467 authorized shares of preferred stock, of which 385,000, 1,572,000, 1,360,962, 2,659,975, 10,718,530, and 6,000,000 shares were designated as Series A, Series B, Series C, Series D, Series E and Series F preferred stock, respectively.
During the six months ended June 30, 2017, no activities occurred with respect to convertible preferred stock. During 2016, ACM issued 3,663,254 shares of Series F preferred stock, consisting of 3,615,800 shares issued at $2.50 per share for cash totaling $9,040 and 47,454 shares issued upon conversion of convertible promissory notes.
The number of outstanding shares of Series A, Series B, Series C, Series D, Series E and Series F was 385,000, 1,572,000, 1,360,962, 1,326,642, 0 and 3,663,254, respectively, at June 30, 2017 and December 31, 2016 and 385,000, 1,572,000, 1,360,962, 1,326,642, 0 and 0, respectively, at December 31, 2015.
Shares of ACM’s convertible preferred stock have rights, preferences and privileges as follows:
F-33
Table of Contents
ACM RESEARCH, INC.
Notes to Consolidated Financial Statements
(Information as of June 30, 2017 and for the six months ended
June 30, 2017 and 2016 is unaudited)
(in thousands, except share and per share data)
Voting Rights
Each share of Series A through Series F convertible preferred stock is entitled to a number of votes equal to the number of whole shares of common stock into which such share can be converted.
Dividends
Holders of Series A through Series F convertible preferred stock have a non-cumulative right to participate in and receive the same dividends as may be declared for common stockholders, as and if declared by the Board of Directors, payable out of funds legally available.
Conversion
Each share of Series A through Series F convertible preferred stock is convertible at any time, at the option of the holder. At June 30, 2017, each share of Series A, B and F convertible preferred stock was convertible into one-third share of Class A common stock, each share of Series C convertible preferred stock was convertible into 0.3544 shares of Class A common stock, and each share of Series D convertible preferred stock was convertible into 0.4562 shares of Class A common stock. The Series A through Series F convertible preferred stock will convert automatically into Class A common stock upon the closing of an initial public offering of Class A common stock with aggregate proceeds of at least $20,000 and a per-share price of at least $15.00. At June 30, 2017 and 2016 and December 31, 2016, 2,960,968 shares of Class A common stock were reserved for issuance upon conversion of outstanding Series A through Series F convertible preferred stock.
Liquidation Preferences
Holders of Series A through Series F convertible preferred stock are entitled to receive specified liquidation amounts in the event of a liquidation, dissolution or winding-up of ACM or of certain deemed liquidation events. The deemed liquidation events generally include (a) a merger or stock sale after which new stockholders would own a majority of the voting stock of ACM and (b) a sale of all or substantially all of the assets of the Company.
In the event of a liquidation, dissolution or winding-up of ACM or a deemed liquidation, the holders of Series A through Series F convertible preferred stock shall be entitled to be paid, prior to and in preference to the holders of common stock, an amount equal to $0.80, $1.00, $1.50, $3.75, $1.00 and $2.50 per share of Series A through Series F convertible preferred stock, respectively, plus any accumulated and unpaid dividends as of the redemption date.
NOTE 16 – STOCK-BASED COMPENSATION
On April 29, 1998, ACM adopted the 1998 Stock Option Plan (the “1998 Plan”). The options issued under the Plan consisted of incentive stock options (“ISOs”) and nonstatutory stock options (“NSOs”) that should be determined at the time of grant. ISOs could be granted only to employees. NSOs could be granted to employees, directors and consultants. The option price of each ISO and each NSO could not be less than 100% or less than 85% of the fair market value of stock price at the time of grant, respectively. The vesting period was to be determined by the Board of Directors for each grant. The total number of shares of common stock reserved under the 1998 Plan, as amended, was 766,667. If any option granted under the 1998 Plan expires or otherwise terminates without having been exercised in full, the shares of common stock subject to that option would become available for re-grant. At March 3, 2014, the 1998 Plan terminated and no further grants under the 1998 Plan could be made thereunder, although certain previously granted options remained outstanding in accordance with their terms.
F-34
Table of Contents
ACM RESEARCH, INC.
Notes to Consolidated Financial Statements
(Information as of June 30, 2017 and for the six months ended
June 30, 2017 and 2016 is unaudited)
(in thousands, except share and per share data)
On December 28, 2016, ACM adopted the 2016 Omnibus Incentive Plan (the “2016 Plan”). Under the 2016 Plan, the aggregate number of shares of Class A common stock that may be issued shall equal the sum of (a) 2,333,334 and (b) an annual increase on the first day of each year beginning in 2018 and ending in 2026 equal to the lesser of (i) 4% of the shares of Class A and Class B common stock outstanding (on an as-converted basis) on the last day of the immediately preceding year and (ii) such smaller number of shares as may be determined by the Board. A maximum of 2,333,334 shares is available for issuance as ISOs under the 2016 Plan. Besides the stock options, the 2016 Plan also authorizes issuance of stock appreciation rights, restricted stock, restricted stock units, and other share-based and cash awards. The 2016 Plan will terminate on December 27, 2026.
Employee Awards
The following table summarizes ACM’s employee share option activities:
| Number of Option Shares |
Weighted Average Grant Date Fair Value |
Weighted Average Exercise Price |
Weighted Average Remaining Contractual Term |
|||||||||||||
| Outstanding at January 1, 2015 |
1,000,009 | $ | 0.39 | $ | 0.75 | 4.23 | ||||||||||
| Granted |
550,003 | 0.66 | 1.50 | |||||||||||||
| Exercised |
— | — | — | |||||||||||||
| Expired |
(50,002 | ) | 0.54 | 0.75 | ||||||||||||
| Forfeited |
— | — | — | |||||||||||||
| Outstanding at December 31, 2015 |
1,500,010 | 0.48 | 1.02 | 5.60 | ||||||||||||
| Granted |
1,009,371 | 0.54 | 3.00 | |||||||||||||
| Exercised |
(409,004 | ) | 0.42 | 0.75 | ||||||||||||
| Expired |
— | — | — | |||||||||||||
| Forfeited |
— | — | — | |||||||||||||
| Outstanding at December 31, 2016 |
2,100,377 | 0.54 | 2.03 | 7.83 | ||||||||||||
| Granted |
83,334 | 2.58 | 7.50 | |||||||||||||
| Exercised |
(166,667 | ) | 0.45 | 0.75 | ||||||||||||
| Expired |
— | — | — | |||||||||||||
| Forfeited |
(7,099 | ) | 0.54 | 3.00 | ||||||||||||
| Outstanding at June 30, 2017 |
2,009,945 | 0.63 | 2.36 | 7.99 | ||||||||||||
| Vested and exercisable at December 31, 2015 |
942,367 | |||||||||||||||
| Vested and exercisable at December 31, 2016 |
758,708 | |||||||||||||||
| Vested and exercisable at June 30, 2017 |
821,598 | |||||||||||||||
During the six months ended June 30, 2017 and 2016 and the years ended December 31, 2016 and 2015, ACM recognized employee stock-based compensation expense of $128, $46, $92 and $73, respectively. As of June 30, 2017 and December 31, 2016 and 2015, $788, $726 and $299, respectively, of total unrecognized employee stock-based compensation expense, net of estimated forfeitures, related to stock-based awards were expected to be recognized over a weighted-average period of 2.12 years, 2.25 years and 1.24 years, respectively. Total unrecognized compensation cost may be adjusted for future changes in estimated forfeitures.
F-35
Table of Contents
ACM RESEARCH, INC.
Notes to Consolidated Financial Statements
(Information as of June 30, 2017 and for the six months ended
June 30, 2017 and 2016 is unaudited)
(in thousands, except share and per share data)
The fair value of each option granted to employee is estimated on the grant date using the Black-Scholes valuation model with the following assumptions. No options were granted to employees during the six months ended June 30, 2016.
| June 30, 2017 |
December 31, | |||||||||||
| 2016 | 2015 | |||||||||||
| Fair value of common share(1) |
$ | 7.59 | $ | 2.28 | $ | 1.59 | ||||||
| Expected term in years(2) |
6.25 | 5.75-6.25 | 6.25 | |||||||||
| Volatility(3) |
29.18 | % | 29.93 | % | 37.67 | % | ||||||
| Risk-free interest rate(4) |
2.22 | % | 2.02%-2.32 | % | 1.87 | % | ||||||
| Expected dividend(5) |
0 | % | 0 | % | 0 | % | ||||||
| (1) | As the common stock was not publicly traded, the Company used an independent third-party valuation firm to value the common stock in 2014, 2015, 2016 and the six months ended June 30, 2017. The fair value of common stock issued prior to January 1, 2014 was determined to be $0.75, which was the price most investors paid to purchase common stock prior to that date. |
| (2) | Expected term of stock options is based on the average of the vesting period and the contractual term for each grant according to Staff Accounting Bulletin 110. |
| (3) | Volatility is calculated based on the historical volatility of ACM’s comparable companies in the period equal to the expected term of each grant. |
| (4) | Risk-free interest rate is based on the yields of U.S. Treasury securities with maturities similar to the expected term of the stock options in effect at the time of grant. |
| (5) | Expected dividend is assumed to be 0% as ACM has no history or expectation of paying a dividend on its common stock. |
In addition to the assumptions used in the Black-Scholes valuation model, the Company estimates, based on the historical turnover rate, a forfeiture rate of 10% for use in calculating the stock-based compensation for its stock-based awards.
F-36
Table of Contents
ACM RESEARCH, INC.
Notes to Consolidated Financial Statements
(Information as of June 30, 2017 and for the six months ended
June 30, 2017 and 2016 is unaudited)
(in thousands, except share and per share data)
Non-employee Awards
The following table summarizes ACM’s non-employee share option activities:
| Number of Option Shares |
Weighted Average Grant Date Fair Value |
Weighted Average Exercise Price |
Weighted Average Remaining Contractual Term |
|||||||||||||
| Outstanding at January 1, 2015 |
1,036,673 | $ | 0.39 | $ | 0.75 | 4.60 | ||||||||||
| Granted |
496,670 | 0.66 | 1.50 | |||||||||||||
| Exercised |
— | — | — | |||||||||||||
| Expired |
— | — | — | |||||||||||||
| Forfeited |
— | — | — | |||||||||||||
| Outstanding at December 31, 2015 |
1,533,343 | 0.48 | 0.99 | 5.53 | ||||||||||||
| Granted |
415,225 | 0.54 | 3.00 | |||||||||||||
| Exercised |
(370,003 | ) | 0.45 | 0.75 | ||||||||||||
| Expired |
— | — | — | |||||||||||||
| Forfeited |
— | — | — | |||||||||||||
| Outstanding at December 31, 2016 |
1,578,565 | 0.51 | 1.58 | 6.81 | ||||||||||||
| Granted |
133,335 | 2.46 | 7.50 | |||||||||||||
| Exercised |
(231,886 | ) | 0.36 | 0.99 | ||||||||||||
| Expired |
— | — | — | |||||||||||||
| Forfeited |
— | — | — | |||||||||||||
| Outstanding at June 30, 2017 |
1,480,014 | 0.72 | 2.20 | 6.91 | ||||||||||||
| Vested and exercisable at December 31, 2015 |
1,006,117 | |||||||||||||||
| Vested and exercisable at December 31, 2016 |
877,097 | |||||||||||||||
| Vested and exercisable at June 30, 2017 |
789,997 | |||||||||||||||
During the six months ended June 30, 2017 and 2016 and the years ended December 31, 2016 and 2015, the Company recognized non-employee stock-based compensation expense of $1,220, $148, $291 and $350, respectively.
The fair value of each option granted to non-employees is re-measured at each period end until the vesting date using the Black-Scholes valuation model with the following assumptions:
| June 30, | December 31, | |||||||||||||||
| 2017 | 2016 | 2016 | 2015 | |||||||||||||
| Fair value of common share(1) |
$6.87-$7.59 | $1.86 | $2.28 | $1.59 | ||||||||||||
| Expected term in years(2) |
4.08-6.19 | 2.62-5.69 | 2.11-6.24 | 3.12-5.94 | ||||||||||||
| Volatility(3) |
28.87%-29.41% | 30.59%-31.43% | 29.93 | % | 33.21 | % | ||||||||||
| Risk-free interest rate(4) |
1.85%-2.33% | 0.71%-1.21% | 1.00%-2.25 | % | 1.31%-1.76 | % | ||||||||||
| Expected dividend(5) |
0% | 0% | 0 | % | 0 | % | ||||||||||
| (1) | As the common stock was not publicly traded, the Company used an independent third-party valuation firm to value the common stock in 2014, 2015, 2016 and the six months ended June 30, 2017. The fair value of common stock issued prior to January 1, 2014 was determined to be $0.75, which was the price most investors paid to purchase common stock prior to that date. |
F-37
Table of Contents
ACM RESEARCH, INC.
Notes to Consolidated Financial Statements
(Information as of June 30, 2017 and for the six months ended
June 30, 2017 and 2016 is unaudited)
(in thousands, except share and per share data)
| (2) | Expected term of share options is based on the average of the vesting period and the contractual term for each grant according to Staff Accounting Bulletin 110. |
| (3) | Volatility is calculated based on the historical volatility of ACM’s comparable companies in the period equal to the expected term of each grant. |
| (4) | Risk-free interest rate is based on the yields of U.S. Treasury securities with maturities similar to the expected term of the share options in effect at the time of grant. |
| (5) | Expected dividend is assumed to be 0% as ACM has no history or expectation of paying a dividend on its common stock. |
NOTE 17 – INCOME TAXES
The following represent components of the income tax benefit (expense) for the six months ended June 30, 2017 and 2016 and the years ended December 31, 2016 and 2015:
| Six Months Ended June 30, | December 31, | |||||||||||||||
| 2017 | 2016 | 2016 | 2015 | |||||||||||||
| Current: |
||||||||||||||||
| U.S. federal |
$— | $— | $ | — | $ | (40 | ) | |||||||||
| U.S. state |
— | — | (1 | ) | 30 | |||||||||||
| Foreign |
— | — | — | — | ||||||||||||
|
|
|
|
|
|
|
|
|
|||||||||
| Total current tax benefit (expense) |
— | — | (1 | ) | (10 | ) | ||||||||||
|
|
|
|
|
|
|
|
|
|||||||||
| Deferred: |
||||||||||||||||
| U.S. federal |
— | — | — | — | ||||||||||||
| U.S. state |
— | — | — | — | ||||||||||||
| Foreign |
(749) | 73 | (594 | ) | 2,535 | |||||||||||
|
|
|
|
|
|
|
|
|
|||||||||
| Total deferred tax benefit (expense) |
(749) | 73 | (594 | ) | 2,535 | |||||||||||
|
|
|
|
|
|
|
|
|
|||||||||
| Total income tax benefit (expense) |
$(749) | 73 | $ | (595 | ) | 2,525 | ||||||||||
|
|
|
|
|
|
|
|
|
|||||||||
F-38
Table of Contents
ACM RESEARCH, INC.
Notes to Consolidated Financial Statements
(Information as of June 30, 2017 and for the six months ended
June 30, 2017 and 2016 is unaudited)
(in thousands, except share and per share data)
Tax effects of temporary differences that give rise to significant portions of the Company’s deferred tax assets at June 30, 2017 and December 31, 2016 and 2015 are presented below:
| June 30, 2017 |
December 31, | |||||||||||
| 2016 | 2015 | |||||||||||
| Deferred tax assets: |
||||||||||||
| Net operating loss carry forwards (offshore) |
$1,275 | $ | 1,029 | $ | 1,568 | |||||||
| Net operating loss carry forwards (U.S.) and credit |
7,124 | 5,815 | 5,141 | |||||||||
| Deferred revenue (offshore) |
589 | 840 | 1,130 | |||||||||
| Accruals (U.S.) |
42 | 18 | 472 | |||||||||
| Reserves and other (offshore) |
43 | 43 | 72 | |||||||||
| Stock-based compensation (U.S.) |
760 | 342 | 298 | |||||||||
| Property and equipment (U.S.) |
3 | 3 | 3 | |||||||||
|
|
|
|
|
|
|
|||||||
| Total gross deferred tax assets |
9,836 | 8,090 | 8,684 | |||||||||
| Less: valuation allowance |
(8,713) | (6,249 | ) | (6,148 | ) | |||||||
|
|
|
|
|
|
|
|||||||
| Total deferred tax assets |
1,123 | 1,841 | 2,536 | |||||||||
| Total deferred tax liabilities |
— | — | — | |||||||||
| Translation difference |
— | — | (104 | ) | ||||||||
|
|
|
|
|
|
|
|||||||
| Deferred tax assets, net |
$1,123 | $ | 1,841 | $ | 2,432 | |||||||
|
|
|
|
|
|
|
|||||||
The Company considers all available evidence to determine whether it is more likely than not that some portion or all of the deferred tax assets will be realized. The ultimate realization of deferred tax assets is dependent upon the generation of future taxable income during the periods in which those temporary differences become realizable. Management considers the scheduled reversal of deferred tax liabilities (including the impact of available carryback and carry-forward periods), and projected taxable income in assessing the realizability of deferred tax assets. In making such judgments, significant weight is given to evidence that can be objectively verified. Based on all available evidence, a partial valuation allowance has been established against some net deferred tax assets as of June 30, 2017 and December 31, 2016 and 2015, based on estimates of recoverability. While the Company has optimistic plans for its business strategy, it determined that such a valuation allowance was necessary given its historical losses and the uncertainty with respect to its ability to generate sufficient profits from its business model from all tax jurisdictions. In order to fully realize the U.S. deferred tax assets, the Company must generate sufficient taxable income in future periods before the expiration of the deferred tax assets governed by the tax code. The valuation allowance in the U.S. increased by approximately $1,811, $264 and $106 during the six months ended June 30, 2017 and the years ended December 31, 2016 and 2015, respectively. The valuation allowance in China increased by approximately $653 and decreased by $163 and $2,469 during six months ended June 30, 2017 and the years ended December 31, 2016 and 2015, respectively.
The Company did not have any significant temporary differences relating to deferred tax liabilities as of June 30, 2017 or December 31, 2016 or 2015.
As of June 30, 2017 and December 31, 2016, the Company had net operating loss carry-forwards of respectively, $18,886 and $15,037 for U.S federal purposes, $322 for U.S. state purposes and $8,409 and $6,822 for Chinese income tax purposes. Such losses are set to expire in 2019, 2032, and 2017 for U.S. federal, U.S. state and Chinese income tax purposes, respectively.
F-39
Table of Contents
ACM RESEARCH, INC.
Notes to Consolidated Financial Statements
(Information as of June 30, 2017 and for the six months ended
June 30, 2017 and 2016 is unaudited)
(in thousands, except share and per share data)
As of June 30, 2017 and December 31, 2016, the Company had research credit carry-forwards of $606 for U.S. federal purposes, and $377 for U.S. state purposes. Such credits are set to expire in 2025 for U.S. federal carry-forwards. There is no expiration date for U.S. state carry-forwards.
A limitation may apply to the use of the U.S. net operating loss and credit carry-forwards, under provisions of the U.S. Internal Revenue Code that would be applicable if ACM experiences an “ownership change.” Should these limitations apply, the carry-forwards would be subject to an annual limitation, resulting in a substantial reduction in the gross deferred tax assets before considering the valuation allowance. As of June 30, 2017 and December 31, 2016, the Company had not performed an analysis to determine if its net operating loss and credit carry-forwards would be subject to such limitations.
The Company’s effective tax rate differs from statutory rates of 34% for U.S. federal income tax purposes and 15%-25% for Chinese income tax purpose due to the effects of the valuation allowance and certain permanent differences as it pertains to book-tax differences in the value of client shares received for services. Pursuant to the Corporate Income Tax Law of the PRC, all of the Company’s PRC subsidiaries are liable to PRC Corporate Income Taxes at a rate of 25% except for ACM Shanghai. According to Guoshuihan 2009 No. 203, if an entity is certified as an “advanced and new technology enterprise,” it is entitled to a preferential income tax rate of 15%. ACM Shanghai obtained the certificate of “advanced and new technology enterprise” in 2012 and again in 2016 with an effective period of three years, and the provision for PRC corporate income tax for ACM Shanghai is calculated by applying the income tax rate of 15% for the six months ended June 30, 2017 and 2016 and the years ended December 31, 2016 and 2015.
Income tax (expense) benefit for the six months ended June 30, 2017 and 2016 and years ended December 31, 2016 and 2015 differed from the amounts computed by applying the statutory federal income tax rate of 34% to pretax income (loss) as a result of the following:
| Six Months Ended June 30, | December 31, | |||||||||||||||
| 2017 | 2016 | 2016 | 2015 | |||||||||||||
| Effective tax rate reconciliation: |
||||||||||||||||
| Income tax provision at statutory rate |
34.0 | % | 34.0 | % | (34.0 | )% | (34.0 | )% | ||||||||
| State taxes, net of Federal benefit |
0.0 | 0.0 | 0.0 | 0.6 | ||||||||||||
| Foreign rate differential |
4.5 | 20.4 | 38.7 | 20.7 | ||||||||||||
| Other permanent difference |
5.6 | (32.4 | ) | (20.9 | ) | (2.0 | ) | |||||||||
| Change in valuation allowance |
(78.0 | ) | (16.0 | ) | (3.8 | ) | 61.6 | |||||||||
|
|
|
|
|
|
|
|
|
|||||||||
| Total income tax (expense) benefit |
(33.9 | )% | 6.0 | % | (20.0 | )% | 46.9 | % | ||||||||
|
|
|
|
|
|
|
|
|
|||||||||
F-40
Table of Contents
ACM RESEARCH, INC.
Notes to Consolidated Financial Statements
(Information as of June 30, 2017 and for the six months ended
June 30, 2017 and 2016 is unaudited)
(in thousands, except share and per share data)
Tax positions are evaluated in a two-step process. The Company first determines whether it is more likely than not that a tax position will be sustained upon examination. If a tax position meets the more-likely-than-not recognition threshold it is then measured to determine the amount of benefit to recognize in the financial statements. The tax position is measured as the largest amount of benefit that is greater than 50% likely of being realized upon ultimate settlement. The aggregate changes in the balance of gross unrecognized tax benefits, which excludes interest and penalties, for the six months ended June 30, 2017 and the years ended December 31, 2016 and 2015, are as follows:
| June 30, 2017 |
December 31, | |||||||||||
| 2016 | 2015 | |||||||||||
| Beginning balance |
$ | 44 | $ | 44 | $ | — | ||||||
| Increase/(Decrease) of unrecognized tax benefits taken in prior years |
— | — | — | |||||||||
| Increase/(Decrease) of unrecognized tax benefits related to current year |
— | — | 44 | |||||||||
| Increase/(Decreases) of unrecognized tax benefits related to settlements |
— | — | — | |||||||||
| Reductions to unrecognized tax benefits related to lapsing statute of limitations |
— | — | — | |||||||||
|
|
|
|
|
|
|
|||||||
| Ending balance |
$ | 44 | $ | 44 | $ | 44 | ||||||
|
|
|
|
|
|
|
|||||||
The Company files income tax returns in the United States, and state and foreign jurisdictions. The federal, state and foreign income tax returns are under the statute of limitations subject to tax examinations for the tax years ended December 31, 2009 through June 30, 2017. To the extent the Company has tax attribute carry-forwards, the tax years in which the attribute was generated may still be adjusted upon examination by the U.S. Internal Revenue Service, state or foreign tax authorities to the extent utilized in a future period.
The Company had $44 of unrecognized tax benefits as of June 30, 2017 and December 31, 2016 and 2015. The Company does not anticipate a significant change to its unrecognized tax benefits in the year ending December 31, 2017.
The Company recognizes interest and penalties related to uncertain tax positions in income tax expense. As of June 30, 2017 and December 31, 2016 and 2015, the Company had $44 of accrued penalties and $0 of accrued penalties related to uncertain tax positions, none of which has been recognized in the Company’s consolidated statements of operations and comprehensive income for the six months ended June 30, 2017 and the year ended December 31, 2016. There were no ongoing examinations by taxing authorities as of June 30, 2017 and December 31, 2016.
The Company intends to indefinitely reinvest the PRC earnings outside of the U.S. as of June 30, 2017 and December 31, 2016. Thus, deferred taxes are not provided in the U.S. for unremitted earnings in the PRC.
NOTE 18 – COMMITMENTS AND CONTINGENCIES
The Company leases offices under non-cancelable operating lease agreements. The rental expenses were $336, $342, $675 and $718 for the six months ended June 30, 2017 and the years ended December 31, 2016 and
F-41
Table of Contents
ACM RESEARCH, INC.
Notes to Consolidated Financial Statements
(Information as of June 30, 2017 and for the six months ended
June 30, 2017 and 2016 is unaudited)
(in thousands, except share and per share data)
2015, respectively. See note 13 for future minimum lease payments under non-cancelable operating lease agreements with initial terms of one year or more.
The Company did not have any capital commitments during the reported periods.
From time to time the Company is subject to legal proceedings, including claims in the ordinary course of business and claims with respect to patent infringements.
NOTE 19 – RESTRICTED NET ASSETS
In accordance with the PRC’s Foreign Enterprise Law, ACM Shanghai and ACM Wuxi are required to make contributions to a statutory surplus reserve (note 2).
As a result of PRC laws and regulations that require annual appropriations of 10% of net after-tax profits to be set aside prior to payment of dividends as general reserve fund or statutory surplus fund, ACM Shanghai is restricted in its ability to transfer a portion of its net assets to ACM (including any assets received as distributions from ACM Wuxi). Amounts restricted included paid-in capital and statutory reserve funds, as determined pursuant to PRC accounting standards and regulations, were $29,927 as of June 30, 2017 and December 31, 2016 and 2015.
NOTE 20 – SUBSEQUENT EVENTS
ACM has entered into the following agreements with minority third-party investors holding a minority, or non-controlling, equity interest in ACM Shanghai, which are reflected as “non-controlling interests” in the Company’s consolidated financial statements:
| • | In March 2017 ACM entered into a securities purchase agreement with Shanghai Science and Technology Venture Capital Co., Ltd. (“SSTVC”) pursuant to which, effective as of August 31, 2017, ACM acquired SSTVC’s equity interests in ACM Shanghai for a purchase price of $5,800 and issued to SSTVC 4,998,508 shares of Series E convertible preferred stock for a purchase price of $5,800. |
| • | In August 2017 ACM entered into a securities purchase agreement with Shanghai Pudong High-Tech Investment Co., Ltd. (“PDHTI”) and its subsidiary Pudong Science and Technology (Cayman) Co., Ltd. (“PST”), in which ACM agreed to bid, in an auction process mandated by PRC regulations, to purchase PDHTI’s 10.78% equity interests in ACM Shanghai and to sell shares of Class A common stock to PST. On September 8, 2017, ACM issued 1,119,576 shares of Class A common stock to PST for a purchase price of $7.50 per share, representing an aggregate purchase price of $8,397. |
| • | In August 2017 ACM entered into a securities purchase agreement with Shanghai Zhangjiang Science & Technology Venture Capital Co., Ltd. (“ZSTVC”) and its subsidiary Zhangjiang AJ Company Limited (“ZJAJ”), in which ACM agreed to bid, in an auction process mandated by PRC regulations, to purchase ZSTVC’s 7.58% equity interests in ACM Shanghai and to sell shares of Class A common stock to ZJAJ. On September 8, 2017, ACM issued 787,098 shares of Class A common stock to ZJAJ for a purchase price of $7.50 per share, or an aggregate purchase price of $5,903. |
On September 6, 2017 ACM and Ninebell Co., Ltd. (“Ninebell”) entered into:
| • | an ordinary share purchase agreement, effective as of September 11, 2017, pursuant to which, contemporaneously with signing, Ninebell issued to ACM, for a purchase price of $1,200, ordinary shares representing 20% of Ninebell’s post-closing equity; and |
F-42
Table of Contents
ACM RESEARCH, INC.
Notes to Consolidated Financial Statements
(Information as of June 30, 2017 and for the six months ended
June 30, 2017 and 2016 is unaudited)
(in thousands, except share and per share data)
| • | a common stock purchase agreement, effective as of September 11, 2017, pursuant to which, contemporaneously with signing, ACM issued 133,334 shares of Class A common stock to Ninebell for a purchase price of $7.50 per share, or an aggregate purchase price of $1,000. |
On September 13, 2017, ACM effected the Reverse Split. Under the terms of the Reverse Split, each share of Class A and Class B common stock, issued and outstanding as of such effective date, was automatically reclassified and changed into one-third of one share of Class A and Class B common stock, as applicable, without any action by the stockholders. Fractional shares were rounded up to the nearest whole share on a holder-by-holder basis. All share and per share amounts have been restated to reflect the Reverse Split for all periods presented.
NOTE 21 – PARENT COMPANY ONLY CONDENSED FINANCIAL INFORMATION
The Company performed a test on the restricted net assets of consolidated subsidiaries in accordance with Rule 4-08(e)(3) of Regulation S-X of the SEC and concluded that it was applicable for the Company to disclose the financial information for ACM only. Certain information and footnote disclosures generally included in financial statements prepared in accordance with GAAP have been condensed or omitted. The footnote disclosure contains supplemental information relating to the operations of ACM separately.
ACM’s subsidiaries did not pay any dividends to ACM during the periods presented.
ACM did not have significant capital or other commitments, long-term obligations, or guarantees as of June 30, 2017 or December 31, 2016 or 2015.
F-43
Table of Contents
ACM RESEARCH, INC.
Notes to Consolidated Financial Statements
(Information as of June 30, 2017 and for the six months ended
June 30, 2017 and 2016 is unaudited)
(in thousands, except share and per share data)
The following represents condensed unconsolidated financial information of ACM only as of and for the years ended December 31, 2016 and 2015:
CONDENSED BALANCE SHEET
| December 31, | ||||||||
| 2016 | 2015 | |||||||
| Assets |
|
|||||||
| Current assets: |
||||||||
| Cash and cash equivalents |
$ | 7,264 | $ | 504 | ||||
| Inventory |
1,042 | 732 | ||||||
| Due from intercompany |
1,986 | — | ||||||
| Other receivable |
3 | — | ||||||
|
|
|
|
|
|||||
| Total current assets |
10,295 | 1,236 | ||||||
| Investment in unconsolidated subsidiaries |
6,583 | 3,250 | ||||||
|
|
|
|
|
|||||
| Total assets |
$ | 16,878 | 4,486 | |||||
|
|
|
|
|
|||||
| Liabilities, Redeemable Convertible Preferred Stock and Stockholders’ Deficit |
||||||||
| Notes payable |
$ | 11 | $ | 2,837 | ||||
| Accounts payable |
1,176 | 685 | ||||||
| Due to intercompany |
— | 280 | ||||||
| Other payable |
47 | — | ||||||
| Income taxes payable |
44 | 44 | ||||||
|
|
|
|
|
|||||
| Total liabilities |
1,278 | 3,846 | ||||||
| Total redeemable convertible preferred stocks |
18,034 | 8,876 | ||||||
| Total stockholders’ deficit |
(2,434 | ) | (8,236 | ) | ||||
|
|
|
|
|
|||||
| Total liabilities, redeemable convertible preferred stock and stockholders’ deficit |
$ | 16,878 | $ | 4,486 | ||||
|
|
|
|
|
|||||
F-44
Table of Contents
ACM RESEARCH, INC.
Notes to Consolidated Financial Statements
(Information as of June 30, 2017 and for the six months ended
June 30, 2017 and 2016 is unaudited)
(in thousands, except share and per share data)
CONDENSED STATEMENT OF OPERATIONS
| Year Ended December 31, |
||||||||
| 2016 | 2015 | |||||||
| Revenue |
$ | 5,803 | $ | 6,787 | ||||
| Cost of revenue |
(5,346 | ) | (6,185 | ) | ||||
|
|
|
|
|
|||||
| Gross profit |
457 | 602 | ||||||
| Operating expenses: |
||||||||
| Sales and marketing expenses |
(64 | ) | (1 | ) | ||||
| General and administrative expenses |
(1,202 | ) | (715 | ) | ||||
| Research and development expenses |
(6 | ) | — | |||||
|
|
|
|
|
|||||
| Loss from operations |
(815 | ) | (114 | ) | ||||
| Equity in earnings of unconsolidated subsidiaries |
3,561 | 5,611 | ||||||
| Other income (expense), net |
(1,608 | ) | 1 | |||||
| Interest expense, net |
(106 | ) | (108 | ) | ||||
|
|
|
|
|
|||||
| Income before income taxes |
1,032 | 5,390 | ||||||
| Income tax expense |
(1 | ) | (10 | ) | ||||
|
|
|
|
|
|||||
| Net income |
$ | 1,031 | $ | 5,380 | ||||
|
|
|
|
|
|||||
CONDENSED STATEMENT OF CASH FLOWS
| Year Ended December 31, |
||||||||
| 2016 | 2015 | |||||||
| Net cash (used in) provided by operating activities |
$ | (2,220 | ) | $ | 357 | |||
| Net cash provided by financing activities |
9,309 | — | ||||||
|
|
|
|
|
|||||
| Net increase in cash and cash equivalents |
7,089 | 357 | ||||||
| Cash and cash equivalents, beginning of year |
504 | 326 | ||||||
| Effect of exchange rate changes on cash and cash equivalents |
(329 | ) | (179 | ) | ||||
|
|
|
|
|
|||||
| Cash and cash equivalents, end of year |
$ | 7,264 | $ | 504 | ||||
|
|
|
|
|
|||||
NOTES TO CONDENSED FINANCIAL INFORMATION
Basis of Presentation
The condensed financial information has been prepared using the same accounting policies as set out in the Company’s consolidated financial statements except that ACM has used the equity method to account for its investments in subsidiaries.
Investments in Subsidiaries
For the ACM-only condensed financial information, ACM records its investments in its subsidiaries under the equity method of accounting as prescribed in FASB ASC Topic 323, Investment – Equity Method and Joint Ventures. ACM’s investments in subsidiaries are stated at cost plus its equity interest in undistributed earnings of subsidiaries less impairment loss, if any, since inception, and are presented on its condensed balance sheet as “Investments in unconsolidated subsidiaries” and ACM’s share of the subsidiaries’ income or loss as “Equity in earnings of unconsolidated subsidiaries” on ACM’s condensed statement of operations.
F-45
Table of Contents
2,000,000 Shares
Class A Common Stock
PROSPECTUS
Sole Book-Running Manager
Roth Capital Partners
Co-Managers
| Craig-Hallum Capital Group | The Benchmark Company |
, 2017
Through and including , 2017 (the 25th day after the date of this offering), all dealers effecting transactions in these securities, whether or not participating in this offering, may be required to deliver a prospectus. This is in addition to a dealer’s obligation to deliver a prospectus when acting as an underwriter and with respect to an unsold allotment or subscription.
Table of Contents
PART II
INFORMATION NOT REQUIRED IN THE PROSPECTUS
| Item 13. | Other Expenses of Issuance and Distribution. |
The following table presents the costs and expenses, other than underwriting discounts and commissions, payable in connection with the sale of Class A common stock being registered. All amounts are estimates except the SEC registration fee, the FINRA filing fee and the exchange listing fee. Except as otherwise noted, all the expenses below will be paid by us.
| SEC registration fee |
$ | 2,720 | ||
| FINRA filing fee |
5,675 | |||
| Exchange listing fee |
125,000 | |||
| Printing and engraving expenses |
106,000 | |||
| Legal fees and expenses |
1,135,000 | |||
| Accounting fees and expenses |
500,000 | |||
| Transfer agent and registrar fees |
3,500 | |||
| Miscellaneous fees and expenses |
372,105 | |||
|
|
|
|||
| Total |
$ | 2,250,000 | ||
|
|
|
| Item 14. | Indemnification of Directors and Officers. |
Sections 145 and 102(b)(7) of the General Corporation Law of the State of Delaware provide that a corporation may indemnify any person made a party to an action by reason of the fact that he or she was a director, officer, employee or agent of the corporation or is or was serving at the request of a corporation against expenses (including attorneys’ fees), judgments, fines and amounts paid in settlement actually and reasonably incurred by him or her in connection with such action if he or she acted in good faith and in a manner he or she reasonably believed to be in, or not opposed to, the best interests of the corporation and, with respect to any criminal action or proceeding, had no reasonable cause to believe his or her conduct was unlawful, except that, in the case of an action by or in right of the corporation, no indemnification may generally be made in respect of any claim as to which such person is adjudged to be liable to the corporation.
In connection with the completion of this offering, the registrant’s restated charter will contain provisions that eliminate, to the maximum extent permitted by the General Corporation Law of the State of Delaware, the personal liability of the registrant’s directors for monetary damages for breach of their fiduciary duties as directors. The registrant’s restated bylaws to be in effect immediately prior to the completion of this offering provide that the registrant must indemnify its directors and officers and may indemnify its employees and other agents to the fullest extent permitted by the General Corporation Law of the State of Delaware.
The registrant has entered into indemnification agreements with its directors and executive officers, in addition to the indemnification provided for in its restated bylaws, and intends to enter into indemnification agreements with any new directors and executive officers in the future.
The registrant has purchased and intends to maintain insurance on behalf of any person who is or was a director or officer of the registrant against any loss arising from any claim asserted against him or her and incurred by him or her in any such capacity, subject to certain exclusions.
The Underwriting Agreement, the form of which is attached as Exhibit 1.1 hereto, provides for indemnification by the underwriters of the registrant and its executive officers and directors, and by the registrant
II-1
Table of Contents
of the underwriters, for certain liabilities, including liabilities arising under the Securities Act and affords certain rights of contribution with respect thereto.
See also “Undertakings” set out in response to Item 17 herein.
| Item 15. | Recent Sales of Unregistered Securities. |
Set forth below is information regarding the shares of common stock and preferred stock, and options granted, by us since January 30, 2014 that were not registered under the Securities Act of 1933.
| (1) | We granted stock options to purchase shares of Class A common stock to certain of our employees, officers, directors, consultants and advisors, as follows: (a) on May 1, 2015, we granted stock options to purchase an aggregate of 783,338 shares of Class A common stock at a price of $1.50 per share; (b) on September 8, 2015 we granted stock options to purchase an aggregate of 263,335 shares of Class A common stock at an exercise price of $1.50 per share; (c) on December 28, 2016 we granted stock options to purchase an aggregate of 1,424,596 shares of Class A common stock at a price of $3.00 per share; (d) on March 9, 2017 we granted a stock option to purchase 33,334 shares of Class A common stock at a price of $7.50 per share and (e) on May 9, 2017 we granted a stock option to purchase an aggregate of 183,335 shares of Class A common stock at a price of $2.50 per share. |
| (2) | Options have been exercised to acquire a total of 889,558 shares of Class A common stock for consideration aggregating $723,910. |
| (3) | Options have been exercised to acquire a total of 362,335 shares of Class B common stock for consideration aggregating $271,750. |
| (4) | In December 2016 we issued (a) 3,615,800 shares of Series F convertible preferred stock for an aggregate purchase price of $9,039,500, (b) 47,454 shares of Series F convertible preferred stock pursuant to conversion of $118,665 of principal and accrued interest of convertible promissory notes and (c) 1,812,069 shares of Class A common stock pursuant to the conversion of $2,522,784 of principal of convertible promissory notes. |
| (5) | In March 2017 we entered into a securities purchase agreement pursuant to which we issued a warrant to acquire 397,502 shares of Class A common stock for an aggregate purchase price of $2,981,265. |
| (6) | In March 2017 we entered into a securities purchase agreement pursuant to which we issued 4,998,508 shares of Series E convertible preferred stock for an aggregate purchase price of $5,800,000. |
| (7) | In August 2017 we entered into a securities purchase agreement pursuant to which we issued 1,119,576 shares of Class A common stock for an aggregate purchase price of $8,396,820. |
| (8) | In August 2017 we entered into a securities purchase agreement pursuant to which we issued 787,098 shares of Class A common stock for an aggregate purchase price of $5,903,235. |
| (9) | In September 2017 we entered into a securities purchase agreement pursuant to which we issued 133,334 shares of Class A common stock for an aggregate purchase price of $1,000,000. |
| (10) | In October 2017 we entered into securities purchase agreements pursuant to which we agreed to issue, subject to the closing of this offering, 1,333,334 shares of Class A common stock in a concurrent private placement at an exercise price per share equal to the initial public offering price of this offering (subject to adjustment). |
The offers, sales, grants and issuances of the securities described in paragraphs (1), (2) and (3) were deemed to be exempt from registration under the Securities Act in reliance on Rule 701. The recipients of such securities were our employees, officers, directors, bona fide consultants and advisors and received the securities under our 1998 Stock Option Plan, written compensation contracts or our 2016 Omnibus Incentive Plan. Appropriate legends were affixed to the securities issued in these transactions. Each of the recipients of securities in these transactions had adequate access, through employment, business or other relationships, to information about us.
The offer, sale and issuance of the securities described in paragraphs (4) through (10) were deemed to be exempt from registration under the Securities Act in reliance on Section 4(a)(2) of the Securities Act in that the
II-2
Table of Contents
issuance of the securities to the accredited investors did not involve a public offering. The recipients of the securities in these transactions acquired the securities for investment only and not with a view to or for sale in connection with any distribution thereof, and appropriate legends were affixed to the securities issued in these transactions. The recipients of the securities in these transactions were accredited investors under Rule 501 of Regulation D.
| Item 16. | Exhibits and Consolidated Financial Statement Schedules. |
(a) Exhibits
II-3
Table of Contents
| # | Previously filed. |
| * | To be filed by amendment. |
| + | Indicates management contract or compensatory plan. |
(b) Consolidated Financial Statement Schedules
Schedules not listed above have been omitted because the information required to be set forth therein is not applicable or is shown in the financial statements or notes thereto.
| Item 17. | Undertakings. |
Insofar as indemnification for liabilities arising under the Securities Act of 1933 may be permitted to directors, officers and controlling persons of the registrant pursuant to the foregoing provisions, or otherwise, the registrant
II-4
Table of Contents
has been advised that, in the opinion of the SEC, such indemnification is against public policy as expressed in the Securities Act of 1933, and is, therefore, unenforceable. In the event that a claim for indemnification against such liabilities (other than the payment by the registrant of expenses incurred or paid by a director, officer or controlling person of the registrant in the successful defense of any action, suit or proceeding) is asserted by such director, officer or controlling person in connection with the securities being registered, the registrant will, unless in the opinion of its counsel the matter has been settled by controlling precedent, submit to a court of appropriate jurisdiction the question whether such indemnification by it is against public policy as expressed in the Securities Act of 1933, and will be governed by the final adjudication of such issue.
The undersigned registrant hereby undertakes to provide the underwriters, at the closing specified in the underwriting agreement, certificates in such denominations and registered in such names as required by the underwriters to permit prompt delivery to each purchaser.
The undersigned registrant hereby undertakes that:
| 1. | For purposes of determining any liability under the Securities Act of 1933, the information omitted from a form of prospectus filed as part of this registration statement in reliance upon Rule 430A and contained in the form of prospectus filed by the registrant pursuant to Rule 424(b)(1) or (4) or 497(h) under the Securities Act of 1933 shall be deemed to be part of this registration statement as of the time it was declared effective. |
| 2. | For the purpose of determining any liability under the Securities Act of 1933, each post-effective amendment that contains a form of prospectus shall be deemed to be a new registration statement relating to the securities offered therein, and the offering of such securities at that time shall be deemed to be the initial bona fide offering thereof. |
II-5
Table of Contents
SIGNATURES
Pursuant to the requirements of the Securities Act of 1933, as amended, the registrant has duly caused this Registration Statement to be signed on its behalf by the undersigned, thereunto duly authorized, in the City of Fremont, State of California, on October 18, 2017.
| ACM RESEARCH, INC. | ||
| By: | /S/ DAVID H. WANG | |
| David H. Wang | ||
| Chief Executive Officer and President | ||
Pursuant to the requirements of the Securities Act of 1933, as amended, this Registration Statement has been signed by the following persons in the capacities indicated on October 18, 2017:
| Signature |
Title | |
| /S/ DAVID H. WANG David H. Wang |
Chief Executive Officer, President and Director (Principal Executive Officer) | |
| /S/ MIN XU Min Xu |
Chief Financial Officer and Treasurer (Principal Financial and Accounting Officer) | |
| * Haiping Dun |
Director | |
| * Chenming Hu |
Director | |
| * Tracy Liu |
Director | |
|
*BY: /S/ MIN XU Min Xu Attorney-in-Fact |
||
II-6
Table of Contents
EXHIBIT INDEX
| Exhibit |
Description | |
| 1.01 | Form of Underwriting Agreement to be entered into between ACM Research, Inc. and the underwriters of this offering | |
| 3.01# | Certificate of Incorporation of ACM Research, Inc., as amended (currently in effect) | |
| 3.02# | Bylaws of ACM Research, Inc. (currently in effect) | |
| 3.03 | Form of Restated Certificate of Incorporation (to be effective following completion of this offering) | |
| 3.04 | Form of Restated Bylaws of ACM Research, Inc. (to be effective upon completion of this offering) | |
| 4.01 | Specimen stock certificate evidencing Class A common stock of ACM Research, Inc. | |
| 4.02 | Form of Class A Common Stock Warrant of ACM Research, Inc. to be issued to the underwriters of this offering | |
| 5.01* | Form of Opinion of K&L Gates LLP | |
| 10.01# | Lease dated March 22, 2017 between ACM Research, Inc. and D&J Construction, Inc. | |
| 10.02# | Lease dated September 6, 2016 between ACM Research (Shanghai), Inc. and Shanghai Zhangjiang Group Co., Ltd. | |
| 10.03# | Securities Purchase Agreement dated March 14, 2017 by and among ACM Research, Inc., Shengxin (Shanghai) Management Consulting Limited Partnership and ACM Research (Shanghai), Inc. | |
| 10.03(a)# | Warrant dated March 14, 2017 issued by ACM Research, Inc. to Shengxin (Shanghai) Management Consulting Limited Partnership | |
| 10.04 | Securities Purchase Agreement dated March 23, 2017 between ACM Research, Inc. and Shanghai Science and Technology Venture Capital Co., Ltd., as amended | |
| 10.05# | Securities Purchase Agreement dated August 31, 2017 by and among ACM Research, Inc., Shanghai Pudong High-Tech Investment Co., Ltd. and Pudong Science and Technology (Cayman) Co., Ltd. | |
| 10.06# | Securities Purchase Agreement dated August 31, 2017 by and among ACM Research, Inc., Shanghai Zhangjiang Science & Technology Venture Capital Co., Ltd. and Zhangjiang AJ Company Limited | |
| 10.07 | Ordinary Share Purchase Agreement dated September 6, 2017 by and among ACM Research, Inc., Ninebell Co., Ltd. and Moon-Soo Choi | |
| 10.08 | Class A Common Stock Purchase Agreement dated September 6, 2017 by and among ACM Research, Inc., Ninebell Co., Ltd. and Moon-Soo Choi | |
| 10.09 | Form of Second Amended and Restated Registration Rights Agreement to be entered into between ACM Research, Inc. and certain of its stockholders | |
| 10.10 | Stock Purchase Agreement, dated October 11, 2017, by and among ACM Research, Inc., Xunxin (Shanghai) Capital Co., Limited, Xinxin (Hongkong) Capital Co., Limited and David H. Wang | |
| 10.11 | Stock Purchase Agreement, dated October 16, 2017, by and between ACM Research, Inc. and Victorious Way Limited | |
| 10.12 | Nomination and Voting Agreement, dated October 11, 2017, by and among Xinxin (Hongkong) Capital Co., Limited, ACM Research, Inc., David H. Wang, and the individuals named therein | |
| 10.13 | Voting Agreement, dated March 23, 2017, by and among Shanghai Technology Venture Capital Co., Ltd. (also known as Shanghai Science and Technology Venture Capital Co., Ltd.) and ACM Research, Inc. | |
| 10.14+# | 2016 Omnibus Incentive Plan of ACM Research, Inc. | |
II-7
Table of Contents
| Exhibit |
Description | |
| 10.14(a)+# | Form of Incentive Stock Option Grant Notice and Agreement under 2016 Omnibus Incentive Plan | |
| 10.14(b)+# | Form of Non-qualified Stock Option Grant Notice and Agreement under 2016 Omnibus Incentive Plan | |
| 10.14(c)+# | Form of Restricted Stock Unit Grant Notice and Agreement under 2016 Omnibus Incentive Plan | |
| 10.15+# | Form of Nonstatutory Stock Option Agreement of ACM Research, Inc. | |
| 10.16+# | 1998 Stock Option Plan of ACM Research, Inc. | |
| 10.16(a)+# | Form of Incentive Stock Option Agreement under 1998 Stock Option Plan | |
| 10.16(b)+# | Form of Non-statutory Stock Option Agreement under 1998 Stock Option Plan | |
| 10.17# | Form of Indemnification Agreement to be entered into between ACM Research, Inc. and certain of its directors and officers | |
| 10.18+# | Executive Retention Agreement dated November 14, 2016 between ACM Research, Inc. and Min Xu | |
| 10.19* | Line of Credit Agreement dated August 21, 2017 between ACM Research (Shanghai), Inc. and Bank of China Pudong Branch | |
| 10.20* | Line of Credit Agreement dated August 21, 2017 between ACM Research (Shanghai), Inc. and Bank of Shanghai Pudong Branch | |
| 21.01# | List of Subsidiaries of ACM Research, Inc. | |
| 23.01 | Consent of BDO China Shu Lan Pan Certified Public Accountants LLP | |
| 23.02* | Consent of K&L Gates LLP (included in Exhibit 5.01) | |
| 24.01# | Power of Attorney (included on signature page of Form S-1 filed on September 13, 2017) | |
| # | Previously filed. |
| * | To be filed by amendment. |
| + | Indicates management contract or compensatory plan. |
II-8