Attached files
| file | filename |
|---|---|
| EX-23.1 - EX-23.1 - Merchants Bancorp | a2233443zex-23_1.htm |
| EX-10.8 - EX-10.8 - Merchants Bancorp | a2233443zex-10_8.htm |
| EX-5.1 - EX-5.1 - Merchants Bancorp | a2233443zex-5_1.htm |
| EX-2.2 - EX-2.2 - Merchants Bancorp | a2233443zex-2_2.htm |
| EX-1.1 - EX-1.1 - Merchants Bancorp | a2233443zex-1_1.htm |
Use these links to rapidly review the document
TABLE OF CONTENTS
Index to Consolidated Financial Statements of Merchants Bancorp
As filed with the Securities and Exchange Commission on October 16, 2017.
Registration No. 333-220623
UNITED STATES
SECURITIES AND EXCHANGE COMMISSION
Washington, D.C. 20549
Amendment No. 1
to
Form S-1
REGISTRATION STATEMENT UNDER THE SECURITIES ACT OF 1933
MERCHANTS BANCORP
(Exact name of registrant as specified in its charter)
| Indiana | 6022 | 20-5747400 | ||
| (State or other jurisdiction of incorporation or organization) |
(Primary Standard Industrial Classification Code Number) |
(I.R.S. Employer Identification No.) |
11555 North Meridian Street, Suite 400
Carmel, Indiana 46032
(317) 569-7420
(Address, including zip code, and telephone number, including area code, of registrant's principal executive offices)
John F. Macke
Principal Financial Officer
Merchants Bancorp
11555 North Meridian Street, Suite 400
Carmel, Indiana 46032
(317) 569-7420
(Name, address, including zip code and telephone number, including area code, of agent for service)
Copies to:
| Michael J. Messaglia | Frank M. Conner III | |
| Robert J. Wild | Michael P. Reed | |
| Krieg DeVault LLP | Covington & Burling LLP | |
| One Indiana Square, Suite 2800 | One CityCenter | |
| Indianapolis, Indiana 46204 | 850 Tenth Street, NW | |
| (317) 636-4341 | Washington, D.C. 20001 | |
| (202) 662-6000 |
Approximate date of commencement of proposed sale to the public: As soon as practicable after the effective date of this registration statement.
If any of the securities being registered on this Form are to be offered on a delayed or continuous basis pursuant to Rule 415 under the Securities Act of 1933 check the following box: o
If this Form is filed to register additional securities for an offering pursuant to Rule 462(b) under the Securities Act, please check the following box and list the Securities Act registration statement number of the earlier effective registration statement for the same offering. o
If this Form is a post-effective amendment filed pursuant to Rule 462(c) under the Securities Act, check the following box and list the Securities Act registration statement number of the earlier effective registration statement for the same offering. o
If this Form is a post-effective amendment filed pursuant to Rule 462(d) under the Securities Act, check the following box and list the Securities Act registration statement number of the earlier effective registration statement for the same offering. o
Indicate by check mark whether the registrant is a large accelerated filer, an accelerated filer, a non-accelerated filer, a smaller reporting company or an emerging growth company. See the definitions of "large accelerated filer," "accelerated filer" "smaller reporting company" and "emerging growth company" in Rule 12b-2 of the Exchange Act.
| Large accelerated filer o | Accelerated filer o | Non-accelerated filer ý (Do not check if a smaller reporting company) |
Smaller reporting company o Emerging growth company ý |
If an emerging growth company, indicate by check mark if the registrant has elected not to use the extended transition period for complying with any new or revised financial accounting standards provided to Section 7(a)(2)(B) of the Securities Act. o
The Registrant hereby amends this Registration Statement on such date or dates as may be necessary to delay its effective date until the Registrant shall file a further amendment which specifically states that this registration statement shall thereafter become effective in accordance with Section 8(a) of the Securities Act of 1933, or until the Registration Statement shall become effective on such date as the Securities and Exchange Commission, acting pursuant to said Section 8(a), may determine.
The information in this preliminary prospectus is not complete and may be changed. We may not sell these securities until the Registration Statement filed with the Securities and Exchange Commission is effective. This preliminary prospectus is not an offer to sell nor does it seek an offer to buy these securities in any jurisdiction where the offer or sale is not permitted.
SUBJECT TO COMPLETION, DATED OCTOBER 16, 2017
PRELIMINARY PROSPECTUS
5,555,555 Shares

Common Stock
This prospectus relates to the initial public offering of Merchants Bancorp. We are a diversified bank holding company headquartered in Carmel, Indiana.
Prior to this offering, there has been no established public market for our common stock. We anticipate that the public offering price of our common stock will be between $17.00 and $19.00 per share. We have applied to list our common stock on the Nasdaq Capital Market under the trading symbol "MBIN."
Investing in our common stock involves risk. See "Risk Factors" beginning on page 17.
We are an "emerging growth company" under the federal securities laws and will be subject to reduced public company reporting requirements. See "Implications of Being an Emerging Growth Company."
| |
Per Share | Total | |||||
|---|---|---|---|---|---|---|---|
Initial public offering price |
$ | $ | |||||
Underwriting discounts |
|||||||
Proceeds to us, before expenses |
|||||||
We have granted the underwriters an option to purchase up to an additional 833,333 shares from us at the initial public offering price, less the underwriting discounts, within 30 days from the date of this prospectus.
Neither the Securities and Exchange Commission nor any other state securities commission nor any other regulatory authority has approved or disapproved of these securities or passed upon the accuracy or adequacy of this prospectus. Any representation to the contrary is a criminal offense.
Shares of our common stock are not savings accounts or deposits and are not insured or guaranteed by the Federal Deposit Insurance Corporation or any other government agency.
The underwriters expect to deliver the shares of our common stock against payment in New York, New York, on or about , 2017.
| Sandler O'Neill + Partners, L.P. | Stephens Inc. | Raymond James | ||
SunTrust Robinson Humphrey |
||||
The date of this prospectus is , 2017.
i
You should rely only on the information contained in this prospectus or in any free writing prospectus that we authorize to be delivered to you. We and the underwriters have not authorized anyone to provide you with different or additional information. We and the underwriters are not making an offer of these securities in any jurisdiction where the offer is not permitted. You should not assume that the information contained in this prospectus is accurate as of any date other than the date on the front of this prospectus. Our business, financial condition, results of operations and prospects may have changed since that date.
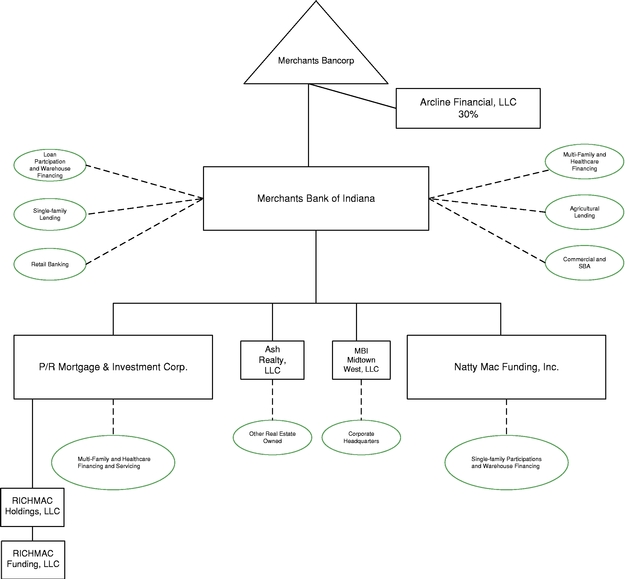
Unless we state otherwise or the context otherwise requires, references in this prospectus to "we," "our," "us" or "the Company" refer to Merchants Bancorp, an Indiana corporation, and our consolidated subsidiaries, references to "Merchants Bank" or the "Bank" refer to our banking subsidiary, Merchants Bank of Indiana, an Indiana state chartered bank, references to "P/RMIC" refer to the Bank's subsidiary, P/R Mortgage and Investment Corp., an Indiana corporation, references to "RICHMAC" refer collectively to P/RMIC's subsidiaries, RICHMAC Holdings, LLC, an Indiana limited liability company and RICHMAC Funding, LLC, a Delaware limited liability company, references to "NMF" refer to the Bank's subsidiary, Natty Mac Funding, Inc., an Indiana corporation, references to "Midtown West" refer to the Bank's subsidiary, MBI Midtown West, LLC, an Indiana limited liability company, and references to "Ash Realty" refer to the Bank's subsidiary, Ash Realty Holdings, LLC.
Within this prospectus, we reference certain market, industry and demographic data and other statistical information. We have obtained this data and information from various independent, third party industry sources and publications. Nothing in the data or information used or derived from third party sources should be construed as advice. Some data and other information are also based on our good faith estimates, which are derived from our review of internal surveys and independent sources. We believe that these external sources and estimates are reliable, but have not independently verified them. Statements as to our market position are based on market data currently available to us. Although we are not aware of any misstatements regarding the economic, employment, industry and other market data presented herein, these estimates involve inherent risks and uncertainties and are based on assumptions that are subject to change.
IMPLICATIONS OF BEING AN EMERGING GROWTH COMPANY
As a company with less than $1.07 billion in revenue during our last fiscal year, we qualify as an "emerging growth company" under the Jumpstart Our Business Startups Act of 2012 (the "JOBS Act"). An emerging growth company may take advantage of reduced reporting requirements and is relieved of certain other significant requirements that are otherwise generally applicable to public companies. As an emerging growth company:
- •
- we may present as few as two years of audited financial statements and two years of related management discussion and analysis of financial
condition and results of operations;
- •
- we are exempt from the requirement to obtain an attestation and report from our auditors on management's assessment of our internal control
over financial reporting under the Sarbanes-Oxley Act of 2002;
- •
- we are permitted to provide less extensive disclosure about our executive compensation arrangements; and
- •
- we are not required to give our shareholders non-binding advisory votes on executive compensation or golden parachute arrangements.
ii
In this prospectus we have elected to take advantage of the reduced disclosure requirements relating to executive compensation and the number of years of financial information presented, and in the future we may take advantage of any or all of these exemptions for so long as we remain an emerging growth company. We will remain an emerging growth company until the earliest of (i) the end of the fiscal year during which we have total annual gross revenues of $1.07 billion or more, (ii) the end of the fiscal year following the fifth anniversary of the completion of this offering, (iii) the date on which we have, during the previous three-year period, issued more than $1.07 billion in non-convertible debt and (iv) the date on which we are deemed to be a "large accelerated filer" under the Securities Exchange Act of 1934, as amended (the "Exchange Act").
In addition to the relief described above, the JOBS Act permits us an extended transition period for complying with new or revised accounting standards affecting public companies. We intend to take advantage of this extended transition period.
iii
This summary highlights selected information contained elsewhere in this prospectus and may not contain all of the information that you should consider before investing in our common stock. Before making an investment decision you should carefully read the entire prospectus, including the sections entitled "Risk Factors" and "Management's Discussion and Analysis of Financial Condition and Results of Operations," together with our consolidated financial statements and the related notes that are included herein.
Our Company Overview
We are a diversified bank holding company headquartered in Carmel, Indiana and registered under the Bank Holding Company Act of 1956, as amended. We currently operate multiple lines of business with a focus on Federal Housing Administration ("FHA") multi-family housing and healthcare facility financing and servicing, mortgage warehouse financing, retail and correspondent residential mortgage banking, agricultural lending and traditional community banking. As of June 30, 2017, we had $3.1 billion in assets, $2.8 billion of deposits and $226.5 million of shareholders' equity.
We were founded in 1990 as a mortgage banking company, providing financing for multi-family housing and senior living properties. The shared vision of our founders, Michael Petrie and Randall Rogers, was to create a diversified financial services company, which efficiently operates both nationally through mortgage banking and related services and locally through a community bank. We have grown both organically and through acquisitions focused on expanding our services. We have strategically built our business in a way that we believe offers insulation from cyclical economic and credit swings and may provide us with synergies across our lines of business.
Experienced Board and Management Team
Our founders, Michael Petrie and Randall Rogers, each have over 38 years of industry experience. Prior to founding Merchants, Mr. Petrie and Mr. Rogers worked together as Merchants Mortgage Corporation, a company founded by Mr. Rogers, with Mr. Rogers as Chief Executive Officer and Mr. Petrie as Executive Vice President.
In addition to our founders, the other members of our executive management team collectively have, on average, over 27 years of industry experience, each with a diverse and complementary background that is an integral part of our success. Michael Dunlap, the President and Co-Chief Operating Officer of Merchants Bank, has primarily been responsible for establishing our warehouse lending platform and Merchants Mortgage, and previously served in senior management and financial roles for several mortgage companies, including as Chief Financial Officer of National City Mortgage. John Macke, our Chief Financial Officer, previously served as Executive Vice President of Capital Markets and as Chief Financial Officer of Stonegate Mortgage Corporation. Scott Evans, President of Merchants Bank's Lynn Market and Co-Chief Operating Officer, has extensive experience in community banking, including as Vice President of The Farmers State Bank for over 10 years, and is primarily responsible for our Banking segment, including our agriculture lending activities. Michael Dury, the Executive Vice President and Chief Operating Officer of P/RMIC, oversees P/RMIC's strategy and business development for multi-family and healthcare financing activities and since 2010 has originated over $3 billion of multi-family loan volume. For more information on our executive management team, see the "Management" section below in this prospectus. The below table provides a
1
summary of our executive management team and reflects each member's respective current ownership of our common stock as of October 12, 2017.
Name
|
Title | Age | Years in Financial Services |
Years with the Company |
Ownership | ||||||||||
|---|---|---|---|---|---|---|---|---|---|---|---|---|---|---|---|
Michael F. Petrie |
Chairman and Chief Executive Officer of Merchants and Merchants Bank | 63 | 38 | 27 | 46.53 | %(1) | |||||||||
Randall D. Rogers |
President and Chief Operating Officer of Merchants, Vice Chairman of Merchants Bank |
71 |
48 |
27 |
44.84 |
%(2) |
|||||||||
Michael J. Dunlap |
President and Co-Chief Operating Officer of Merchants Bank |
51 |
25 |
8 |
* |
||||||||||
John F. Macke |
Chief Financial Officer of Merchants and Merchants Bank |
52 |
25 |
0 |
— |
||||||||||
Michael R. Dury |
Executive Vice President and Chief Operating Officer of P/RMIC |
32 |
10 |
10 |
* |
||||||||||
Scott A. Evans |
Lynn Market President and Co-Chief Operating Officer of Merchants Bank |
52 |
28 |
13 |
* |
||||||||||
Susan D. Kucer |
Indianapolis Market President of Merchants Bank |
62 |
35 |
2 |
— |
||||||||||
Jerry F. Koors |
President of Merchants Mortgage |
53 |
26 |
4 |
* |
||||||||||
Richard L. Belser |
Senior Vice President and Senior Credit Officer of Merchants Bank |
66 |
43 |
10 |
— |
||||||||||
Bill D. Buchanan |
Senior Vice President and Chief Accounting Officer of Merchants and Merchants Bank |
59 |
29 |
3 |
* |
||||||||||
Kevin T. Langford |
Senior Vice President and Chief Administrative Officer of Merchants Bank |
49 |
27 |
1 |
— |
||||||||||
| | | | | | | | | | | | | | | | |
TOTAL |
91.57 |
%(3) |
|||||||||||||
| | | | | | | | | | | | | | | | |
| | | | | | | | | | | | | | | | |
| | | | | | | | | | | | | | | | |
AVERAGE |
30.36 |
9.55 |
|||||||||||||
| | | | | | | | | | | | | | | | |
| | | | | | | | | | | | | | | | |
| | | | | | | | | | | | | | | | |
- *
- denotes
less than 1%
- (1)
- Includes
38.58% beneficially owned by Mr. Petrie's wife, Jody J. Petrie. See "Security Ownership of Certain Beneficial Owners and Management" for additional
information.
- (2)
- Includes
43.59% beneficially owned by Mr. Rogers' wife, Mary H. Rogers. See "Security Ownership of Certain Beneficial Owners and Management" for additional
information.
- (3)
- Includes 82.17% beneficially owned by Mr. Petrie's or Mr. Rogers' wives as described in (1) and (2) above.
Upon the closing of this offering, Messrs. Petrie and Rogers, together with their families, will hold approximately 73.97% of our outstanding common stock. Therefore, Messrs. Petrie and Rogers, together with their families, will have the ability to control the outcome of matters submitted to our shareholders for approval, including the election or removal of directors and the amendment of our articles of incorporation, along with approval of significant transactions. This control position may conflict with the interests of some or all of our other shareholders. In addition, Messrs. Petrie and Rogers, together with their families, own approximately 24.02% of our outstanding 8% Non-Cumulative, Perpetual Preferred Stock.
Our five non-executive directors are all successful business owners, professionals or senior executives with long-standing ties to their communities. The collective professional background of our
2
directors provides us with valuable insights into the business and banking needs of our customer base. After the completion of this offering, our five non-executive directors and their affiliated entities, collectively, are expected to own approximately 0.15% of our outstanding common stock.
Our Growth
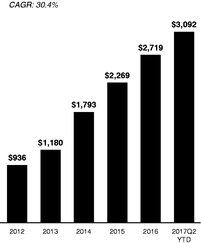
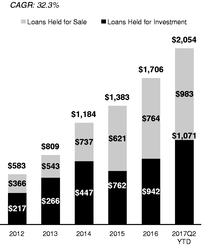
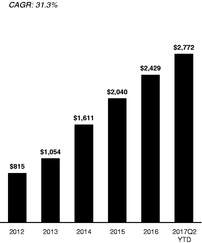
Since our acquisition of Merchants Bank (formerly known as Greensfork Township State Bank), with assets of $6.7 million in March 2002, we have achieved significant growth in many of our key financial performance categories. During this period, we have maintained an acute focus on building profitable and complementary business lines that provide for insulation from cyclical swings and create synergies within our lines of business that give us competitive advantages. Since December 31, 2012, we have seen significant growth in our total assets, total gross loans and total deposits. Between December 31, 2012 and June 30, 2017, our total assets have grown at a compound annual growth rate of 30.4%, from $936 million to $3.1 billion, and we increased total gross loans (including loans held for investment and loans held for sale) at a compound annual growth rate of 32.3%, from $583 million to $2.1 billion. We have funded our growth during this period, in large part, through a substantial increase in deposits, which we have increased from $815 million to $2.8 billion, a compound annual growth rate of 31.3%.
Our growth thus far is due primarily to the consistent production and efficiency of P/RMIC and the scalable growth of our warehouse lending line of business. P/RMIC has grown the unpaid principal balance of its servicing portfolio from $2.8 billion as of December 31, 2012 to $6.2 billion as of June 30, 2017, while our warehouse lending funded volumes have grown from $8.3 billion in 2012 to $24.8 billion in 2016. Over the same period of time we have experienced low levels of non-performing assets and charge-offs, driven principally by the nature of our lending business and our focus on originating assets with favorable risk profiles.
| Total Assets ($ in Millions) |
Total Gross Loans ($ in Millions) |
Total Deposits ($ in Millions) |
||
|
|
|
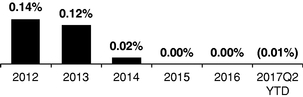
| Nonperforming Assets / Total Assets | Net Charge-offs / Average Loans | |
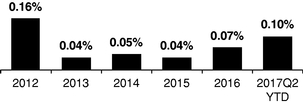
|
|
3
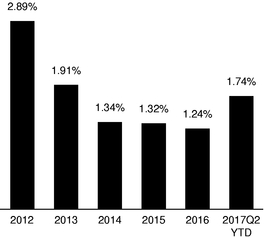
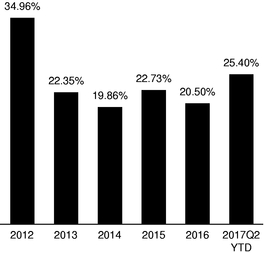
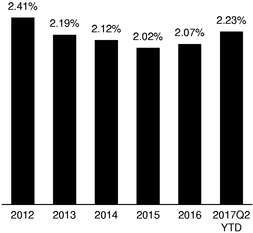
During every period since January 1, 2012, as shown in the chart below, we have maintained a return on average assets above 1.23%, a return on average tangible common equity over 19%, and an efficiency ratio under 33%. We were able to achieve these metrics despite historically earning a lower net interest rate margin than most banks, which is caused by originating low risk, shorter-term assets.
| Return on Average Assets(1) |
Return on Average Tangible Common Equity(1) |
|
|
|
| Efficiency Ratio | Net Interest Margin | |

|
|
- (1)
- In 2014, for federal income tax purposes, we converted from a Subchapter S corporation to a C corporation. The 2012 and 2013 performance metrics reflect adjustments to net income to enhance comparability with subsequent years. Specifically, for 2012 and 2013, we adjusted net income for pro-forma federal and state corporate income tax expenses to which we were subject following our conversion to a C corporation, using an assumed income tax rate of 40%. Net income also was adjusted for 2014 to reverse the charge we recorded for the conversion of deferred tax liabilities in connection with our conversion from a Subchapter S to C corporation. These pro-forma net income metrics are non-GAAP financial measures. Refer to "Non-GAAP Financial Measures" for additional discussion regarding pro-forma net income and a reconciliation of this metric to net income.
4
Our Corporate Structure
We have multiple lines of business and provide various banking and financial services through our subsidiaries as follows:
- •
- Multi-Family Rental Housing
- •
- Healthcare Financing
- •
- Servicing and Subservicing
P/R Mortgage & Investment Corp. (a subsidiary of Merchants Bank)
- •
- Multi-Family Rental Housing
RICHMAC Funding, LLC (a subsidiary of P/RMIC)
- •
- Warehouse Financing and Loan Participations
- •
- Commercial Lending
- •
- Retail Banking
- •
- SBA Small Business Loan Programs
- •
- Agricultural Lending
- •
- Merchants Mortgage
- •
- Single-Family Mortgage Lending
- •
- Correspondent Mortgage Banking
Merchants Bank of Indiana
- •
- Warehouse Financing and Loan Participations
Natty Mac Funding, Inc. (a subsidiary of Merchants Bank)
5
P/RMIC: Multi-Family Rental Housing, Healthcare Financing and Servicing
P/RMIC is primarily engaged in mortgage banking, specializing in originating and servicing loans for multi-family rental housing and healthcare facility financing, particularly for senior living properties.
P/RMIC originated $1.2 billion in loans during 2016 and $906 million during the six months ended June 30, 2017. P/RMIC primarily originates FHA loans that are sold as Government National Mortgage Association ("Ginnie Mae") mortgage backed securities within approximately 30 days. The loans are sold and the mortgage servicing rights are retained. Other originations include bridge and permanent financing that are referred to the Banking segment. These loans eventually become permanent FHA financings by P/RMIC. In addition to the $1.2 billion originated directly by P/RMIC, we also funded loans brought to us by non-affiliated entities. As of June 30, 2017, P/RMIC's servicing portfolio totaled $6.2 billion, which includes both owned and subserviced loans.
We generated approximately $22.6 and $23.0 million, or 41.9% and 27.9%, of net revenue (net interest income plus non-interest income) from our Multi-family Mortgage Banking segment for the six months ended June 30, 2017 and year ended December 31, 2016, respectively.
6
RICHMAC Funding, LLC
In August 2017, P/RMIC acquired RICHMAC Funding, LLC, a national multi-family housing mortgage lender, to complement and expand the products and services offered by P/RMIC.
MERCHANTS BANK
Warehouse Financing and Loan Participations
Merchants Bank started our warehouse lending business in 2009 as a result of dislocation in the market. Merchants Bank currently has warehouse lines of credit and loan participations with some of the largest non-depository financial institutions in the country. As of June 30, 2017, Merchants Bank and NMF had $1.2 billion in loans outstanding from warehouse lines for credit to single and multi-family lenders and loan participations. We generated approximately $17.7 and $35.3 million, or 32.9% and 42.8%, of net revenue (net interest income plus non-interest income) from our Mortgage Warehousing segment for the six months ended June 30, 2017 and year ended December 31, 2016, respectively.
Commercial Lending and Retail Banking
Merchants Bank operates under an Indiana charter and provides full banking services. Merchants Bank has five depository branches located in Carmel, Indianapolis and Lynn, Indiana. Merchants Bank holds loans in its portfolio comprised of multi-family construction and bridge loans referred by P/RMIC, owner occupied commercial real estate loans, commercial & industrial loans, agricultural loans, residential mortgage loans and consumer loans. Merchants Bank receives deposits from customers located primarily in Hamilton, Marion, Randolph and surrounding counties in Indiana and from the escrows generated by the servicing activities of P/RMIC.
SBA Lending
Merchants Bank participates in the Small Business Administration's ("SBA") 7(a) program in order to meet the needs of our small business community, and help diversify our retail revenue stream. We originate and service, as well as sell the guaranteed portion of these loans. As of June 30, 2017, Merchants Bank had originated $4.5 million in SBA 7(a) loans in Marion and Hamilton counties in Central Indiana since our participation in this program.
The SBA's 7(a) program provides up to a 75% guaranty for loans greater than $150,000. For loans $150,000 or less, the program provides up to an 85% guaranty. The maximum 7(a) loan amount is $5 million. The guaranty is conditional and covers a portion of the risk of payment default by the borrower, but not the risk of improper closing and servicing by the lender. As such, prudent underwriting and closing processes are essential to effective utilization of the 7(a) program. We typically sell in the secondary market the SBA-guaranteed portion (generally 75% of the principal balance) of the loans we originate.
Agricultural Lending
Merchants Bank has a division ("MBI-Lynn") located in Lynn, Randolph County, Indiana with its primary business function to provide agricultural loans within its designated Community Reinvestment Act ("CRA") area of Randolph and Wayne counties in Eastern Indiana and nearby Darke County, Ohio. Merchants Bank offers operating lines of credit for crop and livestock production, intermediate term financing to purchase equipment and breeding livestock and long-term financing to purchase agricultural real estate. As of June 30, 2017, of the $66.4 million of agricultural loans in our portfolio, including undisbursed funds of $4.3 million, 48.2% have a Farm Service Agency ("FSA") 90% guarantee. Merchants Bank is approved to sell agricultural loans in the secondary market through the
7
Federal Agricultural Mortgage Corporation ("Farmer Mac") and uses this relationship to manage interest rate risk within the agricultural loan portfolio. As of June 30, 2017, Merchants Bank sold agricultural loans with an aggregate principal balance of $13.5 million to Farmer Mac without recourse. Merchants Bank has written off less than $25 thousand in loan loss in its agricultural loan portfolio since December 31, 2004.
MERCHANTS MORTGAGE: Single Family Mortgage Lending, Correspondent Lending and Servicing
Merchants Mortgage is the branded arm and division of Merchants Bank that is a full service single-family mortgage origination and servicing platform started in February 2013. Merchants Mortgage is both a retail and correspondent mortgage lender. Merchants Mortgage offers agency eligible, jumbo fixed and hybrid adjustable rate mortgages for purchase or refinancing. Other products include construction, bridge and lot financing and home equity lines of credit ("HELOC"), including the All-in-One product, which links a customer's checking account balance to a first lien HELOC. Merchants Mortgage generates revenues from fees charged to borrowers, interest income during the warehouse period, and gain on sale of loan to investors. There are multiple investor outlets, including direct sale capability to Federal National Mortgage Association ("Fannie Mae"), Federal Home Loan Mortgage Corporation ("Freddie Mac"), Federal Home Loan Bank of Indianapolis (the "FHLBI"), and other third-party investors to allow Merchants Mortgage a best execution at sale. Merchants Mortgage also originates loans held for investment and earns interest income over the life of the loan.
NMF: Warehouse Financing and Loan Participations
Through NMF we engage in loan participations and warehouse financing with Home Point Financial Corporation ("Home Point") and its subsidiaries and correspondent customers. NMF was established as a wholly owned subsidiary of Merchants Bank in 2014. We entered into a Revolving Loan and Subordinated Loan Agreement whereby Home Point invested $30 million in our subordinated debt. In turn, we invested the proceeds into Merchants Bank and then to NMF. NMF provides $300 million of lending capacity to Home Point and its subsidiaries and correspondent customers. We earn net interest income and use Home Point custodial deposits to fund the loans.
MIDTOWN WEST
MBI Midtown owns land upon which we expect to build our new corporate headquarters building in Carmel, Indiana.
ASH REALTY
Ash Realty holds assets acquired through, or in lieu of, loan foreclosures. At June 30, 2017, there were no assets held in Ash Realty.
ARCLINE FINANCIAL, LLC
Merchants owns 30% of Arcline Financial, LLC ("Arcline") and is accounted for using the equity method of accounting. Arcline processes warehouse and correspondent lending transactions, including on behalf of Merchants Bank.
Our Strategic Plan
Our strategic plan focuses on continuing to grow complementary business lines that will provide a diverse and stable revenue platform and create a balance between interest and non-interest income. Our strategic plan reflects our belief that our mortgage business and community banking structure
8
complement one another by creating important operational and revenue synergies. Our strategic plan includes five initiatives:
- •
- maintain and grow complementary and diversified business lines;
- •
- develop deep customer relationships;
- •
- execute prudent acquisitions in strategic areas;
- •
- hire experienced and talented personnel while developing talented personnel from within our organization; and
- •
- maintain a low risk profile through strong enterprise-wide risk management.
We have achieved our recent growth through focused and sustained execution of these initiatives, and we believe that we have an experienced management team in place that will allow us to continue this success.
Our Competitive Strengths
We believe our competitive strengths set us apart from many similarly sized community banks and mortgage banking companies, and include the following key attributes:
Diversified business lines within our mortgage banking business. Our primary business lines within our mortgage banking business are complementary and provide a diverse and stable source of revenue. Our subsidiaries and divisions are integrated and offer opportunities for operational and revenue synergies. For example, Merchants Bank provides short-term lending support for P/RMIC originations in the form of bridge or construction financing. P/RMIC, in turn, deposits custodial escrow servicing accounts at Merchants Bank, which can be invested in securities and pledged to the FHLBI for additional funding capacity. Although we are exposed to the systemic risk in the mortgage market and the economy as a whole, our performance is not directly correlated with mortgage origination volumes. For example, for the year ended December 31, 2016, our mortgage warehouse lending funding volumes increased by 23%, while the mortgage market as a whole increased by 13%. In addition, for the six months ended June 30, 2017 our mortgage warehouse lending volumes increased 4.3% compared to the six months ended June 30, 2016, while the mortgage market as a whole decreased by 4.2% (based on market volumes from Mortgage Bankers Association of America). We largely attribute our ability to succeed under various market conditions to our low efficiency ratio, which is mainly a result of our variable cost operating model, and our balanced presence in single and multi-family finance. In rising rate environments, single family mortgage origination volumes may fall, however this should be offset through increased net interest margin. Additionally, as market interest rates rise, originations for multi-family housing may decrease, but the value of our servicing asset increases due to a lesser expectation of prepayment. In falling rate environments, we may expect to see increased gain on sale income from purchase and refinance originations in both the single and multi-family mortgage markets to offset a potential decrease in the value of our servicing asset due to higher prepayments. Thus, Merchants Mortgage's position in the single-family and P/RMIC's position in multi-family housing sector offers us an alternative against variability in the mortgage industry.
Stable source of non-interest income reduces risks associated with changes in interest rates. Just as we strive to have diversification within our business lines, we also strive to maintain a complementary and diversified revenue model. We believe that this balanced revenue stream approach can help minimize volatility in our earnings through various economic and interest rate cycles. As a result, we do not have an undue reliance on one source of income, such as net interest income, which can be materially affected by changes in interest rates, or non-interest income, which can be materially affected by reductions in mortgage volumes. Historically, P/RMIC earned fees and servicing income (non-interest income) that greatly outweighed the interest income earned by Merchants Bank. We recognize our
9
reliance on this revenue stream and have implemented strategies to augment the revenue. Since 2012, we have increased our portfolio of loans held for investment to balance our income and to reduce our reliance on a single source of income.
| |
For the Six Months Ended June 30, |
For the Year Ended December 31, | ||||||||||||||||||||
|---|---|---|---|---|---|---|---|---|---|---|---|---|---|---|---|---|---|---|---|---|---|---|
| (Dollars in thousands) |
2017 | 2016 | 2016 | 2015 | 2014 | 2013 | 2012 | |||||||||||||||
| |
(unaudited) |
|
|
|
|
|
||||||||||||||||
Net Interest Income |
$ | 29,255 | $ | 23,819 | $ | 53,971 | $ | 42,055 | $ | 30,630 | $ | 25,708 | $ | 20,710 | ||||||||
Non-Interest Income |
24,717 | 9,951 | 28,504 | 27,008 | 20,263 | 27,284 | 36,121 | |||||||||||||||
| | | | | | | | | | | | | | | | | | | | | | | |
Revenue |
$ | 53,972 | $ | 33,770 | $ | 82,475 | $ | 69,063 | $ | 50,893 | $ | 52,992 | $ | 56,831 | ||||||||
| | | | | | | | | | | | | | | | | | | | | | | |
| | | | | | | | | | | | | | | | | | | | | | | |
| | | | | | | | | | | | | | | | | | | | | | | |
Net Interest Income / Revenue |
54 | % | 71 | % | 65 | % | 61 | % | 60 | % | 49 | % | 36 | % | ||||||||
Non-Interest Income / Revenue |
46 | % | 29 | % | 35 | % | 39 | % | 40 | % | 51 | % | 64 | % | ||||||||
Low cost and stable source of funds. Merchants Bank funds its loans, including its participation agreements and warehouse lines of credit, using funds generated primarily from mortgage related custodial deposits. Merchants Bank's cost of total deposits was 0.70% for the six months ended June 30, 2017 and its total cost of funds was 0.98% for the six months ended June 30, 2017. Custodial funds come from Merchants Bank's non-depository financial institution clients, such as servicing related escrow deposits for insurance and property taxes. These deposits are stable because the sources of the deposits have significant borrowing relationships with Merchants Bank that it expects will continue. Merchants Bank may elect not to participate or fund loans in the event these customers decide to remove the deposits, thus we can better manage our assets with our liabilities. Merchants Bank also uses brokered deposits as a source of funding to make up for any funding gap with warehouse volumes or timing of mortgage custodial remittances. These deposits are short term and typically have maturities of up to three months to match the temporarily higher volumes in warehouse volumes and custodial remittances. Further, in the event Merchants Bank's deposits were insufficient to meet its customers' borrowing needs, Merchants Bank has available liquidity through cash reserves and available borrowing capacity of $386.4 million through the FHLBI as of June 30, 2017.
Sophisticated risk management platform. Our largest source of interest income is Merchants Bank's warehouse financing business, which we have structured to minimize risk. Merchants Bank underwrites mortgage companies ("lenders") prior to entering into a warehouse lending agreement. Merchants Bank uses two different arrangements to fund agency eligible, government insured or guaranteed, or jumbo residential mortgage loans secured by mortgages placed on existing one-to-four family dwellings. The majority of our loans are funded under a participation agreement whereby Merchants Bank elects to purchase a participation interest of up to 100% in individual loans and shares proportionately in the interest income until the loan is sold in the secondary market. Merchants Bank also will fund loans under a warehouse line of credit as a secured financing. The warehouse arrangement is secured by a combination of the funded mortgage loans, cash deposits and personal guarantees of the originating lender, and Merchants Bank's initial disbursement of less than 100% of the loan amount. Merchants Bank's risk mitigation procedures include possession of collateral until the loan is sold and Merchants Bank directly receives the proceeds from the secondary market investor. In addition, prior to funding Merchants Bank reviews each loan to confirm its agency eligibility status and uses vendors to further validate loans as well as to hold the collateral securing the loan. Loans typically are sold by lenders to a third-party investor within approximately 20 days of funding, allowing Merchants Bank to minimize its risk that a loan will default prior to sale. The lenders sell most of these loans individually or through government sponsored entities ("GSEs") (i.e., Fannie Mae, Freddie Mac, and Ginnie Mae) mortgage backed securities programs to large financial institutions or to GSEs, as the end investors. This relatively short turnover time is also part of what keeps our balance sheet assets repricing to the current rate environment and helps us manage interest rate risk, as discussed below.
10
Minimizing interest rate exposure. We believe that we appropriately minimize the potential for risk in our investment and loan portfolios, including risks associated with an increase in interest rates given the structure and composition of these portfolios. Our securities portfolio consists primarily of callable, government-backed securities with maturities of two years or less, all of which are available for sale. Our loan portfolio is comprised predominantly of variable interest rates or short maturities, which allows the interest rates to change with the market. As of June 30, 2017, 78.7% of Merchants Bank's assets reprice in less than 90 days. In our multi-family financing business, the vast majority of loans are sold into the secondary market with P/RMIC retaining servicing rights. P/RMIC also avoids "locking in" interest rates significantly in advance of loan closings, which further minimizes interest rate risk prior to closing of the loans.
Innovative mortgage warehouse lending platform. We believe that Merchants Bank has an innovative warehouse lending platform that may be considered an industry leader. We have the capability to fully fund electronic mortgages through our E-Note program, one of only seven lenders in the country approved by Freddie Mac to offer this solution. We are highly responsive to our customers' needs by offering mortgage servicing rights ("MSRs") and operating lines of credit selectively to warehouse lending customers. The lines of credit secured by MSR's lead to the potential for additional deposits as the customer increases its servicing portfolio. In addition, customer service is especially important in the warehouse lending business because customers need to be able to rely, with confidence, on a readily accessible, stable source of funds given the timing realities of meeting and honoring mortgage loan closings or purchases. We believe that our mortgage banking expertise and experience, size and low overhead costs permit us to be responsive to customers on a level that many larger banks are unable to match. These factors contribute to Merchants Bank providing warehouse facilities to some of the leading non-depository institutions in the country.
Recent Acquisition
RICHMAC Funding, LLC. We entered into a Member Interests Purchase Agreement dated June 26, 2017, to acquire 100% of the equity interests of RICHMAC Funding, LLC, a Delaware limited liability company. We closed the acquisition on August 15, 2017, and issued 383,271 shares of our common stock in exchange for 100% of the equity interests of RICHMAC. The acquisition is expected to allow P/RMIC through RICHMAC to operate as a Fannie Mae Affordable Lender and a Freddie Mac Targeted Affordable Housing (TAH) Seller/Servicer. In addition, we acquired a Fannie Mae and Freddie Mac servicing portfolio as part of the transaction. The acquisition is expected to provide additional product offerings, such as the Freddie Mac Bridge to Resyndication and the Fannie Mae Tax Exempt Bond Credit Enhancement, to current customers as well as broaden the origination network into attractive markets where we do not currently have a presence. RICHMAC currently operates principally in Minneapolis, Minnesota and New York, New York.
Pending Acquisition
Joy State Bank. On October 31, 2016, we entered into an Agreement and Plan of Merger to acquire Joy State Bank, an Illinois chartered bank located in Joy, Illinois. Since the timing and approval of the transaction was uncertain due to our capital position at September 30, 2016, on December 22, 2016 the Agreement and Plan of Merger was amended and the parties agreed that Michael Petrie and Randall Rogers, two of our directors and executive officers, would acquire Joy State Bank. The acquisition of Joy State Bank by Messrs. Petrie and Rogers received appropriate regulatory approvals and closed on April 3, 2017. On May 8, 2017, we entered into a Stock Purchase Agreement with Messrs. Petrie and Rogers to acquire Joy State Bank. The acquisition is expected to provide access to the Mortgage Partnership Finance (MPF) Program, an attractive program offered through the Federal Home Loan Bank of Chicago which Merchants Bank, as an Indiana chartered state bank, cannot access. We have agreed to pay a purchase price of approximately $5.4 million plus $16,403 for
11
each 30 days after June 30, 2017, prorated to the closing date. The purchase price is equal to the price paid by Messrs. Petrie and Rogers, plus expenses and a cost of funds equal to 3.75%. The acquisition has been approved by the Federal Reserve Bank of Chicago, but remains subject to the approval of the Illinois Department of Financial and Professional Regulation, Division of Banking. We expect to close this acquisition in the first quarter of 2018.
2017 Third Quarter Update
We are currently in the process of preparing our consolidated financial results for the third quarter ended September 30, 2017 and, therefore, our actual results for that period are not yet available and are subject to change. However, based on our expectations, our 2017 third quarter net income will increase over our 2017 first quarter net income of $9.1 million but will be less than our 2017 second quarter net income of $14.8 million. Investors should look at our financial results on an annual basis and not necessarily on a quarterly basis. Our quarterly results tend to exhibit some level of variability, particularly related to non-interest income. Various factors impact our non-interest income resulting in net income being higher or lower from quarter-to-quarter. Our pro-forma return on average assets and pro-forma return on average tangible common equity have ranged from 1.24% to 2.89% and 19.86% to 34.96%, from 2012 through the latest twelve months ended June 30, 2017, respectively, see "Summary Historical Consolidated Data" and "Selected Historical Consolidated Data."
Risks Relating to Our Company
Our ability to implement our strategic plan and the success of our business are subject to numerous risks and uncertainties, which are discussed in the section titled "Risk Factors," beginning on page 17, and include, but are not limited to, the following:
- •
- decreased residential and multi-family mortgage origination, volume and pricing decisions of competitors, and changes in interest rates, may
adversely affect our profitability;
- •
- our mortgage banking profitability could significantly decline if we are not able to originate and resell a high volume of mortgage loans;
- •
- fluctuations in interest rates may reduce net interest income and otherwise negatively impact our financial condition and results of
operations;
- •
- because a significant portion of our loan portfolio is comprised of real estate loans, negative changes in the economy affecting real estate
values and liquidity could impair the value of collateral securing our real estate loans and result in loan and other losses; and
- •
- liquidity risks could affect operations and jeopardize our business, financial condition, and results of operations.
Corporate Information
Our principal executive offices are located at 11555 North Meridian Street, Suite 400, Carmel, Indiana 46032, and our telephone number at that address is (317) 569-7420. Our website address is www.merchantsbankofindiana.com. The information contained on our website is not a part of, or incorporated by reference into, this prospectus.
12
Common stock offered by us |
5,555,555 shares | |
Underwriters' option to purchase additional shares of our common stock |
833,333 shares |
|
Common stock outstanding after completion of this offering |
27,053,222 shares (or 27,886,555 shares if the underwriters exercise in full their option to purchase additional shares of our common stock). |
|
Use of proceeds |
Assuming an initial public offering price of $18.00 per share, which is the midpoint of the offering price range set forth on the cover page of this prospectus, the net proceeds to us from this offering, after deducting underwriting discounts and estimated offering expenses, will be approximately $92.2 million (or approximately $106.3 million if the underwriters exercise their option to purchase additional shares in full). We intend to contribute $86.4 million of the net proceeds that we receive from this offering to Merchants Bank to support balance sheet growth, and to use the remainder for general corporate purposes, which could include future acquisitions and other growth initiatives. We also intend to use approximately $5.8 million to complete the pending acquisition of Joy State Bank. See "Use of Proceeds" and "Business—Pending Acquisition—Joy State Bank." |
|
Dividends |
It has been our policy to pay quarterly dividends to holders of our common stock, and we intend to generally maintain our current dividend levels. Our dividend policy and practice may change in the future, however, and our board of directors may change or eliminate the payment of future dividends at its discretion, without notice to our shareholders. Any future determination to pay dividends to holders of our common stock will depend on our results of operations, financial condition, capital requirements, banking regulations, payment of dividends on our preferred stock, contractual restrictions and any other factors that our board of directors may deem relevant. See "Dividend Policy." |
|
Nasdaq listing |
We have applied to list our common stock on the Nasdaq Capital Market under the trading symbol "MBIN." |
|
Risk factors |
Investing in shares of our common stock involves a high degree of risk. See "Risk Factors" beginning on page 17 for a discussion of certain factors you should consider carefully before deciding to invest. |
13
Directed Share Program |
At our request, the underwriters have reserved for sale, at the initial public offering price, up to 277,777 shares of the common stock being offered by this prospectus, to our directors, officers, employees and other individuals that have a business relationship with us, including current shareholders and customers, and their family members who have expressed an interest in purchasing our common stock in this offering. See "Underwriting." |
Unless otherwise indicated, all information in this prospectus relating to the number of shares of common stock to be outstanding immediately after the completion of this offering is based on 21,497,667 shares outstanding as of October 12, 2017, as adjusted for the 2.5 for 1 stock split that was effective July 6, 2017, and:
- •
- excludes 17,910 shares of unvested restricted stock (as adjusted for the 2.5 for 1 stock split that was effective July 6, 2017); and
- •
- excludes 1,500,000 shares of common stock available for future awards under our 2017 Equity Incentive Plan.
Except as otherwise indicated, all information in this prospectus:
- •
- assumes an initial public offering of $18.00 per share, which is the midpoint of the price range set forth on the cover page of this
prospectus;
- •
- assumes no exercise by the underwriters of their option to purchase additional shares of our common stock; and
- •
- assumes that all shares reserved under the Directed Share Program are purchased.
14
SUMMARY HISTORICAL CONSOLIDATED FINANCIAL DATA
The following table sets forth our summary historical consolidated financial data as of the dates and for the periods shown. The summary balance sheet data as of December 31, 2016 and 2015 and the summary income statement data for the years ended December 31, 2016 and 2015 have been derived from our audited consolidated financial statements included elsewhere in this prospectus. We have derived the summary historical consolidated financial data as of and for the years ended December 31, 2014, 2013 and 2012 from our audited financial statements not included in this prospectus. The summary consolidated financial data as of June 30, 2017 and for the six months ended June 30, 2017 and 2016 is derived from our unaudited interim consolidated financial statements included elsewhere in this prospectus and includes all normal and recurring adjustments that we consider necessary for a fair presentation. Operating results for the six months ended June 30, 2017 are not necessarily indicative of the results that may be expected for the year ending December 31, 2017.
You should read the following financial data in conjunction with the other information contained in this prospectus, including "Selected Historical Consolidated Financial Data," "Management's Discussion and Analysis of Financial Condition and Results of Operations" and in the consolidated financial statements and related notes included elsewhere in this prospectus.
| |
At or for the Six Months Ended June 30, |
At or for the Year Ended December 31, | |
||||||||||||||||||||
|---|---|---|---|---|---|---|---|---|---|---|---|---|---|---|---|---|---|---|---|---|---|---|---|
| (Dollars in thousands, except per share data) |
2017 | 2016 | 2016 | 2015 | 2014 | 2013 | 2012 | |
|||||||||||||||
| |
(unaudited) |
|
|
|
|
|
|
||||||||||||||||
Balance Sheet Data |
|||||||||||||||||||||||
Total Assets |
$ | 3,091,500 | $ | 2,506,974 | $ | 2,718,512 | $ | 2,269,442 | $ | 1,793,008 | $ | 1,179,791 | $ | 936,172 | |||||||||
Loans held for investment |
1,070,866 | 872,292 | 941,796 | 762,212 | 447,614 | 266,092 | 217,073 | ||||||||||||||||
Allowance for loan losses |
(6,865 | ) | (5,902 | ) | (6,250 | ) | (5,422 | ) | (4,458 | ) | (3,295 | ) | (2,854 | ) | |||||||||
Loans held for sale |
983,420 | 818,404 | 764,503 | 620,583 | 736,667 | 542,571 | 365,444 | ||||||||||||||||
Deposits |
2,771,501 | 2,247,621 | 2,428,621 | 2,039,520 | 1,610,719 | 1,054,304 | 815,418 | ||||||||||||||||
Total liabilities |
2,864,987 | 2,329,701 | 2,512,224 | 2,121,242 | 1,682,872 | 1,060,976 | 841,864 | ||||||||||||||||
Total shareholder's equity |
226,513 | 177,273 | 206,288 | 148,200 | 110,137 | 118,814 | 94,308 | ||||||||||||||||
Tangible common equity |
184,409 | 148,226 | 164,184 | 137,677 | 109,614 | 118,291 | 93,785 | ||||||||||||||||
Income Statement Data |
|
||||||||||||||||||||||
Interest Income |
$ | 41,471 | $ | 32,421 | $ | 72,939 | $ | 56,345 | $ | 39,554 | $ | 31,659 | $ | 25,764 | |||||||||
Interest Expense |
12,216 | 8,602 | 18,968 | 14,290 | 8,924 | 5,951 | 5,054 | ||||||||||||||||
| | | | | | | | | | | | | | | | | | | | | | | | |
Net interest income |
29,255 | 23,819 | 53,971 | 42,055 | 30,630 | 25,708 | 20,710 | ||||||||||||||||
Provision for loan losses |
480 | 480 | 960 | 960 | 1,215 | 720 | 1,270 | ||||||||||||||||
Noninterest income |
24,717 | 9,951 | 28,504 | 27,008 | 20,263 | 27,284 | 36,121 | ||||||||||||||||
Noninterest expense |
14,902 | 12,163 | 26,720 | 20,922 | 15,796 | 13,328 | 12,504 | ||||||||||||||||
| | | | | | | | | | | | | | | | | | | | | | | | |
Income before taxes |
38,590 | 21,127 | 54,795 | 47,181 | 33,882 | 38,944 | 43,057 | ||||||||||||||||
Provision for income taxes |
14,702 | 8,353 | 21,668 | 18,798 | 30,079 | — | — | ||||||||||||||||
| | | | | | | | | | | | | | | | | | | | | | | | |
Net income, as previously reported |
23,888 | 12,774 | 33,127 | 28,383 | 3,803 | 38,944 | 43,057 | ||||||||||||||||
Non-GAAP Reconciliation: |
|||||||||||||||||||||||
Pro-forma adjustments: |
|||||||||||||||||||||||
Add back of tax effect of S Corp to C Corp conversion |
— | — | — | — | 16,431 | (1) | — | — | |||||||||||||||
Less provision for income taxes |
— | — | — | — | — | 15,578 | (2) | 17,223 | (2) | ||||||||||||||
| | | | | | | | | | | | | | | | | | | | | | | | |
Pro-forma net income |
23,888 | 12,774 | 33,127 | 28,383 | 20,234 | 23,366 | 25,834 | ||||||||||||||||
Preferred stock dividends |
1,665 | 407 | 2,002 | — | — | — | — | ||||||||||||||||
| | | | | | | | | | | | | | | | | | | | | | | | |
Pro-forma net income available to common shareholders |
$ | 22,223 | $ | 12,367 | $ | 31,125 | $ | 28,383 | $ | 20,234 | $ | 23,366 | $ | 25,834 | |||||||||
| | | | | | | | | | | | | | | | | | | | | | | | |
| | | | | | | | | | | | | | | | | | | | | | | | |
| | | | | | | | | | | | | | | | | | | | | | | | |
Credit Quality Data |
|
||||||||||||||||||||||
Nonperforming loans |
$ | 3,219 | $ | 2,195 | $ | 1,887 | $ | 887 | $ | 815 | $ | 490 | $ | 1,451 | |||||||||
15
| |
At or for the Six Months Ended June 30, |
At or for the Year Ended December 31, | |
||||||||||||||||||||
|---|---|---|---|---|---|---|---|---|---|---|---|---|---|---|---|---|---|---|---|---|---|---|---|
| (Dollars in thousands, except per share data) |
2017 | 2016 | 2016 | 2015 | 2014 | 2013 | 2012 | |
|||||||||||||||
| |
(unaudited) |
|
|
|
|
|
|
||||||||||||||||
Nonperforming loans to total loans |
0.30 | % | 0.25 | % | 0.20 | % | 0.12 | % | 0.18 | % | 0.18 | % | 0.67 | % | |||||||||
Nonperforming assets |
$ | 3,219 | $ | 2,195 | $ | 1,887 | $ | 887 | $ | 815 | $ | 490 | $ | 1,451 | |||||||||
Nonperforming assets to total assets |
0.10 | % | 0.09 | % | 0.07 | % | 0.04 | % | 0.05 | % | 0.04 | % | 0.16 | % | |||||||||
Allowance for loan losses to total loans |
0.64 | % | 0.68 | % | 0.66 | % | 0.71 | % | 1.00 | % | 1.24 | % | 1.31 | % | |||||||||
Allowance for loan losses to nonperforming loans |
213.26 | % | 268.88 | % | 331.21 | % | 611.27 | % | 546.99 | % | 672.45 | % | 196.69 | % | |||||||||
Net charge-offs/(recoveries) to average loans |
(0.01 | )% | — | — | — | 0.02 | % | 0.12 | % | 0.14 | % | ||||||||||||
Per Share Data (Common Stock) |
|
||||||||||||||||||||||
Basic and diluted earnings per share |
|||||||||||||||||||||||
As reported |
$ | 1.05 | $ | 0.59 | $ | 1.47 | $ | 1.35 | $ | 0.19 | $ | 1.95 | $ | 2.15 | |||||||||
Pro-forma |
$ | 1.05 | $ | 0.59 | $ | 1.47 | $ | 1.35 | $ | 1.01 | (3) | $ | 1.17 | (3) | $ | 1.29 | (3) | ||||||
Dividends declared |
$ | 0.10 | $ | 0.10 | $ | 0.20 | $ | 0.20 | $ | 0.95 | $ | 0.72 | $ | 0.44 | |||||||||
Book value |
|||||||||||||||||||||||
As reported |
$ | 8.76 | $ | 7.05 | $ | 7.80 | $ | 6.55 | $ | 5.32 | $ | 5.94 | $ | 4.72 | |||||||||
Pro-forma |
$ | 8.76 | $ | 7.05 | $ | 7.80 | $ | 6.55 | $ | 6.11 | (4) | $ | 5.16 | (5) | $ | 3.85 | (5) | ||||||
Tangible book value |
|||||||||||||||||||||||
As reported |
$ | 8.73 | $ | 7.02 | $ | 7.78 | $ | 6.52 | $ | 5.29 | $ | 5.92 | $ | 4.69 | |||||||||
Pro-forma |
$ | 8.73 | $ | 7.02 | $ | 7.78 | $ | 6.52 | $ | 6.09 | (4) | $ | 5.14 | (5) | $ | 3.83 | (5) | ||||||
Weighted average shares outstanding |
|||||||||||||||||||||||
Basic |
21,114,400 | 21,111,200 | 21,111,208 | 21,075,475 | 20,017,400 | 20,000,000 | 20,000,000 | ||||||||||||||||
Diluted |
21,119,411 | 21,112,283 | 21,113,435 | 21,075,475 | 20,017,400 | 20,000,000 | 20,000,000 | ||||||||||||||||
Shares outstanding at period end |
21,114,400 | 21,111,200 | 21,111,200 | 21,111,200 | 20,703,700 | 20,000,000 | 20,000,000 | ||||||||||||||||
Performance Metrics |
|
||||||||||||||||||||||
Return on average assets |
|||||||||||||||||||||||
As reported |
1.74 | % | 1.05 | % | 1.24 | % | 1.32 | % | 0.25 | % | 3.18 | % | 4.81 | % | |||||||||
Pro-forma |
1.74 | % | 1.05 | % | 1.24 | % | 1.32 | % | 1.34% | (4) | 1.91% | (5) | 2.89% | (5) | |||||||||
Return on average equity |
|||||||||||||||||||||||
As reported |
22.00 | % | 16.52 | % | 18.68 | % | 22.62 | % | 3.71 | % | 37.07 | % | 57.86 | % | |||||||||
Pro-forma |
22.00 | % | 16.52 | % | 18.68 | % | 22.62 | % | 19.76% | (4) | 22.24% | (5) | 34.71% | (5) | |||||||||
Return on average tangible common equity |
|||||||||||||||||||||||
As reported |
25.40 | % | 17.18 | % | 20.50 | % | 22.73 | % | 3.73 | % | 37.25 | % | 58.27 | % | |||||||||
Pro-forma |
25.40 | % | 17.18 | % | 20.50 | % | 22.73 | % | 19.86% | (4) | 22.35% | (5) | 34.96% | (5) | |||||||||
Net interest margin |
2.23 | % | 2.03 | % | 2.07 | % | 2.02 | % | 2.12 | % | 2.19 | % | 2.41 | % | |||||||||
Efficiency ratio |
27.61 | % | 36.02 | % | 32.40 | % | 30.29 | % | 31.04 | % | 25.15 | % | 22.00 | % | |||||||||
Loans and loans held for sale to deposits |
74.12 | % | 75.22 | % | 70.26 | % | 67.80 | % | 73.52 | % | 76.70 | % | 71.44 | % | |||||||||
Capital Ratios—Merchants Bancorp |
|
||||||||||||||||||||||
Tangible common equity to tangible assets |
6.0 | % | 5.9 | % | 6.0 | % | 6.1 | % | 6.1 | % | 10.0 | 10.0 | |||||||||||
Common equity Tier 1 capital to risk-weighted assets |
7.4 | % | 7.4 | % | 8.1 | % | 8.5 | % | N/A | N/A | N/A | ||||||||||||
Tier 1 leverage ratio |
7.4 | % | 6.5 | % | 6.6 | % | 6.1 | % | 6.1 | % | 8.4 | % | 8.0 | % | |||||||||
Tier 1 capital to risk weighted assets |
9.3 | % | 8.9 | % | 10.3 | % | 9.2 | % | 7.7 | % | 11.9 | % | 18.0 | % | |||||||||
Total capital to risk-weighted assets |
9.6 | % | 9.2 | % | 10.6 | % | 9.6 | % | 8.1 | % | 12.2 | % | 18.0 | % | |||||||||
Regulatory Capital Ratios—Merchants Bank Only |
|
||||||||||||||||||||||
Tier 1 common capital to risk-weighted assets |
11.7 | % | 12.0 | % | 13.2 | % | 12.9 | % | N/A | — | — | ||||||||||||
Tier 1 leverage ratio |
9.3 | % | 8.7 | % | 8.4 | % | 8.5 | % | 8.7 | % | 8.4 | % | 8.0 | % | |||||||||
Tier 1 capital to risk-weighted assets |
11.7 | % | 12.0 | % | 13.2 | % | 12.9 | % | 11.0 | % | 11.9 | % | 18.0 | % | |||||||||
Total capital to risk-weighted assets |
12.0 | % | 12.4 | % | 13.5 | % | 13.3 | % | 11.3 | % | 12.2 | % | 18.0 | % | |||||||||
- (1)
- Represents
the recognition of deferred tax liabilities recorded upon conversion from a Subchapter S corporation to a regular C corporation.
- (2)
- Represents
the pro-forma effects of income taxes using a 40% income tax rate, as we were a Subchapter S corporation in years prior to 2014.
- (3)
- Represents
basic and diluted earnings per share calculated on pro-forma net income.
- (4)
- Represents
pro-forma performance metrics calculated on net income as adjusted for the effects of the deferred tax liabilities recorded in connection with the
conversion from Subchapter S to C corporation.
- (5)
- Represents pro-forma performance metrics calculated on net income as adjusted for the effects of income taxes included calculated using a 40% income tax rate for years previously reported as a Subchapter S corporation.
16
Investing in our common stock involves a high degree of risk. Before you decide to invest, you should carefully consider the risks described below, together with all other information included in this prospectus. Any of the following risks, as well as risks that we do not know or currently deem immaterial, could have a material adverse effect on our business, financial condition, results of operations and growth prospects. As a result, the trading price of our common stock could decline and you could experience a partial or complete loss of your investment. Further, to the extent that any of the information in this prospectus constitutes forward-looking statements, the risk factors below also are cautionary statements identifying important factors that could cause actual results to differ materially from those expressed in any forward-looking statements made by us or on our behalf. See "Cautionary Note Regarding Forward-Looking Statements" beginning on page 38.
Risks Related to Our Business
Decreased residential and multi-family mortgage origination, volume and pricing decisions of competitors, and changes in interest rates, may adversely affect our profitability.
We currently operate a residential and multi-family mortgage origination, warehouse financing, and servicing business. Changes in interest rates and pricing decisions by our loan competitors may adversely affect demand for our mortgage loan products, the revenue realized on the sale of loans, revenues received from servicing such loans and the valuation of our mortgage servicing rights.
Our mortgage banking profitability could significantly decline if we are not able to originate and resell a high volume of mortgage loans.
Mortgage production, especially refinancing activity, declines in rising interest rate environments. Interest rates have been historically low over the last few years and this environment likely will not continue indefinitely. Moreover, when interest rates increase further, there can be no assurance that our mortgage production will continue at current levels. Because we sell a substantial portion of the mortgage loans we originate and purchase, the profitability of our mortgage banking business also depends in large part on our ability to aggregate a high volume of loans and sell them at a gain in the secondary market. Thus, in addition to our dependence on the interest rate environment, we are dependent upon (i) the existence of an active secondary market and (ii) our ability to profitably sell loans or securities into that market. If our level of mortgage production declines, the profitability will depend upon our ability to reduce our costs commensurate with the reduction of revenue from our mortgage operations.
In addition, our ability to sell mortgage loans readily is dependent upon our ability to remain eligible for the programs offered by GSEs and other institutional and non-institutional investors. Any significant impairment of our eligibility with any of the GSEs could materially and adversely affect our operations. Further, the criteria for loans to be accepted under such programs may be changed from time to time by the sponsoring entity, which could result in a lower volume of corresponding loan originations. The profitability of participating in specific programs may vary depending on a number of factors, including our administrative costs of originating and purchasing qualifying loans and our costs of meeting such criteria.
The ability for us and our warehouse financing customers to originate and sell residential mortgage loans readily is dependent upon the availability of an active secondary market for single-family mortgage loans, which in turn depends in part upon the continuation of programs currently offered by GSEs and other institutional and non-institutional investors. These entities account for a substantial portion of the secondary market in residential mortgage loans. Because the largest participants in the secondary market are Fannie Mae and Freddie Mac, GSEs whose activities are governed by federal law, any future changes in laws that significantly affect the activity of these GSEs could, in turn,
17
adversely affect our operations. In September 2008, Fannie Mae and Freddie Mac were placed into conservatorship by the U.S. government. The federal government has for many years considered proposals to reform Fannie Mae and Freddie Mac, but the results of any such reform, and their impact on us, are difficult to predict. To date, no reform proposal has been enacted.
Fluctuations in interest rates may reduce net interest income and otherwise negatively impact our financial condition and results of operations.
Net interest income is the difference between the amounts received by us on our interest-earning assets and the interest paid by us on our interest-bearing liabilities. When interest rates rise, the rate of interest we pay on our liabilities, such as deposits, rises more quickly than the rate of interest that we receive on our interest-bearing assets, such as loans, which may cause our profits to decrease. The impact on earnings is more adverse when short-term interest rates increase more than long-term interest rates or when long-term interest rates decrease more than short-term interest rates, leading to similar yields between short-term and long-term rates. Many factors impact interest rates, including governmental monetary policies, inflation, recession, changes in unemployment, the money supply and international economic weaknesses and disorder and instability in domestic and foreign financial markets.
Interest rate increases often result in larger payment requirements for our borrowers, which increases the potential for default. At the same time, the marketability of the underlying property may be adversely affected by any reduced demand resulting from higher interest rates. In a declining interest rate environment, there may be an increase in prepayments on loans as borrowers refinance their mortgages and other indebtedness at lower rates.
Our mortgage servicing rights assets typically have a ten year call protection, but as interest rates decrease, the potential for prepayment increases and the fair market value of our mortgage servicing rights assets may decrease. Our ability to mitigate this decrease in value is largely dependent on our ability to be the refinancier and retain servicing rights. While we have previously been successful in our servicing retention, we may not be able to achieve the same level of retention in the future.
Changes in interest rates also can affect the value of loans, securities and other assets. An increase in interest rates that adversely affects the ability of borrowers to pay the principal or interest on loans may lead to an increase in nonperforming assets and a reduction of income recognized, which could have a material adverse effect on our results of operations and cash flows. Further, when we place a loan on nonaccrual status, we reverse any accrued but unpaid interest receivable, which decreases interest income. Subsequently, we continue to have a cost to fund the loan, which is reflected as interest expense, without any interest income to offset the associated funding expense. Thus, an increase in the amount of nonperforming assets would have an adverse impact on net interest income.
Rising interest rates will result in a decline in value of the fixed-rate debt securities we hold in our investment securities portfolio. The unrealized losses resulting from holding these securities would be recognized in other comprehensive income (loss) and reduce total shareholders' equity. Unrealized losses do not negatively impact our regulatory capital ratios; however, tangible common equity and the associated ratios would be reduced. If debt securities in an unrealized loss position are sold, such losses become realized and will reduce our regulatory capital ratios.
If short-term interest rates remain at their historically low levels for a prolonged period, and assuming longer term interest rates fall further, we could experience net interest margin compression as our interest earning assets would continue to reprice downward while our interest-bearing liability rates could fail to decline in tandem. This would have a material adverse effect on our net interest income and our results of operations.
18
Because a significant portion of our loan portfolio is comprised of real estate loans, negative changes in the economy affecting real estate values and liquidity could impair the value of collateral securing our real estate loans and result in loan and other losses.
At June 30, 2017, approximately 81.4% of our loan portfolio was comprised of loans with real estate as a primary or secondary component of collateral. As a result, adverse developments affecting real estate values in our market areas could increase the credit risk associated with our real estate loan portfolio. The market value of real estate can fluctuate significantly in a short period of time as a result of market conditions in the area in which the real estate is located. Adverse changes affecting real estate values and the liquidity of real estate in one or more of our markets could increase the credit risk associated with our loan portfolio, significantly impair the value of property pledged as collateral on loans and affect our ability to sell the collateral upon foreclosure without a loss or additional losses, which could result in losses that would adversely affect profitability. Such declines and losses would have a material adverse impact on our business, results of operations and growth prospects. In addition, if hazardous or toxic substances are found on properties pledged as collateral, the value of the real estate could be impaired. If we foreclose on and take title to such properties, we may be liable for remediation costs, as well as for personal injury and property damage. Environmental laws may require us to incur substantial expenses to address unknown liabilities and may materially reduce the affected property's value or limit our ability to use or sell the affected property.
Liquidity risks could affect operations and jeopardize our business, financial condition, and results of operations.
Liquidity is essential to our business. An inability to raise funds through deposits, borrowings, the sale of loans and/or investment securities and from other sources could have a substantial negative effect on our liquidity. A source of our funds consists of our customer deposits, including escrow deposits held in connection with our multi-family mortgage servicing business. These deposits are subject to potentially dramatic fluctuations in availability or price due to certain factors that may be outside of our control, such as a loss of confidence by customers in us or the banking sector generally, customer perceptions of our financial health and general reputation, increasing competitive pressures from other financial services firms for consumer or corporate customer deposits, changes in interest rates and returns on other investment classes. If customers move money out of bank deposits and into other investments, we could lose a relatively low cost source of funds, which would require us to seek wholesale funding alternatives in order to continue to grow, thereby increasing our funding costs and reducing our net interest income and net income.
As of June 30, 2017, $819.7 million, or 29.6% of our total deposits, were concentrated in three large mortgage non-depository financial institutions. These concentration levels expose us to the risk that one of these depositors will experience financial difficulties, withdraw its deposits, or otherwise lose the ability to generate custodial funds due to business or regulatory realities. However, two of these institutions also have warehouse funding arrangements, providing us the opportunity to mitigate this risk by electing not to participate or fund an institution's loans in the event such institution removes its deposits. Nonetheless, failure to effectively manage this risk and subsequent reduction in the deposits of our significant customers could have a material impact on our ability to fund lending commitments or increase cost of funds, thereby decreasing our revenues.
Additional liquidity is provided by brokered deposits and our ability to borrow from the FHLBI. As of June 30, 2017 brokered deposits were $687.3 million, or 24.8% of our total deposits. Brokered deposits may be more rate sensitive than other sources of funding. In the future, those depositors may not replace their brokered deposits with us as they mature, or we may have to pay a higher rate of interest to keep those deposits or to replace them with other deposits or other sources of funds. Not being able to maintain or replace those deposits as they mature would adversely affect our liquidity. Additionally, if the Bank does not maintain its well-capitalized position, it may not accept or renew any
19
brokered deposits without a waiver granted by the FDIC. We also may borrow from third-party lenders from time to time. Our access to funding sources in amounts adequate to finance or capitalize our activities or on terms that are acceptable to us could be impaired by factors that affect us directly or the financial services industry or economy in general, such as disruptions in the financial markets or negative views and expectations about the prospects for the financial services industry.
Additionally, as a bank holding company we are dependent on dividends from our subsidiaries as our primary source of income. Our subsidiaries are subject to certain legal and regulatory limitations on their ability to pay us dividends. Any reduction or limitation on our subsidiaries abilities to pay us dividends could have a material adverse effect on our liquidity and in particular, affect our ability to repay our borrowings.
Any decline in available funding, including a decrease in brokered deposits, could adversely impact our ability to continue to implement our strategic plan, including our ability to originate loans, fund warehouse financing commitments, meet our expenses, declare and pay dividends to our shareholders or to fulfill obligations such as repaying our borrowings or meeting deposit withdrawal demands, any of which could have a material adverse impact on our liquidity, business, financial condition and results of operations.
If we violate HUD lending requirements, our multi-family FHA origination business could be adversely affected.
We originate, sell and service loans under the U.S. Department of Housing and Urban Development ("HUD") programs, and make certifications regarding compliance with applicable requirements and guidelines. If we were to violate these requirements and guidelines, or other applicable laws, or if the FHA loans we originate show a high frequency of loan defaults, we could be subject to monetary penalties and indemnification claims, and could be declared ineligible for FHA programs. Any inability to engage in our multi-family FHA origination and servicing business would lead to a decrease in our net income.
If the federal government shuts down or otherwise fails to fully fund the federal budget, our multi-family FHA origination business could be adversely affected.
Disagreement over the federal budget has caused the U.S. federal government to shut down for periods of time in recent years. Federal governmental entities, such as HUD, that rely on funding from the federal budget, could be adversely affected in the event of a government shut-down, which could have a material adverse effect on our multi-family FHA origination business and our results of operations.
A decline in general business and economic conditions and any regulatory responses to such conditions could have a material adverse effect on our business, financial position, results of operations and growth prospects.
Our business and operations are sensitive to general business and economic conditions in the United States, generally, and particularly Indiana. If the national, regional and local economies experience worsening economic conditions, including high levels of unemployment, our growth and profitability could be constrained. Additionally, our ability to assess the credit worthiness of our customers is made more complex by uncertain business and economic conditions. Weak economic conditions are characterized by, among other indicators, deflation, elevated levels of unemployment, fluctuations in debt and equity capital markets, increased delinquencies on mortgage, commercial and consumer loans, residential and commercial real estate price declines, increases in non-performing assets and foreclosures, lower home sales and commercial activity, and fluctuations in the multi-family FHA financing sector. All of these factors are generally detrimental to our business. Our business is significantly affected by monetary and other regulatory policies of the U.S. federal government, its
20
agencies and government-sponsored entities. Changes in any of these policies are influenced by macroeconomic conditions and other factors that are beyond our control, are difficult to predict and could have a material adverse effect on our business, financial position, results of operations and growth prospects.
If we do not effectively manage our credit risk, we may experience increased levels of delinquencies, nonperforming loans and charge-offs, which could require increases in our provision for loan losses.
There are risks inherent in making any loan, including risks inherent in dealing with individual borrowers, risks of nonpayment, risks resulting from uncertainties as to the future value of collateral and cash flows available to service debt and risks resulting from changes in economic and market conditions. We cannot guarantee that our credit underwriting, credit monitoring, and risk management procedures will adequately reduce these credit risks, and they cannot be expected to completely eliminate our credit risks. If the overall economic climate in the United States, generally, or our market areas, specifically, declines, our borrowers may experience difficulties in repaying their loans, and the level of nonperforming loans, charge-offs and delinquencies could rise and require further increases in the provision for loan losses, which would cause our net income, return on equity and capital to decrease.
Nonperforming assets take significant time to resolve and adversely affect our results of operations and financial condition, and could result in further losses in the future.
Our nonperforming assets adversely affect our net income in various ways. We do not record interest income on nonaccrual loans or other real estate owned, thereby adversely affecting our net income and returns on assets and equity, increasing our loan administration costs and adversely affecting our efficiency ratio. When we take collateral in foreclosure and similar proceedings, we are required to mark the collateral to its then-fair market value, which may result in a loss. These nonperforming loans and other real estate owned also increase our risk profile and the level of capital our regulators believe is appropriate for us to maintain in light of such risks. The resolution of nonperforming assets requires significant time commitments from management and can be detrimental to the performance of their other responsibilities. If we experience increases in nonperforming loans and nonperforming assets, our net interest income may be negatively impacted and our loan administration costs could increase, each of which could have an adverse effect on our net income and related ratios, such as return on assets and equity.
As of June 30, 2017, our nonperforming loans (which consist of nonaccrual loans and loans past due 90 days or more and still accruing interest) totaled $3.2 million, or 0.3% of our loan portfolio, and our nonperforming assets (which include only nonperforming loans at June 30, 2017) totaled $3.2 million, or 0.1% of total assets. In addition, we had $4.6 million in accruing loans that were 31-89 days delinquent as of June 30, 2017.
Our allowance for loan losses may prove to be insufficient to absorb potential losses in our loan portfolio.
We establish our allowance for loan losses and maintain it at a level that management considers adequate to absorb probable loan losses based on an analysis of our portfolio, the underlying health of our borrowers and general economic conditions. The allowance for loan losses represents our estimate of probable losses in the portfolio at each balance sheet date and is based upon relevant information available to us. The allowance contains provisions for probable losses that have been identified relating to specific borrowing relationships, as well as probable losses inherent in the loan portfolio and credit undertakings that are not specifically identified. Additions to the allowance for loan losses, which are charged to earnings through the provision for loan losses, are determined based on a variety of factors, including an analysis of the loan portfolio, historical loss experience and an evaluation of current economic conditions in our market areas. The determination of the appropriate level of the allowance
21
for loan losses is inherently subjective and requires us to make significant estimates and assumptions regarding current credit risks and future trends, all of which may undergo material changes. The actual amount of loan losses is affected by changes in economic, operating and other conditions within our markets, which may be beyond our control, and such losses may exceed current estimates.
As of June 30, 2017, our allowance for loan losses as a percentage of total loans was 0.64% and as a percentage of total nonperforming loans was 213.3%. Although management believes that the allowance for loan losses is adequate to absorb losses on any existing loans that may become uncollectible, we may be required to take additional provisions for loan losses in the future to further supplement the allowance for loan losses, either due to management's decision to do so or because our banking regulators require us to do so. Our bank regulatory agencies will periodically review our allowance for loan losses and the value attributed to nonaccrual loans or to real estate acquired through foreclosure and may require us to adjust our determination of the value for these items. These adjustments may adversely affect our business, financial condition and results of operations.
The small to midsized businesses that we lend to may have fewer resources to weather adverse business developments, which may impair a borrower's ability to repay a loan, and such impairment could adversely affect our results of operations and financial condition.
We target our business development and marketing strategy primarily to serve the banking and financial services needs of small to midsized businesses. These businesses generally have fewer financial resources in terms of capital or borrowing capacity than larger entities, frequently have smaller market shares than their competition, may be more vulnerable to economic downturns, often need substantial additional capital to expand or compete and may experience substantial volatility in operating results, any of which may impair a borrower's ability to repay a loan. In addition, the success of a small or medium-sized business often depends on the management talents and efforts of one or two people or a small group of people, and the death, disability or resignation of one or more of these people could have a material adverse impact on the business and its ability to repay its loan. If general economic conditions negatively impact the markets in which we operate and small to medium-sized businesses are adversely affected or our borrowers are otherwise affected by adverse business developments, our business, financial condition and results of operations may be adversely affected.
Real estate construction loans are based upon estimates of costs and values associated with the complete project. These estimates may be inaccurate, and we may be exposed to significant losses on loans for these projects.
Real estate construction loans comprised approximately 7.6% of our total loan portfolio as of June 30, 2017, and such lending involves additional risks because funds are advanced upon the security of the project, which is of uncertain value prior to its completion, and costs may exceed realizable values in declining real estate markets. Because of the uncertainties inherent in estimating construction costs and the realizable market value of the completed project and the effects of governmental regulation of real property, it is relatively difficult to evaluate accurately the total funds required to complete a project and the related loan-to-value ratio. As a result, construction loans often involve the disbursement of substantial funds with repayment dependent, in part, on the success of the ultimate project and the ability of the borrower to sell or lease the property, rather than the ability of the borrower or guarantor to repay principal and interest. If our appraisal of the value of the completed project proves to be overstated or market values or rental rates decline, we may have inadequate security for the repayment of the loan upon completion of construction of the project. If we are forced to foreclose on a project prior to or at completion due to a default, we may not be able to recover all of the unpaid balance of, and accrued interest on, the loan as well as related foreclosure and holding costs. In addition, we may be required to fund additional amounts to complete the project and may have to hold the property for an unspecified period of time while we attempt to dispose of it.
22
Our risk management framework may not be effective in mitigating risks and/or losses to us.
Our risk management framework is comprised of various processes, systems and strategies, and is designed to manage the types of risk to which we are subject, including, among others, credit, market, liquidity, interest rate and compliance. Our framework also includes financial or other modeling methodologies that involve management assumptions and judgment. Our risk management framework may not be effective under all circumstances and may not adequately mitigate any risk or loss to us. If our framework is not effective, we could suffer unexpected losses and our business, financial condition, results of operations or growth prospects could be materially and adversely affected. We may also be subject to potentially adverse regulatory consequences.
We are highly dependent on our management team, and the loss of our senior executive officers or other key employees could harm our ability to implement our strategic plan, impair our relationships with customers and adversely affect our business, results of operations and growth prospects.
Our success is dependent, to a large degree, upon the continued service and skills of our executive management team, particularly Mr. Petrie, our Chairman and Chief Executive Officer, and Mr. Dunlap, the President and Co-Chief Operating Officer of Merchants Bank.
Our business and growth strategies are built primarily upon our ability to retain employees with experience and business relationships within their respective market areas. We seek to manage the continuity of our executive management team through regular succession planning. As part of such succession planning, other executives and high performing individuals have been identified and are provided certain training in order to be prepared to assume particular management roles and responsibilities in the event of the departure of a member of our executive management team. However, the loss of Mr. Petrie or Mr. Dunlap, or any of our other key personnel could have an adverse impact on our business and growth because of their skills, years of industry experience, and knowledge of our market areas, our failure to develop and implement a viable succession plan, the difficulty of finding qualified replacement personnel, or any difficulties associated with transitioning of responsibilities to any new members of the executive management team. With the exception of Mr. Dury, Executive Vice President and Chief Operating Officer of P/RMIC, who is subject to an "at will" employment agreement that contains a 12 month non-competition period, we do not have employment or non-competition agreements with our executives or other employees who are important to our business. While our mortgage originators and loan officers are generally subject to non-solicitation provisions as part of their employment, our ability to enforce such agreements may not fully mitigate the injury to our business from the breach of such agreements, as such employees could leave us and immediately begin soliciting our customers. The departure of any of our personnel who are not subject to enforceable non-competition agreements could have a material adverse impact on our business, results of operations and growth prospects.
System failure or breaches of our network security could subject us to increased operating costs as well as litigation and other liabilities.
The computer systems and network infrastructure we use could be vulnerable to hardware and cyber security issues. Our operations are dependent upon our ability to protect our computer equipment against damage from fire, power loss, telecommunications failure or a similar catastrophic event. We could also experience a breach by intentional or negligent conduct on the part of employees or other internal or external sources, including our third-party vendors. Any damage or failure that causes an interruption in our operations could have an adverse effect on our financial condition and results of operations. In addition, our operations are dependent upon our ability to protect the computer systems and network infrastructure utilized by us, including our internet banking activities, against damage from physical break-ins, cyber security breaches and other disruptive problems caused by the internet or other users. Such computer break-ins and other disruptions would jeopardize the
23
security of information stored in and transmitted through our computer systems and network infrastructure, which may result in significant liability, damage our reputation and inhibit the use of our internet banking services by current and potential customers. We regularly add additional security measures to our computer systems and network infrastructure to mitigate the possibility of cyber security breaches, including firewalls and penetration testing. However, it is difficult or impossible to defend against every risk being posed by changing technologies as well as criminal intent on committing cyber-crime. Increasing sophistication of cyber criminals and terrorists make keeping up with new threats difficult and could result in a breach. Controls employed by our information technology department and cloud vendors could prove inadequate. A breach of our security that results in unauthorized access to our data could expose us to a disruption or challenges relating to our daily operations, as well as to data loss, litigation, damages, fines and penalties, significant increases in compliance costs and reputational damage, any of which could have an adverse effect on our business, financial condition and results of operations.
Our operations could be interrupted if our third-party service providers experience difficulty, terminate their services or fail to comply with banking regulations.
We depend to a significant extent on a number of relationships with third-party service providers. Specifically, we receive core systems processing, essential web hosting and other internet systems, deposit processing and other processing services from third-party service providers. If these third-party service providers experience difficulties or terminate their services and we are unable to replace them with other service providers, our operations could be interrupted. If an interruption were to continue for a significant period of time, our business, financial condition and results of operations could be adversely affected, perhaps materially. Even if we are able to replace them, it may be at a higher cost to us, which could adversely affect our business, financial condition and results of operations.
We have a continuing need for technological change, and we may not have the resources to effectively implement new technology or we may experience operational challenges when implementing new technology.
The financial services industry is undergoing rapid technological changes with frequent introductions of new technology-driven products and services. In addition to better serving customers, the effective use of technology increases efficiency and enables financial institutions to reduce costs. Our future success will depend in part upon our ability to address the needs of our customers by using technology to provide products and services that will satisfy customer demands for convenience as well as to create additional efficiencies in our operations as we continue to grow and expand our market area. We may experience operational challenges as we implement these new technology enhancements, or seek to implement them across all of our offices and business units, which could result in us not fully realizing the anticipated benefits from such new technology or require us to incur significant costs to remedy any such challenges in a timely manner.
Many of our larger competitors have substantially greater resources to invest in technological improvements. As a result, they may be able to offer additional or superior products to those that we will be able to offer, which would put us at a competitive disadvantage. Accordingly, a risk exists that we will not be able to effectively implement new technology-driven products and services or be successful in marketing such products and services to our customers.
We are subject to certain operational risks, including, but not limited to, customer or employee fraud and data processing system failures and errors.
Employee errors and employee and/or customer misconduct could subject us to financial losses or regulatory sanctions and seriously harm our reputation or financial performance. Misconduct by our employees could include, but is not limited to, hiding unauthorized activities from us, improper or unauthorized activities on behalf of our customers or improper use of confidential information. It is not
24
always possible to prevent employee errors and misconduct, and the precautions we take to prevent and detect this activity may not be effective in all cases. Employee errors could also subject us to financial claims for negligence.
We maintain a system of internal controls and insurance coverage to mitigate against operational risks, including data processing system failures and errors and customer or employee fraud. If our internal controls fail to prevent or detect an occurrence, or if any resulting loss is not insured or exceeds applicable insurance limits, it could have a material adverse effect on our business, financial condition and results of operations.
We may not be able to overcome the integration and other risks associated with acquisitions, which could have an adverse effect on our ability to implement our business strategy.
Although we plan to continue to grow our business organically, we also intend to pursue acquisition opportunities that we believe complement our activities and have the ability to enhance our profitability and provide attractive risk-adjusted returns, including our pending acquisition of Joy State Bank. Our future acquisition activities could be material to our business and involve a number of risks, including the following:
- •
- intense competition from other banking organizations and other acquirers for potential merger candidates;
- •
- market pricing for desirable acquisitions resulting in returns that are less attractive than we have traditionally sought to achieve;
- •
- incurring time and expense associated with identifying and evaluating potential acquisitions and negotiating potential transactions, resulting
in our attention being diverted from the operation of our existing business;
- •
- using inaccurate estimates and judgments to evaluate credit, operations, management and market risks with respect to the target institution or
assets;
- •
- potential exposure to unknown or contingent liabilities of banks and businesses we acquire, including consumer compliance issues;
- •
- the time and expense required to integrate the operations and personnel of the combined businesses;
- •
- experiencing higher operating expenses relative to operating income from the new operations;
- •
- losing key employees and customers;
- •
- reputational issues if the target's management does not align with our culture and values;
- •
- significant problems relating to the conversion of the financial and customer data of the target;
- •
- integration of acquired customers into our financial and customer product systems;
- •
- risks of impairment to goodwill; or
- •
- regulatory timeframes for review of applications may limit the number and frequency of transactions we may be able to consummate.
Depending on the condition of any institution or assets or liabilities that we may acquire, that acquisition may, at least in the near term, adversely affect our capital and earnings and, if not successfully integrated with our organization, may continue to have such effects over a longer period. We may not be successful in overcoming these risks or any other problems encountered in connection with pending or potential acquisitions, and any acquisition we may consider will be subject to prior regulatory approval. Our inability to overcome these risks could have an adverse effect on our ability to implement our business strategy, which, in turn, could have an adverse effect on our business, financial condition and results of operations.
25
If the goodwill that we have recorded or may record in connection with a business acquisition becomes impaired, it could require charges to earnings.
Goodwill represents the amount by which the cost of an acquisition exceeded the fair value of net assets we acquired in connection with the purchase of another financial institution. We review goodwill for impairment at least annually, or more frequently if a triggering event occurs which indicates that the carrying value of the asset might be impaired.
Our goodwill impairment test involves a two-step process. Under the first step, the estimation of fair value of the reporting unit is compared to its carrying value including goodwill. If step one indicates a potential impairment, the second step is performed to measure the amount of impairment, if any. If the carrying amount of the reporting unit goodwill exceeds the implied fair value of that goodwill, an impairment loss is recognized in an amount equal to that excess. Any such adjustments are reflected in our results of operations in the periods in which they become known. As of June 30, 2017, our goodwill totaled $523,000. While we have not recorded any impairment charges since we initially recorded the goodwill, there can be no assurance that our future evaluations of our existing goodwill or goodwill we may acquire in the future will not result in findings of impairment and related write-downs, which could adversely affect our business, financial condition and results of operations.
We may need to raise additional capital in the future, and if we fail to maintain sufficient capital, whether due to losses, an inability to raise additional capital or otherwise, our financial condition, liquidity and results of operations, as well as our ability to maintain regulatory compliance, would be adversely affected.
We face significant capital and other regulatory requirements as a financial institution. Although management believes that funds raised in this offering will be sufficient to fund operations and growth initiatives for at least the next 18 to 24 months based on our estimated future operations, we may need to raise additional capital in the future to provide us with sufficient capital resources and liquidity to meet our commitments and business needs, which could include the possibility of financing acquisitions. In addition, we, on a consolidated basis, and the Bank, on a stand-alone basis, must meet certain regulatory capital requirements and maintain sufficient liquidity. Importantly, regulatory capital requirements could increase from current levels, which could require us to raise additional capital or contract our operations. Our ability to raise additional capital depends on conditions in the capital markets, economic conditions and a number of other factors, including investor perceptions regarding the banking industry, market conditions and governmental activities, and on our financial condition and performance. Accordingly, we cannot assure you that we will be able to raise additional capital if needed or on terms acceptable to us. If we fail to maintain capital to meet regulatory requirements, our financial condition, liquidity and results of operations would be materially and adversely affected.
Our ability to maintain our reputation is critical to the success of our business, and the failure to do so may materially adversely affect our business and the value of our stock.
We are a community bank and known nationally for P/RMIC and warehouse financing, and our reputation is one of the most valuable components of our business. As such, we strive to conduct our business in a manner that enhances our reputation. This is done, in part, by recruiting, hiring and retaining employees who share our core values of being an integral part of the communities we serve, delivering superior service to our customers and caring about our customers and associates. If our reputation is negatively affected, by the actions of our employees or otherwise, our business and, therefore, our operating results and the value of our stock may be materially adversely affected.
26
We face strong competition from financial services companies and other companies that offer banking, mortgage, leasing, and providers of FHA financing and servicing, which could harm our business.
The banking business is highly competitive, and we experience competition in our market from many other financial institutions. Our operations consist of offering banking and residential mortgage services, and we also offer multi-family FHA financing to generate noninterest income. Many of our competitors offer the same, or a wider variety of, banking and related financial services within our market areas. These competitors include national banks, regional banks and community banks. We also face competition from many other types of financial institutions, including savings and loan institutions, finance companies, brokerage firms, insurance companies, credit unions, mortgage banks and other financial intermediaries. In addition, a number of out-of-state financial intermediaries have opened production offices or otherwise solicit deposits in our market areas. Additionally, we face growing competition from online businesses with few or no physical locations, including online banks, lenders and consumer and commercial lending platforms. Increased competition in our markets may result in reduced loans, deposits and commissions and brokers' fees, as well as reduced net interest margin and profitability. Ultimately, we may not be able to compete successfully against current and future competitors. If we are unable to attract and retain banking and mortgage customers, we may be unable to continue to grow our business, and our financial condition and results of operations may be adversely affected.
Many of our non-bank competitors are not subject to the same extensive regulations that govern our activities and may have greater flexibility in competing for business. The financial services industry could become even more competitive as a result of legislative, regulatory and technological changes and continued consolidation. In addition, some of our current commercial banking customers may seek alternative banking sources as they develop needs for credit facilities larger than we may be able to accommodate. Our inability to compete successfully in the markets in which we operate could have an adverse effect on our business, financial condition or results of operations.
Changes in accounting standards could materially impact our financial statements.
From time to time, the Financial Accounting Standards Board or the SEC may change the financial accounting and reporting standards that govern the preparation of our financial statements. Such changes may result in us being subject to new or changing accounting and reporting standards. In addition, the bodies that interpret the accounting standards (such as banking regulators or outside auditors) may change their interpretations or positions on how these standards should be applied. These changes may be beyond our control, can be hard to predict and can materially impact how we record and report our financial condition and results of operations. In some cases, we could be required to apply a new or revised standard retrospectively, or apply an existing standard differently, also retrospectively, in each case resulting in our needing to revise or restate prior period financial statements. Additionally, as an emerging growth company we intend to take advantage of extended transition periods for complying with new or revised accounting standards affecting public companies.
The obligations associated with being a public company will require significant resources and management attention, which may divert from our business operations.
As a result of this offering, we will become subject to the reporting requirements of the Exchange Act and the Sarbanes-Oxley Act of 2002 (the "Sarbanes-Oxley Act"). The Exchange Act requires that we file annual, quarterly and current reports with respect to our business and financial condition with the SEC. The Sarbanes-Oxley Act requires, among other things, that we establish and maintain effective internal controls and procedures for financial reporting. As a result, we will incur significant legal, accounting and other expenses that we did not previously incur. We anticipate that these costs will materially increase our general and administrative expenses. Furthermore, the need to establish the corporate infrastructure demanded of a public company may divert management's attention from
27
implementing our strategic plan, which could prevent us from successfully implementing our growth initiatives and improving our business, results of operations and financial condition.
As an emerging growth company, we intend to take advantage of certain temporary exemptions from various reporting requirements, including reduced disclosure obligations regarding executive compensation in our periodic reports and proxy statements and an exemption from the requirement to obtain an attestation from our auditors on management's assessment of our internal control over financial reporting. When these exemptions cease to apply, we expect to incur additional expenses and devote increased management effort toward ensuring compliance with them. We cannot predict or estimate the amount of additional costs we may incur as a result of becoming a public company or the timing of such costs.
We depend on the accuracy and completeness of information provided by customers and counterparties.
In deciding whether to extend credit or enter into other transactions with customers and counterparties, we may rely on information furnished to us by or on behalf of customers and counterparties, including financial statements and other financial information. We also may rely on representations of customers and counterparties as to the accuracy and completeness of that information. In deciding whether to extend credit, we may rely upon our customers' representations that their financial statements conform to GAAP and present fairly, in all material respects, the financial condition, results of operations and cash flows of the customer. We also may rely on customer representations and certifications, or other audit or accountants' reports, with respect to the business and financial condition of our clients. Our financial condition, results of operations, financial reporting and reputation could be negatively affected if we rely on materially misleading, false, inaccurate or fraudulent information.
The accuracy of our financial statements and related disclosures could be affected if the judgments, assumptions or estimates used in our critical accounting policies are inaccurate.
The preparation of financial statements and related disclosures in conformity with GAAP requires us to make judgments, assumptions and estimates that affect the amounts reported in our consolidated financial statements and accompanying notes. Our critical accounting policies, which are included in the section captioned "Management's Discussion and Analysis of Financial Condition and Results of Operations" in this prospectus, describe those significant accounting policies and methods used in the preparation of our consolidated financial statements that we consider "critical" because they require judgments, assumptions and estimates that materially affect our consolidated financial statements and related disclosures. As a result, if future events or regulatory views concerning such analysis differ significantly from the judgments, assumptions and estimates in our critical accounting policies, those events or assumptions could have a material impact on our consolidated financial statements and related disclosures, in each case resulting in our needing to revise or restate prior period financial statements, cause damage to our reputation and the price of our common stock, and adversely affect our business, financial condition and results of operations.
If we breach any of the representations or warranties we make to a purchaser of our mortgage loans, we may be liable to the purchaser for certain costs and damages.
When we sell or securitize mortgage loans in the ordinary course of business, we are required to make certain representations and warranties to the purchaser about the mortgage loans and the manner in which they were originated. Under these agreements, we may be required to repurchase mortgage loans if we have breached any of these representations or warranties, in which case we may record a loss. In addition, if repurchase and indemnity demands increase on loans that we sell from our portfolios, our liquidity, results of operations and financial condition could be adversely affected.
28
We are dependent on the use of data and modeling in our management's decision-making, and faulty data or modeling approaches could negatively impact our decision-making ability or possibly subject us to regulatory scrutiny in the future.
The use of statistical and quantitative models and other quantitative analyses is endemic to bank decision-making, and the employment of such analyses is becoming increasingly widespread in our operations. Liquidity stress testing, interest rate sensitivity analysis, and the identification of possible violations of anti-money laundering regulations are all examples of areas in which we are dependent on models and the data that underlies them. The use of statistical and quantitative models is also becoming more prevalent in regulatory compliance. While we are not currently subject to annual Dodd-Frank Act stress testing (DFAST) and the Comprehensive Capital Analysis and Review (CCAR) submissions, we anticipate that model-derived testing may become more extensively implemented by regulators in the future. We anticipate data-based modeling will penetrate further into bank decision-making, particularly risk management efforts, as the capacities developed to meet rigorous stress testing requirements are able to be employed more widely and in differing applications. While we believe these quantitative techniques and approaches improve our decision-making, they also create the possibility that faulty data or flawed quantitative approaches could negatively impact our decision-making ability or, if we become subject to regulatory stress-testing in the future, adverse regulatory scrutiny. Secondarily, because of the complexity inherent in these approaches, misunderstanding or misuse of their outputs could similarly result in suboptimal decision-making.
Downgrades to the credit rating of the U.S. government or of its securities or any of its agencies by one or more of the credit ratings agencies could have a material adverse effect on general economic conditions, as well as our business.
On August 5, 2011, Standard & Poor's cut the credit rating of the U.S. federal government's long-term sovereign debt from AAA to AA+, while also keeping its outlook negative. Moody's had lowered its own outlook for the same debt to "Negative" on August 2, 2011, and Fitch also lowered its outlook for the same debt to "Negative," on November 28, 2011. In 2013, both Moody's and Standard & Poor's revised their outlooks from "Negative" to "Stable," and on March 21, 2014, Fitch revised its outlook from "Negative" to "Stable." Further downgrades of the U.S. federal government's sovereign credit rating, and the perceived creditworthiness of U.S. government-backed obligations, could affect our ability to obtain funding that is collateralized by affected instruments and our ability to access capital markets on favorable terms. Such downgrades could also affect the pricing of funding, when funding is available. A downgrade of the credit rating of the U.S. government, or of its agencies, government-sponsored enterprises or related institutions or instrumentalities, may also adversely affect the market value of such instruments and, further, exacerbate the other risks to which we are subject and any related adverse effects on our business, financial condition or results of operations.
Severe weather, natural disasters, pandemics, acts of war or terrorism or other external events could significantly impact our business.
Severe weather, natural disasters, widespread disease or pandemics, acts of war or terrorism or other adverse external events could have a significant impact on our ability to conduct business. In addition, such events could affect the stability of our deposit base, impair the value of collateral securing loans, cause significant property damage, result in loss of revenue or cause us to incur additional expenses. The occurrence of any of these events in the future could have a material adverse effect on our business, financial condition or results of operations.
29
Risks Related to the Regulation of Our Industry
Legislative and regulatory actions taken now or in the future may increase our costs and impact our business, governance structure, financial condition or results of operations.
The Dodd-Frank Act, among other things, imposed new capital requirements on bank holding companies; changed the base for the Federal Deposit Insurance Corporation ("FDIC") insurance assessments to a bank's average consolidated total assets minus average tangible equity, rather than upon its deposit base; permanently raised the current standard deposit insurance limit to $250,000; and expanded the FDIC's authority to raise insurance premiums. The Dodd-Frank Act established the Consumer Financial Protection Bureau ("CFPB") as an independent entity within the Board of Governors of the Federal Reserve System ("Federal Reserve"), which has broad rulemaking, supervisory and enforcement authority over consumer financial products and services, including deposit products, residential mortgages, home-equity loans and credit cards and contains provisions on mortgage-related matters, such as steering incentives, determinations as to a borrower's ability to repay and prepayment penalties. Although the applicability of certain elements of the Dodd-Frank Act is limited to institutions with more than $10 billion in assets, there can be no guarantee that such applicability will not be extended in the future or that regulators or other third parties will not seek to impose such requirements on institutions with less than $10 billion in assets, such as the Bank.
Compliance with the Dodd-Frank Act and its implementing regulations has and will continue to result in additional operating and compliance costs that could have a material adverse effect on our business, financial condition, results of operations and growth prospects.
In addition, new proposals for legislation continue to be introduced in the U.S. Congress that could further substantially increase regulation of the bank and non-bank financial services industries and impose restrictions on the operations and general ability of firms within the industry to conduct business consistent with historical practices. Federal and state regulatory agencies also frequently adopt changes to their regulations or change the manner in which existing regulations are applied. Certain aspects of current or proposed regulatory or legislative changes to laws applicable to the financial industry, if enacted or adopted, may impact the profitability of our business activities, require more oversight or change certain of our business practices, including the ability to offer new products, obtain financing, attract deposits, make loans and achieve satisfactory interest spreads and could expose us to additional costs, including increased compliance costs. These changes also may require us to invest significant management attention and resources to make any necessary changes to operations to comply and could have an adverse effect on our business, financial condition and results of operations.
New regulations, increased regulatory reviews, and/or changes in the structure of the secondary mortgage markets which we would utilize to sell mortgage loans may be introduced and may increase costs and make it more difficult to operate a residential and multi-family mortgage origination and servicing business.
As a result of the Dodd-Frank Act and recent rulemaking, we are subject to more stringent capital requirements.
In July 2013, the U.S. federal banking authorities approved the implementation of the Basel III regulatory capital reforms, or Basel III, and issued rules effecting certain changes required by the Dodd-Frank Act. Basel III is applicable to all U.S. banks that are subject to minimum capital requirements as well as to bank and saving and loan holding companies, other than "small bank holding companies" (generally bank holding companies with consolidated assets of less than $1.0 billion). Basel III not only increases most of the required minimum regulatory capital ratios, it introduces a new common equity Tier 1 capital ratio and the concept of a capital conservation buffer. Basel III also expands the current definition of capital by establishing additional criteria that capital instruments must meet to be considered additional Tier 1 and Tier 2 capital. In order to be a
30
"well-capitalized" depository institution under the new regime, an institution must maintain a common equity Tier 1 capital ratio of 6.5% or more; a Tier 1 capital ratio of 8% or more; a total capital ratio of 10% or more; and a leverage ratio of 5% or more. Institutions must also maintain a capital conservation buffer consisting of common equity Tier 1 capital. The Basel III capital rules became effective as applied to us and the Bank on January 1, 2015 with a phase-in period that generally extends through January 1, 2019 for many of the changes.
The failure to meet applicable regulatory capital requirements could result in one or more of our regulators placing limitations or conditions on our activities, including our growth initiatives, or restricting the commencement of new activities, and could affect customer and investor confidence, our costs of funds and FDIC insurance costs, our ability to pay dividends on our common stock, our ability to make acquisitions, and our business, results of operations and financial conditions, generally.
Monetary policies and regulations of the Federal Reserve could adversely affect our business, financial condition and results of operations.
In addition to being affected by general economic conditions, our earnings and growth are affected by the policies of the Federal Reserve. An important function of the Federal Reserve is to regulate the money supply and credit conditions. Among the instruments used by the Federal Reserve to implement these objectives are open market purchases and sales of U.S. government securities, adjustments of the discount rate and changes in banks' reserve requirements against bank deposits. These instruments are used in varying combinations to influence overall economic growth and the distribution of credit, bank loans, investments and deposits. Their use also affects interest rates charged on loans or paid on deposits.
The monetary policies and regulations of the Federal Reserve have had a significant effect on the operating results of commercial banks in the past and are expected to continue to do so in the future. The effects of such policies upon our business, financial condition and results of operations cannot be predicted.
Federal and state regulators periodically examine our business, and we may be required to remediate adverse examination findings.
The Federal Reserve, FDIC, Indiana Department of Financial Institutions ("IDFI"), Fannie Mae, Freddie Mac, the Rural Housing Service ("RHS"), and Ginnie Mae periodically examine our business, including our compliance with laws and regulations. If, as a result of an examination, a banking agency were to determine that our financial condition, capital resources, asset quality, earnings prospects, management, liquidity or other aspects of any of our operations had become unsatisfactory, or that we were in violation of any law or regulation, they may take a number of different remedial actions as they deem appropriate. These actions include the power to enjoin "unsafe or unsound" practices, to require affirmative action to correct any conditions resulting from any violation or practice, to issue an administrative order that can be judicially enforced, to direct an increase in our capital, to restrict our growth, to assess civil money penalties, to fine or remove officers and directors and, if it is concluded that such conditions cannot be corrected or there is an imminent risk of loss to depositors, to terminate our deposit insurance and place us into receivership or conservatorship. Any regulatory action against us could have an adverse effect on our business, financial condition and results of operations.
We are subject to numerous laws designed to protect consumers, including the CRA and fair lending laws, and failure to comply with these laws could lead to a wide variety of sanctions.
The CRA, the Equal Credit Opportunity Act, the Fair Housing Act and other fair lending laws and regulations prohibit discriminatory lending practices by financial institutions. The U.S. Department of Justice, federal banking agencies, and other federal agencies are responsible for enforcing these laws
31
and regulations. A challenge to an institution's compliance with fair lending laws and regulations could result in a wide variety of sanctions, including damages and civil money penalties, injunctive relief, restrictions on mergers and acquisitions activity, restrictions on expansion, and restrictions on entering new business lines. Private parties may also challenge an institution's performance under fair lending laws in private class action litigation. Such actions could have a material adverse effect on our business, financial condition, results of operations and growth prospects.
Additionally, the CFPB was created under the Dodd-Frank Act to centralize responsibility for consumer financial protection with broad rulemaking authority to administer and carry out the purposes and objectives of federal consumer financial laws with respect to all financial institutions that offer financial products and services to consumers. The CFPB is also authorized to prescribe rules applicable to any covered person or service provider, identifying and prohibiting acts or practices that are "unfair, deceptive, or abusive" in connection with any transaction with a consumer for a consumer financial product or service, or the offering of a consumer financial product or service. The ongoing broad rulemaking powers of the CFPB have potential to have a significant impact on the operations of financial institutions offering consumer financial products or services. The CFPB has indicated that it may propose new rules on overdrafts and other consumer financial products or services, which could have an adverse effect on our business, financial condition and results of operations if any such rules limit our ability to provide such financial products or services.
We face a risk of noncompliance and enforcement action with the Bank Secrecy Act and other anti-money laundering statutes and regulations.
The Bank Secrecy Act, the USA Patriot Act and other laws and regulations require financial institutions, among other duties, to institute and maintain an effective anti-money laundering program and to file reports such as suspicious activity reports and currency transaction reports. We are required to comply with these and other anti-money laundering requirements. The federal banking agencies and Financial Crimes Enforcement Network are authorized to impose significant civil money penalties for violations of those requirements and have recently engaged in coordinated enforcement efforts against banks and other financial services providers with the U.S. Department of Justice, Drug Enforcement Administration and Internal Revenue Service. We are also subject to increased scrutiny of compliance with the rules enforced by the Office of Foreign Assets Control. If our policies, procedures and systems are deemed deficient, we would be subject to liability, including fines and regulatory actions, which may include restrictions on our ability to pay dividends and the necessity to obtain regulatory approvals to proceed with certain aspects of our business plan, including our acquisition plans.
Failure to maintain and implement adequate programs to combat money laundering and terrorist financing could also have serious reputational consequences for us. Any of these results could have a material adverse effect on our business, financial condition, results of operations and growth prospects.
The Federal Reserve may require us to commit capital resources to support the Bank.
As a matter of policy, the Federal Reserve expects a bank holding company to act as a source of financial and managerial strength to a subsidiary bank and to commit resources to support such subsidiary bank. The Dodd-Frank Act codified the Federal Reserve's policy on serving as a source of financial strength. Under the "source of strength" doctrine, the Federal Reserve may require a bank holding company to make capital injections into a troubled subsidiary bank and may charge the bank holding company with engaging in unsafe and unsound practices for failure to commit resources to a subsidiary bank. A capital injection may be required at times when the holding company may not have the resources to provide it and therefore may be required to borrow the funds or raise capital. Any loans by a holding company to its subsidiary banks are subordinate in right of payment to deposits and to certain other indebtedness of such subsidiary bank. In the event of a bank holding company's bankruptcy, the bankruptcy trustee will assume any commitment by the holding company to a federal
32
bank regulatory agency to maintain the capital of a subsidiary bank. Moreover, bankruptcy law provides that claims based on any such commitment will be entitled to a priority of payment over the claims of the institution's general unsecured creditors, including the holders of its note obligations. Thus, any borrowing that must be done by us to make a required capital injection becomes more difficult and expensive and could have an adverse effect on our business, financial condition and results of operations.
We may be adversely affected by the soundness of other financial institutions.
Our ability to engage in routine funding transactions could be adversely affected by the actions and commercial soundness of other financial institutions. Financial services companies are interrelated as a result of trading, clearing, counterparty, and other relationships. We have exposure to different industries and counterparties, and through transactions with counterparties in the financial services industry, including brokers and dealers, commercial banks, investment banks, and other institutional clients. As a result, defaults by, or even rumors or questions about, one or more financial services companies, or the financial services industry generally, have led to market-wide liquidity problems and could lead to losses or defaults by us or by other institutions. These losses or defaults could have a material adverse effect on our business, financial condition, results of operations and growth prospects. Additionally, if our competitors were extending credit on terms we found to pose excessive risks, or at interest rates which we believed did not warrant the credit exposure, we may not be able to maintain our business volume and could experience deteriorating financial performance.
Risks Related to this Offering and an Investment in Our Common Stock
An active, liquid trading market for our common stock may not develop, and you may not be able to sell your common stock at or above the public offering price, or at all.
Prior to this offering, there has been no public market for our common stock. An active trading market for shares of our common stock may never develop or be sustained following this offering. If an active trading market does not develop, you may have difficulty selling your shares of common stock at an attractive price, or at all. The public offering price for our common stock will be determined by negotiations between us and the representatives of the underwriters and may not be indicative of prices that will prevail in the open market following this offering. Consequently, you may not be able to sell your common stock at or above the public offering price or at any other price or at the time that you would like to sell. An inactive market may also impair our ability to raise capital by selling our common stock and may impair our ability to expand our business by using our common stock as consideration in an acquisition.
The price of our common stock could be volatile following this offering.
The market price of our common stock following this offering may be volatile and could be subject to wide fluctuations in price in response to various factors, some of which are beyond our control. These factors include, among other things:
- •
- actual or anticipated variations in our quarterly results of operations;
- •
- changes in business and economic conditions;
- •
- recommendations by securities analysts;
- •
- operating and stock price performance of other companies that investors deem comparable to us;
- •
- news reports relating to trends, concerns and other issues in the financial services industry generally;
33
- •
- perceptions in the marketplace regarding us and/or our competitors;
- •
- additions or departures of key personnel;
- •
- new technology used, or services offered, by competitors; and
- •
- changes in government regulations.
In addition, if the market for stocks in our industry, or the stock market in general, experiences a loss of investor confidence, the trading price of our common stock could decline for reasons unrelated to our business, financial condition or results of operations. If any of the foregoing occurs, it could cause our stock price to fall and may expose us to lawsuits that, even if unsuccessful, could be costly to defend and a distraction to management.
Two of our directors and executive officers, Messrs. Petrie and Rogers, and their families beneficially own over 73% of our outstanding shares of common stock following this offering which allows them to exert control over matters requiring shareholder approval.
Prior to this offering, two of our directors and executive officers, Messrs. Petrie and Rogers and their families, collectively owned approximately 93% of our outstanding common stock as of October 12, 2017, and, upon the closing of this offering, they will hold approximately 73.97% of our outstanding common stock. Therefore, even after this offering, Messrs. Petrie and Rogers, together with their families, will have the ability to control the outcome of matters submitted to our shareholders for approval, including the election or removal of directors, the amendment of our articles of incorporation, along with significant transactions. This control position may conflict with the interests of some or all of our other shareholders.
We are not considered a "controlled company" within the meaning of the corporate governance standards of Nasdaq. Messrs. Petrie and Rogers and their families comprise two separate "groups" under SEC beneficial ownership rules with one group representing the Petrie family interests and the other group representing the Rogers family interests. Each of these groups controls less than 50% of our voting power. Therefore, we do not expect to be able to utilize the "controlled company" exemption. However, if Messrs. Petrie and Rogers were to form a single "group" with combined voting power exceeding 50%, we would become a "controlled company" and would be able to avail ourselves of the exemptions to Nasdaq's requirement to have a majority of independent directors and independent compensation and nomination committees. We currently have no intention to utilize the "controlled company" exemptions even if they are available in the future.
An investment in our common stock is not an insured deposit.
An investment in our common stock is not a bank deposit and, therefore, is not insured against loss by the FDIC, any other deposit insurance fund or by any other public or private entity. Investment in our common stock is inherently risky for the reasons described herein, and is subject to the same market forces that affect the price of common stock in any company. As a result, if you acquire our common stock, you could lose some or all of your investment.
If equity research analysts do not publish research or reports about our business, or if they do publish such reports but issue unfavorable commentary or downgrade our common stock, the price and trading volume of our common stock could decline.
The trading market for our common stock could be affected by whether equity research analysts publish research or reports about us and our business. We cannot predict at this time whether any research analysts will publish research and reports on us and our common stock. If one or more equity analysts do cover us and our common stock and publish research reports about us, the price of our
34
stock could decline if one or more securities analysts downgrade our stock or if those analysts issue other unfavorable commentary or cease publishing reports about us or our business.
If any of the analysts who elect to cover us downgrades our stock, our stock price could decline rapidly. If any of these analysts ceases coverage of us, we could lose visibility in the market, which in turn could cause our common stock price or trading volume to decline and our common stock to be less liquid.
We may not pay a dividend.
Holders of our common stock are only entitled to receive such cash dividends as our board of directors, in its discretion, may declare out of funds legally available for such payments. Furthermore, consistent with our strategic plans, growth initiatives, capital availability, projected liquidity needs, payment of dividends on our preferred stock, and other factors, we have made, and will continue to make, capital management decisions and policies could adversely impact the amount of dividends paid to our common shareholders.
We are a separate and distinct legal entity from our subsidiaries, including Merchants Bank. We receive substantially all of our revenue from dividends from the Bank, which we use as the principal source of funds to pay our expenses. Various federal and/or state laws and regulations limit the amount of dividends that Merchants Bank and our indirect non-bank subsidiaries may pay us. Such limits are also tied to the earnings of our subsidiaries. If Merchants Bank does not receive regulatory approval or if our subsidiaries' earnings are not sufficient to make dividend payments to us while maintaining adequate capital levels, our ability to pay our expenses and our business, financial condition or results of operations could be materially and adversely impacted.
Shares of certain shareholders may be sold into the public market in the near future. This could cause the market price of our common stock to drop significantly.
In connection with this offering, our directors, our executive officers and certain of our shareholders have entered into lock-up agreements that restrict the sale of their holdings of our common stock for a period of 180 days from the date of this prospectus. The underwriters, in their discretion, may release any of the shares of our common stock subject to these lock-up agreements at any time without notice. In addition, after this offering, approximately 1,403,271 shares of our common stock that are currently issued and outstanding will not be subject to lock-up. The resale of such shares could cause the market price of our stock to drop significantly, and concerns that those sales may occur could cause the trading price of our common stock to decrease or to be lower than it might otherwise be.
Immediately following this offering, we intend to file a registration statement on Form S-8 registering under the Securities Act of 1933, as amended (the "Securities Act"), the shares of common stock reserved for issuance in respect of incentive awards issued under our 2017 Equity Incentive Plan. If a large number of shares are sold in the public market, the sales could reduce the trading price of our common stock. These sales also could impede our ability to raise future capital.
Our management will have broad discretion as to the use of proceeds from this offering, and we may not use the proceeds effectively.
We are not required to apply any portion of the net proceeds of this offering for any particular purpose. Accordingly, our management will have broad discretion as to the application of the net proceeds of this offering and could use them for purposes other than those contemplated at the time of this offering. A portion of the proceeds are expected to be used to provide additional capital as a cushion against minimum regulatory capital requirements, which may tend to reduce our return on equity compared to if such proceeds were used for further growth. Our shareholders may not agree
35
with the manner in which our management chooses to allocate and invest the net proceeds. We may not be successful in using the net proceeds from this offering to increase our profitability or market value and we cannot predict whether the proceeds will be invested to yield a favorable return.
Failure to maintain effective internal controls over financial reporting could have a material adverse effect on our business and stock price.
As a private company, we are not currently required to comply with the rules of the SEC implementing Section 404 of the Sarbanes-Oxley Act and are therefore not required to make a formal assessment of the effectiveness of our internal control over financial reporting for that purpose. Upon becoming a public company after completion of this offering, we will be required to comply with the SEC's rules implementing Sections 302 and 404 of the Sarbanes-Oxley Act, which will require management to certify financial and other information in our quarterly and annual reports and provide an annual management report on the effectiveness of controls over financial reporting. In particular, we will be required to certify our compliance with Section 404 of the Sarbanes-Oxley Act beginning with our second annual report on Form 10-K, which will require us to furnish annually a report by management on the effectiveness of our internal control over financial reporting. Furthermore, unless we remain an emerging growth company and elect additional transitional relief available to emerging growth companies, or we qualify as a smaller reporting company under applicable SEC rules, then our independent registered public accounting firm will be required to report on the effectiveness of our internal control over financial reporting, beginning as of that second annual report.
If we identify any material weaknesses in our internal control over financial reporting or are unable to comply with the requirements of Section 404 in a timely manner or assert that our internal control over financial reporting is effective, or if our independent registered public accounting firm is unable to express an opinion as to the effectiveness of our internal control over financial reporting once we are no longer an emerging growth company, investors, counterparties and customers may lose confidence in the accuracy and completeness of our financial statements and reports; our liquidity, access to capital markets and perceptions of our creditworthiness could be adversely affected; and the market price of our common stock could decline. In addition, we could become subject to investigations by the stock exchange on which our securities are listed, the SEC, Federal Reserve, FDIC, IDFI or other regulatory authorities, which could require additional financial and management resources. These events could have an adverse effect on our business, financial condition and results of operations.
You will incur immediate dilution as a result of this offering.
The initial public offering price is substantially higher than the net tangible book value per share of our common stock. Investors purchasing common stock in this offering will pay a price per share that substantially exceeds the book value of our tangible assets after subtracting our liabilities. As a result, investors purchasing common stock in this offering will incur immediate dilution of $7.77 per share, based on the assumed initial public offering price of $18.00 (the mid-point of the price range set forth on the cover page of this prospectus). Further, investors purchasing common stock in this offering will contribute approximately 83.3% of the total amount invested by stockholders since our inception, but will own only approximately 20.5% of the shares of common stock outstanding after giving effect to this offering. As a result of the dilution to investors purchasing shares in this offering, investors may receive significantly less than the purchase price paid in this offering, if anything, in the event of our liquidation. For a further description of the dilution that you will experience immediately after this offering, see "Dilution."
36
Future equity issuances could result in dilution, which could cause our common stock price to decline.
We are generally not restricted from issuing additional shares of our common stock, up to the 50,000,000 shares of common stock and 5,000,000 shares of preferred stock authorized in our articles of incorporation, which in each case could be increased by a vote of a majority of our shares. We may issue additional shares of our common stock in the future pursuant to current or future equity compensation plans, upon conversions of preferred stock or debt, upon exercise of warrants or in connection with future acquisitions or financings. If we choose to raise capital by selling shares of our common stock for any reason, the issuance would have a dilutive effect on the holders of our common stock and could have a material negative effect on the market price of our common stock.
We may issue shares of preferred stock in the future, which could make it difficult for another company to acquire us or could otherwise adversely affect holders of our common stock, which could depress the price of our common stock.
Although there are 41,625 shares of our 8% Non-Cumulative, Perpetual Preferred Stock issued and outstanding as of October 12, 2017, our articles of organization authorize us to issue up to 5,000,000 shares of one or more series of preferred stock. The board also has the power, without shareholder approval, to set the terms of any series of preferred stock that may be issued, including voting rights, dividend rights, preferences over our common stock with respect to dividends or in the event of a dissolution, liquidation or winding up and other terms. In the event that we issue preferred stock in the future that has preference over our common stock with respect to payment of dividends or upon our liquidation, dissolution or winding up, or if we issue preferred stock with voting rights that dilute the voting power of our common stock, the rights of the holders of our common stock or the market price of our common stock could be adversely affected. In addition, the ability of our board of directors to issue shares of preferred stock without any action on the part of our shareholders may impede a takeover of us and prevent a transaction perceived to be favorable to our shareholders.
Provisions in our charter documents and Indiana law may have an anti-takeover effect, and there are substantial regulatory limitations on changes of control of bank holding companies.
Provisions of our charter documents and the Indiana Business Corporation Law (the "IBCL"), could make it more difficult for a third party to acquire us, even if doing so would be perceived to be beneficial by our shareholders. Furthermore, with certain limited exceptions, federal regulations prohibit a person or company or a group of persons deemed to be "acting in concert" from, directly or indirectly, acquiring more than 10% (5% if the acquirer is a bank holding company) of any class of our voting stock or obtaining the ability to control in any manner the election of a majority of our directors or otherwise direct the management or policies of our company without prior notice or application to and the approval of the Federal Reserve. Accordingly, prospective investors need to be aware of and comply with these requirements, if applicable, in connection with any purchase of shares of our common stock. Moreover, the combination of these provisions effectively inhibits certain mergers or other business combinations, which, in turn, could adversely affect the market price of our common stock.
37
CAUTIONARY NOTE REGARDING FORWARD-LOOKING STATEMENTS
This prospectus contains forward-looking statements which reflect our current views with respect to, among other things, future events and our financial performance. These statements are often, but not always, made through the use of words or phrases such as "may," "might," "should," "could," "predict," "potential," "believe," "expect," "continue," "will," "anticipate," "seek," "estimate," "intend," "plan," "projection," "goal," "target," "outlook," "aim," "would," "annualized" and "outlook," or the negative version of those words or other comparable words or phrases of a future or forward-looking nature. These forward-looking statements are not historical facts, and are based on current expectations, estimates and projections about our industry, management's beliefs and certain assumptions made by management, many of which, by their nature, are inherently uncertain and beyond our control. Accordingly, we caution you that any such forward-looking statements are not guarantees of future performance and are subject to risks, assumptions, estimates and uncertainties that are difficult to predict. Although we believe that the expectations reflected in these forward-looking statements are reasonable as of the date made, actual results may prove to be materially different from the results expressed or implied by the forward-looking statements.
A number of important factors could cause our actual results to differ materially from those indicated in these forward-looking statements, including those factors identified in "Risk Factors" or "Management's Discussion and Analysis of Financial Condition and Results of Operations" or the following:
- •
- business and economic conditions, particularly those affecting the financial services industry and our primary market areas;
- •
- our ability to successfully manage our credit risk and the sufficiency of our allowance for loan loss;
- •
- factors that can impact the performance of our loan portfolio, including real estate values and liquidity in our primary market areas, the
financial health of our commercial borrowers and the success of construction projects that we finance, including any loans acquired in acquisition transactions;
- •
- compliance with governmental and regulatory requirements, including the Dodd-Frank Act and others relating to banking, consumer protection,
securities and tax matters;
- •
- our ability to maintain licenses required in connection with multi-family mortgage origination, sale and servicing operations;
- •
- our ability to identify and address cyber-security risks, fraud and systems errors;
- •
- our ability to effectively execute our strategic plan and manage our growth;
- •
- changes in our senior management team and our ability to attract, motivate and retain qualified personnel;
- •
- governmental monetary and fiscal policies, and changes in market interest rates;
- •
- liquidity issues, including fluctuations in the fair value and liquidity of the securities we hold for sale and our ability to raise additional
capital, if necessary;
- •
- incremental costs and obligations associated with operating as a public company;
- •
- effects of competition from a wide variety of local, regional, national and other providers of financial, investment and insurance services;
- •
- the impact of any claims or legal actions to which we may be subject, including any effect on our reputation;
38
- •
- changes in federal tax law or policy; and
- •
- risks related to this offering.
The foregoing factors should not be construed as exhaustive and should be read together with the other cautionary statements included in this prospectus. Because of these risks and other uncertainties, our actual future results, performance or achievement, or industry results, may be materially different from the results indicated by the forward looking statements in this prospectus. In addition, our past results of operations are not necessarily indicative of our future results. You should not rely on any forward looking statements, which represent our beliefs, assumptions and estimates only as of the dates on which they were made, as predictions of future events. Any forward-looking statement speaks only as of the date on which it is made, and we do not undertake any obligation to update or review any forward-looking statement, whether as a result of new information, future developments or otherwise.
39
Assuming an initial public offering price of $18.00 per share, which is the midpoint of the offering price range set forth on the cover page of this prospectus, the net proceeds to us from this offering, after deducting underwriting discounts and estimated offering expenses, will be approximately $92.2 million (or approximately $106.3 million if the underwriters exercise their option to purchase additional shares from us in full).
Each $1.00 increase (decrease) in the assumed initial public offering price would increase (decrease) the net proceeds to us from this offering by $5.2 million, (or $6.0 million if the underwriters elect to exercise in full their option to purchase additional shares), assuming the number of shares we sell, as set forth on the cover of this prospectus, remains the same, after deducting the underwriting discounts and estimated offering expenses.
We intend to contribute $86.4 million of the net proceeds that we receive from this offering to Merchants Bank to support balance sheet growth, and to use the remainder for general corporate purposes, which could include future acquisitions and other growth initiatives. We also intend to use approximately $5.8 million to complete the pending acquisition of Joy State Bank. See "Business—Pending Acquisition." We do not have any current specific plan for such remaining net proceeds, and do not have any current plans, arrangements or understandings to make any material acquisitions or to establish any de novo bank branches. Our management will retain broad discretion to allocate the net proceeds of this offering. The precise amounts and timing of our use of the proceeds will depend upon market conditions, among other factors.
40
It has been our policy to pay quarterly dividends to holders of our common stock, and we intend to generally maintain our current dividend levels. Our dividend policy and practice may change in the future, however, and our board of directors may change or eliminate the payment of future dividends at its discretion, without notice to our shareholders. Any future determination to pay dividends to holders of our common stock will depend on our results of operations, financial condition, capital requirements, banking regulations, payment of dividends on our preferred stock, contractual restrictions and any other factors that our board of directors may deem relevant.
The following table shows recent quarterly dividends on our common stock during the periods indicated, as adjusted for stock splits.
Quarterly Period
|
Amount Per Share |
Payment Date | |||
|---|---|---|---|---|---|
Third Quarter 2017 |
$ | 0.05 | October 2, 2017 | ||
Second Quarter 2017 |
0.05 | June 30, 2017 | |||
First Quarter 2017 |
0.05 | March 31, 2017 | |||
Fourth Quarter 2016 |
0.05 | December 31, 2016 | |||
Third Quarter 2016 |
0.05 | September 30, 2016 | |||
Second Quarter 2016 |
0.05 | June 30, 2016 | |||
First Quarter 2016 |
0.05 | March 31, 2016 | |||
Fourth Quarter 2015 |
0.05 | December 31, 2015 | |||
Third Quarter 2015 |
0.05 | September 30, 2015 | |||
Second Quarter 2015 |
0.05 | June 30, 2015 | |||
First Quarter 2015 |
0.05 | March 31, 2015 | |||
Dividend Restrictions
Under the terms of our 8% Non-Cumulative, Perpetual Preferred Stock, we are not permitted to declare or pay any dividends on our common stock unless the dividends have been declared and paid on the shares of our 8% Non-Cumulative, Perpetual Preferred Stock for the period since the last payment of dividends. See "Description of Capital Stock—Preferred Stock—Dividends and Other Distributions."
As a bank holding company, our ability to pay dividends is affected by the policies and enforcement powers of the Federal Reserve. In addition, because we are a holding company, we are dependent upon the payment of dividends by the Bank to us as our principal source of funds to pay dividends in the future, if any, and to make other payments. Merchants Bank is also subject to various legal, regulatory and other restrictions on its ability to pay dividends and make other distributions and payments to us. See "Supervision and Regulation—Merchants Bank—Dividends."
41
The following table shows our capitalization and regulatory capital ratios as of June 30, 2017, on an actual basis and on an as adjusted basis after giving effect to the net proceeds from the sale by us of 5,555,555 shares of our common stock at an assumed public offering price of $18.00 per share, which is the midpoint of the price range on the cover of this prospectus, after deducting underwriting discounts and estimated offering expenses. You should read the following table in conjunction with the sections titled "Summary Historical Consolidated Financial Data," "Selected Historical Consolidated Financial Data" and "Management's Discussion and Analysis of Financial Condition and Results of Operations," and our consolidated financial statements and related notes appearing elsewhere in this prospectus. This table assumes the underwriters do not exercise their option to purchase additional shares from us.
| |
As of June 30, 2017 | ||||||
|---|---|---|---|---|---|---|---|
| |
Actual | As adjusted(1) | |||||
| (Dollars in thousands) |
(unaudited) |
||||||
Shareholders' equity: |
|||||||
Preferred stock, no par value, $1,000.00 per share, 5,000,000 shares authorized, 41,625 shares of 8% Non-Cumulative, Perpetual Preferred Stock outstanding actual and 41,625 shares of 8% Non-Cumulative, Perpetual Preferred Stock outstanding as adjusted |
$ | 41,581 | $ | 41,581 | |||
Common stock, no par value, $0.01 per share, 50,000,000 shares authorized, 21,114,400 shares outstanding actual and 27,053,222 shares outstanding as adjusted(2) |
20,103 | 112,348 | |||||
Retained earnings |
165,386 | 165,386 | |||||
Accumulated other comprehensive loss |
(557 | ) | (557 | ) | |||
| | | | | | | | |
Total shareholders' equity |
226,513 | 318,758 | |||||
| | | | | | | | |
Total capitalization |
$ | 226,513 | $ | 318,758 | |||
| | | | | | | | |
| | | | | | | | |
| | | | | | | | |
Capital ratios (Merchants Bancorp): |
|||||||
Tier 1 capital to average assets |
7.4 | % | 10.6 | % | |||
Common equity Tier 1 capital(3) |
7.4 | % | 11.5 | % | |||
Tier 1 capital to risk-weighted assets |
9.3 | % | 13.3 | % | |||
Total capital to risk-weighted assets |
9.6 | % | 13.6 | % | |||
Tangible common equity to tangible assets(4) |
6.0 | % | 8.7 | % | |||
Capital ratios (Merchants Bank only): |
|||||||
Tier 1 common equity to risk-weighted assets |
11.7 | % | 15.5 | % | |||
Tier 1 leverage ratio |
9.3 | % | 12.4 | % | |||
Tier 1 capital to risk-weighted assets |
11.7 | % | 15.5 | % | |||
Total capital to risk-weighted assets |
12.0 | % | 15.8 | % | |||
- (1)
- Each
$1.00 increase or (decrease) in the assumed initial public offering price of $18.00 per share (the midpoint of the price range set forth on the cover page of
this prospectus) would increase or (decrease), respectively, the amount of cash and cash equivalents, total stockholders' equity and total capitalization by approximately $5.2 million, assuming
the number of shares offered by us, as set forth on the cover page of this prospectus, remains the same and after deducting the estimated underwriting discounts and estimated offering expenses payable
by us. Excludes the impact of the RICHMAC acquisition on our balance sheet. Net proceeds of this offering are assumed to have a 0% risk-weighting and are not included in average assets.
- (2)
- As
adjusted to include shares of our common stock issued in August 2017 for the acquisition of RICHMAC.
- (3)
- Deductions
and other adjustments to the capital measure "Common Equity Tier 1" are being phased in over a four-year period, and began as of January 1,
2016 at the 0.625% level with increases at that amount each subsequent January 1 until it reaches 2.5% on January 1, 2019.
- (4)
- Tangible common equity to tangible assets is a non-GAAP financial measure. For more information on this financial measure, see "Non-GAAP Financial Measures" for a reconciliation of this measure to its most comparable GAAP measure.
42
If you purchase shares of our common stock in this offering, your ownership interest will experience immediate book value dilution to the extent the public offering price per share exceeds our net tangible book value per share immediately after this offering. Net tangible book value per share represents the amount of our total tangible assets less our total liabilities and preferred stock, divided by the number of shares of common stock outstanding. Our net tangible book value per share computation includes shares of our common stock issued in August 2017 for the acquisition of RICHMAC, but excludes the increase to equity for issuance of such shares and the effect of the change in net tangible book value as a result of the acquisition.
Our net tangible book value at June 30, 2017 was approximately $184.4 million, or $8.58 per share. After giving effect to our sale of 5,555,555 shares in this offering at an assumed public offering price of $18.00 per share, which is the midpoint of the price range on the cover of this prospectus, and after deducting underwriting discounts and estimated offering expenses, our as adjusted net tangible book value at June 30, 2017 would have been approximately $276.6 million, or $10.23 per share. Therefore, this offering will result in an immediate increase of $1.65 in the net tangible book value per share to our existing shareholders, and immediate dilution of $7.77 in the net tangible book value per share to investors purchasing shares in this offering. The following table illustrates this per share dilution.
Assumed initial public offering price per share, the mid-point of the price range set forth on the cover page of this prospectus |
$ | 18.00 | |||||
Net tangible book value per share at June 30, 2017 |
$ | 8.58 | |||||
Increase in net tangible book value per share attributable to this offering |
1.65 | ||||||
| | | | | | | | |
As adjusted net tangible book value per share after this offering |
10.23 | ||||||
| | | | | | | | |
Dilution in net tangible book value per share to new investors |
$ | 7.77 | |||||
| | | | | | | | |
| | | | | | | | |
| | | | | | | | |
A $1.00 increase (decrease) in the assumed public offering price of $18.00 per share, which is the midpoint of the price range on the cover of this prospectus, would increase (decrease) our net tangible book value by $5.2 million, or $0.19 per share, and the dilution to new investors by $0.81 per share, assuming no change to the number of shares offered by us as set forth on the cover of this prospectus, and after deducting underwriting discounts and estimated offering expenses.
If the underwriters exercise their option to purchase additional shares from us in full, the as adjusted net tangible book value after giving effect to this offering would be $10.42 per share. This represents an increase in net tangible book value of $1.84 per share to existing shareholders and dilution of $7.58 per share to new investors.
The following table sets forth information regarding the shares issued to, and consideration paid by, our existing shareholders and the shares to be issued to, and consideration to be paid by, investors in this offering at an assumed public offering price of $18.00 per share, which is the midpoint of the
43
price range on the cover of this prospectus, before deducting underwriting discounts and estimated offering expenses.
| |
|
|
Total consideration | |
||||||||||||
|---|---|---|---|---|---|---|---|---|---|---|---|---|---|---|---|---|
| |
Shares purchased | |
||||||||||||||
| |
Amount (in thousands) |
|
Average price per share |
|||||||||||||
| |
Number | Percent | Percent | |||||||||||||
Shareholders as of June 30, 2017 |
21,497,667 | (1) | 79.5 | % | $ | 20,103 | 16.7 | % | $ | 0.94 | ||||||
Investors in this offering |
5,555,555 | 20.5 | % | 100,000 | 83.3 | % | 18.00 | |||||||||
| | | | | | | | | | | | | | | | | |
Total |
27,053,222 | 100.0 | % | $ | 120,103 | 100.0 | % | $ | 4.44 | |||||||
| | | | | | | | | | | | | | | | | |
| | | | | | | | | | | | | | | | | |
| | | | | | | | | | | | | | | | | |
- (1)
- As adjusted to include shares of our common stock issued in August 2017 for the acquisition of RICHMAC, but excludes the increase to equity for issuance of such shares.
For the purposes of this section of this prospectus, the number of shares of our common stock outstanding as of June 30, 2017 and to be outstanding after this offering is based on 21,497,667 shares of common stock outstanding as of October 12, 2017, as adjusted for the 2.5 for 1 stock split that was effective July 6, 2017:
- •
- excludes 17,910 shares of unvested restricted stock (as adjusted for the 2.5 for 1 stock split that was effective on July 6, 2017); and
- •
- excludes 1,500,000 shares of common stock available for future awards under our 2017 Equity Incentive Plan.
We may choose to raise additional capital through the sale of equity or convertible debt securities due to market conditions or strategic considerations even if we believe we have sufficient funds for our current or future operating plans. To the extent we issue additional shares of common stock or other equity or convertible debt securities in the future, there will be further dilution to investors participating in this offering.
PRICE RANGE OF OUR COMMON STOCK
Prior to this offering, our common stock has not been traded on an established public trading market, and quotations for our common stock were not reported on any market. As a result, there has been no regular market for our common stock. Although shares of our common stock may have been sporadically traded in private transactions, the prices at which such transactions occurred may not necessarily reflect the price that would be paid for our common stock in an active market. As of June 30, 2017, there were 102 holders of record of our common stock.
We anticipate that this offering and the listing of our common stock on the Nasdaq Capital Market will result in a more active trading market for our common stock. However, we cannot assure you that a liquid trading market for our common stock will develop or be sustained after this offering. You may not be able to sell your shares quickly or at the market price if trading in our common stock is not active. See the section of this prospectus titled "Underwriting" for more information regarding our arrangements with the underwriters and the factors considered in setting the initial public offering price.
44
SELECTED HISTORICAL CONSOLIDATED FINANCIAL DATA
The following table sets forth our summary historical consolidated financial data as of the dates and for the periods shown. The summary balance sheet data as of December 31, 2016 and 2015 and the summary income statement data for the years ended December 31, 2016 and 2015 have been derived from our audited consolidated financial statements included elsewhere in this prospectus. We have derived the summary historical consolidated financial data as of and for the years ended December 31, 2014, 2013 and 2012 from our audited financial statements not included in this prospectus. The summary consolidated financial data as of June 30, 2017 and for the six months ended June 30, 2017 and 2016 is derived from our unaudited interim consolidated financial statements included elsewhere in this prospectus and includes all normal and recurring adjustments that we consider necessary for a fair presentation. Operating results for the six months ended June 30, 2017 are not necessarily indicative of the results that may be expected for the year ending December 31, 2017.
You should read the following financial data in conjunction with the other information contained in this prospectus, including "Summary Selected Consolidated Financial Data," "Management's Discussion and Analysis of Financial Condition and Results of Operations" and in the consolidated financial statements and related notes included elsewhere in this prospectus.
| |
At or for the Six Months Ended June 30, |
At or for the Year Ended December 31, | ||||||||||||||||||||
|---|---|---|---|---|---|---|---|---|---|---|---|---|---|---|---|---|---|---|---|---|---|---|
| (Dollars in thousands, except per share data) |
2017 | 2016 | 2016 | 2015 | 2014 | 2013 | 2012 | |||||||||||||||
| |
(unaudited) |
|
|
|
|
|
||||||||||||||||
Balance Sheet Data |
||||||||||||||||||||||
Total Assets |
$ | 3,091,500 | $ | 2,506,974 | $ | 2,718,512 | $ | 2,269,442 | $ | 1,793,008 | $ | 1,179,791 | $ | 936,172 | ||||||||
Loans held for investment |
1,070,866 | 872,292 | 941,796 | 762,212 | 447,614 | 266,092 | 217,073 | |||||||||||||||
Allowance for loan losses |
(6,865 | ) | (5,902 | ) | (6,250 | ) | (5,422 | ) | (4,458 | ) | (3,295 | ) | (2,854 | ) | ||||||||
Loans held for sale |
983,420 | 818,404 | 764,503 | 620,583 | 736,667 | 542,571 | 365,444 | |||||||||||||||
Investment securities |
523,351 | 426,310 | 463,549 | 362,325 | 305,583 | 222,798 | 190,261 | |||||||||||||||
Deposits |
2,771,501 | 2,247,621 | 2,428,621 | 2,039,520 | 1,610,719 | 1,054,304 | 815,418 | |||||||||||||||
FHLB advances and other borrowings |
26,633 | 27,030 | 27,006 | 27,490 | 17,860 | 3,223 | 7,584 | |||||||||||||||
Subordinated debt |
30,000 | 30,000 | 30,000 | 30,000 | 30,000 | — | — | |||||||||||||||
Total liabilities |
2,864,987 | 2,329,701 | 2,512,224 | 2,121,242 | 1,682,872 | 1,060,976 | 841,864 | |||||||||||||||
Preferred stock |
41,581 | 28,525 | 41,581 | 10,000 | — | — | — | |||||||||||||||
Common stock |
20,103 | 20,062 | 20,061 | 20,061 | 16,121 | 9,469 | 9,469 | |||||||||||||||
Total shareholder's equity |
226,513 | 177,273 | 206,288 | 148,200 | 110,137 | 118,814 | 94,308 | |||||||||||||||
Tangible common equity |
184,409 | 148,226 | 164,184 | 137,677 | 109,614 | 118,291 | 93,785 | |||||||||||||||
Income Statement Data |
||||||||||||||||||||||
Interest Income |
$ | 41,471 | $ | 32,421 | $ | 72,939 | $ | 56,345 | $ | 39,554 | $ | 31,659 | $ | 25,764 | ||||||||
Interest Expense |
12,216 | 8,602 | 18,968 | 14,290 | 8,924 | 5,951 | 5,054 | |||||||||||||||
| | | | | | | | | | | | | | | | | | | | | | | |
Net interest income |
29,255 | 23,819 | 53,971 | 42,055 | 30,630 | 25,708 | 20,710 | |||||||||||||||
Provision for loan losses |
480 | 480 | 960 | 960 | 1,215 | 720 | 1,270 | |||||||||||||||
Noninterest income |
24,717 | 9,951 | 28,504 | 27,008 | 20,263 | 27,284 | 36,121 | |||||||||||||||
Noninterest expense |
14,902 | 12,163 | 26,720 | 20,922 | 15,796 | 13,328 | 12,504 | |||||||||||||||
| | | | | | | | | | | | | | | | | | | | | | | |
Income before taxes |
38,590 | 21,127 | 54,795 | 47,181 | 33,882 | 38,944 | 43,057 | |||||||||||||||
Provision for income taxes |
14,702 | 8,353 | 21,668 | 18,798 | 30,079 | — | — | |||||||||||||||
| | | | | | | | | | | | | | | | | | | | | | | |
Net income, as previously reported |
23,888 | 12,774 | 33,127 | 28,383 | 3,803 | 38,944 | 43,057 | |||||||||||||||
Non-GAAP Reconciliation: |
||||||||||||||||||||||
Pro-forma adjustments: |
||||||||||||||||||||||
Add back of tax effect of S Corp to C Corp conversion |
— | — | — | — | 16,431 | (1) | — | — | ||||||||||||||
Less provision for income taxes |
— | — | — | — | — | 15,578 | (2) | 17,223 | (2) | |||||||||||||
| | | | | | | | | | | | | | | | | | | | | | | |
Pro-forma net income |
23,888 | 12,774 | 33,127 | 28,383 | 20,234 | 23,366 | 25,834 | |||||||||||||||
Preferred stock dividends |
1,665 | 407 | 2,002 | — | — | — | — | |||||||||||||||
| | | | | | | | | | | | | | | | | | | | | | | |
Pro-forma net income available to common shareholders |
$ | 22,223 | $ | 12,367 | $ | 31,125 | $ | 28,383 | $ | 20,234 | $ | 23,366 | $ | 25,834 | ||||||||
| | | | | | | | | | | | | | | | | | | | | | | |
| | | | | | | | | | | | | | | | | | | | | | | |
| | | | | | | | | | | | | | | | | | | | | | | |
45
| |
At or for the Six Months Ended June 30, |
At or for the Year Ended December 31, | ||||||||||||||||||||
|---|---|---|---|---|---|---|---|---|---|---|---|---|---|---|---|---|---|---|---|---|---|---|
| (Dollars in thousands, except per share data) |
2017 | 2016 | 2016 | 2015 | 2014 | 2013 | 2012 | |||||||||||||||
| |
(unaudited) |
|
|
|
|
|
||||||||||||||||
Credit Quality Data |
||||||||||||||||||||||
Loans 30-89 days past due |
$ | 4,617 | $ | 382 | $ | 2,288 | $ | 1,515 | $ | 1,190 | $ | — | $ | 148 | ||||||||
Loans 30-89 days past due to total loans |
0.43 | % | 0.04 | % | 0.24 | % | 0.20 | % | 0.27 | % | — | 0.07 | % | |||||||||
Nonperforming loans |
$ | 3,219 | $ | 2,195 | $ | 1,887 | $ | 887 | $ | 815 | $ | 490 | $ | 1,451 | ||||||||
Nonperforming loans to total loans |
0.30 | % | 0.25 | % | 0.20 | % | 0.12 | % | 0.18 | % | 0.18 | % | 0.67 | % | ||||||||
Nonperforming assets |
$ | 3,219 | $ | 2,195 | $ | 1,887 | $ | 887 | $ | 815 | $ | 490 | $ | 1,451 | ||||||||
Nonperforming assets to total assets |
0.10 | % | 0.09 | % | 0.07 | % | 0.04 | % | 0.05 | % | 0.04 | % | 0.16 | % | ||||||||
Allowance for loan losses to total loans |
0.64 | % | 0.68 | % | 0.66 | % | 0.71 | % | 1.00 | % | 1.24 | % | 1.31 | % | ||||||||
Allowance for loan losses to nonperforming loans |
213.26 | % | 268.88 | % | 331.21 | % | 611.27 | % | 546.99 | % | 672.45 | % | 196.69 | % | ||||||||
Net charge-offs/(recoveries) to average loans |
(0.01 | )% | — | — | — | 0.02 | % | 0.12 | % | 0.14 | % | |||||||||||
Per Share Data (Common Stock) |
||||||||||||||||||||||
Basic and diluted earnings per share |
||||||||||||||||||||||
As reported |
$ | 1.05 | $ | 0.59 | $ | 1.47 | $ | 1.35 | $ | 0.19 | $ | 1.95 | $ | 2.15 | ||||||||
Pro-forma |
$ | 1.05 | $ | 0.59 | $ | 1.47 | $ | 1.35 | $ | 1.01 | (3) | $ | 1.17 | (3) | $ | 1.29 | (3) | |||||
Dividends declared |
$ | 0.10 | $ | 0.10 | $ | 0.20 | $ | 0.20 | $ | 0.95 | $ | 0.72 | $ | 0.44 | ||||||||
Book value |
||||||||||||||||||||||
As reported |
$ | 8.76 | $ | 7.05 | $ | 7.80 | $ | 6.55 | $ | 5.32 | $ | 5.94 | $ | 4.72 | ||||||||
Pro-forma |
$ | 8.76 | $ | 7.05 | $ | 7.80 | $ | 6.55 | $ | 6.11 | (4) | $ | 5.16 | (5) | $ | 3.85 | (5) | |||||
Tangible book value |
||||||||||||||||||||||
As reported |
$ | 8.73 | $ | 7.02 | $ | 7.78 | $ | 6.52 | $ | 5.29 | $ | 5.92 | $ | 4.69 | ||||||||
Pro-forma |
$ | 8.73 | $ | 7.02 | $ | 7.78 | $ | 6.52 | $ | 6.09 | (4) | $ | 5.14 | (5) | $ | 3.83 | (5) | |||||
Weighted average shares outstanding |
||||||||||||||||||||||
Basic |
21,114,400 | 21,111,200 | 21,111,208 | 21,075,475 | 20,017,400 | 20,000,000 | 20,000,000 | |||||||||||||||
Diluted |
21,119,411 | 21,112,283 | 21,113,435 | 21,075,475 | 20,017,400 | 20,000,000 | 20,000,000 | |||||||||||||||
Shares outstanding at period end |
21,114,400 | 21,111,200 | 21,111,200 | 21,111,200 | 20,703,700 | 20,000,000 | 20,000,000 | |||||||||||||||
Performance Metrics |
||||||||||||||||||||||
Return on average assets |
||||||||||||||||||||||
As reported |
1.74 | % | 1.05 | % | 1.24 | % | 1.32 | % | 0.25 | % | 3.18 | % | 4.81 | % | ||||||||
Pro-forma |
1.74 | % | 1.05 | % | 1.24 | % | 1.32 | % | 1.34 | %(4) | 1.91 | %(5) | 2.89 | %(5) | ||||||||
Return on average equity |
||||||||||||||||||||||
As reported |
22.00 | % | 16.52 | % | 18.68 | % | 22.62 | % | 3.71 | % | 37.07 | % | 57.86 | % | ||||||||
Pro-forma |
22.00 | % | 16.52 | % | 18.68 | % | 22.62 | % | 19.76 | %(4) | 22.24 | %(5) | 34.71 | %(5) | ||||||||
Return on average tangible common equity |
||||||||||||||||||||||
As reported |
25.40 | % | 17.18 | % | 20.50 | % | 22.73 | % | 3.73 | % | 37.25 | % | 58.27 | % | ||||||||
Pro-forma |
25.40 | % | 17.18 | % | 20.50 | % | 22.73 | % | 19.86 | %(4) | 22.35 | %(5) | 34.96 | %(5) | ||||||||
Net interest margin |
2.23 | % | 2.03 | % | 2.07 | % | 2.02 | % | 2.12 | % | 2.19 | % | 2.41 | % | ||||||||
Efficiency ratio |
27.61 | % | 36.02 | % | 32.40 | % | 30.29 | % | 31.04 | % | 25.15 | % | 22.00 | % | ||||||||
Loans and loans held for sale to deposits |
74.12 | % | 75.22 | % | 70.26 | % | 67.80 | % | 73.52 | % | 76.70 | % | 71.44 | % | ||||||||
Capital Ratios—Merchants Bancorp |
||||||||||||||||||||||
Tangible common equity to tangible assets |
6.0 | % | 5.9 | % | 6.0 | % | 6.1 | % | 6.1 | % | 10.0 | 10.0 | ||||||||||
Common equity Tier 1 capital to risk-weighted assets |
7.4 | % | 7.4 | % | 8.1 | % | 8.5 | % | N/ | A | N/ | A | N/ | A | ||||||||
Tier 1 leverage ratio |
7.4 | % | 6.5 | % | 6.6 | % | 6.1 | % | 6.1 | % | 8.4 | % | 8.0 | % | ||||||||
Tier 1 capital to risk weighted assets |
9.3 | % | 8.9 | % | 10.3 | % | 9.2 | % | 7.7 | % | 11.9 | % | 18.0 | % | ||||||||
Total capital to risk-weighted assets |
9.6 | % | 9.2 | % | 10.6 | % | 9.6 | % | 8.1 | % | 12.2 | % | 18.0 | % | ||||||||
Regulatory Capital Ratios—Merchants Bank Only |
||||||||||||||||||||||
Tier 1 common capital to risk-weighted assets |
11.7 | % | 12.0 | % | 13.2 | % | 12.9 | % | N/ | A | — | — | ||||||||||
Tier 1 leverage ratio |
9.3 | % | 8.7 | % | 8.4 | % | 8.5 | % | 8.7 | % | 8.4 | % | 8.0 | % | ||||||||
Tier 1 capital to risk-weighted assets |
11.7 | % | 12.0 | % | 13.2 | % | 12.9 | % | 11.0 | % | 11.9 | % | 18.0 | % | ||||||||
Total capital to risk-weighted assets |
12.0 | % | 12.4 | % | 13.5 | % | 13.3 | % | 11.3 | % | 12.2 | % | 18.0 | % | ||||||||
- (1)
- Represents
the recognition of deferred tax liabilities recorded upon conversion from a Subchapter S corporation to a regular C corporation.
- (2)
- Represents
the pro-forma effects of income taxes using a 40% income tax rate, as we were a Subchapter S corporation in years prior to 2014.
- (3)
- Represents
basic and diluted earnings per share calculated on pro-forma net income.
- (4)
- Represents
pro-forma performance metrics calculated on net income as adjusted for the effects of the deferred tax liabilities recorded in connection with the
conversion from Subchapter S to C corporation.
- (5)
- Represents pro-forma performance metrics calculated on net income as adjusted for the effects of income taxes included calculated using a 40% income tax rate for years previously reported as a Subchapter S corporation.
46
Some of the financial measures included in this prospectus are not measures of financial performance recognized by generally accepted accounting principles in the United States. Our management uses these non-GAAP financial measures in its analysis of our performance. These non-GAAP financial measures include presentation of tangible shareholders' equity and pro-forma tax effects related to our conversion from a Subchapter S corporation to a C corporation for income tax purposes.
The reconciliation from shareholders' equity per GAAP to tangible shareholders' equity is comprised solely of goodwill totaling $523,000 in all periods from December 31, 2012 through June 30, 2017.
We converted from a Subchapter S corporation to a C corporation in 2014. In connection with this conversion, we recorded a charge to net income in 2014 for the recognition of deferred tax liabilities totaling $16.4 million. To facilitate comparison of the years ended December 31, 2014, 2013 and 2012, with subsequent years, we have displayed tax expense for 2013 and 2012 at an estimated assumed tax rate of 40.0%, and a reversal of the charge for deferred tax liabilities in 2014.
We believe that these non-GAAP financial measures provide useful information to management and investors that is supplementary to our financial condition, results of operations and cash flows computed in accordance with GAAP; however, we acknowledge that the non-GAAP financial measures have a number of limitations. As such, you should not view these disclosures as a substitute for results determined in accordance with GAAP, and these disclosures are not necessarily comparable to non-GAAP financial measures that other companies use.
A reconciliation of GAAP to non-GAAP financial measures is as follows:
| |
At June 30, | At December 31, | ||||||||||||||||||||
|---|---|---|---|---|---|---|---|---|---|---|---|---|---|---|---|---|---|---|---|---|---|---|
| (Dollars in thousands) |
2017 | 2016 | 2016 | 2015 | 2014 | 2013 | 2012 | |||||||||||||||
| |
(unaudited) |
|
|
|
|
|
||||||||||||||||
Tangible shareholders' equity |
||||||||||||||||||||||
Shareholders' equity per GAAP |
$ | 226,513 | $ | 177,273 | $ | 206,288 | $ | 148,200 | $ | 110,137 | $ | 118,814 | $ | 94,308 | ||||||||
Less: Goodwill |
(523 | ) | (523 | ) | (523 | ) | (523 | ) | (523 | ) | (523 | ) | (523 | ) | ||||||||
| | | | | | | | | | | | | | | | | | | | | | | |
Tangible shareholders' equity |
225,990 | 176,750 | 205,765 | 147,677 | 109,614 | 118,291 | 93,785 | |||||||||||||||
Less preferred stock |
(41,581 | ) | (28,525 | ) | (41,581 | ) | (10,000 | ) | — | — | — | |||||||||||
| | | | | | | | | | | | | | | | | | | | | | | |
Tangible common shareholders' equity |
$ | 184,409 | $ | 148,225 | $ | 164,184 | $ | 137,677 | $ | 109,614 | $ | 118,291 | $ | 93,785 | ||||||||
| | | | | | | | | | | | | | | | | | | | | | | |
| | | | | | | | | | | | | | | | | | | | | | | |
| | | | | | | | | | | | | | | | | | | | | | | |
Tangible common equity to tangible assets(1) |
6.0 | % | 5.9 | % | 6.0 | % | 6.1 | % | 6.1 | % | 10.0 | % | 10.0 | % | ||||||||
| | | | | | | | | | | | | | | | | | | | | | | |
| | | | | | | | | | | | | | | | | | | | | | | |
| | | | | | | | | | | | | | | | | | | | | | | |
Efficiency ratio(2) |
27.61 | % | 36.02 | % | 32.40 | % | 30.29 | % | 31.04 | % | 25.15 | % | 22.00 | % | ||||||||
| | | | | | | | | | | | | | | | | | | | | | | |
| | | | | | | | | | | | | | | | | | | | | | | |
| | | | | | | | | | | | | | | | | | | | | | | |
| |
For the Six Months Ended June 30, |
For the Year Ended December 31, |
||||||||||||||||||||
|---|---|---|---|---|---|---|---|---|---|---|---|---|---|---|---|---|---|---|---|---|---|---|
| |
2017 | 2016 | 2016 | 2015 | 2014 | 2013 | 2012 | |||||||||||||||
Net income as reported |
$ | 23,888 | $ | 12,774 | $ | 33,127 | $ | 28,383 | $ | 3,803 | $ | 38,944 | $ | 43,057 | ||||||||
Pro-forma tax effects of C corp status |
— | — | — | — | 16,431 | (15,578 | ) | (17,223 | ) | |||||||||||||
| | | | | | | | | | | | | | | | | | | | | | | |
Pro-forma net income |
$ | 23,888 | $ | 12,774 | $ | 33,127 | $ | 28,383 | $ | 20,234 | $ | 23,366 | $ | 25,834 | ||||||||
| | | | | | | | | | | | | | | | | | | | | | | |
| | | | | | | | | | | | | | | | | | | | | | | |
| | | | | | | | | | | | | | | | | | | | | | | |
- (1)
- Tangible
assets represents consolidated assets less goodwill of $523 in each period.
- (2)
- The efficiency ratio represents noninterest expense divided by the sum of net interest income and noninterest income.
47
MANAGEMENT'S DISCUSSION AND ANALYSIS OF FINANCIAL CONDITION
AND RESULTS OF OPERATIONS
The following discussion and analysis of our financial condition and results of operations should be read in conjunction with "Summary Historical Consolidated Financial Data" and "Selected Historical Consolidated Financial Data" and our audited and unaudited consolidated financial statements and the accompanying notes included elsewhere in this prospectus. This discussion and analysis contains forward-looking statements that are subject to known and unknown risks and uncertainties that could cause our results to differ materially from our expectations. Actual results and the timing of events may differ significantly from those expressed or implied by such forward-looking statements due to a number of factors, including those set forth under "Cautionary Note Regarding Forward-Looking Statements," "Risk Factors" and elsewhere in this prospectus. We assume no obligation to update any of these forward-looking statements.
Our Company Overview
We are a diversified bank holding company headquartered in Carmel, Indiana and registered under the Bank Holding Company Act of 1956, as amended. We currently operate multiple lines of business with a focus on FHA multi-family housing and healthcare facility financing and servicing, mortgage warehouse financing, retail and correspondent residential mortgage banking, agricultural lending and traditional community banking.
Our business consists primarily of funding low risk loans that sell within 90 days of origination. The sale of loans and servicing fees generated from the multifamily rental real estate loans servicing portfolio contribute to noninterest income. The funding source is primarily from mortgage custodial, municipal, and retail and commercial deposits. We believe that the combination of net interest income and noninterest income from the sale of low risk profile assets results in lower than industry charge offs and a lower expense base serving to maximize net income and shareholder return.
Our Corporate Structure
We have multiple lines of business and provide various banking and financial services through our subsidiaries and Merchants Bank divisions as follows:
- •
- Multi-Family Rental Housing
- •
- Healthcare Financing
- •
- Servicing and Subservicing
P/R Mortgage & Investment Corp. (a subsidiary of Merchants Bank)
- •
- Multi-Family Rental Housing
RICHMAC Funding, LLC (a subsidiary of P/RMIC)
- •
- Warehouse Financing and Loan Participations
- •
- Commercial Lending
- •
- Retail Banking
- •
- SBA Small Business Loan Programs
- •
- Agricultural Lending
Merchants Bank of Indiana
48
- •
- Merchants Mortgage
- •
- Single-Family Mortgage Lending
- •
- Correspondent Mortgage Banking
- •
- Warehouse Financing and Loan Participations
Natty Mac Funding, Inc. (a subsidiary of Merchants Bank)
P/RMIC: Multi-Family Rental Housing, Healthcare Financing and Servicing
P/RMIC is primarily engaged in mortgage banking, specializing in originating and servicing loans for multi-family rental housing and healthcare facility financing, particularly for senior living properties.
P/RMIC originated $1.2 billion in loans during 2016 and $906 million during the six months ended June 30, 2017. P/RMIC primarily originates FHA loans that are sold as Ginnie Mae mortgage backed securities in approximately 30 days. The loans are sold and the mortgage servicing rights are retained. Other originations include bridge and permanent financing that are referred to the Banking segment. These loans eventually become permanent FHA financings by P/RMIC. In addition to the $1.2 billion originated directly by P/RMIC, we also funded loans brought to us by non-affiliated entities. As of June 30, 2017, P/RMIC's servicing portfolio totaled $6.2 billion, which includes owned and subserviced loans.
We generated approximately $22.6 and $23.0 million, or 41.9% and 27.9%, of net revenue (net interest income plus non-interest income) from our Multi-family Mortgage Banking segment for the six months ended June 30, 2017 and year ended December 31, 2016, respectively.
RICHMAC
In August 2017, P/RMIC acquired RICHMAC Funding, LLC, a national multi-family housing mortgage lender, to complement and expand the products and services offered by P/RMIC.
MERCHANTS BANK: Warehouse Financing and Loan Participations
Merchants Bank started our warehouse lending business in 2009 as a result of dislocation in the market. Merchants Bank currently has warehouse lines of credit and loan participations with some of the largest non-depository financial institutions in the country. For the six months ended June 30, 2017, Merchants Bank and NMF had $1.2 billion in loans outstanding from warehouse lines for credit to single and multi-family lenders and loan participations. We generated approximately $17.7 and $35.3 million, or 32.9% and 42.8%, of net revenue (net interest income plus non-interest income) from our Mortgage Warehousing segment for the six months ended June 30, 2017 and year ended December 31, 2016, respectively.
Commercial Lending and Retail Banking
Merchants Bank operates under an Indiana charter and provides full banking services. Merchants Bank has five depository branches located in Carmel, Indianapolis and Lynn, Indiana. Merchants Bank holds loans in its portfolio comprised of multi-family construction and bridge loans referred by P/RMIC, owner occupied commercial real estate loans, commercial & industrial loans, agricultural loans, residential mortgage loans and consumer loans. Merchants Bank receives deposits from customers located primarily in Hamilton, Marion, Randolph and surrounding counties in Indiana and from the escrows generated by the servicing activities of P/RMIC.
49
SBA Lending
Merchants Bank participates in the SBA 7(a) program in order to meet the needs of our small business community, and help diversify our retail revenue stream. We originate and service, as well as sell the guaranteed portion of these loans. As of June 30, 2017, Merchants Bank had originated $4.5 million in SBA 7(a) loans in Marion and Hamilton counties in Central Indiana since our participation in this program.
The SBA's 7(a) program provides up to a 75% guaranty for loans greater than $150,000. For loans $150,000 or less, the program provides up to an 85% guaranty. The maximum 7(a) loan amount is $5 million. The guaranty is conditional and covers a portion of the risk of payment default by the borrower, but not the risk of improper closing and servicing by the lender. As such, prudent underwriting and closing processes are essential to effective utilization of the 7(a) program. We typically sell in the secondary market the SBA-guaranteed portion (generally 75% of the principal balance) of the loans we originate.
Agricultural Lending
Merchants Bank has its MBI-Lynn division located in Lynn, Randolph County, Indiana with its primary business function to provide agricultural loans within its designated CRA area of Randolph and Wayne counties in Eastern Indiana and nearby Darke County, Ohio. Merchants Bank offers operating lines of credit for crop and livestock production, intermediate term financing to purchase equipment and breeding livestock and long-term financing to purchase agricultural real estate. As of June 30, 2017, there were $66.4 million of agricultural loans in the portfolio, including undisbursed funds of $4.3 million, 48.2% of which have a FSA 90% guarantee. Merchants Bank is approved to sell agricultural loans in the secondary market through Farmer Mac and uses this relationship to manage interest rate risk within the agricultural loan portfolio. As of June 30, 2017, $13.5 million in agricultural loans had been sold to Farmer Mac without recourse. Merchants Bank has written off less than $25 thousand in loan loss in its agricultural loan portfolio since December 31, 2004.
Loan Origination Guidelines
Our various categories of loans held for investment are underwritten in accordance with guidelines appropriate for each loan type. For mortgage warehouse lines of credit, we evaluate warehouse lending customers based on their financial condition, including minimum net worth and compliance with agency requirements, before entering a warehouse line of credit relationship. Warehouse lending customers are monitored quarterly and renewed annually. We review each mortgage loan funded on the lines of credit prior to funding to ensure compliance with agency or investor guidelines. Residential and multi-family rental real estate loans included in loans held for investment are underwritten in accordance with agency credit criteria. However, we make certain exceptions for loan size on certain residential mortgages. Commercial and commercial real estate loans are underwritten in accordance with loan policy parameters of 80% loan-to-value ratio and 1.25 debt service coverage ratio, and we may include other financial covenants and guarantors where we deem appropriate.
MERCHANTS MORTGAGE: Single Family Mortgage Lending, Correspondent Lending and Servicing
Merchants Mortgage is the branded arm and division of Merchants Bank which is a full service single-family mortgage origination and servicing platform started in February 2013. Merchants Mortgage is both a retail and correspondent mortgage lender. Merchants Mortgage offers agency eligible, jumbo fixed and hybrid adjustable rate mortgages for purchase or refinancing. Other products include construction, bridge and lot financing and HELOCs, including the All-in-One product, which links a customer's checking account balance to a first lien HELOC. Merchants Mortgage generates revenues from fees charged to borrowers, interest income during the warehouse period, and gain on
50
the sale of loans to investors. There are multiple investor outlets, including direct sale capability to Fannie Mae, Freddie Mac, FHLBI, and other third-party investors to allow Merchants Mortgage a best execution at sale. Merchants Mortgage also originates loans held for investment and earns interest income over the life of the loan.
NMF: Warehouse Financing and Loan Participations
Through NMF we engage in loan participations and warehouse financing with Home Point and its subsidiaries and correspondent customers. NMF was established as a wholly owned subsidiary of Merchants Bank in 2014. We entered into a Revolving Loan and Subordinated Loan Agreement whereby Home Point invested $30 million in our subordinated debt. In turn, we invested the proceeds into Merchants Bank and then to NMF. NMF provides $300 million of lending capacity to Home Point and its subsidiaries and correspondent customers. We earn net interest income and use Home Point custodial deposits to fund the loans.
MIDTOWN WEST
MBI Midtown owns land upon which we expect to build our new corporate headquarters building in Carmel, Indiana.
ASH REALTY
Ash Realty holds assets acquired through, or in lieu of, loan foreclosures. At June 30, 2017, there were no assets held in Ash Realty.
ARCLINE FINANCIAL, LLC
Merchants owns 30% of Arcline and is accounted for using the equity method of accounting. Arcline processes warehouse and correspondent lending transactions, including on behalf of Merchants Bank.
Our Segments
We operate in three primary segments: Multi-family Mortgage Banking, Mortgage Warehousing, and Banking. We believe that P/RMIC, which operates in our Multi-Family Mortgage Banking segment, is one of the largest FHA lenders and Ginnie Mae servicers in the country based on aggregate loan principal value. P/RMIC has grown to over $1 billion in annual originations since the beginning of 2015 and services $6.2 billion as of June 30, 2017. The servicing portfolio is primarily Ginnie Mae and is a significant source of our noninterest income and deposits. Our Mortgage Warehousing segment funds agency eligible loans for non-depository financial institutions from the date of origination or purchase until the date of sale to an investor, which typically takes less than 30 days and is a significant source of our net interest income, loans, and deposits. Mortgage Warehousing has grown to fund over $20 billion of loan principal annually since 2015. Mortgage Warehousing also provides deposits related to the mortgage escrow accounts of its customers. The Banking segment includes retail banking, commercial lending, agricultural lending, retail and correspondent residential mortgage banking, and SBA lending. Banking operates primarily in the Indianapolis metropolitan and Randolph County Indiana markets except for correspondent mortgage banking which, like Multi-family Mortgage Banking and Mortgage Warehousing, is a national business. The Banking segment has a well-diversified customer and borrower base and has experienced significant growth over the past three years. These segments diversify the net income of the Bank and provide synergies across the segments. The strategic opportunities include that P/RMIC loans are funded by the Banking segment and the Banking segment provides Ginnie Mae custodial services to P/RMIC. The securities available for sale funded by P/RMIC custodial deposits are pledged to FHLBI to provide advance capacity during periods of high residential loan volume for
51
mortgage warehousing. Mortgage Warehousing provides leads to correspondent residential lending in the banking segment. Retail and commercial customers provide cross selling opportunities within the banking segment. These and other synergies form a part of our strategic plan.
For the six months ended June 30, 2017 and 2016, we had total net income of $23.9 million and $12.8 million, respectively, and for the years ended December 31, 2016 and 2015, we had total net income of $33.1 million and $28.4 million, respectively. Net income for our three segments for the respective periods was as follows:
| |
Net Income For the Six Months Ended June 30, |
For the Year Ended December 31, |
|||||||||||
|---|---|---|---|---|---|---|---|---|---|---|---|---|---|
| (Dollars in thousands) |
2017 | 2016 | 2016 | 2015 | |||||||||
| |
(unaudited) |
|
|
||||||||||
Multi-family Mortgage Banking |
$ | 11,300 | $ | 2,913 | $ | 9,408 | $ | 11,277 | |||||
Mortgage Warehousing |
8,418 | 7,005 | 16,839 | 13,693 | |||||||||
Banking |
5,454 | 4,303 | 9,492 | 5,270 | |||||||||
Other |
(1,284 | ) | (1,447 | ) | (2,612 | ) | (1,857 | ) | |||||
| | | | | | | | | | | | | | |
Total |
$ | 23,888 | $ | 12,774 | $ | 33,127 | $ | 28,383 | |||||
| | | | | | | | | | | | | | |
| | | | | | | | | | | | | | |
| | | | | | | | | | | | | | |
Primary Factors We Use to Evaluate Our Business
As a financial institution, we manage and evaluate various aspects of both our results of operations and our financial condition. We evaluate the comparative levels and trends of the line items in our consolidated balance sheet and income statement as well as various financial ratios that are commonly used in our industry. We analyze these ratios and financial trends against our own historical performance, our budgeted performance and the financial condition and performance of comparable financial institutions in our region.
Results of operations.
In addition to net income, the primary factors we use to evaluate and manage our results of operations include net interest income, noninterest income and noninterest expense.
Net interest income. Net interest income represents interest income less interest expense. We generate interest income from interest (net of any servicing fees paid or costs amortized over the expected life of the loans) and fees received on interest-earning assets, including loans and investment securities and dividends on FHLBI stock we own. We incur interest expense from interest paid on interest-bearing liabilities, including interest-bearing deposits and borrowings. Since 2014, net interest income has been the most significant contributor to our revenues and net income. To evaluate net interest income, we measure and monitor: (a) yields on our loans and other interest-earning assets; (b) the costs of our deposits and other funding sources; (c) our net interest margin; and (d) the regulatory risk weighting associated with the assets. Net interest margin is calculated as the annualized net interest income divided by average interest-earning assets. Because noninterest-bearing sources of funds, such as noninterest-bearing deposits and shareholders' equity, also fund interest-earning assets, net interest margin includes the benefit of these noninterest-bearing sources.
Changes in market interest rates, the slope of the yield curve, and interest we earn on interest-earning assets or pay on interest-bearing liabilities, as well as the volume and types of interest-earning assets, interest-bearing and noninterest-bearing liabilities and shareholders' equity, usually have the largest impact on changes in our net interest spread, net interest margin and net interest income during a reporting period.
52
Noninterest Income. Noninterest income consists of, among other things: (a) gain on sale of loans; (b) loan servicing fees; (c) mortgage warehouse fees; and (d) other noninterest income.
Gain on sale of loans includes placement and origination fees, capitalized mortgage servicing rights, trading gains and losses, and other related income. Loan servicing fees are collected as payments are received for loans in the servicing portfolio. Fair value adjustments to the value of mortgage servicing rights are also included in noninterest income. Mortgage warehouse fees are collected as the funded loans are sold in the secondary market.
Noninterest expense. Noninterest expense includes, among other things: (a) salaries and employee benefits; (b) loan origination expenses; (c) occupancy and equipment expense; (d) professional fees; (e) FDIC insurance expense; (f) technology expense; and (g) other general and administrative expenses.
Salaries and employee benefits includes compensation, employee benefits and employment tax expenses for our personnel. Loan expenses include third party processing for mortgage warehouse financing activities and loan-related origination expenses. Occupancy expense includes depreciation expense on our owned properties, lease expense on our leased properties and other occupancy-related expenses. Equipment expense includes furniture, fixtures and equipment related expenses. Professional fees include legal, accounting, consulting and other outsourcing arrangements. FDIC insurance expense represents the assessments that we pay to the FDIC for deposit insurance. Technology expense includes data processing fees paid to our third-party data processing system provider and other data service providers. Other general and administrative expenses include expenses associated with travel, meals, training, supplies and postage. Noninterest expenses generally increase as we grow our business. Noninterest expenses have increased significantly over the past few years as we have grown organically, and as we have built out and modernized our operational infrastructure and implemented our plan to build an efficient, technology-driven mortgage banking operation with significant operational capacity for growth.
Financial Condition
The primary factors we use to evaluate and manage our financial condition are asset levels, liquidity, capital and asset quality.
Asset Levels. We manage our asset levels based upon forecasted closings or fundings within our business segments to ensure we have the necessary liquidity and capital to meet the required regulatory capital ratios. Each segment evaluates its funding needs by forecasting the fundings and sales of loans, communicating with customers on their projected funding needs, and reviewing its opportunities to add new customers.
Liquidity. We manage our liquidity based upon factors that include our amount of custodial and brokered deposits as a percentage of total deposits, the level of diversification of our funding sources, the allocation and amount of our deposits among deposit types, the short-term funding sources used to fund assets, the amount of non-deposit funding used to fund assets, the availability of unused funding sources, off-balance sheet obligations, the availability of assets to be readily converted into cash without a material loss on the investment, the amount of cash and cash equivalent securities we hold, the repricing characteristics and maturities of our assets when compared to the repricing characteristics of our liabilities and other factors.
Capital. We manage our regulatory capital based upon factors that include: (a) the level and quality of capital and our overall financial condition; (b) the trend and volume of problem assets; (c) the dollar amount of mortgage servicing rights as a percentage of capital; (d) the level and quality of earnings; (e) the risk exposures in our balance sheet; and (f) other factors. In addition, beginning in 2014 we have annually increased our capital through net income less dividends and equity issuances.
53
Asset Quality. We manage the diversification and quality of our assets based upon factors that include the level, distribution, severity and trend of problem, classified, delinquent, nonaccrual, nonperforming and restructured assets, the adequacy of our allowance for loan losses, or the allowance, the diversification and quality of loan and investment portfolios, the extent of counterparty risks, credit risk concentrations and other factors.
Recent Developments and Material Trends
Economic and Interest Rate Environment. The results of our operations are highly dependent on economic conditions, mortgage volumes, and market interest rates. Residential mortgage volumes fluctuate based on economic conditions, market interest rates, and the credit parameters set by the agencies. Since the recession ended in 2009, Economic growth has been modest, the real estate market continues to recover and unemployment rates in the U.S. and our primary markets have significantly improved. In December 2015, the Federal Reserve raised short-term interest rates for the first time in nine years with a 25 basis point increase and then raised rates again in December 2016, March 2017 and June 2017, each with additional 25 basis point increases. The Mortgage Bankers Association reported a decrease in residential volume of 4.2% for the six months ended June 30, 2017 compared to the six months ended June 30, 2016 and has forecasted a 14.0% decline in residential volume from $1.891 trillion in 2016 to $1.627 trillion in 2017. Forecasts for 2018 and 2019 are $1.588 and $1.640 trillion, respectively.
Regulatory Environment. We believe the most important trends affecting community banks in the United States over the foreseeable future will be related to heightened regulatory capital requirements, regulatory burdens generally, including the Dodd-Frank Act and the regulations thereunder, and interest margin compression. We expect that troubled community banks will continue to face significant challenges when attempting to raise capital. We also believe that heightened regulatory capital requirements will make it more difficult for even well-capitalized, healthy community banks to grow in their communities by taking advantage of opportunities in their markets that result as the economy improves. We believe these trends will favor community banks that have sufficient capital, a diversified business model and a strong deposit franchise.
General and Administrative Expenses. We expect to continue incurring increased noninterest expense attributable to general and administrative expenses related to building out and modernizing our operational infrastructure, marketing and other administrative expenses to execute our strategic initiatives, expenses to hire additional personnel and other costs required to continue our growth.
Allowance for Loan Losses. One of our key operating objectives has been, and continues to be, maintenance of an appropriate level of allowance for loan losses for probable incurred losses in our loan portfolio. The provision for loan losses recorded in prior years was primarily due to growth in our loan portfolio, as our historical loss rates remained very low. As we anticipate that our loan portfolio will continue to grow, we expect the provision to increase irrespective of any increases of problem loans in our portfolio.
2017 Third Quarter Update. We are currently in the process of preparing our consolidated financial results for the third quarter ended September 30, 2017 and, therefore, our actual results for that period are not yet available and are subject to change. However, based on our expectations, our 2017 third quarter net income will increase over our 2017 first quarter net income of $9.1 million but will be less than our 2017 second quarter net income of $14.8 million. Investors should look at our financial results on an annual basis and not necessarily on a quarterly basis. Our quarterly results tend to exhibit some level of variability, particularly related to non-interest income. Various factors impact our non-interest income resulting in net income being higher or lower from quarter-to-quarter. Our pro-forma return on average assets and pro-forma return on average tangible common equity have ranged from 1.24% to 2.89% and 19.86% to 34.96%, from 2012 through the latest twelve months ended June 30, 2017, respectively, see "Summary Historical Consolidated Data" and "Selected Historical Consolidated Data."
54
Comparison of Operating Results for the Six Months Ended June 30, 2017 and 2016
General. Net income for the six months ended June 30, 2017 was $23.9 million, an increase of $11.1 million, or 87.0%, over the net income of $12.8 million for the six months ended June 30, 2016. The increase was primarily due to a $5.4 million increase in net interest income and a $14.8 million increase in noninterest income, which were partially offset by a $2.7 million increase in non-interest expense and a $6.3 million increase in the provision for income taxes.
Interest Income. Interest income increased $9.1 million, or 27.9%, to $41.5 million for the six months ended June 30, 2017 from $32.4 million for the six months ended June 30, 2016. This increase was primarily attributable to a $6.7 million increase in interest on loans and loans held for sale, a $1.3 million increase in interest on trading securities, a $348,000 increase in interest on available-for-sale securities, and a $638,000 increase in interest on other interest-earning deposits, including FHLBI stock. The average balance of loans, including loans held for sale, during the six months ended June 30, 2017 increased $190.7 million, or 12.5%, to $1.7 billion from $1.5 billion for the six months ended June 30, 2016, while the average yield on loans increased 39 basis points to 4.08% for the six months ended June 30, 2017 compared to 3.69% for the six months ended June 30, 2016. The increase in loans and loans held for sale was due to the addition of Mortgage Warehousing segment customers resulting in warehouse fundings increasing 4.3% to $11.1 billion for the six months ended June 30, 2017 compared to $10.6 billion for the six months ended June 30, 2016. The increase in the average yield on loans was due to the overall increase in interest rates in the economy period to period. The average balance of trading securities increased $85.3 million, or 91.0%, to $179.1 million for the six months ended June 30, 2017 compared to $93.8 million for the six months ended June 30, 2016, while the average yield decreased four basis points to 3.18% for the six months ended June 30, 2017. The average balance of available-for-sale securities increased $61.6 million, or 21.6%, to $346.3 million for the six months ended June 30, 2017 compared to $284.8 million for the six months ended June 30, 2016, and the average yield increased one basis point to 1.12% for the six months ended June 30, 2017. The average balance of other interest-earning assets decreased $48.2 million, or 10.6%, to $405.2 million for the six months ended June 30, 2017 from $453.4 million for the six months ended June 30, 2016, while the average yield increased 39 basis points to 0.96% for the six months ended June 30, 2017.
Interest Expense. Total interest expense increased $3.6 million, or 42.0%, to $12.2 million for the six months ended June 30, 2017 compared to the six months ended June 30, 2016. Interest expense on deposits increased $3.6 million, or 71.6%, to $8.5 million for the six months ended June 30, 2017 from the six months ended June 30, 2016. The increase was primarily due to a 27 basis point increase in the average cost of interest-bearing deposits, to 0.92% for the six months ended June 30, 2017 from 0.65% for the same period in 2016, and an increase in the average balance of interest-bearing deposits of $323.1 million, or 20.9%, to $1.9 billion for the six months ended June 30, 2017. The increase was primarily due to the addition of deposits from existing Mortgage Warehousing segment customers. The increase in the cost of deposits was due to the overall increase in interest rates in the economy period to period. Interest expense on borrowings increased $63,000, or 1.7%, to $3.7 million for the six months ended June 30, 2017 from $3.6 million for the six months ended June 30, 2016. The increase was due primarily to a $2.2 million, or 3.7%, increase in the average balance outstanding period to period, which was partially offset by a 21 basis point decrease in the average cost of borrowings to 12.30% for the six months ended June 30, 2017 compared to 12.51% for the six months ended June 30, 2016. The terms of our $30.0 million subordinated debt include a variable interest rate equal to the one-month LIBOR rate plus an applicable margin. Additionally, the debt agreement provides for an additional interest payment of an amount equal to 49.0% of the earnings of our wholly owned subsidiary, NMF. As a result of this payment, the effective cost of borrowings increased from 3.46% and 3.13%, to 12.30% and 12.51% for the six months ended June 30, 2017 and 2016, respectively.
Net Interest Income. Net interest income increased $5.4 million, or 22.8%, to $29.3 million for the six months ended June 30, 2017 compared to the six months ended June 30, 2016. The increase was due
55
to a 19 basis point increase in our interest rate spread, to 1.87%, for the six months ended June 30, 2017 from 1.68% for the six months ended June 30, 2016, which was partially offset by a $36.0 million decrease in our net interest earning assets period to period. Our net interest margin increased to 2.23% for the six months ended June 30, 2017 from 2.03% for the six months ended June 30, 2016.
The following table presents, for the periods indicated, information about (i) average balances, the total dollar amount of interest income from interest-earning assets and the resultant average yields; (ii) average balances, the total dollar amount of interest expense on interest-bearing liabilities and the resultant average rates; (iii) net interest income; (iv) the interest rate spread; and (v) the net interest margin. Yields have been calculated on a pre-tax basis.
| |
Six Months Ended June 30, | ||||||||||||||||||
|---|---|---|---|---|---|---|---|---|---|---|---|---|---|---|---|---|---|---|---|
| |
2017 | 2016 | |||||||||||||||||
| (Dollars in thousands) |
Average Balance(1) |
Interest Inc / Exp |
Average Yield / Rate |
Average Balance(1) |
Interest Inc / Exp |
Average Yield / Rate |
|||||||||||||
| |
(unaudited) |
||||||||||||||||||
ASSETS |
|||||||||||||||||||
Interest bearing deposits and other |
$ | 405,188 | $ | 1,926 | 0.96 | % | $ | 453,421 | $ | 1,288 | 0.57 | % | |||||||
Securities available for sale |
346,316 | 1,916 | 1.12 | % | 284,766 | 1,568 | 1.11 | % | |||||||||||
Trading securities |
179,058 | 2,824 | 3.18 | % | 93,753 | 1,499 | 3.22 | % | |||||||||||
Loans and loans held for sale |
1,720,849 | 34,805 | 4.08 | % | 1,530,163 | 28,066 | 3.69 | % | |||||||||||
| | | | | | | | | | | | | | | | | | | | |
Total interest-earning assets |
2,651,411 | 41,471 | 3.15 | % | 2,362,103 | 32,421 | 2.76 | % | |||||||||||
| | | | | | | | | | | | | | | | | | | | |
Allowance for loan losses |
(6,580 | ) | (5,684 | ) | |||||||||||||||
Noninterest-earning assets |
106,992 | 76,271 | |||||||||||||||||
| | | | | | | | | | | | | | | | | | | | |
TOTAL ASSETS |
$ | 2,751,823 | $ | 2,432,690 | |||||||||||||||
| | | | | | | | | | | | | | | | | | | | |
| | | | | | | | | | | | | | | | | | | | |
| | | | | | | | | | | | | | | | | | | | |
LIABILITIES AND SHAREHOLDERS' EQUITY |
|||||||||||||||||||
Deposits |
|||||||||||||||||||
Interest bearing checking |
520,973 | 2,605 | 1.01 | %(4) | 291,892 | 862 | 0.59 | % | |||||||||||
Savings deposits |
313,294 | 394 | 0.25 | % | 270,293 | 165 | 0.12 | % | |||||||||||
Money market deposits |
846,721 | 4,728 | 1.13 | % | 643,170 | 3,060 | 0.96 | % | |||||||||||
Certificates of deposit |
186,639 | 784 | 0.85 | % | 339,181 | 873 | 0.52 | % | |||||||||||
| | | | | | | | | | | | | | | | | | | | |
Total deposits |
1,867,627 | 8,511 | 0.92 | % | 1,544,536 | 4,960 | 0.65 | % | |||||||||||
Borrowings |
60,733 | 3,705 | 12.30 | % | 58,566 | 3,642 | 12.51 | % | |||||||||||
| | | | | | | | | | | | | | | | | | | | |
Total interest bearing liabilities |
1,928,360 | 12,216 | 1.28 | % | 1,603,102 | 8,602 | 1.08 | % | |||||||||||
| | | | | | | | | | | | | | | | | | | | |
Noninterest bearing deposits |
576,624 | 654,050 | |||||||||||||||||
Noninterest-bearing liabilities |
29,717 | 20,902 | |||||||||||||||||
| | | | | | | | | | | | | | | | | | | | |
Total liabilities |
2,534,701 | 2,278,054 | |||||||||||||||||
| | | | | | | | | | | | | | | | | | | | |
Total shareholders' equity |
217,122 | 154,636 | |||||||||||||||||
| | | | | | | | | | | | | | | | | | | | |
TOTAL LIABILITIES AND SHAREHOLDERS' EQUITY |
$ | 2,751,823 | $ | 2,432,690 | |||||||||||||||
| | | | | | | | | | | | | | | | | | | | |
| | | | | | | | | | | | | | | | | | | | |
| | | | | | | | | | | | | | | | | | | | |
Net interest spread(2) |
1.87 | % | 1.68 | % | |||||||||||||||
Net interest-earning assets |
$ |
723,051 |
$ |
759,001 |
|||||||||||||||
| | | | | | | | | | | | | | | | | | | | |
| | | | | | | | | | | | | | | | | | | | |
| | | | | | | | | | | | | | | | | | | | |
Net interest income |
$ | 29,255 | $ | 23,819 | |||||||||||||||
| | | | | | | | | | | | | | | | | | | | |
| | | | | | | | | | | | | | | | | | | | |
| | | | | | | | | | | | | | | | | | | | |
Net interest margin(3) |
2.23 | % | 2.03 | % | |||||||||||||||
| | | | | | | | | | | | | | | | | | | | |
| | | | | | | | | | | | | | | | | | | | |
| | | | | | | | | | | | | | | | | | | | |
Average interest-earning assets to average interest-bearing liabilities |
137.50 | % | 147.35 | % | |||||||||||||||
| | | | | | | | | | | | | | | | | | | | |
| | | | | | | | | | | | | | | | | | | | |
| | | | | | | | | | | | | | | | | | | | |
- (1)
- Average
balances are average daily balances.
- (2)
- Represents
the average rate earned on interest-earning assets minus the average rate paid on interest-bearing liabilities.
- (3)
- Represents
net interest income (annualized) divided by total average earning assets.
- (4)
- Reflects increases in LIBOR on mortgage custodial deposits.
56
Increases and decreases in interest income and interest expense result from changes in average balances (volume) of interest-earning assets and interest-bearing liabilities, as well as changes in weighted average interest rates. The following table sets forth the effects of changing rates and volumes on our net interest income during the periods shown. Information is provided with respect to (i) effects on interest income attributable to changes in volume (changes in volume multiplied by prior rate) and (ii) effects on interest income attributable to changes in rate (changes in rate multiplied by prior volume). Changes applicable to both volume and rate have been allocated to volume. Yields have been calculated on a pre-tax basis. The table below summarizes the increases and decreases in interest income and interest expense resulting from changes in average balances (volume) and changes in average interest rates:
| |
Six Months ended June 30, 2017 compared to Six Months ended June 30, 2016 |
|||||||||
|---|---|---|---|---|---|---|---|---|---|---|
| |
Increase (Decrease) Due to |
|
||||||||
| (Dollars in thousands) |
Volume | Rate | Total | |||||||
| |
(unaudited) |
|||||||||
Interest income |
||||||||||
Interest bearing deposits and other |
$ | (390 | ) | $ | 1,028 | $ | 638 | |||
Securities available for sale |
336 | 12 | 348 | |||||||
Trading securities |
1,374 | (49 | ) | 1,325 | ||||||
Loans and loans held for sale |
3,645 | 3,094 | 6,739 | |||||||
| | | | | | | | | | | |
Total interest income |
4,965 | 4,085 | 9,050 | |||||||
| | | | | | | | | | | |
Interest expense |
||||||||||
Deposits |
||||||||||
Interest bearing checking |
923 | 820 | 1,743 | |||||||
Savings deposits |
30 | 199 | 229 | |||||||
Money market deposits |
1,070 | 598 | 1,668 | |||||||
Certificates of deposit |
(962 | ) | 873 | (89 | ) | |||||
| | | | | | | | | | | |
|
1,061 | 2,490 | 3,551 | |||||||
Borrowing |
209 | (146 | ) | 63 | ||||||
| | | | | | | | | | | |
Total interest expense |
1,270 | 2,344 | 3,614 | |||||||
| | | | | | | | | | | |
Net interest income |
$ | 3,695 | $ | 1,741 | $ | 5,436 | ||||
| | | | | | | | | | | |
| | | | | | | | | | | |
| | | | | | | | | | | |
Provision for Loan Losses. We recorded a provision for loan losses of $480,000 for each of the six month periods ended June 30, 2017 and 2016. The allowance for loan losses was $6.9 million, or 0.64% of total loans, at June 30, 2017, compared to $5.9 million, or 0.68% of total loans, at June 30, 2016. Total nonperforming loans were $3.2 million at June 30, 2017, compared to $2.2 million at June 30, 2016. Classified (substandard, doubtful and loss) loans were $5.3 million at June 30, 2017 and $5.2 million at June 30, 2016, and total loans past due greater than 30 days were $7.8 million and $2.6 million at those respective dates. We had net recoveries of $135,000 during the six months ended June 30, 2017 and no charge offs or recoveries during the six months ended June 30, 2016. As a percentage of nonperforming loans, the allowance for loan losses was 213.3% at June 30, 2017 compared to 268.9% at June 30, 2016.
Non-Interest Income. Non-interest income increased $14.8 million, or 148.4%, to $24.7 million for the six months ended June 30, 2017 from $10.0 million for the six months ended June 30, 2016. The increase was primarily due to an increase of $14.0 million in gain on sale of loans, a $293,000 increase
57
in loan servicing fees, an $80,000 increase in mortgage warehouse fees and a $394,000 increase in other income. The gain on sale of loans amounted to $20.6 million during the six months ended June 30, 2017, compared to $6.6 million in the year earlier period, an increase of 211.8%, due primarily to an increase in the volume of multi-family rental real estate loan sales in the secondary market. The volume of loan originations was lower during the six months ended June 30, 2016, within the Multi-family Mortgage Banking segment, as borrowers delayed closings anticipating favorable HUD regulation changes that became effective in the second quarter of 2016. The increase in loan servicing fees was due primarily to a $1.6 billion, or 34.8%, increase in the volume of loans serviced from June 30, 2016 to June 30, 2017.
Non-Interest Expense. Non-interest expense increased $2.7 million, or 22.5%, to $14.9 million for the six months ended June 30, 2017 compared to $12.2 million for the six months ended June 30, 2016. The increase was due primarily to a $2.8 million, or 44.6%, increase in salaries and employee benefits. The increase in salaries and employee benefits was due primarily to an increase in staffing levels and loan commission expenses as a result of our increased level of multi-family loan origination and sales volume. We added 24 employees, including 9 in Merchants Mortgage to support growth plans, between June 30, 2016 and June 30, 2017.
Income Taxes. Income tax expense increased $6.3 million, or 76.0%, to $14.7 million for the six months ended June 30, 2017 from $8.4 million for the six months ended June 30, 2016. The increase was due primarily to the increase in pretax income period to period. The effective tax rate was 38.1% for the six months ended June 30, 2017 and 39.5% for the six months ended June 30, 2016.
Comparison of Operating Results for the Years Ended December 31, 2016 and 2015
General. Net income totaled $33.1 million for the year ended December 31, 2016, an increase of $4.7 million, or 16.7%, compared to net income of $28.4 million for the year ended December 31, 2015. The increase in net income for fiscal 2016 resulted primarily from an increase of $11.9 million in net interest income and an increase of $1.5 million in noninterest income, which were partially offset by an increase of $5.8 million in noninterest expenses and an increase of $2.9 million in the provision for income taxes.
Interest Income. Interest income increased $16.6 million, or 29.5%, to $72.9 million for the year ended December 31, 2016 from $56.3 million for the year ended December 31, 2015. The increase resulted primarily from a $13.6 million, or 27.7%, increase in interest on loans and loans held for sale, a $937,000, or 26.2%, increase in interest on trading securities, an $888,000, or 37.6%, increase in interest on available-for-sale securities and a $1.2 million, or 86.6% increase in interest on other interest-earning assets, and dividends on FHLBI stock. The increase in interest on loans and loans held for sale was due primarily to a $378.1 million, or 28.6%, increase in the average balance of loans and loans held for sale outstanding year to year, partially offset by a three basis point decline in the average yield, to 3.68% for 2016 from 3.71% for 2015. The average balance increased primarily due to an increase in Mortgage Warehousing fundings of warehouse lines of credit and loan participations from $20.1 billion in 2015 to $24.8 billion in 2016 and a $213.1 million increase in the average balances in the Banking segment due to higher residential and multi-family originations. The increase in interest on trading securities was due primarily to a $40.6 million, or 37.8%, increase in the average balance outstanding, to $147.8 million for 2016 from $107.2 million for 2015, which was partially offset by a 28 basis point decrease in the average yield to 3.06% for 2016 from 3.34% for 2015. The increase in interest on available-for-sale securities was due primarily to a $64.6 million, or 27.7%, increase in the average balance outstanding, to $297.9 million for 2016 from $233.3 million for 2015, while the average yield increased by eight basis points to 1.09% for both 2016 from 1.01% for 2015. The increase in interest on other interest-earning assets was due primarily to a $34.3 million, or 8.1%, increase in the
58
average balance outstanding, to $458.1 million for 2016 from $423.8 million for 2015, and a 24 basis point increase in the average yield, to 0.57% for 2016.
Interest Expense. Interest expense increased $4.7 million, or 32.7%, to $19.0 million for the year ended December 31, 2016 from $14.3 million for the year ended December 31, 2015. Interest expense on deposits increased $4.3 million, or 58.8%, to $11.7 million for the year ended December 31, 2016 from $7.3 million for the year ended December 31, 2015. The increase was primarily due to an increase of $446.7 million, or 35.8%, in the average balance of interest-bearing deposits to $1.7 billion for 2016 from $1.2 billion for 2015, and an increase of 10 basis points in the average cost of interest-bearing deposits to 0.69% for the year ended December 31, 2016 from 0.59% for the year ended December 31, 2015. The increase in average deposits was primarily due to an increase in mortgage custodial deposits in the Mortgage Warehousing segment. Interest expense on borrowings increased $361,000, or 5.2%, to $7.3 million for the year ended December 31, 2016 from $6.9 million for the year ended December 31, 2015. The average balance of borrowings increased $1.8 million to $58.3 million for the year ended December 31, 2016 from $56.6 million for the year ended December 31, 2015, while the average cost of these borrowings increased 25 basis points to 12.52% from 12.27% year to year. The terms of our's $30.0 million subordinated debt include a variable interest rate equal to the one-month LIBOR rate plus an applicable margin. Additionally, the debt agreement provides for payment by us of an amount equal to 49.0% of the earnings of our wholly owned subsidiary, NMF. As a result of this payment, the effective cost of borrowings increased from 3.21% and 2.86%, to 12.52% and 12.27% for the years ended December 31, 2016 and 2015, respectively.
Net Interest Income. Net interest income increased $11.9 million, or 28.3%, to $54.0 million for the year ended December 31, 2016 from $42.1 million for the year ended December 31, 2015. The increase resulted from a $69.0 million increase in net interest-earning assets to $850.4 million for 2016 from $781.4 million for 2015, and an increase of 12 basis points in the interest rate spread to 1.72% for 2016 from 1.60% for 2015. The net interest margin increased five basis points to 2.07% for 2016 from 2.02% for 2015.
The following table presents, for the periods indicated, information about (i) average balances, the total dollar amount of interest income from interest-earning assets and the resultant average yields; (ii) average balances, the total dollar amount of interest expense on interest-bearing liabilities and the
59
resultant average rates; (iii) net interest income; (iv) the interest rate spread; and (v) the net interest margin. Yields have been calculated on a pre-tax basis.
| |
Year Ended December 31, | ||||||||||||||||||
|---|---|---|---|---|---|---|---|---|---|---|---|---|---|---|---|---|---|---|---|
| |
2016 | 2015 | |||||||||||||||||
| (Dollars in thousands) |
Average Balance(1) |
Interest Inc / Exp |
Average Yield / Rate |
Average Balance(1) |
Interest Inc / Exp |
Average Yield / Rate |
|||||||||||||
ASSETS |
|||||||||||||||||||
Interest bearing deposits and other |
$ | 458,060 | $ | 2,611 | 0.57 | % | $ | 423,765 | $ | 1,399 | 0.33 | % | |||||||
Securities available for sale |
297,874 | 3,249 | 1.09 | % | 233,312 | 2,361 | 1.01 | % | |||||||||||
Trading securities |
147,782 | 4,516 | 3.06 | % | 107,214 | 3,579 | 3.34 | % | |||||||||||
Loans and loans held for sale |
1,697,957 | 62,563 | 3.68 | % | 1,319,834 | 49,006 | 3.71 | % | |||||||||||
| | | | | | | | | | | | | | | | | | | | |
Total interest-earning assets |
2,601,673 | 72,939 | 2.80 | % | 2,084,125 | 56,345 | 2.70 | % | |||||||||||
| | | | | | | | | | | | | | | | | | | | |
Allowance for loan losses |
(5,892 | ) | (4,964 | ) | |||||||||||||||
Noninterest-earning assets |
83,890 | 71,501 | |||||||||||||||||
| | | | | | | | | | | | | | | | | | | | |
TOTAL ASSETS |
$ | 2,679,671 | $ | 2,150,662 | |||||||||||||||
| | | | | | | | | | | | | | | | | | | | |
| | | | | | | | | | | | | | | | | | | | |
| | | | | | | | | | | | | | | | | | | | |
LIABILITIES AND SHAREHOLDERS' EQUITY |
|||||||||||||||||||
Deposits |
|||||||||||||||||||
Interest bearing checking |
$ | 397,767 | 2,796 | 0.70 | %(4) | $ | 196,738 | 486 | 0.25 | % | |||||||||
Savings deposits |
278,919 | 356 | 0.13 | % | 243,841 | 306 | 0.13 | % | |||||||||||
Money market deposits |
673,643 | 6,481 | 0.96 | % | 540,028 | 5,202 | 0.96 | % | |||||||||||
Certificates of deposit |
342,599 | 2,030 | 0.59 | % | 265,577 | 1,352 | 0.51 | % | |||||||||||
| | | | | | | | | | | | | | | | | | | | |
Total Deposits |
1,692,928 | 11,663 | 0.69 | % | 1,246,184 | 7,346 | 0.59 | % | |||||||||||
Borrowings |
58,335 | 7,305 | 12.52 | % | 56,580 | 6,944 | 12.27 | % | |||||||||||
| | | | | | | | | | | | | | | | | | | | |
Total interest bearing liabilities |
1,751,263 | 18,968 | 1.08 | % | 1,302,764 | 14,290 | 1.10 | % | |||||||||||
| | | | | | | | | | | | | | | | | | | | |
Noninterest bearing deposits |
726,811 | 703,944 | |||||||||||||||||
Noninterest-bearing liabilities |
24,227 | 18,491 | |||||||||||||||||
| | | | | | | | | | | | | | | | | | | | |
Total liabilities |
2,502,301 | 2,025,199 | |||||||||||||||||
Shareholders' Equity |
177,370 | 125,463 | |||||||||||||||||
| | | | | | | | | | | | | | | | | | | | |
TOTAL LIABILITIES AND SHAREHOLDERS' EQUITY |
$ | 2,679,671 | $ | 2,150,662 | |||||||||||||||
| | | | | | | | | | | | | | | | | | | | |
| | | | | | | | | | | | | | | | | | | | |
| | | | | | | | | | | | | | | | | | | | |
Net interest spread(2) |
1.72 | % | 1.60 | % | |||||||||||||||
| | | | | | | | | | | | | | | | | | | | |
| | | | | | | | | | | | | | | | | | | | |
| | | | | | | | | | | | | | | | | | | | |
Net interest-earning assets |
$ | 850,410 | $ | 781,361 | |||||||||||||||
| | | | | | | | | | | | | | | | | | | | |
| | | | | | | | | | | | | | | | | | | | |
| | | | | | | | | | | | | | | | | | | | |
Net interest income |
$ | 53,971 | $ | 42,055 | |||||||||||||||
| | | | | | | | | | | | | | | | | | | | |
| | | | | | | | | | | | | | | | | | | | |
| | | | | | | | | | | | | | | | | | | | |
Net interest margin(3) |
2.07 | % | 2.02 | % | |||||||||||||||
| | | | | | | | | | | | | | | | | | | | |
| | | | | | | | | | | | | | | | | | | | |
| | | | | | | | | | | | | | | | | | | | |
Average interest-earning assets to average interest-bearing liabilities |
148.56 | % | 159.98 | % | |||||||||||||||
| | | | | | | | | | | | | | | | | | | | |
| | | | | | | | | | | | | | | | | | | | |
| | | | | | | | | | | | | | | | | | | | |
- (1)
- Average
balances are average daily balances.
- (2)
- Represents
the average rate earned on interest-earning assets minus the average rate paid on interest-bearing liabilities.
- (3)
- Represents
net interest income (annualized) divided by total average earning assets.
- (4)
- Reflects increases in LIBOR on mortgage custodial deposits.
60
Increases and decreases in interest income and interest expense result from changes in average balances (volume) of interest-earning assets and interest-bearing liabilities, as well as changes in weighted average interest rates. The following table sets forth the effects of changing rates and volumes on our net interest income during the periods shown. Information is provided with respect to (i) effects on interest income attributable to changes in volume (changes in volume multiplied by prior rate) and (ii) effects on interest income attributable to changes in rate (changes in rate multiplied by prior volume). Changes applicable to both volume and rate have been allocated to volume. Yields have been calculated on a pre-tax basis. The tables below summarize the increases and decreases in interest income and interest expense resulting from changes in average balances (volume) and changes in average interest rates:
| |
Year ended December 31, 2016 compared to Year ended December 31, 2015 |
|||||||||
|---|---|---|---|---|---|---|---|---|---|---|
| |
Increase (Decrease) Due to |
|
||||||||
| (Dollars in thousands) |
Volume | Rate | Total | |||||||
Interest income |
||||||||||
Interest bearing deposits and other |
$ | 121 | $ | 1,091 | $ | 1,212 | ||||
Securities available for sale |
693 | 195 | 888 | |||||||
Trading securities |
1,261 | (324 | ) | 937 | ||||||
Loans and loans held for sale |
13,935 | (378 | ) | 13,557 | ||||||
| | | | | | | | | | | |
Total interest income |
16,010 | 584 | 16,594 | |||||||
| | | | | | | | | | | |
Interest expense |
||||||||||
Deposits |
||||||||||
Interest bearing checking |
823 | 1,487 | 2,310 | |||||||
Savings deposits |
45 | 5 | 50 | |||||||
Money market deposits |
1,285 | (6 | ) | 1,279 | ||||||
Certificates of deposit |
433 | 245 | 678 | |||||||
| | | | | | | | | | | |
Total Deposits |
2,586 | 1,731 | 4,317 | |||||||
Borrowings |
218 | 143 | 361 | |||||||
| | | | | | | | | | | |
Total interest expense |
2,804 | 1,874 | 4,678 | |||||||
| | | | | | | | | | | |
Net interest income |
$ | 13,206 | $ | (1,290 | ) | $ | 11,916 | |||
| | | | | | | | | | | |
| | | | | | | | | | | |
| | | | | | | | | | | |
Provision for Loan Losses. We recorded a $960,000 provision for loan losses for each of the years ended December 31, 2016 and 2015. The allowance for loan losses was $6.3 million, or 0.66% of total loans, at December 31, 2016, compared to $5.4 million, or 0.71% of total loans, at December 31, 2015. Total nonperforming loans were $1.9 million at December 31, 2016, compared to $887,000 at December 31, 2015. Classified (substandard, doubtful and loss) loans were $5.5 million at December 31, 2016, compared to $2.9 million at December 31, 2015, and total loans past due greater than 30 days were $4.2 million and $2.4 million at December 31, 2016 and 2015, respectively. The Bank had no net charge-offs or recoveries during 2016, and net recoveries of $4,000 during 2015. As a percentage of nonperforming loans, the allowance for loan losses was 331.2% at December 31, 2016 compared to 611.3% at December 31, 2015.
Non-Interest Income. Non-interest income increased $1.5 million, or 5.5%, to $28.5 million for the year ended December 31, 2016 from $27.0 million for the year ended December 31, 2015. The increase was primarily due to a $1.8 million increase in mortgage warehouse fees, which was partially offset by a $556,000, or 66.5%, decrease in loan servicing fees. The increase in mortgage warehouse fees was due primarily to a 23.1%, increase in funding volumes of residential participations and warehouse lines of
61
credit. The funded volume of residential participations and warehouse lines of credit increased from $20.1 billion for the year ended December 31, 2015 to $24.8 billion for the year ended December 31, 2016. The decrease in net loan servicing fees was due primarily to a decline in the fair value of mortgage servicing rights at December 31, 2016, compared to December 31, 2015. The Bank accounts for mortgage servicing rights at fair value. Fluctuations in fair value, based upon periodic appraisals performed by independent third party specialists, are recorded to the consolidated financial statements as an adjustment to the carrying value of the mortgage servicing rights asset and recognized in the income statement as a component of noninterest income.
Non-Interest Expense. Non-interest expense increased $5.8 million, or 27.7%, to $26.7 million for the year ended December 31, 2016 compared to $20.9 million for the year ended December 31, 2015. Salaries and employee benefits increased $2.4 million, or 19.7%, to $14.3 million during the year ended December 31, 2016 compared to the year ended December 31, 2015; loan expenses increased $1.5 million, or 55.4%, to $4.3 million for 2016 compared to 2015; professional fees increased $623,000, or 92.3%, to $1.3 million for 2016 from $675,000 for 2015; and other expenses increased $857,000, or 34.0%, to $3.4 million for 2016 from $2.5 million for 2015. The increase in salaries and employee benefits was due primarily to an increase in staffing levels as a result of our growth. We added 17 full-time equivalent positions during the year ended December 31, 2016. The increase in loan expenses was due to the increased loan origination volume year to year. The increase in technology expense was due primarily to costs associated with the implementation and use of new wire transfer software during 2016, which increased efficiencies and enhanced internal controls at our Mortgage Warehousing segment noted above. The increase in professional expense was due primarily to an increase in legal expense related to loan related litigation, and an increase in audit, accounting, consulting and supervisory examination fees due to our overall growth.
Income Taxes. Income tax expense increased $2.9 million, or 15.3%, to $21.7 million for the year ended December 31, 2016 from $18.8 million for the year ended December 31, 2015. The increase resulted from the increase in pretax income of $7.6 million, or 16.1% during 2016 as compared to 2015. The effective tax rate was 39.5% and 39.8% for the years ended December 31, 2016 and 2015, respectively.
Operating Segment Analysis
Our reportable segments are Multi-family Mortgage Banking, Mortgage Warehousing and Banking. As discussed in Note 23 of our Consolidated Financial Statements included elsewhere in this prospectus, our reportable segments have been determined based upon their business processes and economic characteristics. This determination also gave consideration to the structure and management of various product lines.
The Multi-family Mortgage Banking segment originates and services predominantly government sponsored mortgages for multi-family and healthcare facilities. The Mortgage Warehousing segment funds agency eligible residential loans from origination or purchase to sale in the secondary market, as well as commercial loans to non-depository financial institutions. The Banking segment provides a wide range of financial products and services to consumers and businesses, including commercial, commercial real estate, mortgage and other consumer loan products; letters of credit; and various types of deposit products, including checking, savings and time deposit accounts. The Other item presented in Note 23 of our Consolidated Financial Statements included elsewhere in this prospectus includes general and administrative expenses for provision of services to all segments, internal funds transfer pricing offsets resulting from allocations to or from the other segments, certain elimination entries, and investments in qualified affordable housing limited partnerships.
Our segment financial information was compiled utilizing the accounting policies described in Note 1, "Summary of Significant Accounting Policies," and Note 23, "Segment Information," of the
62
Notes to Consolidated Financial Statements included elsewhere in this prospectus. As a result, reported segments and the financial information of the reported segments are not necessarily comparable with similar information reported by other financial institutions. Furthermore, changes in management structure or allocation methodologies and procedures may result in future changes to previously reported segment financial data. Transactions between segments consist primarily of borrowed funds. Intersegment interest expense is allocated to the Mortgage Warehousing and Banking segments based on the Bank's cost of funds. The provision for loan losses is allocated based on information included in our allowance for loan losses analysis and specific loan data for each segment.
The following tables present our primary operating results for our operating segments for the six-month periods ended June 30, 2017 and 2016.
63
| (Dollars in thousands) |
Multi-family Mortgage Banking |
Mortgage Warehousing |
Banking | Other | Total | |||||||||||
|---|---|---|---|---|---|---|---|---|---|---|---|---|---|---|---|---|
| |
(Unaudited) |
|||||||||||||||
Six Months Ended June 30, 2017 |
||||||||||||||||
Interest Income |
||||||||||||||||
Loans held for sale |
$ | — | $ | 15,967 | $ | — | $ | — | $ | 15,967 | ||||||
Mortgage warehouse lines of credit |
— | 4,334 | — | — | 4,334 | |||||||||||
Residential real estate |
— | — | 4,975 | — | 4,975 | |||||||||||
Multi-family residential real estate |
— | — | 5,131 | — | 5,131 | |||||||||||
Commercial and commercial real estate |
— | 787 | 2,210 | — | 2,997 | |||||||||||
Agricultural production and real estate |
— | — | 1,051 | — | 1,051 | |||||||||||
Consumer and margin loans |
142 | 11 | 197 | — | 350 | |||||||||||
Investment securities and other |
37 | 1,413 | 5,216 | — | 6,666 | |||||||||||
| | | | | | | | | | | | | | | | | |
Total interest income |
179 | 22,512 | 18,780 | — | 41,471 | |||||||||||
Interest Expense |
||||||||||||||||
Deposits |
— | 2,428 | 6,083 | — | 8,511 | |||||||||||
Internal funds transfer charge |
— | 337 | 212 | (549 | ) | — | ||||||||||
Borrowings |
— | 3,316 | 47 | 342 | 3,705 | |||||||||||
| | | | | | | | | | | | | | | | | |
Total interest expense |
— | 6,081 | 6,342 | (207 | ) | 12,216 | ||||||||||
| | | | | | | | | | | | | | | | | |
Net interest income |
179 | 16,431 | 12,438 | 207 | 29,255 | |||||||||||
Provision for loan losses |
— | 405 | 75 | — | 480 | |||||||||||
| | | | | | | | | | | | | | | | | |
Net interest income after provision for loan losses |
179 | 16,026 | 12,363 | 207 | 28,775 | |||||||||||
Noninterest income |
||||||||||||||||
Gain on sale of loans |
20,064 | — | 545 | — | 20,609 | |||||||||||
Loan servicing fees |
2,384 | — | — | — | 2,384 | |||||||||||
Warehouse fee income |
— | 1,258 | — | — | 1,258 | |||||||||||
Other income |
— | 45 | 421 | — | 466 | |||||||||||
| | | | | | | | | | | | | | | | | |
Total noninterest income |
22,448 | 1,303 | 966 | — | 24,717 | |||||||||||
Noninterest expense |
||||||||||||||||
Salaries and employee benefits |
3,497 | 943 | 2,946 | 1,681 | 9,067 | |||||||||||
Loan expenses |
— | 1,780 | 173 | — | 1,953 | |||||||||||
Occupancy and equipment |
189 | 92 | 363 | 110 | 754 | |||||||||||
Professional fees |
106 | 208 | 147 | 69 | 530 | |||||||||||
Deposit insurance |
— | 137 | 337 | — | 474 | |||||||||||
Technology expense |
27 | 197 | 275 | 7 | 506 | |||||||||||
Other expense |
553 | 373 | 277 | 415 | 1,618 | |||||||||||
| | | | | | | | | | | | | | | | | |
Noninterest expense |
4,372 | 3,730 | 4,518 | 2,282 | 14,902 | |||||||||||
| | | | | | | | | | | | | | | | | |
Income before income taxes |
18,255 | 13,599 | 8,811 | (2,075 | ) | 38,590 | ||||||||||
Income taxes |
6,955 | 5,181 | 3,357 | (791 | ) | 14,702 | ||||||||||
| | | | | | | | | | | | | | | | | |
Net income |
$ | 11,300 | $ | 8,418 | $ | 5,454 | $ | (1,284 | ) | $ | 23,888 | |||||
| | | | | | | | | | | | | | | | | |
| | | | | | | | | | | | | | | | | |
| | | | | | | | | | | | | | | | | |
Total assets |
$ | 117,862 | $ | 1,288,717 | $ | 1,671,054 | $ | 13,867 | $ | 3,091,500 | ||||||
| | | | | | | | | | | | | | | | | |
| | | | | | | | | | | | | | | | | |
| | | | | | | | | | | | | | | | | |
64
| (Dollars in thousands) |
Multi-family Mortgage Banking |
Mortgage Warehousing |
Banking | Other | Total | |||||||||||
|---|---|---|---|---|---|---|---|---|---|---|---|---|---|---|---|---|
| |
(Unaudited) |
|||||||||||||||
Six Months Ended June 30, 2016 |
||||||||||||||||
Interest Income |
||||||||||||||||
Loans held for sale |
$ | — | $ | 13,091 | $ | — | $ | — | $ | 13,091 | ||||||
Mortgage warehouse lines of credit |
— | 4,838 | — | — | 4,838 | |||||||||||
Residential real estate |
— | — | 3,852 | — | 3,852 | |||||||||||
Multi-family residential real estate |
— | — | 2,858 | — | 2,858 | |||||||||||
Commercial and commercial real estate |
— | 581 | 1,324 | — | 1,905 | |||||||||||
Agricultural production and real estate |
— | — | 1,284 | — | 1,284 | |||||||||||
Consumer and margin loans |
62 | 11 | 165 | — | 238 | |||||||||||
Investment securities and other |
3 | 870 | 3,482 | — | 4,355 | |||||||||||
| | | | | | | | | | | | | | | | | |
Total interest income |
65 | 19,391 | 12,965 | — | 32,421 | |||||||||||
Interest Expense |
||||||||||||||||
Deposits |
— | 930 | 4,030 | — | 4,960 | |||||||||||
Internal funds transfer charge |
— | 967 | (1,408 | ) | 441 | — | ||||||||||
Borrowings |
— | 3,320 | 34 | 288 | 3,642 | |||||||||||
| | | | | | | | | | | | | | | | | |
Total interest expense |
— | 5,217 | 2,656 | 729 | 8,602 | |||||||||||
| | | | | | | | | | | | | | | | | |
Net interest income |
65 | 14,174 | 10,309 | (729 | ) | 23,819 | ||||||||||
Provision for loan losses |
— | 286 | 194 | — | 480 | |||||||||||
| | | | | | | | | | | | | | | | | |
Net interest income after provision for loan losses |
65 | 13,888 | 10,115 | (729 | ) | 23,339 | ||||||||||
Noninterest income |
||||||||||||||||
Gain on sale of loans |
5,799 | — | 811 | — | 6,610 | |||||||||||
Loan servicing fees |
2,091 | — | — | — | 2,091 | |||||||||||
Warehouse fee income |
— | 1,178 | — | — | 1,178 | |||||||||||
Other income |
— | — | 72 | — | 72 | |||||||||||
| | | | | | | | | | | | | | | | | |
Total noninterest income |
7,890 | 1,178 | 883 | — | 9,951 | |||||||||||
Noninterest expense |
||||||||||||||||
Salaries and employee benefits |
2,363 | 884 | 2,247 | 777 | 6,271 | |||||||||||
Loan expenses |
(3 | ) | 1,636 | 273 | — | 1,906 | ||||||||||
Occupancy and equipment |
141 | 81 | 338 | 112 | 672 | |||||||||||
Professional fees |
61 | 195 | 94 | 389 | 739 | |||||||||||
Deposit insurance |
— | 177 | 413 | — | 590 | |||||||||||
Technology expense |
9 | 149 | 252 | 11 | 421 | |||||||||||
Other expense |
566 | 359 | 265 | 374 | 1,564 | |||||||||||
| | | | | | | | | | | | | | | | | |
Noninterest expense |
3,137 | 3,481 | 3,882 | 1,663 | 12,163 | |||||||||||
| | | | | | | | | | | | | | | | | |
Income before income taxes |
4,818 | 11,585 | 7,116 | (2,392 | ) | 21,127 | ||||||||||
Income taxes |
1,905 | 4,580 | 2,813 | (945 | ) | 8,353 | ||||||||||
| | | | | | | | | | | | | | | | | |
Net income |
$ | 2,913 | $ | 7,005 | $ | 4,303 | $ | (1,447 | ) | $ | 12,774 | |||||
| | | | | | | | | | | | | | | | | |
| | | | | | | | | | | | | | | | | |
| | | | | | | | | | | | | | | | | |
Total assets |
$ | 92,749 | $ | 1,138,638 | $ | 1,271,277 | $ | 4,310 | $ | 2,506,974 | ||||||
| | | | | | | | | | | | | | | | | |
| | | | | | | | | | | | | | | | | |
| | | | | | | | | | | | | | | | | |
65
Multi-family Mortgage Banking. The Multi-family Mortgage Banking segment reported net income for the six months ended June 30, 2017, of $11.3 million, an increase of $8.4 million, or 287.9%, over the $2.9 million reported for the six months ended June 30, 2016. The increase was comprised primarily of a $14.6 million increase in noninterest income, primarily gain on sale of loans and loan servicing fees, as the volume of loans originated for sale in the secondary market increased by $397.7 million, or 305.6%, to $527.9 million for the six months ended June 30, 2017 compared to the six months ended June 30, 2016. The volume in the six months ended June 30, 2016 was lower than other periods in this segment, as borrowers delayed closings anticipating favorable HUD regulation changes that became effective in the second quarter of 2016. This increase in loan volume contributed to a $1.6 billion increase in the portfolio of loans serviced as of June 30, 2017, compared to June 30, 2016, and as a result loan servicing fees increased $293,000, or 14.0%, for the six months ended June 30, 2017 compared to the same period in 2016. The $13.4 million increase in pretax income resulted in a $5.1 million increase in income taxes expense.
Mortgage Warehousing. The Mortgage Warehousing segment reported net income for the six months ended June 30, 2017, of $8.4 million, an increase of $1.4 million, or 20.2%, over the $7.0 million reported for the six months ended June 30, 2016. The increase was comprised primarily of a $2.3 million, or 15.9%, increase in net interest income, due primarily to an increase in the average loan yield. The volume of loans originated during the six months ended June 30, 2017 amounted to $11.1 billion, an increase of $453.8 million, or 4.3%, over the same period in 2016. The increase in net interest income was partially offset by a $249,000 increase in noninterest expenses, primarily loan expenses, which increased 8.8% in connection with the increased volume, and a $601,000 increase in income taxes.
Banking. The Banking segment reported net income for the six months ended June 30, 2017, of $5.5 million, an increase of $1.2 million, or 26.7%, over the $4.3 million reported for the six months ended June 30, 2016. The increase was comprised primarily of a $2.1 million increase in net interest income, due primarily to an increase in both the average loan balance outstanding and the average yield on loans. The increase in net interest income was partially offset by a $699,000 increase in salaries and employee benefits. The Banking segment's personnel increased 13 employees for the six months ended June 30, 2017 compared to the same period in 2016, due primarily to the need to support growth in Merchants Mortgage.
66
The following table presents our primary operating results for our operating segments for the years ended December 31, 2016 and 2015.
| (Dollars in thousands) |
Multi-family Mortgage Banking |
Mortgage Warehousing |
Banking | Other | Total | |||||||||||
|---|---|---|---|---|---|---|---|---|---|---|---|---|---|---|---|---|
Year Ended December 31, 2016 |
||||||||||||||||
Interest Income |
||||||||||||||||
Loans held for sale |
$ | — | $ | 28,252 | $ | — | $ | — | $ | 28,252 | ||||||
Mortgage warehouse lines of credit |
— | 11,792 | — | — | 11,792 | |||||||||||
Residential real estate |
— | — | 7,970 | — | 7,970 | |||||||||||
Multi-family residential real estate |
— | — | 7,480 | — | 7,480 | |||||||||||
Commercial and commercial real estate |
— | 895 | 3,150 | — | 4,045 | |||||||||||
Agricultural production and real estate |
— | — | 2,413 | — | 2,413 | |||||||||||
Consumer and margin loans |
231 | 22 | 358 | — | 611 | |||||||||||
Investment securities and other |
6 | 2,391 | 7,979 | — | 10,376 | |||||||||||
| | | | | | | | | | | | | | | | | |
Total interest income |
237 | 43,352 | 29,350 | — | 72,939 | |||||||||||
Interest Expense |
||||||||||||||||
Deposits |
— | 2,969 | 8,694 | — | 11,663 | |||||||||||
Internal funds transfer charge |
— | 1,616 | (2,215 | ) | 599 | — | ||||||||||
Borrowings |
— | 6,650 | 67 | 588 | 7,305 | |||||||||||
| | | | | | | | | | | | | | | | | |
Total interest expense |
— | 11,235 | 6,546 | 1,187 | 18,968 | |||||||||||
| | | | | | | | | | | | | | | | | |
Net interest income |
237 | 32,117 | 22,804 | (1,187 | ) | 53,971 | ||||||||||
Provision for loan losses |
— | (247 | ) | 1,207 | — | 960 | ||||||||||
| | | | | | | | | | | | | | | | | |
Net interest income after provision for loan losses |
237 | 32,364 | 21,597 | (1,187 | ) | 53,011 | ||||||||||
Noninterest income |
||||||||||||||||
Gain on sale of loans |
22,516 | — | 2,239 | — | 24,755 | |||||||||||
Loan servicing fees |
280 | — | — | — | 280 | |||||||||||
Warehouse fee income |
— | 3,015 | — | — | 3,015 | |||||||||||
Other income |
2 | 205 | 247 | — | 454 | |||||||||||
| | | | | | | | | | | | | | | | | |
Total noninterest income |
22,798 | 3,220 | 2,486 | — | 28,504 | |||||||||||
Noninterest expense |
||||||||||||||||
Salaries and employee benefits |
5,814 | 1,723 | 4,944 | 1,832 | 14,313 | |||||||||||
Loan expenses |
— | 3,766 | 485 | — | 4,251 | |||||||||||
Occupancy and equipment |
303 | 180 | 632 | 229 | 1,344 | |||||||||||
Professional fees |
109 | 501 | 261 | 427 | 1,298 | |||||||||||
Deposit insurance |
— | 343 | 806 | — | 1,149 | |||||||||||
Technology expense |
27 | 416 | 535 | 7 | 985 | |||||||||||
Other expense |
1,221 | 801 | 720 | 638 | 3,380 | |||||||||||
| | | | | | | | | | | | | | | | | |
Noninterest expense |
7,474 | 7,730 | 8,383 | 3,133 | 26,720 | |||||||||||
| | | | | | | | | | | | | | | | | |
Income before income taxes |
15,561 | 27,854 | 15,700 | (4,320 | ) | 54,795 | ||||||||||
Income taxes |
6,153 | 11,015 | 6,208 | (1,708 | ) | 21,668 | ||||||||||
| | | | | | | | | | | | | | | | | |
Net income |
$ | 9,408 | $ | 16,839 | $ | 9,492 | $ | (2,612 | ) | $ | 33,127 | |||||
| | | | | | | | | | | | | | | | | |
| | | | | | | | | | | | | | | | | |
| | | | | | | | | | | | | | | | | |
Total assets |
$ | 98,553 | $ | 1,060,723 | $ | 1,545,783 | $ | 13,453 | $ | 2,718,512 | ||||||
| | | | | | | | | | | | | | | | | |
| | | | | | | | | | | | | | | | | |
| | | | | | | | | | | | | | | | | |
67
| (Dollars in thousands) |
Multi-family Mortgage Banking |
Mortgage Warehousing |
Banking | Other | Total | |||||||||||
|---|---|---|---|---|---|---|---|---|---|---|---|---|---|---|---|---|
Year Ended December 31, 2015 |
||||||||||||||||
Interest Income |
||||||||||||||||
Loans held for sale |
$ | — | $ | 25,452 | $ | — | $ | — | $ | 25,452 | ||||||
Mortgage warehouse lines of credit |
— | 7,363 | — | — | 7,363 | |||||||||||
Residential real estate |
— | 56 | 5,818 | — | 5,874 | |||||||||||
Multi-family residential real estate |
— | — | 3,251 | — | 3,251 | |||||||||||
Commercial and commercial real estate |
— | 2,068 | 2,097 | — | 4,165 | |||||||||||
Agricultural production and real estate |
— | — | 2,309 | — | 2,309 | |||||||||||
Consumer and margin loans |
304 | 22 | 266 | — | 592 | |||||||||||
Investment securities and other |
5 | 1,869 | 5,465 | — | 7,339 | |||||||||||
| | | | | | | | | | | | | | | | | |
Total interest income |
309 | 36,830 | 19,206 | — | 56,345 | |||||||||||
Interest Expense |
||||||||||||||||
Deposits |
— | 440 | 6,906 | — | 7,346 | |||||||||||
Internal funds transfer charge |
— | 2,719 | (3,500 | ) | 781 | — | ||||||||||
Borrowings |
— | 6,447 | 85 | 412 | 6,944 | |||||||||||
| | | | | | | | | | | | | | | | | |
Total interest expense |
— | 9,606 | 3,491 | 1,193 | 14,290 | |||||||||||
| | | | | | | | | | | | | | | | | |
Net interest income |
309 | 27,224 | 15,715 | (1,193 | ) | 42,055 | ||||||||||
Provision for loan losses |
— | (47 | ) | 1,007 | — | 960 | ||||||||||
| | | | | | | | | | | | | | | | | |
Net interest income after provision for loan losses |
309 | 27,271 | 14,708 | (1,193 | ) | 41,095 | ||||||||||
Noninterest income |
||||||||||||||||
Gain on sale of loans |
23,913 | — | 890 | — | 24,803 | |||||||||||
Loan servicing fees |
836 | — | — | — | 836 | |||||||||||
Warehouse fee income |
— | 1,193 | — | — | 1,193 | |||||||||||
Other income |
— | — | 176 | — | 176 | |||||||||||
| | | | | | | | | | | | | | | | | |
Total noninterest income |
24,749 | 1,193 | 1,066 | — | 27,008 | |||||||||||
Noninterest expense |
||||||||||||||||
Salaries and employee benefits |
5,018 | 1,713 | 3,941 | 1,290 | 11,962 | |||||||||||
Loan expenses |
2 | 2,558 | 175 | — | 2,735 | |||||||||||
Occupancy and equipment |
269 | 169 | 673 | 137 | 1,248 | |||||||||||
Professional fees |
116 | 193 | 168 | 198 | 675 | |||||||||||
Deposit insurance |
— | 319 | 758 | — | 1,077 | |||||||||||
Technology expense |
29 | 167 | 493 | 13 | 702 | |||||||||||
Other expense |
878 | 584 | 805 | 256 | 2,523 | |||||||||||
| | | | | | | | | | | | | | | | | |
Noninterest expense |
6,312 | 5,703 | 7,013 | 1,894 | 20,922 | |||||||||||
| | | | | | | | | | | | | | | | | |
Income before income taxes |
18,746 | 22,761 | 8,761 | (3,087 | ) | 47,181 | ||||||||||
Income taxes |
7,469 | 9,068 | 3,491 | (1,230 | ) | 18,798 | ||||||||||
| | | | | | | | | | | | | | | | | |
Net income |
$ | 11,277 | $ | 13,693 | $ | 5,270 | $ | (1,857 | ) | $ | 28,383 | |||||
| | | | | | | | | | | | | | | | | |
| | | | | | | | | | | | | | | | | |
| | | | | | | | | | | | | | | | | |
Total assets |
$ | 87,188 | $ | 924,731 | $ | 1,253,402 | $ | 4,121 | $ | 2,269,442 | ||||||
| | | | | | | | | | | | | | | | | |
| | | | | | | | | | | | | | | | | |
| | | | | | | | | | | | | | | | | |
Multi-family Mortgage Banking. The Multi-family Mortgage Banking segment reported net income for the year ended December 31, 2016, of $9.4 million, a decrease of $1.9 million, or 16.6%, compared to the $11.3 million reported for the year ended December 31, 2015. The decrease was due primarily to a $2.0 million decrease in noninterest income from decreased FHA permanent loan origination volume
68
which decreased gain on sale revenue. The volume in the six months ended June 30, 2016 was lower than other quarters in this segment, as borrowers delayed closings anticipating favorable HUD regulation changes that became effective in the second quarter of 2016. A fair value reduction in the valuation of our mortgage servicing rights at December 31, 2016, contributed to a year-to-year decrease of $556,000 in net loan servicing revenue. Noninterest expense increased $1.2 million, or 18.4%, due primarily to a $796,000, or 15.9%, increase in salaries and employee benefits, as the segment added several key personnel for planned growth. The $3.2 million decrease in pretax income was offset by a $1.3 million decrease in income tax expense.
Mortgage Warehousing. The Mortgage Warehousing segment reported net income for the year ended December 31, 2016, of $16.8 million, an increase of $3.1 million, or 23.0%, over the $13.7 million reported for the year ended December 31, 2015. The increase was comprised primarily of a $4.9 million, or 18.0%, increase in net interest income, due to increases in both the average loan portfolio balance outstanding, and a $1.8 million, or 152.7%, increase in warehouse fee income, which was partially offset by a $1.2 million, or 47.2%, increase in loan expenses, an $819,000 increase in all other noninterest expenses and a $1.9 million increase in income taxes. The volume of warehouse residential participations and lines of credit loan funding increased 23.4% to $24.8 billion for the year ended December 31, 2016 compared to $20.1 billion for the year ended December 31, 2015. The increase in other noninterest expenses was due primarily to a $308,000 increase in legal expense and a $249,000 increase in technology expense related to the implementation and use of new wire transfer software during 2016, which increased efficiencies and enhanced internal controls.
Banking. The Banking segment reported net income for the year ended December 31, 2016, of $9.5 million, an increase of $4.2 million, or 80.1%, over the $5.3 million reported for the year ended December 31, 2015. The increase was comprised primarily of a $7.1 million increase in net interest income, due primarily to an increase in both the average loan and investment securities balances outstanding, and a $1.3 million increase in gain on sale of loans, which were partially offset by a $1.0 million increase in salaries and employee benefits and $2.7 million increase in income taxes. The increase in net interest income was due to a $4.2 million net increase in interest on multi-family rental real estate loans. The average balance of these loans totaled $197.9 million at December 31, 2016 compared to $77.0 million at December 31, 2015, an increase of $120.9 million.
Financial Condition
As of June 30, 2017, we had approximately $3.1 billion in total assets, $2.8 billion in deposits, and $226.5 million in total shareholders' equity. Total assets as of June 30, 2017, included approximately $416.6 million of cash and cash equivalents, $2.0 billion of loans, which was comprised of $983.4 million of loans held for sale and $1.1 billion of loans held for investment. It also includes $145.1 million of trading securities that represent pre-sold multi-family rental real estate loan originations in Ginnie Mae mortgage backed securities pending settlements that typically occur within 30 days. There are $378.3 million of available for sale securities that are match funded with related custodial deposits. There are restrictions on the types of securities as these are funded by certain custodial deposits where we set the cost of deposits based on the yield of the related securities. Mortgage servicing rights at June 30, 2017 were $57.6 million based on the fair value of the multi-family rental real estate loans servicing, which are primarily Ginnie Mae servicing rights with 10-year call protection.
Comparison of Financial Condition at June 30, 2017, December 31, 2016 and December 31, 2015
Total Assets. Total assets increased $373.0 million, or 13.7%, to $3.1 billion at June 30, 2017 from $2.7 billion at December 31, 2016, and at December 31, 2016 increased $449.1 million, or 19.8%, from $2.3 billion at December 31, 2015. The increases were due primarily to increases in investment securities and loans for both periods, which were partially offset by a decrease in cash and cash equivalents.
69
Cash and Cash Equivalents. Cash and cash equivalents decreased $29.1 million, or 6.5%, to $416.6 million at June 30, 2017 from $445.7 million at December 31, 2016, and at December 31, 2016 decreased $1.1 million, or 0.2%, to $445.7 million from $446.8 million at December 31, 2015.
Trading Securities. Trading securities increased $7.4 million, or 5.4%, to $145.1 million at June 30, 2017, from $137.7 million at December 31, 2016, and at December 31, 2016 increased $29.8 million, or 27.6%, to $137.7 million, from $107.9 million at December 31, 2015. The trading securities represent loans that the Bank has funded and are held pending settlement as a Ginnie Mae mortgage-backed security with a firm commitment from the investor, as to which the Bank has committed to sell the securities. The increases were due to an increase in the volume of lending.
Securities Available-for-Sale. Investment securities available-for-sale increased $52.4 million, or 16.1%, to $378.3 million at June 30, 2017 from $325.9 million at December 31, 2016. The increase in securities available-for-sale was primarily due to purchases of $95.0 million which were partially offset by calls, maturities and repayments of securities totaling $42.7 million during the period. Investment securities available-for-sale increased $71.4 million, or 28.1%, to $325.9 million at December 31, 2016 from $254.5 million at December 31, 2015. The increase in securities available-for-sale was primarily due to purchases of $290.4 million, partially offset by maturities (paydowns), calls and sales of securities totaling $218.3 million. We invest in available for sale securities primarily using funds from escrow deposits held at the Bank received in connection with our servicing activities. These escrow deposits increased $79.4 million from $378.5 million at December 31, 2016 to $457.9 million at June 30, 2017.
The available for sale securities are funded by, and paired with as to interest rates, escrow custodial deposits held at the Bank on loans serviced by us. This portfolio of securities is structured to achieve a favorable interest rate spread. The balance of these securities closely approximates the balances of the escrow custodial accounts on an ongoing basis.
The following table sets forth certain information regarding contractual maturities and the weighted average yields of our investment securities as of the dates presented. Expected maturities may differ from contractual maturities if borrowers have the right to call or prepay obligations with or without call or prepayment penalties.
| |
Maturity as of June 30, 2017 | ||||||||||||||||||||||||
|---|---|---|---|---|---|---|---|---|---|---|---|---|---|---|---|---|---|---|---|---|---|---|---|---|---|
| |
Due in One Year or Less |
Due from One to Five Years |
Due from Five to Ten Years |
Due after Ten Years |
|||||||||||||||||||||
| (Dollars in thousands) |
Amortized Cost |
Weighted Average Yield(1) |
Amortized Cost |
Weighted Average Yield(1) |
Amortized Cost |
Weighted Average Yield(1) |
Amortized Cost |
Weighted Average Yield(1) |
|||||||||||||||||
| |
(unaudited) |
||||||||||||||||||||||||
U.S. Treasury Notes |
$ | 1,000 | 0.63 | % | $ | — | — | % | $ | — | — | % | $ | — | — | % | |||||||||
U.S. government agencies |
103,774 | 0.91 | % | 248,284 | 1.12 | % | — | — | % | — | — | % | |||||||||||||
Residential mortgage-backed securities |
— | — | — | — | — | — | 26,173 | 3.74 | % | ||||||||||||||||
| | | | | | | | | | | | | | | | | | | | | | | | | | |
Total |
$ | 104,774 | 0.91 | % | $ | 248,284 | 1.12 | % | $ | — | — | % | $ | 26,173 | 3.74 | % | |||||||||
| | | | | | | | | | | | | | | | | | | | | | | | | | |
| | | | | | | | | | | | | | | | | | | | | | | | | | |
| | | | | | | | | | | | | | | | | | | | | | | | | | |
Loans Held for Sale. Loans held for sale, comprised primarily of single-family residential real estate loan participations, increased $218.9 million, or 28.6%, to $983.4 million at June 30, 2017 from $764.5 million at December 31, 2016. The increase in loans held for sale was due primarily to a $212.3 million increase in balances at Merchants Bank and a $6.6 million increase at NMF. Originations and purchases of loans identified as held for sale totaled $9.5 billion during the six months ended June 30, 2017, compared to $8.5 billion during the same period in 2016, or an increase of 12.9%. Loans held for sale increased $143.9 million, or 23.2%, to $764.5 million at December 31, 2016 from $620.6 million at December 31, 2015. Originations and purchases of loans identified as held for sale
70
totaled $20.1 billion during the year ended December 31, 2016, compared to $15.6 billion during the year ended December 31, 2015.
The following table shows our allocation of loans held for investment as of the dates presented:
| |
June 30, 2017 | December 31, 2016 | December 31, 2015 | ||||||||||||||||
|---|---|---|---|---|---|---|---|---|---|---|---|---|---|---|---|---|---|---|---|
| (Dollars in thousands) |
Amount | % of Total |
Amount | % of Total |
Amount | % of Total |
|||||||||||||
| |
(unaudited) |
|
|
|
|
||||||||||||||
Mortgage warehouse lines of credit |
$ | 245,876 | 23.0 | % | $ | 275,039 | 29.2 | % | $ | 281,746 | 37.0 | % | |||||||
Residential real estate |
289,932 | 27.1 | % | 235,759 | 25.0 | % | 199,065 | 26.1 | % | ||||||||||
Multi-family and healthcare financing |
315,076 | 29.4 | % | 261,031 | 27.7 | % | 145,082 | 19.0 | % | ||||||||||
Commercial and commercial real estate |
162,138 | 15.1 | % | 113,812 | 12.1 | % | 83,688 | 11.0 | % | ||||||||||
Agricultural production and real estate |
48,594 | 4.5 | % | 46,763 | 5.0 | % | 44,772 | 5.9 | % | ||||||||||
Consumer and margin |
9,250 | 0.9 | % | 9,392 | 1.0 | % | 7,859 | 1.0 | % | ||||||||||
| | | | | | | | | | | | | | | | | | | | |
Total |
1,070,866 | 941,796 | 762,212 | ||||||||||||||||
Allowance for loan losses |
(6,865 | ) | (6,250 | ) | (5,422 | ) | |||||||||||||
| | | | | | | | | | | | | | | | | | | | |
Total loans held for investment, net |
$ | 1,064,001 | 100.0 | % | $ | 935,546 | 100 | % | $ | 756,790 | 100 | % | |||||||
| | | | | | | | | | | | | | | | | | | | |
| | | | | | | | | | | | | | | | | | | | |
| | | | | | | | | | | | | | | | | | | | |
Loans Receivable, Net. Loans receivable, net, which are comprised of loans held for investment, increased $128.5 million, or 13.7%, to $1.1 billion at June 30, 2017 compared to December 31, 2016. The increase in net loans was comprised primarily of an increase of $54.2 million, or 23.0%, in residential real estate loans, to $289.9 million at June 30, 2017, a $54.0 million increase in multi-family and healthcare financing loans, to $315.1 million at June 30, 2017 and a $48.3 million, or 42.5%, increase in commercial loans, to $162.1 million at June 30, 2017, which were partially offset by a decrease of $29.2 million, or 10.6%, in mortgage warehouse lines of credit loans to $245.9 million at June 30, 2017 from $275.0 million at December 31, 2016. The decrease in mortgage warehouse lines of credit was due primarily to an $16.7 million decrease in balances and a $12.5 million increase in participations sold to other financial institutions. The decrease in mortgage warehouse lines of credit was primarily due to a shift from warehouse lines of credit to single family loan participations and an industry decline. The overall increase in Mortgage Warehousing warehouse lines and loan participations loan balances was 18.3% from $1.0 billion at December 31, 2016 to $1.2 billion at June 30, 2017 as the decrease in mortgage warehouse lines of credit was more than offset by a 28.9% increase in single-family residential real estate loan participations. There was a 4.2% industry decline in single-family residential loan volumes from the six months ended June 30, 2016 to the six months ended June 30, 2017, according to the Mortgage Bankers Association. The increase in commercial loans was due primarily to a $38.7 million increase in operating lines of credit secured by mortgage servicing rights and cross-collateralized by gain on sale proceeds from loans funded by Merchants Bank under warehouse facilities. Loans receivable, net increased $178.8 million, or 23.6%, to $935.5 million at December 31, 2016 compared to December 31, 2015. The increase in net loans was comprised primarily of an increase of $115.9 million, or 79.9%, in multi-family rental real estate loans, to $261.0 million at December 31, 2016 from $145.1 million at December 31, 2015; a $36.7 million, or 18.4%, increase in residential real estate loans to $235.8 million at December 31, 2016 from $199.1 million at December 31, 2015; and a $30.1 million, or 36.0%, increase in commercial loans, to $113.8 million at December 31, 2016 from $83.7 million at December 31, 2015, which were partially offset by a $6.7 million, or 2.4%, decrease in mortgage warehouse lines of credit loans to $275.0 million at December 31, 2016 from $281.7 million at December 31, 2015. The increase in multi-family rental real estate loans was due to loans delaying conversion to permanent financing due to the favorable HUD regulations changes that went into effect in the second quarter of 2016 and an increase in participations to other institutions which allowed for increased capacity to originate multi-family bridge and acquisition loans. The increase in residential real estate was primarily due to a $36.2 increase in
71
HELOCs due to additional purchases of first lien home equity lines of credit in excess of runoff. The increase in commercial loans was due to new commercial loan relationships.
The following table presents an analysis of the allowance for loan losses for the periods presented:
| |
At or for the Six Months Ended June 30, 2017 |
|
|
|||||||
|---|---|---|---|---|---|---|---|---|---|---|
| |
At or For the Year Ended December 31, |
|||||||||
| (Dollars in thousands) |
2016 | 2015 | ||||||||
| |
(unaudited) |
|
|
|||||||
Balance at beginning of period |
$ | 6,250 | $ | 5,422 | $ | 4,458 | ||||
Charge-offs: |
||||||||||
Mortgage warehouse lines of credit |
— | — | — | |||||||
Residential real estate |
— | — | — | |||||||
Multi-family and healthcare financing |
— | — | — | |||||||
Commercial and commercial real estate |
— | — | — | |||||||
Agricultural production and real estate |
— | — | — | |||||||
Consumer and margin |
— | — | — | |||||||
| | | | | | | | | | | |
Total charge-offs |
— | — | — | |||||||
Recoveries: |
||||||||||
Mortgage warehouse lines of credit |
— | — | — | |||||||
Residential real estate |
— | — | 1 | |||||||
Multi-family and healthcare financing |
— | — | — | |||||||
Commercial and commercial real estate |
101 | — | 3 | |||||||
Agricultural production and real estate |
— | |||||||||
Consumer and margin |
34 | — | — | |||||||
| | | | | | | | | | | |
Total recoveries |
135 | — | 4 | |||||||
| | | | | | | | | | | |
Net (charge-offs) recoveries |
135 | — | 4 | |||||||
Transfers out: |
||||||||||
Residential real estate |
— | (132 | ) | — | ||||||
Provision for loan losses |
480 | 960 | 960 | |||||||
| | | | | | | | | | | |
Balance at end of period |
$ | 6,865 | $ | 6,250 | $ | 5,422 | ||||
| | | | | | | | | | | |
| | | | | | | | | | | |
| | | | | | | | | | | |
Ratios: |
||||||||||
Net recoveries to average loans outstanding |
0.01 | % | 0.00 | % | 0.00 | % | ||||
Allowance for loan losses to non-performing loans at end of period |
213.26 | % | 331.21 | % | 611.27 | % | ||||
Allowance for loan losses to total loans at end of period |
0.64 | % | 0.66 | % | 0.71 | % | ||||
72
The following table presents an analysis of the allowance for loan losses for the periods presented:
| |
|
|
|
At December 31, | ||||||||||||||||||||||||
|---|---|---|---|---|---|---|---|---|---|---|---|---|---|---|---|---|---|---|---|---|---|---|---|---|---|---|---|---|
| |
At June 30, 2017 | 2016 | 2015 | |||||||||||||||||||||||||
| (Dollars in thousands) |
Amount | Percent of Allowance to Total Allowance |
Percent of Loans in Category to Total Loans |
Amount | Percent of Allowance to Total Allowance |
Percent of Loans in Category to Total Loans |
Amount | Percent of Allowance to Total Allowance |
Percent of Loans in Category to Total Loans |
|||||||||||||||||||
| |
(unaudited) |
|
|
|
|
|
|
|||||||||||||||||||||
Mortgage warehouse lines of credit |
$ | 281 | 4.1 | % | 23.0 | % | $ | 373 | 6.0 | % | 29.2 | % | $ | 704 | 13.0 | % | 37.0 | % | ||||||||||
Residential real estate |
1,938 | 28.2 | % | 27.1 | % | 2,170 | 34.7 | % | 25.0 | % | 2,212 | 40.8 | % | 26.1 | % | |||||||||||||
Multi-family and healthcare financing |
2,426 | 35.3 | % | 29.4 | % | 1,962 | 31.4 | % | 27.7 | % | 1,308 | 24.1 | % | 19.0 | % | |||||||||||||
Commercial and commercial real estate |
1,845 | 26.9 | % | 15.1 | % | 1,374 | 22.0 | % | 12.1 | % | 908 | 16.7 | % | 11.0 | % | |||||||||||||
Agricultural production and real estate |
271 | 4.0 | % | 4.5 | % | 269 | 4.3 | % | 5.0 | % | 222 | 4.1 | % | 5.9 | % | |||||||||||||
Consumer and margin |
104 | 1.5 | % | 0.9 | % | 102 | 1.6 | % | 1.0 | % | 68 | 1.3 | % | 1.0 | % | |||||||||||||
| | | | | | | | | | | | | | | | | | | | | | | | | | | | | |
Total allocated allowance |
6,865 | 100.0 | % | 100.0 | % | 6,250 | 100.0 | % | 100.0 | % | 5,422 | 100.0 | % | 100.0 | % | |||||||||||||
Unallocated allowance |
— | — | — | — | — | — | — | — | — | |||||||||||||||||||
Total allowance for loan losses |
$ | 6,865 | 100.0 | % | 100.0 | % | $ | 6,250 | 100.0 | % | 100.0 | % | $ | 5,422 | 100.0 | % | 100.0 | % | ||||||||||
| | | | | | | | | | | | | | | | | | | | | | | | | | | | | |
| | | | | | | | | | | | | | | | | | | | | | | | | | | | | |
| | | | | | | | | | | | | | | | | | | | | | | | | | | | | |
73
The following table sets forth the amounts of non-performing loans and non-performing assets at the dates indicated:
| |
|
At December 31, |
||||||||
|---|---|---|---|---|---|---|---|---|---|---|
| |
At June 30, 2017 |
|||||||||
| (Dollars in thousands) |
2016 | 2015 | ||||||||
| |
(unaudited) |
|
|
|||||||
Nonaccrual loans: |
||||||||||
Mortgage warehouse lines of credit |
$ | — | $ | — | $ | — | ||||
Residential real estate |
301 | 303 | 66 | |||||||
Multi-family and healthcare financing |
— | — | — | |||||||
Commercial and commercial real estate |
627 | 899 | 181 | |||||||
Agricultural production and real estate |
282 | — | — | |||||||
Consumer and margin |
— | — | — | |||||||
| | | | | | | | | | | |
Total |
1,210 | 1,202 | 247 | |||||||
Accruing loans 90 days or more past due: |
||||||||||
Mortgage warehouse lines of credit |
— | — | — | |||||||
Residential real estate |
— | 578 | 605 | |||||||
Multi-family and healthcare financing |
— | — | — | |||||||
Commercial and commercial real estate |
2,009 | — | — | |||||||
Agricultural production and real estate |
— | 107 | 35 | |||||||
Consumer and margin |
— | — | — | |||||||
| | | | | | | | | | | |
Total |
2,009 | 685 | 640 | |||||||
Total nonperforming loans |
3,219 | 1,887 | 887 | |||||||
Real estate owned |
— | — | — | |||||||
Other nonperforming assets |
— | — | — | |||||||
| | | | | | | | | | | |
Total nonperforming assets |
$ | 3,219 | $ | 1,887 | $ | 887 | ||||
| | | | | | | | | | | |
| | | | | | | | | | | |
| | | | | | | | | | | |
Troubled debt restructurings |
||||||||||
Mortgage warehouse lines of credit |
$ | — | $ | — | $ | — | ||||
Residential real estate |
— | — | — | |||||||
Multi-family and healthcare financing |
— | — | — | |||||||
Commercial and commercial real estate |
— | — | — | |||||||
Agricultural production and real estate |
— | — | — | |||||||
Consumer and margin |
— | — | — | |||||||
| | | | | | | | | | | |
Total(1) |
$ | — | $ | — | $ | — | ||||
| | | | | | | | | | | |
| | | | | | | | | | | |
| | | | | | | | | | | |
Ratios: |
||||||||||
Total non-performing loans to total loans |
0.30 | % | 0.20 | % | 0.12 | % | ||||
Total non-performing loans to total assets |
0.10 | % | 0.07 | % | 0.04 | % | ||||
Total non-performing assets to total assets |
0.10 | % | 0.07 | % | 0.04 | % | ||||
Total non-performing loans and TDRs to total loans |
0.30 | % | 0.20 | % | 0.12 | % | ||||
Total non-performing loans and TDRs to total assets |
0.10 | % | 0.07 | % | 0.04 | % | ||||
Total non-performing assets and TDRs to total assets |
0.10 | % | 0.07 | % | 0.04 | % | ||||
Mortgage Servicing Rights. Mortgage servicing rights increased $3.9 million, or 7.2%, to $57.6 million at June 30, 2017 from $53.7 million at December 31, 2016. During the six months ended June 30, 2017, purchased servicing was $1.1 million and additions for originated servicing were $4.8 million, partially offset by reductions for paydowns on serviced loans of $2.7 million. Mortgage servicing rights decreased $1.9 million, or 3.4%, to $53.7 million at December 31, 2016 from $55.6 million at December 31, 2015. Mortgage servicing rights are recognized in connection with sales
74
of multi-family loans when We retain servicing of the sold loans, as well as upon purchases of loan servicing portfolios. The mortgage servicing rights are recorded and carried at fair value.
Deposits. Deposits increased $342.9 million, or 14.1%, to $2.8 billion at June 30, 2017 from $2.4 billion at December 31, 2016. Interest bearing deposits increased $276.4 million, or 14.8%, to $2.1 billion at June 30, 2017, and noninterest bearing deposits increased $66.5 million, to $633.1 million at June 30, 2017. Demand deposits increased $138.7 million, or 13.0%, to $1.2 billion at June 30, 2017, savings deposits increased $53.4 million, or 4.5%, to $1.2 billion at June 30, 2017, while certificates of deposit accounts increased $150.8 million, or 90.7%, to $317.0 million at June 30, 2017. The change in certificates of deposit accounts was largely due to the level of brokered deposits outstanding period to period. Brokered certificates of deposit accounts increased $127.7 million, or 100.6%, to $254.7 million at June 30, 2017 from $127.0 million at December 31, 2016. Brokered savings deposits decreased $38.6 million, or 8.6%, to $412.0 million at June 30, 2017 from $450.6 million at December 31, 2016 and brokered demand deposit accounts also decreased by $39.9 million, or 65.9%, to $20.6 million at June 30, 2017. To fund increased loan originations, total brokered deposits, which also includes brokered demand accounts, increased $49.2 million, or 7.7%, to $687.3 million at June 30, 2017 from $638.1 million at December 31, 2016.
Deposits increased $389.1 million, or 19.1%, to $2.4 billion at December 31, 2016 from $2.0 billion at December 31, 2015. Interest-bearing deposits increased $487.0 million, or 35.4%, to $1.9 billion at December 31, 2016, while noninterest bearing deposits decreased $97.9 million, to $566.6 million at December 31, 2016. Savings deposits increased $331.8 million, or 38.5%, to $1.2 billion at December 31, 2016 and demand deposits increased $294.5 million, or 38.1%, while certificates of deposit accounts decreased $237.2 million, or 58.8%, to $166.2 million at December 31, 2016. The change in savings deposits and certificates of deposit accounts was largely related to the level of brokered deposits outstanding period to period. Brokered savings deposits increased $279.8 million, or 163.8%, to $450.6 million at June 30, 2017 from $170.8 million at December 31, 2016. Brokered certificates of deposit decreased $240.2 million, or 65.4%, to $127.0 million at December 31, 2016 from $367.2 million at December 31, 2015. Total brokered deposits, which includes brokered demand accounts, increased $100.1 million, or 18.6%, to $638.1 million at December 31, 2016 from $538.0 million at December 31, 2015 due to increased loan origination.
Brokered deposits may be more rate sensitive compared to other sources of funding. In the future, those depositors may not replace their brokered deposits with us as they mature, or we may have to pay a higher rate of interest to keep those deposits or to replace them with other deposits or other sources of funds. Not being able to maintain or replace those deposits as they mature would adversely affect our liquidity. Additionally, if the Bank does not maintain its well-capitalized position, it may not accept or renew any brokered deposits without a waiver granted by the FDIC.
The following tables show the average balance amounts and the average contractual rates paid on our deposits for the periods indicated:
| |
For the Six Months Ended June 30, 2017 |
||||||
|---|---|---|---|---|---|---|---|
| (Dollars in thousands) |
Average Balance |
Average Rate |
|||||
| |
(unaudited) |
||||||
Non-interest bearing demand |
$ | 576,624 | 0.00 | % | |||
Interest bearing demand |
520,973 | 1.01 | % | ||||
Money market savings |
846,721 | 1.13 | % | ||||
Savings |
313,294 | 0.25 | % | ||||
Certificates of deposit |
186,639 | 0.85 | % | ||||
| | | | | | | | |
Total |
$ | 2,444,251 | 0.70 | % | |||
| | | | | | | | |
| | | | | | | | |
| | | | | | | | |
75
| |
For the Year Ended December 31, 2016 |
For the Year Ended December 31, 2015 |
|||||||||||
|---|---|---|---|---|---|---|---|---|---|---|---|---|---|
(Dollars in thousands)
|
Average Balance |
Average Rate |
Average Balance |
Average Rate |
|||||||||
Non-interest bearing demand |
$ | 726,811 | 0.00 | % | $ | 703,944 | 0.00 | % | |||||
Interest bearing demand |
397,767 | 0.70 | % | 196,738 | 0.25 | % | |||||||
Money market savings |
673,643 | 0.96 | % | 540,028 | 0.96 | % | |||||||
Savings |
278,919 | 0.13 | % | 243,841 | 0.13 | % | |||||||
Certificates of deposit |
342,599 | 0.59 | % | 265,577 | 0.51 | % | |||||||
| | | | | | | | | | | | | | |
Total |
$ | 2,419,739 | 0.48 | % | $ | 1,950,128 | 0.38 | % | |||||
| | | | | | | | | | | | | | |
| | | | | | | | | | | | | | |
| | | | | | | | | | | | | | |
The following table shows time deposits of $100,000 or more by time remaining until maturity:
(Dollars in thousands)
|
At June 30, 2017 |
|||
|---|---|---|---|---|
| |
(unaudited) |
|||
Three months or less |
$ | 11,771 | ||
Over three months through six months |
26,238 | |||
Over six months through one year |
21,413 | |||
Over one year to three years |
540 | |||
Over three years |
574 | |||
| | | | | |
Total |
$ | 60,536 | ||
| | | | | |
| | | | | |
| | | | | |
Borrowings. Borrowings totaled $56.6 million at June 30, 2017, a decrease of $373,000 from December 31, 2016, and at December 31, 2016, a decrease of $484,000 from December 31, 2015, which represented net repayments on FHLBI advances.
The following table sets forth certain information regarding our borrowings at the dates and for the periods indicated:
| |
|
At or For the Years Ended December 31, |
||||||||
|---|---|---|---|---|---|---|---|---|---|---|
| |
At or For the Six Months Ended June 30, 2017 |
|||||||||
(Dollars in thousands)
|
2016 | 2015 | ||||||||
| |
(unaudited) |
|
|
|||||||
Balance at end of period |
$ | 56,633 | $ | 57,006 | $ | 57,490 | ||||
Average balance during period |
60,733 | 58,335 | 56,580 | |||||||
Maximum outstanding at any month end |
57,002 | 57,490 | 189,125 | |||||||
Weighted average interest rate at end of period(1) |
3.94 | % | 3.35 | % | 2.98 | % | ||||
Average interest rate during period |
12.30 | % | 12.52 | % | 12.27 | % | ||||
- (1)
- The weighted-average interest rate at the end of the period reflects the stated interest rates on the borrowings. In addition to the stated rate, the borrowing term on the subordinated debt include payment of an amount equal to 49% of the net income of NMF.
Total Equity. Total equity increased $20.2 million, or 9.8%, to $226.5 million at June 30, 2017 from $206.3 million at December 31, 2016. The increase resulted primarily from net income of $23.9 million and an increase in other comprehensive income of $71,000, which were partially offset by dividends paid on preferred and common shares of $1.7 million and $2.1 million, respectively, during the period. Total equity increased $58.1 million, or 39.2%, to $206.3 million at December 31, 2016 from $148.2 million at December 31, 2015. The increase resulted primarily from net income of $33.1 million and net proceeds from the issuance of $31.6 million of our 8% Non-Cumulative, Perpetual Preferred
76
Stock, which were partially offset by dividends paid on preferred and common shares of $2.0 million and $4.2 million, respectively, during the year.
Liquidity and Capital Resources
Our primary sources of funds are deposits, escrow and custodial deposits, principal and interest payments on loans, and proceeds from sale of loans. While maturities and scheduled amortization of loans are predictable sources of funds, deposit flows and mortgage prepayments are greatly influenced by market interest rates, economic conditions, and competition. Our most liquid assets are cash, short-term investments, including interest-bearing demand deposits and trading securities. The levels of these assets are dependent on our operating, financing, lending, and investing activities during any given period.
Our cash flows are comprised of three primary classifications: cash flows from operating activities, investing activities, and financing activities. Net cash used in operating activities was $183.6 million and $201.9 million for the six months ended June 30, 2017 and 2016, respectively. Net cash used in investing activities, which consists primarily of net change in loans receivable and purchases, sales and maturities of investment securities, was $184.3 million and $159.8 million for the six months ended June 30, 2017 and 2016, respectively. Net cash provided by financing activities, which is comprised primarily of net change in deposits, was $338.7 million and $223.6 million for the six months ended June 30, 2017 and 2016, respectively.
Net cash provided by (used in) operating activities was $(149.8 million) and $118.3 million for the years ended December 31, 2016 and 2015, respectively. Net cash used in investing activities, which consists primarily of net change in loans receivable and purchases, sales and maturities of investment securities, was $(265.3 million) and $(349.3 million) for the years ended December 31, 2016 and 2015, respectively. Net cash provided by financing activities, which is comprised primarily of net change in deposits, was $414.0 million and $448.2 million for the years ended December 31, 2016 and 2015, respectively.
At June 30, 2017, we had outstanding commitments to originate loans of $328.6 million, unused lines of credit of $93.2 million and outstanding letters of credit of $54.4 million. We anticipate that we will have sufficient funds available to meet our current loan origination commitments. Certificates of deposit that are scheduled to mature in less than one year from June 30, 2017 totaled $315.0 million. Management expects that a substantial portion of the maturing certificates of deposit will be renewed. However, if a substantial portion of these deposits is not retained, we may decide to utilize FHLBI advances or raise interest rates on deposits to attract new accounts, which may result in higher levels of interest expense. At June 30, 2017, based on available collateral and our ownership of FHLBI stock we had access to additional FHLBI advances of up to $386.4 million.
At June 30, 2017, the Bank exceeded all of its regulatory capital requirements with a Tier 1 leverage capital level of $267.0 million, or 9.3% of adjusted total assets, which is above the required level of $114.4 million, or 4.0%; total risk-based capital of $273.9 million, or 12.0% of risk-weighted assets, which is above the required level of $182.3 million, or 8.0%; and common equity Tier 1 capital of $267.0 million, or 11.7% of risk-weighted assets, which is above the required level of $102.5 million, or 4.5% of risk-weighted assets. Accordingly, the Bank was categorized as well capitalized at June 30, 2017. Management is not aware of any conditions or events since the most recent notification that would change our category.
At June 30, 2017, the Company exceeded all of its regulatory capital requirements with a Tier 1 leverage capital level of $211.0 million, or 7.4% of adjusted total assets, which is above the required level of $114.1 million, or 4.0%; total risk-based capital of $217.9 million, or 9.6% of risk-weighted assets, which is above the required level of $182.4 million, or 8.0%; and common equity Tier 1 capital of $169.4 million, or 7.4% of risk-weighted assets, which is above the required level of $102.6 million,
77
or 4.5% of risk-weighted assets. Management is not aware of any conditions or events since the most recent notification that would change our category.
The table directly below shows the capital ratios under the Basel III capital framework:
| |
June 30, 2017 Actual |
December 31, 2016 Actual |
Minimum Capital Levels as of Jan. 1, 2017 |
Well-Capitalized Basel III Ratio as of Jan. 1, 2015 Under Prompt Corrective Action Regulations |
|||||||||
|---|---|---|---|---|---|---|---|---|---|---|---|---|---|
Merchants Bancorp |
|||||||||||||
Common Equity Tier 1 (to risk-weighted assets) |
7.4 | % | 8.1 | % | 4.5 | % | N/A | ||||||
Tier 1 Leverage Ratio |
7.4 | % | 6.6 | % | 4.0 | % | N/A | ||||||
Tier 1 Capital |
9.3 | % | 10.3 | % | 6.0 | % | ³6.0 | % | |||||
Total Capital (to risk-weighted assets) |
9.6 | % | 10.6 | % | 8.0 | % | ³10.0 | % | |||||
Merchants Bank |
|||||||||||||
Common Equity Tier 1 (to risk-weighted assets) |
11.7 | % | 13.2 | % | 4.5 | % | ³6.5 | % | |||||
Tier 1 Leverage Ratio |
9.3 | % | 8.4 | % | 4.0 | % | ³5.0 | % | |||||
Tier 1 Capital |
11.7 | % | 13.2 | % | 6.0 | % | ³8.0 | % | |||||
Total Capital (to risk-weighted assets) |
12.0 | % | 13.5 | % | 8.0 | % | ³10.0 | % | |||||
Contractual obligations
The following table summarizes aggregated information about our outstanding contractual obligations and other long-term liabilities as of June 30, 2017. The payment amounts represent those amounts contractually due to the recipients.
| |
Payments Due by Period | |||||||||||||||
|---|---|---|---|---|---|---|---|---|---|---|---|---|---|---|---|---|
(Dollars in thousands)
|
Total | Less Than One Year |
One to Three Years |
Three to Five Years |
More than Five Years |
|||||||||||
| |
(unaudited) |
|||||||||||||||
Deposits without a stated maturity |
$ | 2,454,473 | $ | 2,454,473 | $ | — | $ | — | $ | — | ||||||
Time deposits |
317,028 | 315,029 | 1,200 | 799 | — | |||||||||||
Borrowings |
56,633 | 55,412 | 358 | 114 | 749 | |||||||||||
Operating lease obligations |
3,729 | 720 | 1,484 | 938 | 587 | |||||||||||
| | | | | | | | | | | | | | | | | |
Total |
$ | 2,831,863 | $ | 2,825,634 | $ | 3,042 | $ | 1,851 | $ | 1,336 | ||||||
| | | | | | | | | | | | | | | | | |
| | | | | | | | | | | | | | | | | |
| | | | | | | | | | | | | | | | | |
Borrowings are fully described in Note 10 of the Consolidated Financial Statements as of June 30, 2017 and December 31, 2016 and 2015. Operating lease obligations are in place primarily for facilities and land on which banking facilities are located. See Note 22 of our Consolidated Financial Statements as of June 30, 2017 and December 31, 2016 and 2015 for additional information.
Off-Balance Sheet Arrangements.
In the normal course of operations, we engage in a variety of financial transactions that, in accordance with U.S. generally accepted accounting principles, are not recorded in our financial statements. These transactions involve, to varying degrees, elements of credit, interest rate and liquidity
78
risk. Such transactions are used primarily to manage customers' requests for funding and take the form of loan commitments, lines of credit and standby letters of credit.
For information about our loan commitments, unused lines of credit and standby letters of credit, see Note 22 of the Notes to our Consolidated Financial Statements beginning on page F-1 of this prospectus.
We have not engaged in any other off-balance-sheet transactions in the normal course of our lending activities.
Quantitative and Qualitative Disclosures About Market Risk
Market Risk. Market risk represents the risk of loss due to changes in market values of assets and liabilities. We incur market risk in the normal course of business through exposures to market interest rates, equity prices, and credit spreads. We have identified two primary sources of market risk: interest rate risk and price risk.
Interest Rate Risk
Overview. Interest rate risk is the risk to earnings and value arising from changes in market interest rates. Interest rate risk arises from timing differences in the repricings and maturities of interest-earning assets and interest-bearing liabilities (reprice risk), changes in the expected maturities of assets and liabilities arising from embedded options, such as borrowers' ability to prepay residential mortgage loans at any time and depositors' ability to redeem certificates of deposit before maturity (option risk), changes in the shape of the yield curve where interest rates increase or decrease in a nonparallel fashion (yield curve risk), and changes in spread relationships between different yield curves, such as U.S. Treasuries and LIBOR (basis risk).
The Asset-Liability Committee of our board of directors, or ALCO, establishes broad policy limits with respect to interest rate risk. ALCO establishes specific operating guidelines within the parameters of the board of directors' policies. In general, we seek to minimize the impact of changing interest rates on net interest income and the economic values of assets and liabilities. Our ALCO meets quarterly to monitor the level of interest rate risk sensitivity to ensure compliance with the board of directors' approved risk limits.
Interest rate risk management is an active process that encompasses monitoring loan and deposit flows complemented by investment and funding activities. Effective management of interest rate risk begins with understanding the dynamic characteristics of assets and liabilities and determining the appropriate interest rate risk posture given business forecasts, management objectives, market expectations, and policy constraints.
An asset sensitive position refers to a balance sheet position in which an increase in short-term interest rates is expected to generate higher net interest income, as rates earned on our interest-earning assets would reprice upward more quickly than rates paid on our interest-bearing liabilities, thus expanding our net interest margin. Conversely, a liability sensitive position refers to a balance sheet position in which an increase in short-term interest rates is expected to generate lower net interest income, as rates paid on our interest-bearing liabilities would reprice upward more quickly than rates earned on our interest-earning assets, thus compressing our net interest margin.
Income Simulation and Economic Value Analysis. Interest rate risk measurement is calculated and reported to the ALCO at least quarterly. The information reported includes period-end results and identifies any policy limits exceeded, along with an assessment of the policy limit breach and the action plan and timeline for resolution, mitigation, or assumption of the risk.
79
We use two approaches to model interest rate risk: Net Interest Income at Risk (NII at Risk) and Economic Value of Equity (EVE). Under NII at Risk, net interest income is modeled utilizing various assumptions for assets, liabilities, and derivatives. EVE measures the period end market value of assets minus the market value of liabilities and the change in this value as rates change. EVE is a period end measurement.
We report NII at Risk to isolate the change in income related solely to interest earning assets and interest-bearing liabilities. The NII at Risk results reflect the analysis used quarterly by management. It models gradual –100, +100 and +200 basis point parallel shifts in market interest rates, implied by the forward yield curve over the next one-year period. The following table presents NII at Risk as of June 30, 2017, December 31, 2016, and December 31, 2015:
| |
Net Interest Income Sensitivity Twelve Months Forward |
|||||||||
|---|---|---|---|---|---|---|---|---|---|---|
(Dollars in thousands)
|
–100 | +100 | +200 | |||||||
June 30, 2017: |
||||||||||
Dollar change |
$ | (13,080 | ) | $ | 9,593 | $ | 19,418 | |||
Percent change |
(16.0 | )% | 11.7 | % | 23.4 | % | ||||
December 31, 2016: |
||||||||||
Dollar change |
$ | (15,458 | ) | $ | 12,867 | $ | 26,083 | |||
Percent change |
(20.3 | )% | 16.9 | % | 34.2 | % | ||||
December 31, 2015: |
||||||||||
Dollar change |
$ | (8,114 | ) | $ | 9,729 | $ | 19,438 | |||
Percent change |
(13.2 | )% | 15.9 | % | 31.7 | % | ||||
Our interest rate risk management policy limits the change in our net interest income to –15% for a 100 basis point move in interest rates, and –20% for a 200 basis point move in rates. At both June 30, 2017 and December 31, 2016 we estimated that a –100 basis point change in rates would have caused a greater than 15% decline in net interest income over the forward 12 month period. However, these estimates were based on a constant-sized balance sheet. Mortgage volumes typically would increase in a –100 basis point scenario which would increase net interest and noninterest income. Management determined these dynamics are sufficient mitigating factors. Management may also remediate situations where we are not within our policy limits by buying or selling assets, buying or selling participations in assets, and changing asset and liability pricing.
The EVE results included in the table below reflect the analysis used quarterly by management. It models immediate –100, +100 and +200 basis point parallel shifts in market interest rates.
| |
Economic Value of Equity Sensitivity (Shock) |
|||||||||
|---|---|---|---|---|---|---|---|---|---|---|
| |
Immediate Change in Rates | |||||||||
(Dollars in thousands)
|
–100 | +100 | +200 | |||||||
June 30, 2017: |
||||||||||
Dollar change |
$ | 2,842 | $ | (5,979 | ) | $ | (13,574 | ) | ||
Percent change |
1.0 | % | (2.2 | )% | (4.9 | )% | ||||
December 31, 2016: |
||||||||||
Dollar change |
$ | 2,277 | $ | (5,289 | ) | $ | (12,100 | ) | ||
Percent change |
0.9 | % | (2.1 | )% | (4.8 | )% | ||||
December 31, 2015: |
||||||||||
Dollar change |
$ | 2,960 | $ | (6,938 | ) | $ | (14,143 | ) | ||
Percent change |
1.5 | % | (3.5 | )% | (7.1 | )% | ||||
80
Our interest rate risk management policy limits the change in our EVE to –15% for a 100 basis point move in interest rates, and –20% for a 200 basis point move in rates. We are within policy limits set by our board of directors for the –100, +100 and +200 basis point scenarios. The EVE reported at June 30, 2017 projects that as interest rates increase (decrease) immediately, the economic value of equity position will be expected to decrease (increase). When interest rates rise, fixed rate assets generally lose economic value; the longer the duration, the greater the value lost. The opposite is true when interest rates fall. The EVE results reported as of June 30, 2017 and December 31, 2016 and 2015, for all levels of interest rate changes, shows an asset sensitive position.
Critical Accounting Policies and Estimates
The discussion and analysis of the financial condition and results of operations are based on our financial statements, which are prepared in conformity with generally accepted accounting principles used in the United States of America. The preparation of these financial statements requires management to make estimates and assumptions affecting the reported amounts of assets and liabilities, disclosure of contingent assets and liabilities, and the reported amounts of income and expenses. We consider the accounting policies discussed below to be critical accounting policies. The estimates and assumptions that we use are based on historical experience and various other factors and are believed to be reasonable under the circumstances. Actual results may differ from these estimates under different assumptions or conditions, resulting in a change that could have a material impact on the carrying value of our assets and liabilities and our results of operations.
The JOBS Act contains provisions that, among other things, reduce certain reporting requirements for qualifying public companies. As an "emerging growth company" we may delay adoption of new or revised accounting pronouncements applicable to public companies until such pronouncements are made applicable to private companies. We intend to take advantage of the benefits of this extended transition period. Accordingly, our financial statements may not be comparable to companies that comply with such new or revised accounting standards.
The following represent our critical accounting policies:
Allowance for Loan Losses. The allowance for loan losses is the estimated amount considered necessary to cover inherent, but unconfirmed, credit losses in the loan portfolio at the balance sheet date. The allowance is established through the provision for loan losses which is charged against income. In determining the allowance for loan losses, management makes significant estimates and has identified this policy as one of our most critical accounting policies.
Management performs a quarterly evaluation of the allowance for loan losses. Consideration is given to a variety of factors in establishing this estimate including, but not limited to, current economic conditions, delinquency statistics, geographic and industry concentrations, the adequacy of the underlying collateral, the financial strength of the borrower, results of internal loan reviews and other relevant factors. This evaluation is inherently subjective as it requires material estimates that may be susceptible to significant change.
The analysis has two components, specific and general allowances. The specific percentage allowance is for unconfirmed losses related to loans that are determined to be impaired. Impairment is measured by determining the present value of expected future cash flows or, for collateral-dependent loans, the fair value of the collateral, adjusted for market conditions and selling expenses. If the fair value of the loan is less than the loan's carrying value, a specific reserve is established for the difference. The general allowance, which is for loans reviewed collectively, is determined by segregating the remaining loans by type of loan, risk weighting (if applicable) and payment history. We also analyze historical loss experience, delinquency trends, general economic conditions and geographic and industry concentrations. This analysis establishes historical loss percentages and qualitative factors that are applied to the loan groups to determine the amount of the allowance for loan losses necessary for
81
loans that are reviewed collectively. The qualitative component is critical in determining the allowance for loan losses as certain trends may indicate the need for changes to the allowance for loan losses based on factors beyond the historical loss history. Not incorporating a qualitative component could misstate the allowance for loan losses. Actual loan losses may be significantly more than the allowances we have established which could result in a material negative effect on our financial results.
Mortgage Servicing Rights. Mortgage servicing assets are recognized separately when rights are acquired through purchase or through sale of financial assets. Servicing rights resulting from the sale or securitization of loans originated by us are initially measured at fair value at the date of transfer. We have elected to initially and subsequently measure the mortgage servicing rights for mortgage loans using the fair value method. Under the fair value method, the servicing rights are carried in the balance sheet at fair value and the changes in fair value are reported in earnings in the period in which the changes occur.
Fair value is based on market prices for comparable mortgage servicing contracts, when available, or alternatively, is based on a valuation model that calculates the present value of estimated future net servicing income. The valuation model is from an independent third party and it incorporates assumptions that market participants would use in estimating future net servicing income, such as the cost to service, the discount rate, the custodial assets earnings rate, an inflation rate, ancillary income, prepayment speeds, prepayment penalties, and default rates and losses. We review the reasonableness of the assumptions and the methodology to ensure the estimated fair value complies with accounting standards generally accepted in the United States. These variables change from quarter to quarter as market conditions and projected interest rates change, and may have an adverse impact on the value of the mortgage-servicing right and may result in a reduction to noninterest income.
Fair Value Measurements. The fair value of a financial instrument is defined as the amount at which the instrument could be exchanged in a current transaction between willing parties, other than in a forced or liquidation sale. We estimate the fair value of a financial instrument and any related asset impairment using a variety of valuation methods. Where financial instruments are actively traded and have quoted market prices, quoted market prices are used for fair value. When the financial instruments are not actively traded, other observable market inputs, such as quoted prices of securities with similar characteristics, may be used, if available, to determine fair value. When observable market prices do not exist, we estimate fair value. These estimates are subjective in nature and imprecision in estimating these factors can impact the amount of gain or loss recorded. A more detailed description of the fair values measured at each level of the fair value hierarchy and the methodology utilized by us can be found in Note 20 of our Consolidated Financial Statements "Disclosures About Fair Value of Assets and Liabilities."
Recently Issued Accounting Pronouncements
For a discussion of the expected impact of accounting pronouncements recently issued but not adopted by us as of June 30, 2017, see Note 25 of our Consolidated Financial Statements "Recent Accounting Pronouncements."
82
Our Company Overview
We are a diversified bank holding company headquartered in Carmel, Indiana and registered under the Bank Holding Company Act of 1956, as amended. We currently operate multiple lines of business with a focus on FHA multi-family housing and healthcare facility financing and servicing, mortgage warehouse financing, retail and correspondent residential mortgage banking, agricultural lending and traditional community banking. As of June 30, 2017, we had $3.1 billion in assets, $2.8 billion of deposits and $226.5 million of shareholders' equity.
We were founded in 1990 as a mortgage banking company, providing financing for multi-family housing and senior living properties. The shared vision of our founders, Michael Petrie and Randall Rogers, was to create a diversified financial services company, which efficiently operates both nationally through mortgage banking and related services and locally through a community bank. We have grown both organically and through acquisitions focused on expanding our services. We have strategically built our business in a way that we believe offers insulation from cyclical economic and credit swings and may provide synergies across our lines of business.
Experienced Board and Management Team
Our founders, Michael Petrie and Randall Rogers, each have over 38 years of industry experience. Prior to founding Merchants, Mr. Petrie and Mr. Rogers worked together as Merchants Mortgage Corporation, a company founded by Mr. Rogers, with Mr. Rogers as Chief Executive Officer and Mr. Petrie as Executive Vice President.
In addition to our founders, the other members of our executive management team collectively have, on average, over 27 years of industry experience, each with a diverse and complementary background that is an integral part of our success. Michael Dunlap, the President and Co-Chief Operating Officer of Merchants Bank, has primarily been responsible for establishing our warehouse lending platform and Merchants Mortgage, and previously served in senior management and financial roles for several mortgage companies, including as Chief Financial Officer of National City Mortgage. John Macke, our Chief Financial Officer, previously served as Executive Vice President of Capital Markets and as Chief Financial Officer of Stonegate Mortgage Corporation. Scott Evans, President of Merchants Bank's Lynn Market and Co-Chief Operating Officer, has extensive experience in community banking, including as Vice President of The Farmers State Bank for over 10 years, and is primarily responsible for our Banking segment, including our agriculture lending activities. Michael Dury, the Executive Vice President and Chief Operating Officer of P/RMIC, oversees P/RMIC's strategy and business development for multi-family and healthcare financing activities and since 2010 has originated over $3 billion of multi-family loan volume. For more information on our executive management team, see the "Management" section below in this prospectus. The below table provides a
83
summary of our executive management team and reflects each member's current respective current ownership of our common stock as of October 12, 2017.
Name
|
Title | Age | Years in Financial Services |
Years with the Company |
Ownership | ||||||||||
|---|---|---|---|---|---|---|---|---|---|---|---|---|---|---|---|
Michael F. Petrie |
Chairman and Chief Executive Officer of Merchants and Merchants Bank | 63 | 38 | 27 | 46.53 | %(1) | |||||||||
Randall D. Rogers |
President and Chief Operating Officer of Merchants, Vice Chairman of Merchants Bank | 71 | 48 | 27 | 44.84 | %(2) | |||||||||
Michael J. Dunlap |
President and Co-Chief Operating Officer of Merchants Bank | 51 | 25 | 8 | * | ||||||||||
John F. Macke |
Chief Financial Officer of Merchants and Merchants Bank | 52 | 25 | 0 | — | ||||||||||
Michael R. Dury |
Executive Vice President and Chief Operating Officer of P/RMIC | 32 | 10 | 10 | * | ||||||||||
Scott A. Evans |
Lynn Market President and Co-Chief Operating Officer of Merchants Bank | 52 | 28 | 13 | * | ||||||||||
Susan D. Kucer |
Indianapolis Market President of Merchants Bank | 62 | 35 | 2 | — | ||||||||||
Jerry F. Koors |
President of Merchants Mortgage | 53 | 26 | 4 | * | ||||||||||
Richard L. Belser |
Senior Vice President and Senior Credit Officer of Merchants Bank | 66 | 43 | 10 | — | ||||||||||
Bill D. Buchanan |
Senior Vice President and Chief Accounting Officer of Merchants and Merchants Bank | 59 | 29 | 3 | * | ||||||||||
Kevin T. Langford |
Senior Vice President and Chief Administrative Officer of Merchants Bank | 49 | 27 | 1 | — | ||||||||||
| | | | | | | | | | | | | | | | |
TOTAL |
91.57 | %(3) | |||||||||||||
| | | | | | | | | | | | | | | | |
| | | | | | | | | | | | | | | | |
| | | | | | | | | | | | | | | | |
AVERAGE |
30.36 | 9.55 | |||||||||||||
| | | | | | | | | | | | | | | | |
| | | | | | | | | | | | | | | | |
| | | | | | | | | | | | | | | | |
- *
- denotes
less than 1%
- (1)
- Includes
38.58% beneficially owned by Mr. Petrie's wife, Jody J. Petrie. See "Security Ownership of Certain Beneficial Owners and Management" for additional
information.
- (2)
- Includes
43.59% beneficially owned by Mr. Rogers' wife, Mary H. Rogers. See "Security Ownership of Certain Beneficial Owners and Management" for additional
information.
- (3)
- Includes 82.17% beneficially owned by Mr. Petrie's and Mr. Rogers' wives as described in (1) and (2) above.
Upon the closing of this offering, Messrs. Petrie and Rogers, together with their families, will hold approximately 73.97% of our outstanding common stock. Therefore, Messrs. Petrie and Rogers, together with their families, will have the ability to control the outcome of matters submitted to our shareholders for approval, including the election or removal of directors and the amendment of our articles of incorporation, along with approval of significant transactions. This control position may conflict with the interests of some or all of our other shareholders. In addition, Messrs. Petrie and Rogers, together with their families, own approximately 24.02% of our outstanding 8% Non-Cumulative, Perpetual Preferred Stock.
84
Our five non-executive directors are all successful business owners, professionals or senior executives with long-standing ties to their communities. The collective professional background of our directors provides us with valuable insights into the business and banking needs of our customer base. After the completion of this offering, our five non-executive directors and their affiliated entities, collectively, are expected to have an approximately 0.15% ownership.
Our Growth
Since our acquisition of Merchants Bank (formerly known as Greensfork Township State Bank), with assets of $6.7 million in March 2002, we have achieved significant growth in many of our key financial performance categories while maintaining an acute focus on building profitable and complementary business lines that provide for insulation from cyclical swings and create synergies within our lines of business that give us competitive advantages. We have grown our total assets from $936 million at December 31, 2012 to $3.1 billion at June 30, 2017, a compound annual growth rate of 30.4%. Total gross loans (including loans held for investment and loans held for sale) grew from $583 million at December 31, 2012 to $2.1 billion at June 30, 2017, a compound annual growth rate of 32.3%. Total deposits grew from $815 million at December 31, 2012 to $2.8 billion at June 30, 2017, a compound annual growth rate of 31.3%.
Our growth thus far is due primarily to the consistent production and efficiency of P/RMIC and the scalable growth of our warehouse lending line of business. P/RMIC has grown the unpaid principal balance of its servicing portfolio from $2.8 billion as of December 31, 2012 to $6.2 billion as of June 30, 2017, while our warehouse lending funded volumes have grown from $8.3 billion in 2012 to $24.8 billion in 2016. Over the same period we have experienced low levels of non-performing assets and charge-offs, driven principally by the nature of our lending business and our focus on originating assets with favorable risk profiles.
| Total Assets |
Total Gross Loans |
Total Deposits |
||
|---|---|---|---|---|
| ($ in Millions) |
($ in Millions) |
($ in Millions) |
||
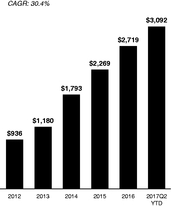
|
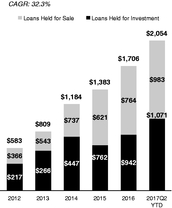
|

|
| Nonperforming Assets / Total Assets |
Net Charge-offs / Average Loans |
|
|---|---|---|
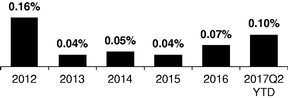
|
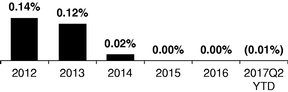
|
85
During every period since January 1, 2012, as shown in the chart below, we have maintained a return on average assets above 1.23%, a return on average tangible common equity over 19%, and an efficiency ratio under 33%. We were able to achieve these metrics despite historically earning a lower net interest rate margin than most banks, which we attribute to originating low risk shorter-term assets.
| Return on Average Assets(2) |
Return on Average Tangible Common Equity(2) |
Efficiency Ratio | Net Interest Margin(1) | |||
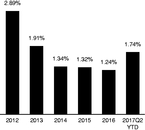
|
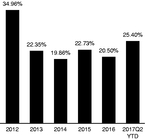
|
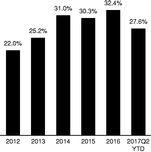
|

|
Our Corporate Structure
We have several lines of business and provide various banking and financial services through our subsidiaries as follows:
- •
- Multi-Family Rental Housing
- •
- Healthcare Financing
- •
- Servicing and Subservicing
P/RMIC (a subsidiary of Merchants Bank)
- •
- Multi-Family Rental Housing
RICHAC (a subsidiary of P/RMIC)
- •
- Warehouse Financing and Loan Participations
- •
- Commercial Lending
- •
- Retail Banking
- •
- SBA Small Business Loan Programs
- •
- Agricultural Lending
- •
- Merchants Mortgage
- •
- Single-Family Mortgage Lending
Merchants Bank of Indiana
- (2)
- In 2014, for federal income tax purposes, we converted from a Subchapter S corporation to a C corporation. The 2012 and 2013 performance metrics reflect adjustments to net income for comparability with subsequent years. Specifically, for 2012 and 2013, we adjusted net income for pro-forma federal and state corporate income tax expenses to which we were subject following our conversion to a C corporation, using an assumed income tax rate of 40%. Net income also was adjusted for 2014 to reverse the charge we recorded for the conversion of deferred tax liabilities in connection with our conversion from a Subchapter S to C corporation. These pro-forma net income metrics are non-GAAP financial measures. Refer to "Non-GAAP Financial Measures" for additional discussion regarding pro-forma net income and a reconciliation of this metric to net income.
86
- •
- Correspondent Mortgage Banking
- •
- Warehouse Financing and Loan Participations
NMF (a subsidiary of Merchants Bank)
Lines of Business
Revenues by our segments for the year ended December 31, 2016 and the six months ended June 30, 2017 were as follows:
| |
Six Months Ended June 30, 2017 | Year Ended December 31, 2016 | |||||||||||||||||
|---|---|---|---|---|---|---|---|---|---|---|---|---|---|---|---|---|---|---|---|
| (Dollars in thousands) |
Multi-Family Mortgage Banking |
Mortgage Warehousing |
Banking | Multi-Family Mortgage Banking |
Mortgage Warehousing |
Banking | |||||||||||||
| |
|
(unaudited) |
|
|
|
|
|||||||||||||
Net Interest Income |
$ | 179 | $ | 16,431 | $ | 12,438 | $ | 237 | $ | 32,117 | $ | 22,804 | |||||||
Non-Interest Income |
22,448 | 1,303 | 966 | 22,798 | 3,220 | 2,486 | |||||||||||||
| | | | | | | | | | | | | | | | | | | | |
Net Revenue |
$ | 22,627 | $ | 17,734 | $ | 13,404 | $ | 23,035 | $ | 35,337 | $ | 25,290 | |||||||
| | | | | | | | | | | | | | | | | | | | |
| | | | | | | | | | | | | | | | | | | | |
| | | | | | | | | | | | | | | | | | | | |
Percent of Net Revenues |
41.9 | % | 32.9 | % | 24.8 | % | 27.9 | % | 42.8 | % | 30.7 | % | |||||||
| | | | | | | | | | | | | | | | | | | | |
| | | | | | | | | | | | | | | | | | | | |
| | | | | | | | | | | | | | | | | | | | |
87
P/RMIC: Multi-Family Rental Housing, Healthcare Financing and Servicing
P/RMIC is primarily engaged in mortgage banking, specializing in originating and servicing loans for multi-family rental housing and healthcare facility financing, particularly for senior living properties. P/RMIC originated $1.2 billion in loans during 2016 and $906 million during the six months ended June 30, 2017. P/RMIC primarily originates FHA loans that are sold as Ginnie Mae mortgage backed securities within approximately 30 days. The loans are sold and servicing is retained. Other originations include bridge and permanent financing that are referred to the Banking segment. These loans eventually become permanent FHA financings by P/RMIC. In addition to the $1.2 billion originated directly by P/RMIC, we also funded loans brought to us by non-affiliated entities. As of June 30, 2017, P/RMIC's servicing portfolio totaled $6.2 billion, which includes both owned and subserviced loans.
P/RMIC's primary source of funding is the national secondary mortgage market. Investors in the market are large financial institutions, brokerage companies, insurance companies and real estate investment trusts. P/RMIC is an approved FHA lender and a Ginnie Mae issuer of mortgage backed securities. During 2010, P/RMIC was the most productive FHA multi-family lender in the country based on number of loans originated. It is also an approved Multifamily Accelerated Processing and HUD section 232 LEAN lender and an RHS approved lender for their Section 538 program. These programs facilitate secondary market activities in order to provide funding for the multi-family mortgage market.
P/RMIC also funds loans through the sale of participation interests to Merchants Bank, where they accrue interest for approximately 30 days before delivery to the end investor. Generally, these loans have 35 year fixed rates with 10 year call protection. The loans are predominantly insured by the FHA and RHS and rate locked as forward delivery Ginnie Mae securities, who guarantees the timely payment of principal and interest to investors. P/RMIC services the loans for a fee.
We generated approximately $22.6 and $23.0 million, or 41.9% and 27.9%, of net revenue (net interest income plus non-interest income) from our Multi-family Mortgage Banking segment for the six months ended June 30, 2017 and year ended December 31, 2016, respectively.
RICHMAC
In August 2017, P/RMIC acquired RICHMAC, a national multi-family housing mortgage lender, to compliment and expand the products and services offered by P/RMIC.
Merchants Bank: Warehouse Financing, Loan Participations and Community Banking
Merchants Bank operates under an Indiana charter and provides traditional community banking services, as well as retail and correspondent residential mortgage banking and agricultural lending. Merchants Bank has five depository branches located in Carmel, Indianapolis, and Lynn, Indiana.
Warehouse Financing and Loan Participations
Merchants Bank started our warehouse lending business in 2009 as a result of dislocation in the market. Merchants Bank currently has warehouse lines of credit and loan participations with some of the largest non-depository financial institutions in the country. As of June 30, 2017, Merchants Bank and NMF had $1.2 billion in loans outstanding from warehouse lines for credit to single and multi-family lenders and loan participations.
We generated approximately $17.7 and $35.3 million, or 32.9% and 42.8%, of net revenue (net interest income plus non-interest income) from our Mortgage Warehousing segment for the six months ended June 30, 2017 and year ended December 31, 2016, respectively.
Under its warehouse program, Merchants Bank provides warehouse financing arrangements to lenders for the origination and sale of residential mortgage loans. Merchants Bank structures its funding primarily as a loan participation and also offers secured lines of credit. Agency eligible (Fannie
88
Mae and Freddie Mac), governmental (FHA insured or Veterans Affairs ("VA") or United States Department of Agriculture ("USDA") guaranteed), and jumbo residential mortgage loans that are secured by mortgages placed on existing one– to four–family dwellings may be purchased and placed on each mortgage warehouse line.
In the case of the purchase of a loan participation interest, Merchants Bank funds the lender's origination or purchase. As a participation, Merchants Bank acts as up to a 100% participant in the loan, but the lender retains servicing rights and the fees attached to origination and servicing the loan. These loans are accounted for as loans held for sale. As a secured line of credit, collateral pledged to Merchants Bank secures each individual mortgage until the lender sells the loan to the secondary market. A traditional secured warehouse line of credit typically carries a basis of 30-day LIBOR or the Wall Street Journal Prime Rate plus a margin.
The participation agreements—unlike the mandatory funding obligations often in a traditional warehouse line of credit—provide Merchants Bank with the option to participate in up to a 100% interest in any loan offered for participation by the lenders. The elective nature of Merchants Bank's participation agreements, and its pre funding requirements including Merchants Bank's review, provides it with the ability to be selective as to the loans it will fund and affords Merchants Bank with flexibility to quickly adjust assets accordingly following unexpected swings in the market or Merchants Bank's liabilities.
Before choosing to participate in any given loan, Merchants Bank validates whether the loan is conforming and agency eligible. Upon validation, Merchants Bank approves the wire. It tracks the receipt of the collateral, the note, and holds it in its possession. Merchants Bank sends the note upon receipt of instructions from the lender as to the identity of the investor, who the lender typically has in place before the loan is made. Merchants Bank or its custodial agent sends the note to the investor under a bailment arrangement and instructs the investor to wire the proceeds directly to Merchants Bank, which applies its share of the proceeds and sends the remainder to the lender. Interest income accrues during the warehouse period. Therefore, throughout this whole process, Merchants Bank attempts to minimize any risk by controlling the cash and collateral and transferring the loan within a 45 day timeframe. These loans are usually sold to Ginnie Mae, Fannie Mae, and Freddie Mac and the FHLBI.
Commercial Lending and Retail Banking
Merchants Bank holds loans in its portfolio comprised of multi-family construction and bridge loans referred by P/RMIC, owner occupied commercial real estate loans, commercial & industrial loans, agricultural loans, residential mortgage loans and consumer loans. Merchants Bank receives deposits from customers located primarily in Hamilton, Marion, Randolph and surrounding counties in Indiana and from the escrows generated by the servicing activities of P/RMIC.
Merchants Bank's assets in its commercial loan portfolio, as of June 30, 2017, primarily consist of $39.9 million from loans secured by commercial real estate and $122.2 million from commercial and industrial loans.
SBA Lending
Merchants Bank participates in the SBA 7(a) program in order to meet the needs of our small business community, and help diversify our retail revenue stream. We originate and service, as well as sell the guaranteed portion of these loans. As of June 30, 2017, Merchants Bank had originated $4.5 million in SBA 7(a) loans in Marion and Hamilton counties in Central Indiana since our participation this program.
The SBA's 7(a) program provides up to a 75% guaranty for loans greater than $150,000. For loans $150,000 or less, the program provides up to an 85% guaranty. The maximum 7(a) loan amount is $5 million. The guaranty is conditional and covers a portion of the risk of payment default by the
89
borrower, but not the risk of improper closing and servicing by the lender. As such, prudent underwriting and closing processes are essential to effective utilization of the 7(a) program. We typically sell in the secondary market the SBA-guaranteed portion (generally 75% of the principal balance) of the loans we originate.
Agricultural Lending
MBI-Lynn, located in Lynn, Randolph County, Indiana, primarily provides agricultural loans within its designated CRA area of Randolph and Wayne counties in Eastern Indiana and nearby Darke County, Ohio. Merchants Bank offers operating lines of credit for crop and livestock production, intermediate term financing to purchase agricultural equipment and breeding livestock and long-term financing to purchase agricultural real estate. As of June 30 2017, Merchants Bank had $66.4 million of agricultural loans, including undisbursed funds of $4.3 million, in our portfolio, 48.2% of which have a FSA 90% guarantee. Merchants Bank is approved to sell agricultural loans in the secondary market through the Farmer Mac and uses this relationship to manage interest rate risk within the agricultural loan portfolio. As of June 30, 2017, Merchants Bank sold agricultural loans with an aggregate principal balance of $13.5 million to Farmer Mac without recourse. Merchants Bank has written off less than $25 thousand in loan loss in its agricultural loan portfolio since December 31, 2004.
Single Family Mortgage Lending, Correspondent Lending and Servicing
Merchants Mortgage is the branded arm and division of Merchants Bank that is a full service single-family mortgage origination and servicing platform that we launched in February 2013. Merchants Mortgage is both a retail and correspondent mortgage lender. Merchants Mortgage offers agency eligible, jumbo fixed and hybrid adjustable rate mortgages for purchase or refinancing of single-family residences. Other products include construction, bridge and lot financing and HELOC, including the All-in-One product, which links a customer's checking account balance to a first lien HELOC. Merchants Mortgage generates revenues from fees charged to borrowers, interest income during the warehouse period, and gain on sale of loans to investors. There are multiple investor outlets, including direct sale capability to Fannie Mae, Freddie Mac, FHLBI, and other third party investors to allow Merchants Mortgage a best execution at sale. Merchants Mortgage also originates loans held for investment and earns interest income over the life of the loan.
NMF: Warehouse Financing and Loan Participations
In 2014, we entered into a Revolving Subordinated Loan Agreement with Stonegate ("Stonegate Loan Agreement"), whereby, Stonegate agreed to invest up to $30 million in our subordinated debt. In exchange, we agreed to cause any funds lent by Stonegate to be contributed to NMF and to pledge all of its shares of NMF as security. We earn net interest income and use the custodial deposits to fund the loans.
On May 31, 2017 Stonegate was acquired by and became a subsidiary of Home Point. On the same date we entered into a Revolving Subordinated Loan Agreement with Home Point ("Home Point Loan Agreement"), whereby Home Point agreed to invest up to $30 million in our subordinated debt on substantially the same terms as the Stonegate Loan Agreement. This agreement with Home Point replaced the Stonegate Loan Agreement. Under the terms of the Home Point Loan Agreement, any funds lent by Home Point are contributed by us to NMF and we have pledged all of our shares of NMF to Home Point as security. Under the terms of the Home Point Loan Agreement, on a monthly basis we pay Home Point an interest payment on the amount outstanding at a rate of one-month LIBOR plus 350 basis points, plus additional interest equal to 49% of NMF's earnings. The principal balance of the amount outstanding to Home Point under the Home Point Loan Agreement, and thereby the amount on which we must pay interest, is automatically reduced by the amount of any loss recognized by NMF in the ordinary course of conducting its business. In executing the Home Point Loan Agreement the maturity date thereof was extended to March 31, 2018, with an automatic,
90
re-occurring one year renewal period unless either party provides 90 days' notice prior to the then effective maturity date.
Under the terms of master participation agreements, NMF may purchase loan participations from and provide warehouse financing to Home Point, its subsidiaries, and its correspondent customers (collectively, the "Home Point Entities"). The participation interests in the warehouse loans from NMF to the Home Point Entities provide NMF with 100% of the note rate for the loans originated by the Home Point Entities through the use of the NMF warehouse line. NMF lends at a 10/1 ratio—the average amount of NMF's loans will not exceed ten times the amount we have borrowed from Home Point.
As a result, the Home Point subordinated debt may be viewed as, in effect, a reserve for NMF's lending programs up to the amount of the subordinated debt issued to Home Point. As of June 30, 2017, Home Point had invested $30 million in our subordinated debt, resulting in a total borrowing capacity of $300 million from the Home Point Entities.
Midtown West
Midtown West owns land upon which we expect to build our new corporate headquarters building in Carmel, Indiana.
Ash Realty
Ash Realty holds assets acquired through, or in lieu of, loan foreclosures. At June 30, 2017, there were no assets held in Ash Realty.
Arcline
Merchants Bancorp owns 30% of Arcline and is accounted for using the equity method of accounting. Arcline processes warehouse and correspondent lending transactions, including on behalf of Merchants Bank.
Our Strategic Plan
Our strategic plan focuses on continuing to grow complementary business lines that will provide a diverse and stable revenue platform and create a balance between our interest and non-interest income. Our strategic plan reflects our belief that our mortgage business and community banking structure complement one another by creating important operational and revenue synergies. Our strategic plan includes five initiatives:
- •
- maintain and grow complementary and diversified business lines;
- •
- develop deep customer relationships;
- •
- execute prudent acquisitions in strategic areas;
- •
- hire experienced and talented personnel while developing talented personnel from within our organization; and
- •
- maintain a low risk profile through strong enterprise-wide risk management.
We have achieved our recent growth through focused and sustained execution of these initiatives, and we believe that we have an experienced management team in place that will allow us to continue this success.
91
Our Competitive Strengths
We believe our competitive strengths set us apart from many similarly sized community banks and mortgage banking companies, and include the following key attributes:
Diversified business lines within our mortgage banking business. Our primary business lines within our mortgage banking business are complementary and provide a diverse and stable source of revenue. Our subsidiaries and divisions are integrated and offer opportunities for operational and revenue synergies. For example, Merchants Bank provides short-term lending support for P/RMIC originations in the form of bridge or construction financing. P/RMIC, in turn, deposits custodial escrow servicing accounts at Merchants Bank, which can be invested in securities and pledged to the FHLBI for additional funding capacity. Although we are exposed to the systemic risk in the mortgage market and the economy as a whole, our performance is not directly correlated with mortgage origination volumes. For example, for the year ended December 31, 2016, our mortgage warehouse lending funding volumes increased by 23%, while the mortgage market as a whole increased by 13%. In addition, for the six months ended June 30, 2017 our mortgage warehouse lending volumes increased 4.3% compared to the six months ended June 30, 2016, while the mortgage market as a whole decreased by 4.2% (based on market volumes from Mortgage Bankers Association of America). We largely attribute our ability to succeed under various market conditions to our low efficiency ratio, which is mainly a result of to our variable cost operating model, and our balanced presence in single and multi-family finance. In rising rate environments, single family mortgage origination volumes may fall, however this should be offset through increased net interest margin. Additionally, as market interest rates rise, originations for multi-family housing may decrease, but the value of our servicing asset increases due to a lesser expectation of prepayment. In falling rate environments, we may expect to see increased gain on sale income from purchase and refinance originations in both the single and multi-family mortgage markets to offset a potential decrease in the value of our servicing asset due to higher prepayments. Thus, Merchants Mortgage's position in the single-family and P/RMIC's position in multi-family housing sector offers us an alternative against variability in the mortgage industry.
Stable source of non-interest income reduces risks associated with changes in interest rates. Just as we strive to have diversification within our business lines, we also strive to maintain a complementary and diversified revenue model. We believe that this balanced revenue stream approach can help minimize volatility in our earnings through various economic and interest rate cycles. As a result, we do not have an undue reliance on one source of income, such as net interest income, which can be materially affected by changes in interest rates, or non-interest income, which can be materially affected by reductions in mortgage volumes. Historically, P/RMIC earned fees and servicing income (non-interest income) that greatly outweighed the interest income earned by Merchants Bank. We recognize our reliance on this revenue stream and have implemented strategies to augment the revenue. Since 2012, we have increased our portfolio of loans held for investment to balance our income and to reduce our reliance on a single source of income.
| |
For the Six Months Ended June 30, |
For the Year Ended December 31, | ||||||||||||||||||||
|---|---|---|---|---|---|---|---|---|---|---|---|---|---|---|---|---|---|---|---|---|---|---|
| (Dollars in thousands) |
2017 | 2016 | 2016 | 2015 | 2014 | 2013 | 2012 | |||||||||||||||
| |
(unaudited) |
|
|
|
|
|
||||||||||||||||
Net Interest Income |
$ | 29,255 | $ | 23,819 | $ | 53,971 | $ | 42,055 | $ | 30,630 | $ | 25,708 | $ | 20,710 | ||||||||
Non-Interest Income |
24,717 | 9,951 | 28,504 | 27,008 | 20,263 | 27,284 | 36,121 | |||||||||||||||
| | | | | | | | | | | | | | | | | | | | | | | |
Net Revenue |
$ | 53,972 | $ | 33,770 | $ | 82,475 | $ | 69,063 | $ | 50,893 | $ | 52,992 | $ | 56,831 | ||||||||
| | | | | | | | | | | | | | | | | | | | | | | |
| | | | | | | | | | | | | | | | | | | | | | | |
| | | | | | | | | | | | | | | | | | | | | | | |
Net Interest Income / Net Revenue |
54 | % | 71 | % | 65 | % | 61 | % | 60 | % | 49 | % | 36 | % | ||||||||
Non-Interest Income / Net Revenue |
46 | % | 29 | % | 35 | % | 39 | % | 40 | % | 51 | % | 64 | % | ||||||||
92
Low cost and stable source of funds. Merchants Bank funds its loans, including its participation agreements and warehouse lines of credit, using funds generated primarily from mortgage related custodial deposits. Merchants Bank's cost of total deposits was 0.70% for the six months ended June 30, 2017 and its total cost of funds was 0.98% for the six months ended June 30, 2017. Custodial funds come from Merchants Bank's non-depository financial institution clients, such as servicing related escrow deposits for insurance and property taxes. These deposits are stable because the sources of the deposits have significant borrowing relationships with Merchants Bank. Merchants Bank may elect not to participate or fund loans in the event these customers decide to remove the deposits, thus we can better manage our assets with our liabilities. Merchants Bank also uses brokered deposits as a source of funding to make up for any funding gap with warehouse volumes or timing of mortgage custodial remittances. These deposits are short term and typically have one, two and three month maturities to match the temporarily higher volumes. Further, in the event Merchants Bank's deposits were insufficient to meet its customers' borrowing needs, Merchants Bank has additional available liquidity through cash reserves and available borrowing capacity of $386.4 million through the FHLBI as of June 30, 2017.
Sophisticated risk management platform. Our largest source of interest income is Merchants Bank's warehouse financing business, which we have structured to minimize risk. Merchants Bank underwrites lenders prior to entering into a warehouse lending agreement. Merchants Bank uses two different arrangements to fund agency eligible, government insured or guaranteed, or jumbo residential mortgage loans secured by mortgages placed on existing one-to-four family dwellings. The majority of our loans are funded under a participation agreement whereby Merchants Bank elects to purchase a participation interest of up to 100% in individual loans and shares proportionately in the interest income until the loan is sold in the secondary market. Merchants Bank also will fund loans under a warehouse line of credit as a secured financing. The warehouse arrangement is secured by a combination of the funded mortgage loans, cash deposits and personal guarantees of the originating lender, and Merchants Bank's initial disbursement of less than 100% of the loan amount. Merchants Bank's risk mitigation procedures include possession of collateral until the loan is sold and Merchants Bank directly receives the proceeds from the secondary market investor. In addition, prior to funding Merchants Bank reviews each loan to confirm its agency eligibility status and uses vendors to further validate loans as well as to hold the collateral securing the loan. Loans typically are sold by lenders to a third-party investor within approximately 20 days of funding, allowing Merchants Bank to minimize its risk that a loan will default prior to sale. The lenders sell most of these loans individually or through GSE (i.e., Fannie Mae, Freddie Mac, and Ginnie Mae) mortgage backed securities programs to large financial institutions or to GSEs, as the end investors. This relatively short turnover time is also part of what keeps our balance sheet assets repricing to the current rate environment and helps us manage interest rate risk, as discussed below.
Minimizing interest rate exposure. We believe that we appropriately minimize the potential for risk in our investment and loan portfolios, including risks associated with an increase in interest rates given the structure and composition of these portfolios. Our securities portfolio consists primarily of callable, government-backed securities with maturities of two years or less, all of which are available for sale. Our loan portfolio is comprised predominantly of variable interest rates or short maturities, which allows the interest rates to change with the market. As of June 30, 2017, 78.7% of Merchants Bank's assets reprice in less than 90 days. In our multi-family financing business, the vast majority of loans are sold into the secondary market with P/RMIC retaining servicing rights. P/RMIC also avoids "locking in" interest rates significantly in advance of loan closings, which further minimizes interest rate risk prior to closing of the loans.
Innovative mortgage warehouse lending platform. We believe that Merchants Bank has an innovative warehouse lending platform that may be considered as an industry leader. We have the capability to fully fund electronic mortgages through our E-Note program, one of only seven lenders in the country
93
approved by Freddie Mac to offer this solution. We are highly responsive to our customers' needs by offering MSRs and operating lines of credit selectively to warehouse lending customers. The lines of credit secured by MSR's lead to the potential to add deposits as the customer increases its servicing portfolio. In addition, customer service is especially important in the warehouse lending business because customers need to be able to rely on, with confidence, a readily accessible, stable source of funds given the timing realities of meeting and honoring mortgage loan closings or purchases. We believe that our mortgage banking expertise and experience, size and low overhead costs permit us to be responsive to customers on a level that many larger banks are unable to match. These factors contribute to Merchants Bank providing warehouse facilities to some of the leading non-depository institutions in the country.
Recent Acquisition
RICHMAC Funding, LLC. We entered into a Member Interests Purchase Agreement dated June 26, 2017, to acquire 100% of the equity interests of RICHMAC. We closed the acquisition on August 15, 2017, and issued 383,271 shares of our common stock in exchange for 100% of the equity interests of RICHMAC. The acquisition is expected to allow P/RMIC through RICHMAC to operate as a Fannie Mae Affordable Lender and a Freddie Mac Targeted Affordable Housing (TAH) Seller/Servicer, as well as a servicing portfolio of Fannie Mae and Freddie Mac loans. The acquisition is expected to provide additional product offerings, such as the Freddie Mac Bridge to Resyndication and the Fannie Mae Tax Exempt Bond Credit Enhancement, to current customers as well as broaden the origination network into attractive markets where we do not currently have a presence. RICHMAC currently operates principally in Minneapolis, Minnesota and New York, New York.
Pending Acquisition
Joy State Bank. On October 31, 2016, we entered into an Agreement and Plan of Merger to acquire Joy State Bank, an Illinois chartered bank located in Joy, Illinois. Since the timing and approval of the transaction was uncertain due to Merchants Bancorp's capital position at September 30, 2016, on December 22, 2016 the Agreement and Plan of Merger was amended and the parties agreed that Michael Petrie and Randall Rogers, two of our directors, would acquire Joy State Bank. The acquisition of Joy State Bank by Messrs. Petrie and Rogers received appropriate regulatory approvals and closed on April 3, 2017. On May 8, 2017, we entered into a Stock Purchase Agreement with Messrs. Petrie and Rogers to acquire Joy State Bank. The acquisition is expected to provide access to the Mortgage Partnership Finance (MPF) Program, an attractive program offered through the Federal Home Loan Bank of Chicago which Merchants Bank, as an Indiana chartered state bank, cannot access. We have agreed to pay a purchase price of approximately $5.4 million plus $16,403 for each 30 days after June 30, 2017, prorated to the closing date. The purchase price is equal to the price paid by Messrs. Petrie and Rogers, plus expenses and a cost of funds equal to 3.75%. The acquisition has been approved by the Federal Reserve Bank of Chicago, but remains subject to the approval of the Illinois Department of Financial and Professional Regulation, Division of Banking. We expect to close this acquisition in the first quarter of 2018.
Our Community Banking Areas
Our banking operations are largely concentrated in Carmel, Indianapolis and Lynn, Indiana.
Carmel, Indiana has experienced rapid growth over the last decade and according to the U.S. Census Bureau, based on the 2010 Census, Carmel, Indiana is the fastest growing city in Indiana.
According to the U.S. Census Bureau, the estimated population of Carmel, Indiana was 91,065 as of July 1, 2016, which represents a 141.3% increase from 2000, and, the estimated number of housing units within Carmel, Indiana was 33,012 in 2015, an increase of 11.9% from 2010. In 2015, the
94
estimated median household income for Carmel, Indiana was $106,433, which compares favorably to Indiana's median household income of $49,255.
According to the Indiana Department of Workforce Development, in 2016 9,061 estimated businesses were located in Hamilton County. Hamilton County has 1,601 professional and technical services, 744 finance and insurance businesses, and 667 construction firms.
With this diversified employment base, Hamilton County has enjoyed steady employment. According to the Indiana Department of Workforce Development, the unemployment rate for Hamilton County in 2016 was 3.2%, the lowest unemployment rate in the State of Indiana, compared to the Indiana unemployment rate of 4.4%.
Competition
We compete in a number of areas, including commercial and retail banking, residential mortgages, and multi-family FHA loan originations in the multi-family and health care sectors. These industries are highly competitive, and Merchants Bank and its subsidiaries face strong direct competition for deposits, loans, and FHA loan originations and other financial-related services. We compete with other nondepository financial institutions and community banks, thrifts and credit unions. Although some of these competitors are situated locally, others have statewide or regional presence. In addition, we compete with large banks and other financial intermediaries, such as consumer finance companies, brokerage firms, mortgage banking companies, business leasing and finance companies, insurance companies, FHA loan origination businesses, securities firms, mutual funds and certain government agencies as well as major retailers, all actively engaged in providing various types of loans and other financial services. Additionally, we face growing competition from online businesses with few or no physical locations, including online banks, lenders and consumer and commercial lending platforms, as well as automated retirement and investment service providers. We believe that the range and quality of products that we offer, the knowledge of our personnel and our emphasis on building long-lasting relationships sets us apart from our competitors.
Employees
As of June 30, 2017, we had approximately 157 employees. The Bank was named one of the "Best Places to Work in Indiana" in 2016 and 2017 by the Indiana Chamber of Commerce. None of our employees are represented by any collective bargaining unit or are parties to a collective bargaining agreement. We believe that our relations with our employees are good.
Properties
Our principal executive offices are located at 11555 North Meridian Street, Suite 400, Carmel, Indiana 46032. Including our principal executive offices, we operate a total of five branches, consisting of three branches in the Indianapolis, Indiana metropolitan area and two branches in Lynn, Indiana. We plan to relocate our principal executive offices in 2018 to a site we own in downtown Carmel, Indiana and operate a Merchants Bank branch at that location. We believe that our facilities are in
95
good condition and are adequate to meet our operating needs for the foreseeable future. The following table summarizes pertinent details of our principal executive offices, branches and new offices:
Address
|
Owned/Leased | |
|---|---|---|
| Principal Executive Office, P/RMIC and Warehouse Lending | ||
11555 North Meridian Street, Suites 400, 500, 520 and 560 |
Leased | |
Central Indiana Branches: |
||
3737 East 96th Street |
Owned | |
11590 North Meridian Street, Suite 120 (Merchants Mortgage) |
Leased |
|
Lynn, Indiana Branches: |
||
7375 South US Highway 27 |
Leased | |
6880 South Arba Pike |
Owned |
|
New Offices: |
||
4th Street SW and 4th Avenue SW |
Owned | |
RICHMAC Offices: |
||
800 Third Avenue, Suite 350 |
Leased | |
255 East Kellogg Blvd., Suite 103 |
Leased |
Legal Proceedings
We are from time to time subject to claims and litigation arising in the ordinary course of business. Currently, we are defendants in a litigation matter pending in the state court of Indiana for breach of contract related to a warehouse credit facility. Management, in consultation with legal counsel, does not expect the ultimate disposition of this matter to have a material adverse effect on our assets, business, cash flow, condition (financial or otherwise), liquidity, prospects, or results of operations. However, given the nature, scope and complexity of the extensive legal and regulatory landscape applicable to our business (including laws and regulations governing consumer protection, fair lending, fair labor, privacy, information security and anti-money laundering and anti-terrorism laws), we, like all banking organizations, are subject to heightened legal and regulatory compliance and litigation risk.
Corporate Information
Our principal executive offices are located at 11555 North Meridian Street, Suite 400, Carmel, Indiana 46032, and our telephone number at that address is (317) 569-7420. Our website address is www.merchantsbankofindiana.com. The information contained on our website is not a part of, or incorporated by reference into, this prospectus.
96
General
Insured banks, their holding companies and their affiliates are extensively regulated under federal and state law. As a result, our growth and earnings performance may be affected not only by management decisions and general economic conditions, but also by the requirements of federal and state statutes and by the regulations and policies of various bank regulatory agencies, including the IDFI, Federal Reserve, FDIC and CFPB. Furthermore, tax laws administered by the Internal Revenue Service and state taxing authorities, accounting rules developed by the Financial Accounting Standards Board, anti-money laundering laws enforced by the U.S. Department of the Treasury (the "Treasury") and mortgage related rules, including with respect to loan securitization and servicing by HUD and agencies such as Ginnie Mae and Freddie Mac, have an impact on our business. The effect of these statutes, regulations, regulatory policies and rules are significant to our operations and results, and the nature and extent of future legislative, regulatory or other changes affecting financial institutions are impossible to predict with any certainty.
Federal and state banking laws impose a comprehensive system of supervision, regulation and enforcement on the operations of financial institutions, their holding companies and affiliates that is intended primarily for the protection of the FDIC-insured deposits and depositors of banks, rather than their shareholders. These federal and state laws, and the regulations of the bank regulatory agencies issued under them, affect, among other things, the scope of business, the kinds and amounts of investments banks may make, reserve requirements, capital levels relative to operations, the nature and amount of collateral for loans, the establishment of branches, the ability to merge, consolidate and acquire, dealings with insiders and affiliates and the payment of dividends.
This supervisory and regulatory framework subjects banks and bank holding companies to regular examination by their respective regulatory agencies, which results in examination reports and ratings that, while not publicly available, can impact the conduct and growth of their businesses. These examinations consider not only compliance with applicable laws and regulations, but also capital levels, asset quality and risk, management ability and performance, earnings, liquidity, and various other factors. The regulatory agencies generally have broad discretion to impose restrictions and limitations on the operations of a regulated entity where the agencies determine, among other things, that such operations are unsafe or unsound, fail to comply with applicable law or are otherwise inconsistent with laws and regulations or with the supervisory policies of these agencies.
The following is a summary of the material elements of the supervisory and regulatory framework applicable to us. It does not describe all of the statutes, regulations and regulatory policies that apply, nor does it restate all of the requirements of those that are described. The descriptions are qualified in their entirety by reference to the particular statutory and regulatory provision.
Merchants Bancorp
Bank Holding Company Act of 1956, as amended
We, as the sole shareholder of Merchants Bank, are a bank holding company ("BHC") within the meaning of the Bank Holding Company Act of 1956, as amended ("BHC Act"). As a BHC, we are subject to the supervision, examination and reporting requirements of the BHC Act and the regulations of Federal Reserve. The BHC Act requires a BHC to file an annual report of its operations and such additional information as the Federal Reserve may require.
Acquisition of Banks
Generally, the BHC Act governs the acquisition and control of banks and nonbanking companies by BHCs.
97
A BHC's acquisition of 5% or more of the voting shares of any other bank or BHC generally requires the prior approval of the Federal Reserve and is subject to applicable federal and state law. The Federal Reserve evaluates acquisition applications based on, among other things, competitive factors, supervisory factors, adequacy of financial and managerial resources, and banking and community needs considerations.
The BHC Act also prohibits, with certain exceptions, a BHC from acquiring direct or indirect ownership or control of more than 5% of the voting shares of any "nonbanking" company unless the FRB finds the nonbanking activities be "so closely related to banking . . . as to be a proper incident thereto" or another exception applies. The current regulations of the FRB permit a BHC and its nonbank subsidiaries, among other activities, to engage in such banking-related business ventures as consumer finance, equipment leasing, data processing, mortgage banking, financial and investment advice, and securities brokerage services. The BHC Act does not place territorial restrictions on the activities of a BHC or its nonbank subsidiaries.
The BHC Act and Change in Bank Control Act, together with related regulations, prohibit acquisition of "control" of a bank or BHC without prior notice to certain federal bank regulators. The BHC Act defines "control," in certain cases, as the acquisition of as little as 10% of the outstanding shares of any class of voting stock. Furthermore, under certain circumstances, a BHC may not be able to purchase its own shares where the gross consideration will equal 10% or more of the company's net worth, without obtaining approval of the FRB.
The Federal Reserve Act subjects banks and their affiliates to certain requirements and restrictions when dealing with each other (affiliate transactions include transactions between a bank and its BHC).
Permitted Activities
Under the BHC Act, a bank holding company is generally permitted to engage in, or acquire direct or indirect control of the voting shares of companies engaged in, a wider range of nonbanking activities that the Federal Reserve determines to be so closely related to banking as to be a proper incident to the business of banking, including:
- •
- factoring accounts receivable;
- •
- making, acquiring, brokering or servicing loans and usual related activities in connection with the foregoing;
- •
- leasing personal or real property under certain conditions;
- •
- operating a non-bank depository institution, such as a savings association;
- •
- engaging in trust company functions in a manner authorized by state law;
- •
- financial and investment advisory activities;
- •
- discount securities brokerage activities;
- •
- underwriting and dealing in government obligations and money market instruments;
- •
- providing specified management consulting and counseling activities;
- •
- performing selected data processing services and support services;
- •
- acting as an agent or broker in selling credit life insurance and other types of insurance in connection with credit transactions; and
- •
- performing selected insurance underwriting activities.
98
The Federal Reserve may order a bank holding company or its subsidiaries to terminate any of these activities or to terminate its ownership or control of any subsidiary when it has reasonable cause to believe that the bank holding company's continued ownership, activity or control constitutes a serious risk to the financial safety, soundness, or stability of it or any of its bank subsidiaries. A qualifying bank holding company that elects to be treated as a financial holding company may also engage in, or acquire direct or indirect control of the voting shares of companies engaged in activities that are financial in nature or incidental to such financial activity or are complementary to a financial activity and do not pose a substantial risk to the safety and soundness of the institution or the financial system generally. We have not elected, and presently do not intend to elect, to be treated as a financial holding company.
Support of Subsidiary Institutions
The FRB has issued regulations under the BHC Act requiring a BHC to serve as a source of financial and managerial strength to its subsidiary banks. Pursuant to such regulations a BHC should stand ready to use its resources to provide adequate capital funds to its subsidiary banks during periods of financial stress or adversity.
Repurchase or Redemption of Shares
A bank holding company is generally required to give the Federal Reserve prior written notice of any purchase or redemption of its own then outstanding equity securities if the gross consideration for the purchase or redemption, when combined with the net consideration paid for all such purchases or redemptions during the preceding 12 months, is equal to 10% or more of the company's consolidated net worth. The Federal Reserve may disapprove such a purchase or redemption if it determines that the proposal would constitute an unsafe and unsound practice, or would violate any law, regulation, Federal Reserve order or directive, or any condition imposed by, or written agreement with, the Federal Reserve. The Federal Reserve has adopted an exception to this approval requirement for well-capitalized bank holding companies that meet certain conditions.
Merchants Bank
Merchants Bank is an Indiana chartered bank subject to supervision and regulation by the FDIC and IDFI.
Bank Secrecy Act and USA Patriot Act
The Bank Secrecy Act ("BSA"), enacted as the Currency and Foreign Transactions Reporting Act, requires financial institutions to maintain records of certain customers and currency transactions and to report certain domestic and foreign currency transactions, which may have a high degree of usefulness in criminal, tax, or regulatory investigations or proceedings. This law requires financial institutions to develop a BSA compliance program.
The Patriot Act, enacted as the Uniting and Strengthening America by Providing Appropriate Tools Required to Intercept and Obstruct Terrorism Act of 2001, is comprehensive anti-terrorism legislation. Title III of the Patriot Act requires financial institutions to help prevent and detect international money laundering and the financing of terrorism and prosecute those involved in such activities. The Department of the Treasury has adopted additional requirements to further implement Title III.
These regulations have established a mechanism for law enforcement officials to communicate names of suspected terrorists and money launderers to financial institutions, enabling financial institutions to promptly locate accounts and transactions involving those suspects. Financial institutions receiving names of suspects must search their account and transaction records for potential matches
99
and report positive results to the U.S. Department of the Treasury Financial Crimes Enforcement Network ("FinCEN"). Each financial institution must designate a point of contact to receive information requests. These regulations outline how financial institutions can share information concerning suspected terrorist and money laundering activity with other financial institutions under the protection of a statutory safe harbor if each financial institution notifies FinCEN of its intent to share information. The Department of the Treasury has also adopted regulations to prevent money laundering and terrorist financing through correspondent accounts that U.S. financial institutions maintain on behalf of foreign banks. These regulations also require financial institutions to take reasonable steps to ensure that they are not providing banking services directly or indirectly to foreign shell banks. In addition, banks must have procedures to verify the identity of their customers.
Merchants Bank has established an anti-money laundering program pursuant to the Bank Secrecy Act and a customer identification program pursuant to the USA Patriot Act. Merchants Bank also maintains records of cash purchases of negotiable instruments, files reports of certain cash transactions exceeding $10,000 (daily aggregate amount), and reports suspicious activity that might signify money laundering, tax evasion, or other criminal activities pursuant to the Bank Secrecy Act. Merchants Bank otherwise has implemented policies and procedures to comply with the foregoing requirements.
FDIC Improvement Act of 1991
The Federal Deposit Insurance Corporation Improvement Act of 1991 ("FDICIA") amended the Federal Deposit Insurance Act to require, among other things, federal bank regulatory authorities to take "prompt corrective action" with respect to banks which do not meet minimum capital requirements. The FDICIA established five capital tiers: well capitalized, adequately capitalized, undercapitalized, significantly undercapitalized and critically undercapitalized. The FDIC has adopted regulations to implement the prompt corrective action provisions of FDICIA.
"Undercapitalized" banks are subject to growth limitations and are required to submit a capital restoration plan. The bank's BHC is required to guarantee that the bank will comply with the plan and provide appropriate assurances of performance. If an "undercapitalized" bank fails to submit an acceptable plan, it is treated as if it is significantly undercapitalized. "Significantly undercapitalized" banks are subject to one or more restrictions, including an order by the FDIC to sell sufficient voting stock to become adequately capitalized, requirements to reduce total assets and cease receipt of deposits from correspondent banks, and restrictions on compensation of executive officers. "Critically undercapitalized" institutions may not, beginning 60 days after becoming "critically undercapitalized," make any payment of principal or interest on certain subordinated debt or extend credit for a highly leveraged transaction or enter into any transaction outside the ordinary course of business. In addition, "critically undercapitalized" institutions are subject to appointment of a receiver or conservator.
Currently, a "well capitalized" institution is one that has a total risk-based capital ratio of at least 10%, a Tier 1 risk-based capital ratio of at least 8%, a Tier 1 leverage ratio of at least 5%, a common equity Tier 1 risk-based capital ratio of at least 6.5%, and is not subject to regulatory direction to maintain a specific level for any capital measure. An "adequately capitalized" institution is one that has ratios of at least 8%, 6%, 4% and 4.5%, respectively. An institution is "undercapitalized" if any of its respective ratios is less than 8%, 6%, 4% and 4.5%, as applicable. "Significantly undercapitalized" institutions have ratios of less than 6%, 4%, 3% and 3%, respectively. An institution is deemed to be "critically undercapitalized" if it has a ratio of tangible equity to total assets that is 2% or less.
At June 30, 2017, Merchants Bank qualified for the well-capitalized category.
Deposit Insurance Fund and Financing Corporation Assessments
The Deposit Insurance Fund ("DIF") of the FDIC insures the deposits of Merchants Bank up to $250,000 per depositor, qualifying joint accounts, and certain other accounts. The FDIC maintains the
100
DIF by assessing depository institutions an insurance premium. The Dodd-Frank Act requires the FDIC to set a DIF reserve ratio of 1.35% of estimated insured deposits and to achieve this ratio by September 30, 2020.
The FDIC's risk-based assessment system requires insured institutions to pay deposit insurance premiums based on the risk that each institution poses to the DIF. The FDIC recently changed the methodology for determining assessment rates. Through the second quarter of 2016, the FDIC assigned each insured depository institution to one of four risk categories based on the institution's regulatory capital levels, supervisory evaluations, and certain other factors. The institution's risk category determines its assessment rate. Certain factors, such as brokered deposits in excess of a certain ceiling, could result in adjustments to an assessment rate. The rate is applied to the institution's total average consolidated assets during the assessment period less average tangible equity (i.e., Tier 1 capital).
Beginning in the third quarter of 2016, the first quarter after the quarter in which the DIF reserve ratio exceeded 1.15%, a new assessment regulation took effect for banks with less than $10.0 billion in assets and that have been FDIC-insured for at least five years, such as Merchants Bank. The rule replaces the four risk categories with a financial ratios method based on a statistical model estimating the insured depository institution's probability of failure over three years. The rule eliminates the adjustment factor for brokered deposits; lowers the range of assessment rates authorized to 0.015% per annum for an institution posing the least risk, to 0.40% per annum for an institution posing the most risk; and will further lower the range of assessment rates if the reserve ratio of the Deposit Insurance Fund increases to 2% or more.
In addition to its risk-based insurance assessments, the FDIC also imposes, assessments to help make $780 million in annual interest payments on approximately $8 billion of bonds issued in the late 1980s by a government corporation, the Financing Corporation ("FICO"), to help finance the recovery of the thrift industry from the savings and loan crisis. For the first quarter of 2017, Merchants Bank's FICO assessment was equal to 0.00135%, or 0.0054% annually, per $100 of assessment base. FICO assessments will continue until all outstanding bonds mature in 2019.
Dividends
We are a legal entity separate and distinct from Merchants Bank. There are various legal limitations on the extent to which Merchants Bank can supply funds to us. Our principal source of funds consists of dividends from Merchants Bank. State and federal law restrict the amount of dividends that banks may pay to its shareholders or BHC. The specific limits depend on a number of factors, including the bank's type of charter, recent earnings, recent dividends, level of capital and regulatory status. The regulators are authorized, and under certain circumstances are required, to prohibit the payment of dividends or other distributions if the regulators determine that making such payments would be an unsafe or unsound practice. For example, the FDICIA generally prohibits an insured depository institution from making any capital distribution (including payment of a dividend) or paying any management fee to its BHC if the distribution would cause the bank to become undercapitalized.
In addition, under Indiana law, Merchants Bank must obtain the approval of the IDFI prior to the payment of any dividend if the total of all dividends declared by Merchants Bank during the calendar year, including any proposed dividend, would exceed the sum of its net income for the year to date combined with its retained net income for the previous two (2) years.
As of 2016, the capital regulations began to limit a depository institution's ability to make capital distributions if it does not hold a specified capital conservation buffer above the required minimum risk-based capital ratios. There is a phase-in period that began in 2016 and concludes in 2019 with a buffer requirement of 2.5%. For 2017, the requirement is 1.25%. Regulators also review and limit proposed dividend payments as part of the supervisory process and review of an institution's capital
101
planning. In addition to dividend limitations, Merchants Bank is subject to certain restrictions on extensions of credit to us, on investments in our shares or other securities and in taking such shares or securities as collateral for loans.
Community Reinvestment Act
The CRA requires that the federal banking regulators evaluate the record of a financial institution in meeting the credit needs of its local community, including low and moderate income neighborhoods. Regulators also consider these factors in evaluating mergers, acquisitions, and applications to open a branch or facility. Failure to adequately meet these criteria could result in the imposition of additional requirements and limitations on Merchants Bank.
Capital Requirements and Basel III
Apart from the capital levels for insured depository institutions that were established by the FDIC Improvements Act of 1991 for the prompt corrective action regime discussed above, the federal regulators have issued rules that impose minimum capital requirements on both insured depository institutions and their holding companies (with the exception of bank holding companies with less than $1 billion in pro forma consolidated assets and that meet other prerequisites). Although the rules contain certain standards applicable only to large, internationally active banks, many of them apply to all banking organizations, including us and Merchants Bank. The institutions and companies subject to the rules are referred to collectively herein as "covered" banking organizations. By virtue of a provision in the Dodd-Frank Act known as the Collins Amendment, the requirements must be the same at both the institution level and the holding company level. The minimum capital rules have undergone several revisions over the years. The current requirements, which began to take effect in 2015, are based on the international Basel III capital framework. These requirements apply to all covered banking organizations (including us) with some requirements phasing in over time. All requirements will be fully effective by January 1, 2019, however, certain requirements may not become fully effective if an August 25, 2017 joint proposal of the Federal Reserve, Office of the Comptroller of the Currency and FDIC (the "Transitions NPR") becomes final that would indefinitely extend the current regulatory capital treatment under the capital rules for certain items that are noted below, including MSRs, in anticipation of a subsequent notice of proposed rulemaking by such regulators to simplify the regulatory capital treatment of such items (the "Simplification NPR").
The minimum capital requirements for all covered banking organizations (including holding companies) are the same as the "adequately capitalized" standards in the prompt corrective action regime: a common equity tier 1 risk-based capital ratio of 4.5%, a tier 1 risk-based capital ratio of 6%, a total risk-based capital ratio of 8%, and a leverage ratio of 4%. Other requirements that apply to us and the Bank are phasing in, including the following provisions that:
- •
- limit to 10% of a bank's common equity Tier 1 capital each of the MSRs, certain temporary difference deferred tax assets, and
significant investments in the common stock of certain unconsolidated banking, financial and insurance entities ("unconsolidated financial institutions"). If any of these components exceeds the 10%
threshold, the excess amount must be deducted from common equity;
- •
- set a cumulative limit on MSRs, certain temporary difference deferred tax assets, and significant investments in the common stock of certain
unconsolidated financial institutions of 15% of a bank's common equity Tier 1 capital. If these combined components exceed the 15% threshold, the surplus amount must be deducted from common
equity;
- •
- increase the percentage of additional deductions from common equity Tier 1 capital (currently at 80% and increasing to 100% starting January 1, 2018 unless delayed) for the amount of investments in capital instruments and MSRs, certain temporary difference deferred tax assets, and significant investments in the common stock of certain unconsolidated financial institutions above the 10% or 15% thresholds;
102
- •
- increase the risk-weighting from 100% to 250% (starting January 1, 2018, unless delayed) for any portion of a bank's MSRs, certain
deferred tax assets, and significant investments in the common stock of certain non-consolidated banking, financial and insurance entities that are not deducted from the calculation of common equity
Tier 1 capital;
- •
- require that 80% of the amount of non-significant investments in the capital of an unconsolidated financial institution above the 10% threshold
be deducted, and that significant investments in the capital stock of unconsolidated financial institutions not in the form of common stock be deducted from regulatory capital in their entirety by
applying the corresponding deduction approach;
- •
- set a new additional capital conservation buffer discussed above under Dividends of 2.5% of risk-weighted assets over each of the required
risk-based capital ratios that must be met to avoid limitations in the ability of a bank to pay dividends, repurchase shares or pay discretionary bonuses; and
- •
- raise the risk-weights of certain assets for purposes of calculating the risk-based capital ratios for high volatility commercial real estate ("HVCRE") acquisition, development and construction ("ADC") loans, certain past due non-residential mortgage loans and certain mortgage-backed and other securities exposures.
The Simplification NPR would change the capital treatment of MSRs, temporary difference deferred tax assets, and investments in the capital of unconsolidated financial institutions by (i) lifting the threshold at which any amount of these asset classes individually must be deducted from common equity Tier 1 capital from 10% to 25% of such capital and (ii) for investments in the capital of unconsolidated financial institutions that are not deducted from common equity Tier 1 capital, replacing the 250% risk weight with the relevant risk weight for the exposure category of the investment. The 250% risk weight would continue to apply to non-deducted MSRs and temporary difference deferred tax assets. The Simplification NPR would eliminate (i) the aggregate 15% deduction threshold that applies collectively to MSRs, temporary difference deferred tax assets, and significant investments in the common stock of unconsolidated financial institutions; (ii) the 10% common equity Tier 1 capital deduction threshold for non-significant investments in the capital of unconsolidated financial institutions; (iii) the deduction treatment for significant investments in the capital of unconsolidated financial institutions not in the form of common stock; and (iv) the distinct treatments for significant and non-significant investments in the capital of unconsolidated financial institutions.
The Simplification NPR also would revise the standardized risk-based capital rules by replacing the exposure category of HVCRE loans, which are risk-weighted at 150%, with a new category of high volatility acquisition, development or construction ("HVADC") loans, which would be risk-weighted at 130%. The definition of HVADC is intended to simplify and clarify the current definition of HVCRE loans. The regulators expect that, in the aggregate, the new definition would capture more loans than does the current definition.
In addition to modifications of the new capital rules, the Simplification NPR also would replace the current rules for the inclusion of minority interests in capital with a rule that would allow a non-advance approaches banking organization to include common equity Tier 1, Tier 1, and total capital minority interests in consolidated subsidiaries up to and including 10% of the organization's common equity Tier 1, Tier 1, and total capital (before the inclusion of any minority interest), respectively.
If the Transition NPR is finalized as substantially proposed, the capital treatment it proposes would remain in effect until the Simplification NPR is finalized and becomes effective or until the Transitions NPR is otherwise superseded.
103
The Dodd-Frank Wall Street Reform and Consumer Protection Act
On July 21, 2010, the Dodd-Frank Wall Street Reform and Consumer Protection Act (the "Dodd-Frank Act") was signed into law. The Dodd-Frank Act represented a sweeping reform of the U.S. supervisory and regulatory framework applicable to financial institutions and capital markets in the wake of the global financial crisis, certain aspects of which are described below in more detail. In particular, and among other things, the Dodd-Frank Act: (i) created a Financial Stability Oversight Council as part of a regulatory structure for identifying emerging systemic risks and improving interagency cooperation; (ii) created the CFPB, which is authorized to regulate providers of consumer credit, savings, payment and other consumer financial products and services; (iii) narrowed the scope of federal preemption of state consumer laws enjoyed by national banks and federal savings associations and expanded the authority of state attorneys general to bring actions to enforce federal consumer protection legislation; (iv) imposed more stringent capital requirements on bank holding companies and subjected certain activities, including interstate mergers and acquisitions, to heightened capital conditions; (v) with respect to mortgage lending, (a) significantly expanded requirements applicable to loans secured by 1-4 family residential real property, (b) imposed strict rules on mortgage servicing, and (c) required the originator of a securitized loan, or the sponsor of a securitization, to retain at least 5% of the credit risk of securitized exposures unless the underlying exposures are qualified residential mortgages or meet certain underwriting standards; (vi) repealed the prohibition on the payment of interest on business checking accounts; (vii) restricted the interchange fees payable on debit card transactions for issuers with $10 billion in assets or greater; (viii) in the so-called "Volcker Rule," subject to numerous exceptions, prohibited depository institutions and affiliates from certain investments in, and sponsorship of, hedge funds and private equity funds and from engaging in proprietary trading; (ix) provided for enhanced regulation of advisers to private funds and of the derivatives markets; (x) enhanced oversight of credit rating agencies; and (xi) prohibited banking agency requirements tied to credit ratings. These statutory changes shifted the regulatory framework for financial institutions, impacted the way in which they do business and have the potential to constrain revenues.
Numerous provisions of the Dodd-Frank Act were required to be implemented through rulemaking by the appropriate federal regulatory agencies. Many of the required regulations have been issued and others have been released for public comment, but are not final. Although the reforms primarily targeted systemically important financial service providers, their influence is expected to filter down in varying degrees to smaller institutions over time.
Consumer Financial Services
The structure of federal consumer protection regulation applicable to all providers of consumer financial products and services changed significantly on July 21, 2011, when the CFPB commenced operations to oversee and enforce consumer protection laws. The CFPB has broad rulemaking authority for a wide range of consumer protection laws that apply to all providers of consumer products and services, including Merchants Bank, as well as the authority to prohibit "unfair, deceptive or abusive" acts and practices. The CFPB has examination and enforcement authority over insured depository institutions and their holding companies with more than $10 billion in assets. (The CFPB has similar authority over certain nonbanking organizations.) Banks and savings institutions with $10 billion or less in assets, like Merchants Bank, will continue to be examined by their primary federal regulators, which can be expected to nonetheless look to the rulings and enforcements actions of the CFPB as they carry out their supervision of larger institutions.
Because abuses in connection with residential mortgages were a significant factor contributing to the financial crisis, many new rules issued by the CFPB and required by the Dodd-Frank Act address mortgage and mortgage-related products, their underwriting, origination, servicing and sales. The Dodd-Frank Act significantly expanded underwriting requirements applicable to loans secured by
104
1-4 family residential real property and augmented federal law combating predatory lending practices. In addition to numerous disclosure requirements, the Dodd-Frank Act imposed new standards for mortgage loan originations on all lenders, including banks and savings associations, in an effort to strongly encourage lenders to verify a borrower's ability to repay, while also establishing a presumption of compliance for certain "qualified mortgages." In addition, the Dodd-Frank Act generally required lenders or securitizers to retain an economic interest in the credit risk relating to loans that the lender sells, and other asset-backed securities that the securitizer issues, if the loans do not comply with the ability-to-repay standards described below. The risk retention requirement generally is 5%, but could be increased or decreased by regulation. Merchants Bank does not currently expect the CFPB's rules to have a significant impact on its operations, except for higher compliance costs.
S.A.F.E. Act
Regulations issued under the Secure and Fair Enforcement for Mortgage Licensing Act of 2008 (the "S.A.F.E. Act") require residential mortgage loan originators who are employees of institutions regulated by the foregoing agencies, including national banks, to meet the registration requirements of the S.A.F.E. Act. The S.A.F.E. Act requires residential mortgage loan originators who are employees of regulated financial institutions to register with the Nationwide Mortgage Licensing System and Registry, a database created by the Conference of State Bank Supervisors and the American Association of Residential Mortgage Regulators to support the licensing of mortgage loan originators by the states. The S.A.F.E. Act generally prohibits employees of regulated financial institutions from originating residential mortgage loans unless they obtain and annually maintain registration as a registered mortgage loan originator.
Mortgage Origination
On January 10, 2013, the CFPB issued a final rule implementing the "ability to repay" requirement in the Dodd-Frank Act. This rule, among other things, requires lenders to consider a consumer's ability to repay a mortgage loan before extending credit to the consumer, and limits prepayment penalties. The rule also establishes certain protections from liability for mortgage lenders with regard to the "qualified mortgages" they originate. This rule includes within the definition of a "qualified mortgage" a loan with a borrower debt-to-income ratio of less than or equal to 43% or, alternatively, a loan eligible for purchase by Fannie Mae or Freddie Mac while they operate under federal conservatorship or receivership, and loans eligible for insurance or guarantee by the FHA, VA or USDA. Additionally, a qualified mortgage may not: (i) contain excess upfront points and fees; (ii) have a term greater than 30 years; or (iii) include interest–only or negative amortization payments. This rule became effective January 10, 2014, and it has not had a significant impact on its mortgage production operations since most of the loans Merchants Bank currently originates would constitute "qualified mortgages" under the rule.
Mortgage Servicing
On January 17, 2013, the CFPB issued a series of final rules as part of an ongoing effort to address mortgage servicing reforms and create uniform standards for the mortgage servicing industry. The rules increase requirements for communications with borrowers, address requirements around the maintenance of customer account records, govern procedural requirements for responding to written borrower requests and complaints of errors, and provide guidance around servicing of delinquent loans, foreclosure proceedings and loss mitigation efforts, among other measures. These rules became effective on January 10, 2014, and have increased the costs to service loans across the mortgage industry, including our mortgage servicing operations.
Several state agencies overseeing the mortgage industry have entered into settlements and enforcement consent orders with mortgage servicers regarding certain foreclosure practices. These
105
settlements and orders generally require servicers, among other things, to: (i) modify their servicing and foreclosure practices, for example, by improving communications with borrowers and prohibiting dual-tracking, which occurs when servicers continue to pursue foreclosure during the loan modification process; (ii) establish a single point of contact for borrowers throughout the loan modification and foreclosure processes; and (iii) establish robust oversight and controls of third party vendors, including outside legal counsel, that provide default management or foreclosure services. Although we are not a party to any of these settlements or consent orders, we, like many mortgage servicers, have voluntarily adopted these servicing and foreclosure standards due to competitive pressures.
Loan Originator Compensation
On January 20, 2013 the CFPB issued a final rule under the Truth in Lending Act (Regulation Z) which imposed several requirements and restrictions on the compensation of mortgage loan originators. These compensation rules are intended to prevent originators from steering consumers into higher cost mortgages.
Consumer Laws
Merchants Bank must comply with a number of federal consumer protection laws, including, among others:
- •
- the Gramm-Leach-Bliley Act, which requires Merchants Bank to maintain privacy with respect to certain consumer data in Merchants Bank's
possession and to periodically communicate with consumers on privacy matters;
- •
- the Right to Financial Privacy Act, which imposed a duty to maintain confidentiality of consumer financial records and prescribes procedures
for complying with administrative subpoenas of financial records;
- •
- the Fair Debt Collection Practices Act, which regulates the timing and content of debt collection communications;
- •
- the Truth in Lending Act and Regulation Z thereunder, which requires certain disclosures to consumer borrowers regarding the terms of
their loans;
- •
- the Fair Credit Reporting Act, which regulates the use and reporting of information related to the credit history of consumers;
- •
- the Equal Credit Opportunity Act and Regulation B thereunder, which prohibits discrimination on the basis of age, race and certain other
characteristics, in the extension of credit;
- •
- the Homeowners Equity Protection Act, which requires, among other things, the cancellation of mortgage insurance once certain equity levels are
reached;
- •
- the Home Mortgage Disclosure Act and Regulation C thereunder, which require mortgage lenders to report certain public loan data;
- •
- the Fair Housing Act, which prohibits discrimination in housing on the basis of race, sex, national origin, and certain other characteristics;
- •
- the Real Estate Settlement Procedures Act and Regulation X thereunder, which imposes conditions on the consummation and servicing of
mortgage loans;
- •
- the Truth in Savings Act and Regulation DD thereunder, which requires certain disclosures to depositors concerning the terms of their deposit accounts; and
106
- •
- the Electronic Funds Transfer Act and Regulation E thereunder, which governs various forms of electronic banking. This statute and regulation often interact with Regulation CC of the Federal Reserve Board, which governs the settlement of checks and other payment system issues.
Future Legislation
In addition to the specific legislation described above, the current administration has signed a number of executive orders and memoranda that could directly impact the regulation of the banking industry. Congress is also considering legislation. The orders and legislation may change banking statutes and our operating environment in substantial and unpredictable ways by increasing or decreasing the cost of doing business, limiting or expanding permissible activities, or affecting the competitive balance among banks, savings associations, credit unions, and other financial institutions.
107
Board of Directors
Our board of directors currently consists of nine (9) members, all of whom are elected annually at the annual meeting of shareholders and serve one-year terms, until their successors are duly elected and qualified. Section 23-1-33-6 of the IBCL requires that any Indiana corporation that has a class of voting shares registered with the SEC provide for staggering the terms of the directors, unless within 30 days after such voting shares are registered the corporation opts out of this requirement. We intend to opt out of this requirement. Pursuant to our Bylaws, our board of directors is authorized to have nine (9) directors, unless changed by resolution of our board of directors. Our directors are not required to be a shareholder of Merchants in order to qualify to serve as a director. All directors of the Company also serve as directors of Merchants Bank.
The following table sets forth certain summary information about our current directors, including their names, ages, and year in which they began serving as a director. No current director has any family relationship, as defined in Item 401 of Regulation S-K, with any other director or with any of our executive officers.
Name
|
Age | Position | Director Since | ||||||
|---|---|---|---|---|---|---|---|---|---|
Michael F. Petrie |
63 | Chairman and Chief Executive Officer | 2006 | ||||||
Randall D. Rogers |
71 | Director, President and Chief Operating Officer | 2006 | ||||||
Michael J. Dunlap |
51 | Director | 2014 | ||||||
Scott A. Evans |
52 | Director | 2006 | ||||||
Sue Anne Gilroy |
69 | Director | 2017 | ||||||
Patrick D. O'Brien |
59 | Director | 2013 | ||||||
John W. Perry |
73 | Director | 2011 | ||||||
Anne E. Sellers |
56 | Director | 2017 | ||||||
David N. Shane |
69 | Director | 2013 | ||||||
Michael F. Petrie. Mr. Petrie has served as the Chairman and Chief Executive Officer of Merchants and Merchants Bank since October 2006 and March 2002, respectively, and President of P/RMIC since it was founded by Mr. Petrie and Mr. Rogers in August 1990. In addition to Mr. Petrie's positions at Merchants and its subsidiaries, Mr. Petrie serves as the trustee of the Michael F. Petrie & Jody J. Petrie Foundation, a director and the President of Merchants Affordable Housing Corp., not-for-profit affordable housing provider, and as a director of Petrie Investment, LLC, Joy State Bank, the Indiana Affordable Housing Council, The Community Investment Fund of Indiana, Inc., and The Children's Museum of Indianapolis. Additionally, Mr. Petrie serves on the National Board for the Indiana University Varsity Club and the Advisory Board for the Indiana University Center for Real Estate Studies. In 2005, Mr. Petrie served as Chairman of the Mortgage Bankers Association Board of Directors, Washington, D.C. Mr. Petrie is a graduate of Indiana University with both a Bachelor of Science and Master of Business Administration in finance.
Randall D. Rogers. Mr. Rogers has served as a director of Merchants and the Vice Chairman of Merchants Bank since October 2006 and March 2002, respectively, President and Chief Operating Officer of Merchants since 2011, and Chairman of P/RMIC since it was founded by Mr. Petrie and Mr. Rogers in August 1990. In addition to Mr. Rogers' positions at Merchants and its subsidiaries, Mr. Rogers is also directly involved with the Rogers Family Foundation, which is administered by Central Indiana Community Foundation, which annually directs gifts to various 501(c) organizations supporting causes such as children's arts, the environment, animal welfare, poverty, healthcare, childhood education, and re-employment support. Mr. Rogers is a graduate of The University of North Carolina at Chapel Hill with a degree in economics and of the Stonier Graduate School of Banking at Rutgers University.
108
Michael J. Dunlap. Mr. Dunlap has served as a director of Merchants since May 2014 and has been President and Co-Chief Operating Officer of Merchants Bank since May 2014. Mr. Dunlap has over 25 years of mortgage banking experience and joined Merchants Bank as Senior Vice President of Mortgage Banking in August 2009 and has been primarily responsible for establishing our warehouse lending platform and Merchants Mortgage. Prior to joining Merchants Bank, Mr. Dunlap served as Chief Financial Officer of National City Mortgage, which is now part of The PNC Financial Services Group, Inc. and prior to that held similar finance positions at Bank One, which is now part of JPMorgan Chase & Co., and Waterfield Mortgage Co., which is now part of Huntington Bancshares, Inc. In addition to Mr. Dunlap's positions at Merchants and Merchants Bank, Mr. Dunlap also serves as a director of Joy State Bank. Mr. Dunlap is a graduate of Indiana University with a degree in accounting and is a former licensed Certified Public Accountant.
Scott A. Evans. Mr. Evans has served as a director of Merchants and President and Chief Operating Officer of Merchants Bank Lynn Market since March 2004. Mr. Evans has over 28 years of community banking and related experience. Prior to joining Merchants, Mr. Evans was Assistant Vice President, Agriculture Lending at Bath State Bank, Bath, Indiana from 2002 to 2004. Also, Mr. Evans served Vice President of The Farmers State Bank, New Madison, Ohio from 1989 to 2000 where he performed a variety management functions, including with respect to compliance, human resources, information technology, information security, and accounting. In addition to Mr. Evans' positions at Merchants and Merchants Bank, Mr. Evans also serves as a director and chairman of Joy State Bank and chairman of the finance committee of Saint Vincent Randolph Hospital Foundation, and is a member of the Ohio Farm Bureau and Ohio Corn and Wheat Growers Association. Mr. Evans is a graduate of The Ohio State University with a Bachelor of Science degree in agriculture, with an emphasis in agriculture economics and finance.
Sue Anne Gilroy. Ms. Gilroy has served as a director of Merchants since June 2017. Ms. Gilroy has served as Executive Director and Vice President of Development for the St. Vincent Foundation, Indianapolis, Indiana, since 2005. Ms. Gilroy has held a number of offices in public service and previously served as Indiana's first female Secretary of State from 1994 to 2002, the first female director of Indianapolis and Marion County, Indiana's consolidated city-county government as Director of Indianapolis Parks and Recreation from 1974 to 1976, Senator Richard G. Lugar's Indiana State Director from 1990 to 1993, and on Indiana Governor Mitch Daniels' Blue Ribbon Commission on Local Government Reform in 2007. In addition, Ms. Gilroy also serves on the board of directors of University of Indianapolis, Indianapolis Oasis, and University High School, Indianapolis, Indiana, on the advisory boards of the Richard G. Lugar Center for Tomorrow's Leaders at University of Indianapolis and True Brothers Initiative of Lambda Chi Alpha Fraternity, and as trustee of the Endowment Fund Board of Tabernacle Presbyterian Church. Ms. Gilroy is a graduate of DePauw University with a degree in speech and secondary education and holds a master's degree in public administration from Indiana University, Indianapolis.
John W. Perry. Mr. Perry has served as a director of Merchants since November 2011. Since December 2004, Mr. Perry has been Senior Vice President and Trust Officer of Terre Haute Savings Bank, Terre Haute, Indiana. From 1974 to 2000 Mr. Perry served in various capacities in community banking at First Financial Corporation, Terre Haute, Indiana, and its subsidiary Terre Haute First National Bank, now known as First Financial Bank, National Association, including as Cashier, Trust Officer, Chief Financial Officer, and Board Secretary. From 2001 to 2004 Mr. Perry served as the First Vice President and Trust Officer for Union Federal Bank of Indianapolis. In addition, since 2014 Mr. Perry has also been a director of THSB Investment Company. Mr. Perry also served on the Accounting Committee of the American Bankers Association from 1988 to 1992 and is currently the Chairman of the Congregation Finance Committee for Sisters of Providence. Mr. Perry is holds a Bachelor of Science and Master of Business Administration from Indiana State University and is a graduate of the Stonier Graduate School of Banking at Rutgers University.
109
Patrick D. O'Brien. Mr. O'Brien has served as a director of Merchants since November 2013. Since 1990 Mr. O'Brien has been President of O'Brien Toyota, a Toyota dealership serving Indianapolis, Indiana. In addition, Mr. O'Brien is on the executive committee of K&P Property Development, LLC, a real estate holding company, and co-owner and managing member of Pinheads, a family entertainment center in Fishers, Indiana. Mr. O'Brien has previously served as chairman of Toyota's Regional Dealer Council, which serves a four state area including Indiana, chairman of the Chicago Region Toyota Dealer Advertising Association, and President of the Auto Dealers Association of Indiana. Mr. O'Brien is a graduate of Indiana University with a bachelor's degree in business management.
Anne E. Sellers. Ms. Sellers has served as a director of Merchants since June 2017. Since 2006 Ms. Sellers has served as Managing Principal and majority owner of Sensory Technologies, LLC, an Indianapolis based company that specializes in audiovisual integration technologies, including videoconferencing system design, web streaming and distribution, and sound and acoustic design. Ms. Sellers' has also previously served in a variety of accounting and finance roles, including with Ernst & Young. In addition, Ms. Sellers is also a member of the board of directors of the National Systems Contractors Association and The Alliance Group, a member of the executive committee of The Gathering, and a past member of the board of directors of the National Association of Women Business Owners, Indianapolis Chapter. Ms. Sellers is a graduate of DePauw University with a degree in economics.
David N. Shane. Mr. Shane has served as a director of Merchants since November 2013. Mr. Shane previously served as member of the board of managers of LDI Ltd., LLC, an Indianapolis based diversified holding company that focuses on funding and operating middle-market companies, and as its President and Chief Executive Officer from 2007 to 2012 and its Vice-President and Executive Vice-President from 1997 to 2006. From 1981 to 1995 Mr. Shane was a partner at the law firm of Baker & Daniels LLP, now part of Faegre Baker Daniels LLP. In addition, Mr. Shane is also a director at Our Health, Inc. and Syndicate Sales, Inc., and serves as a member of the board of directors of Lilly Endowment, Inc., The Mind Trust and Wabash College. Mr. Shane is an emeritus member of the board of directors of the Central Indiana Corporate Partnership and the Economic Club of Indiana. Mr. Shane is a graduate of Wabash College with a degree in English and received his juris doctor degree from Duke University School of Law.
Board and Committee Matters
Director Independence
Under the rules of The Nasdaq Stock Market LLC ("Nasdaq") and the SEC, our board of directors has affirmatively determined that five (5) of the nine (9) directors qualify as independent directors: Sue Anne Gilroy, Patrick D. O'Brien, John W. Perry, Anne E. Sellers and David N. Shane. Michael F. Petrie, Randall D. Rogers, Michael J. Dunlap, and Scott A. Evans do not qualify as independent directors because each individual is an executive officer of Merchants, Merchants Bank, and/or P/RMIC.
In addition, our board of directors has adopted a written charter to govern in the event the Chairman of the board of directors and the Chief Executive Officer of Merchants are held by the same individual. This "Lead Independent Director Charter" was developed to appoint a Lead Independent Director in the event the offices mentioned above are held by the same individual, and the Lead Independent Director will be a member of the Board who satisfies the requirements for independent directors under the Nasdaq rules. The Lead Independent Director is currently John W. Perry.
110
As described in the charter, the Lead Independent Director has responsibility for, among other things:
- •
- consulting with the Chief Executive Officer for board schedules and agendas, including advising the Chief Executive Officer as to the quality,
quantity, and timeliness of the information submitted by Merchants' management;
- •
- organize meetings of the independent directors as necessary to, in part, ensure they have adequate resources for decision making and serve as
the principal liaison between the independent directors and the Chief Executive Officer;
- •
- conducting exit interviews with all departing senior executives, as appropriate; and
- •
- handling other such matters that are specifically delegated to the Lead Independent Director by our board of directors from time to time.
Board Committees
Our board of directors currently has three (3) standing committees: an Audit Committee, a Compensation Committee, and a Nominating and Corporate Governance Committee. Each committee is comprised solely of directors that meet the definition of "independent director" under the Nasdaq rules. Each of the committees of the board of directors meets at such times as determined to be necessary.
Our board of directors also may establish such other committees as it deems appropriate, in accordance with applicable law and regulations and our articles and bylaws.
We are not considered a "controlled company" within the meaning of the corporate governance standards of Nasdaq. Messrs. Petrie and Rogers and their families comprise two separate "groups" under SEC beneficial ownership rules with one group representing the Petrie family interests and the other group representing the Rogers family interests. Each of these groups controls less than 50% of our voting power. Therefore, we do not expect to be able to utilize the "controlled company" exemption. However, if Messrs. Petrie and Rogers were to form a single "group" with combined voting power exceeding 50%, we would become a "controlled company" and would be able to avail ourselves of the exemptions from the requirement to have a majority of independent directors and independent compensation and nomination committees. We currently have no intention to utilize the "controlled company" exemptions even if they are available in the future.
Audit Committee
Our Audit Committee currently consists of John W. Perry (Chairperson), Sue Anne Gilroy, Patrick D. O'Brien, Anne E. Sellers and David N. Shane. Our board of directors has affirmatively determined that each member of the Audit Committee also satisfies the additional independence standards under the Nasdaq rules and applicable SEC rules for audit committee service and has the ability to read and understand fundamental financial statements. In addition, our board has determined that each of John W. Perry, Anne E. Seller and David N. Shane qualify as an "audit committee financial expert," as that term is defined under the applicable SEC rules.
Our Audit Committee has adopted a written charter, which sets forth the committee's duties and responsibilities. The current charter of the Audit Committee will be available on our website at www.merchantsbankofindiana.com upon completion of this offering. As described in its charter, our Audit Committee has responsibility for, among other things:
- •
- selecting and reviewing the performance of our independent auditors and approving, in advance, all engagements and fee arrangements;
111
- •
- reviewing the independence of our independent auditors;
- •
- reviewing actions by management on recommendations of the independent auditors and internal auditors;
- •
- meeting with management, the internal auditors and the independent auditors to review the effectiveness of our system of internal control and
internal audit procedures and results;
- •
- reviewing earnings releases, financial statements and reports to be filed with the SEC or otherwise;
- •
- reviewing and approving transactions for potential conflicts of interest under our Code of Conduct; and
- •
- handling other such matters that are specifically delegated to the Audit Committee by our board of directors from time to time.
Compensation Committee.
Our Compensation Committee currently consists of Patrick D. O'Brien (Chairperson), Sue Anne Gilroy, John W. Perry, Anne E. Sellers and David N. Shane.
Our Compensation Committee has adopted a written charter, which sets forth the committee's duties and responsibilities. The current charter of the Compensation Committee will be available on our website at www.merchantsbankofindiana.com upon completion of this offering. As described in its charter, our Compensation Committee has responsibility for, among other things:
- •
- reviewing, monitoring and approving our overall compensation structure, policies and programs (including benefit plans) and assessing whether
the compensation structure establishes appropriate incentives for our executive officers and other employees and meets our corporate objectives;
- •
- determining the annual compensation of our Chief Executive Officer;
- •
- establishing subjective and objective criteria to serve as the basis for other executive officers' compensation and reviewing the compensation
decisions made by our Chief Executive Officer with respect to our other named executive officers;
- •
- reviewing the talent development and executive succession planning process with our Chief Executive Officer;
- •
- overseeing the administration of our equity plans and other incentive compensation plans and programs and preparing recommendations and
periodic reports to our board of directors relating to these matters;
- •
- preparing the Compensation Committee report required by SEC rules to be included in our annual report; and
- •
- handling such other matters that are specifically delegated to the Compensation Committee by our board of directors from time to time.
Nominating and Corporate Governance Committee.
Our Nominating and Corporate Governance Committee currently consists of David N. Shane (Chairperson), Sue Anne Gilroy, Patrick D. O'Brien, John W. Perry and Anne E. Sellers.
Our Nominating and Corporate Governance Committee has adopted a written charter, which sets forth the committee's duties and responsibilities. The current charter of the Nominating and Corporate Governance Committee will be available on our website at www.merchantsbankofindiana.com upon
112
completion of this offering. As described in its charter, our Nominating and Corporate Governance Committee has responsibility for, among other things:
- •
- recommending persons to be selected by our board of directors as nominees for election as directors or to fill any vacancies on our board of
directors;
- •
- monitoring the functioning of our standing committees and recommending any changes, including the creation or elimination of any committee;
- •
- conducting annual performance evaluations of the Board, including through requests and comments from all directors of the Board;
- •
- developing, reviewing and monitoring compliance with our corporate governance guidelines, requirements of applicable laws, regulations, the
Nasdaq Rules, the Sarbanes-Oxley Act, and other federal banking laws;
- •
- reviewing annually the composition of our board of directors and committees as a whole and making recommendations on the qualifications,
independence, structure, and reporting of the same;
- •
- reviewing Merchant's Bank shareholder proposals properly submitted, including any proposed amendments to our articles of incorporation or
bylaws; and
- •
- handling such other matters that are specifically delegated to the Nominating and Corporate Governance Committee by our board of directors from time to time.
The information contained on our website is not a part of, or incorporated by reference into, this prospectus.
Compensation Committee Interlocks and Insider Participation
No member of our Compensation Committee (i) is or has ever been an employee of ours, (ii) was, during the last completed fiscal year, a participant in any related party transaction requiring disclosure under "Certain Relationships and Related Party Transactions," except with respects to loans made to such committee members in the ordinary course of business on substantially the same terms as those prevailing at the time for comparable transactions with unrelated parties or (iii) had, during the last completed fiscal year, any other interlocking relationship requiring disclosure under applicable SEC rules.
113
Executive Officers
The following table sets forth certain summary information regarding our executive officers, including their names, ages and positions.
Name
|
Age | Position | |||
|---|---|---|---|---|---|
| Michael F. Petrie | 63 | Chairman and Chief Executive Officer of Merchants and Merchants Bank | |||
| Randall D. Rogers | 71 | President and Chief Operating Officer of Merchants, Vice Chairman of Merchants Bank | |||
| Michael J. Dunlap | 51 | President and Co-Chief Operating Officer of Merchants Bank | |||
| John F. Macke | 52 | Chief Financial Officer of Merchants and Merchants Bank | |||
| Michael R. Dury | 32 | Executive Vice President and Chief Operating Officer of P/RMIC | |||
| Scott A. Evans | 52 | Lynn Market President and Co-Chief Operating Officer of Merchants Bank | |||
| Susan D. Kucer | 62 | Indianapolis Market President of Merchants Bank | |||
| Jerry F. Koors | 53 | President of Merchants Mortgage | |||
| Richard L. Belser | 66 | Senior Vice President and Senior Credit Officer of Merchants Bank | |||
| Bill D. Buchanan | 59 | Senior Vice President and Chief Accounting Officer of Merchants and Merchants Bank | |||
| Kevin T. Langford | 49 | Senior Vice President and Chief Administrative Officer of Merchants Bank | |||
The business experience of each of the executive officers documented in the table above is set forth below, except for Michael Petrie, Randall Rogers, Michael Dunlap, and Scott Evans, as the business experiences are described in the above Board of Directors section. No executive officer has any family relationship, as defined in Item 401 of Regulation S-K, with any other executive officer or any of our current directors. There are no arrangements or understandings between any of the officers and any other person pursuant to which he or she was selected as an officer.
John F. Macke. Mr. Macke joined Merchants in July 2017 as the Chief Financial Officer. Prior to joining Merchants, Mr. Macke served as Executive Vice President of Capital Markets at Stonegate Mortgage Corporation where he also served as Chief Financial Officer from April 2013 to May 2014 after joining in January 2012. Mr. Macke also held executive positions with Freedom Mortgage and Irwin Mortgage and has over 25 years of mortgage banking experience. Mr. Macke holds a Bachelor of Science degree in Business Administration from the University of Dayton and an MBA from Indiana University.
Michael R. Dury. Mr. Dury has been with P/RMIC since July 2007 in various capacities, starting as a Real Estate Investment Officer and currently in the position of Executive Vice President and Chief Operating Officer of P/RMIC. During his employment with P/RMIC, Mr. Dury has also served as the Assistant Vice President, Vice President, and Senior Vice President and Chief Operating Officer. In addition to his professional employment, Mr. Dury serves as the President of the Board of Directors of The Notre Dame Club of Indiana.
Susan D. Kucer. Ms. Kucer joined Merchants Bank in February 2016 as the President of the Indianapolis Market. Prior to joining Merchants Bank, Ms. Kucer served as Senior Vice President and the Business Banking Market Manager for PNC Bank from November 1982 through December 2016. At PNC Bank Ms. Kucer led a team of sales and relationship managers to provide deposit, lending,
114
treasury management and merchant services to business customers throughout four Midwest states. Ms. Kucer is currently on the board of Visitors for Butler University's College of Liberal Arts and Sciences and on the Board of Trustees for Brebeuf Jesuit Preparatory School.
Jerry F. Koors. Mr. Koors joined Merchants Mortgage in October 2013 as the President. Prior to joining Merchants Mortgage, Mr. Koors had served as the Regional Vice President for PNC Mortgage since February 1995. Mr. Koors has spent over 20 years in lending and bank-related management roles, including managing up to 120 loan officers in up to five states in the origination of investment quality loans sold to various agencies.
Richard L. Belser. Mr. Belser joined Merchants Bank in July 2007 as Senior Vice President and Senior Credit Officer for the Indianapolis market. Having graduated with a finance degree from the Indiana University Kelley School of Business and an MBA degree from Butler University, his banking career expands over 40 years holding executive management positions in Retail, Business, and Corporate Banking. Mr. Belser's responsibilities include Loan Administration and Chairman of the Bank's Discount Committee.
Bill D. Buchanan. Mr. Buchanan joined Merchants in August 2014 as Senior Vice President and CFO. Since passing the CPA examination in 1984, Mr. Buchanan has spent the majority of his career in senior finance/accounting managerial roles in the financial services industry, most recently as the CFO of Lafayette Community Bank, a mid-sized Indiana community bank, from September 2006 to August 2014.
Kevin T. Langford. Mr. Langford is currently the SVP and Chief Administrative Officer of Merchants Bank and his responsibilities include management of human resources, information technology, compliance and marketing. He joined Merchants Bank in January 2017. Prior to joining Merchants Bank, Mr. Langford served in various executive and management capacities with First Financial Bank, including President of Community Banking, President of Consumer Banking, CIO, and CAO.
115
As an emerging growth company under the JOBS Act, we have opted to comply with the executive compensation disclosure rules applicable to "smaller reporting companies" as such term is defined in the rules promulgated under the Securities Act, which permit us to limit reporting of executive compensation to our principal executive officer and our two other most highly compensated executive officers, which are referred to as our "named executive officers."
The compensation reported in the Summary Compensation Table below is not necessarily indicative of how we will compensate our named executive officers in the future. We will continue to review, evaluate and modify our compensation framework to maintain a competitive total compensation package. As such, and as a result of our becoming a publicly traded company, the compensation program following this offering could vary from our historical practices.
Our named executive officers for 2016, which consist of our principal executive officer and two other most highly compensated executive officers, are:
- •
- Michael F. Petrie, Chairman of the Board and Chief Executive Officer
- •
- Michael J. Dunlap, President and Co-Chief Operating Officer of Merchants Bank
- •
- Michael R. Dury, Executive Vice President and Chief Operating Officer of P/R Mortgage & Investments Corp.
Summary Compensation Table
The following table sets forth information regarding the compensation paid, awarded to, or earned for our fiscal years ended December 31, 2016 and 2015 for each of our named executive officers.
Name and Principal Position
|
Year | Salary ($) |
Bonus ($) |
Stock Awards(1) ($) |
All Other Compensation(2) ($) |
Total ($) |
|||||||||||||
|---|---|---|---|---|---|---|---|---|---|---|---|---|---|---|---|---|---|---|---|
Michael F. Petrie |
2016 | $ | 575,000 | $ | — | $ | — | $ | 17,540 | $ | 592,540 | ||||||||
Chairman of the Board and Chief |
2015 | 300,000 | — | — | 23,700 | 323,700 | |||||||||||||
Executive Officer |
|||||||||||||||||||
Michael J. Dunlap |
2016 |
225,000 |
200,000 |
56,280 |
7,950 |
489,230 |
|||||||||||||
President and Co-Chief Operating Officer of Merchants Bank |
2015 | 201,042 | 175,000 | 55,985 | 7,950 | 439,977 | |||||||||||||
Michael R. Dury |
2016 |
75,000 |
919,106(3) |
26,225 |
4,228 |
1,024,559 |
|||||||||||||
Executive Vice President and Chief |
2015 | 68,000 | 739,777(3) | 26,519 | 2,040 | 836,336 | |||||||||||||
Operating Officer of P/R Mortgage & Investments Corp. |
|||||||||||||||||||
- (1)
- The
amounts set forth in the "Stock Awards" column reflect the aggregate grant date fair value of stock awards for the years ended December 31, 2016 and 2015
in accordance with FASB ASC Topic 718. The stock award amounts are based on a fair market value per share for awards granted on March 15, 2016.
- (2)
- "All
Other Compensation" for the named executive officers during fiscal 2016 includes our match under the terms of our 401(k) Plan and for Mr. Petrie includes
monthly country club dues and assessments.
- (3)
- Mr. Dury's bonuses earned in 2016 and 2015 consist solely of the commissions calculated according to the commission schedule set forth in his employment agreement. See "Executive Compensation—Employment Agreement." Mr. Dury did not receive any discretionary bonuses.
116
General
We compensate our named executive officers (other than Mr. Petrie) through a combination of base salary, annual bonuses, equity awards, and other benefits. Our Compensation Committee believes the executive compensation packages that we provide to our executives, including the named executive officers (other than Mr. Petrie), should include both cash and equity compensation that reward performance as measured against established corporate goals. Each element of compensation is designed to achieve a specific purpose and to contribute to a total package that is competitive with similar packages provided by other institutions that compete for the services of individuals like our named executive officers.
Base Salary
The Compensation Committee reviews and approves base salaries of our named executive officers and sets the compensation of our Chief Executive Officer. In setting the base salary of each named executive officer, the Committee relied on market data provided by our internal human resources department and survey data from industry resources. The Compensation Committee also retains independent consultants as it deems appropriate. Salary levels are typically considered annually as part of our performance review process and upon a promotion or other change in job responsibility.
Bonus
Annual bonuses for Mr. Dunlap and Mr. Dury are approved by the Compensation Committee subject to the terms of their respective incentive arrangements.
Equity Awards
The equity awards we have issued historically consist of restricted stock awards issued pursuant to the Prior Incentive Plan, which, as described more fully below, allows the Compensation Committee to establish the terms and conditions of the awards, subject to the plan terms.
Benefits
401(k) Plan. The 401(k) Plan is designed to provide retirement benefits to all eligible full-time and part-time employees (including those of our subsidiaries). The 401(k) Plan provides employees with the opportunity to save for retirement on a tax-favored basis. Named executive officers, all of whom were eligible during 2016, may elect to participate in the 401(k) Plan on the same basis as all other employees. Employees may defer between 1% and 100% of their compensation to the 401(k) Plan, up to the applicable IRS limit. We currently match, dollar for dollar, the first 3% of an employee's contribution to the 401(k) Plan. Our match is contributed in the form of cash and is invested according to the employee's current investment allocation.
Health and Welfare Benefits. Our named executive officers are eligible to participate in our standard health and welfare benefits program, which offers medical, dental, vision, life, accident, and disability coverage to all of our eligible employees. We do not provide the named executive officers with any health and welfare benefits that are not generally available to our other employees.
Perquisites. We pay monthly dues and assessments for a country club membership for Mr. Petrie which he uses primarly to entertain current and prospective customers. We do not provide any other prequisities to our named executive officers.
Employment Agreements
Mr. Petrie does not have an employment agreement.
117
Mr. Dunlap does not have an employment agreement. We entered into a bonus arrangement with Mr. Dunlap which provides an opportunity for him to earn 50% of his base salary if the Bank's warehouse pretax income is 100% of the annual target and an additional $5,000 for each additional $100,000 of the Bank's warehouse pretax income in excess of the target up to a maximum of base salary.
We entered into an "at will" employment agreement dated December 29, 2010, as amended effective January 1, 2017, with Mr. Dury which provides for a base salary of $53,500, which we have increased from time to time in our discretion, and the opportunity to earn commissions on loan fees received by us on loans originated by Mr. Dury. The loan fees on which Mr. Dury earns commissions are determined in our sole discretion and do not include fees paid prior to or after closing, or fees paid by any party other than the borrower.
Under the employment agreement, Mr. Dury had the opportunity to earn commissions for 2015 and 2016 on the basis below:
Fees on Loans Originated by Mr. Dury
|
Commissions Earned by Mr. Dury | |
|---|---|---|
Under $107,000 |
None | |
Exceeds $107,000 but less than $250,000 |
20% of fees in excess of $107,000 |
|
Exceeds $250,000 |
$14,300 plus 20% of fees in excess of $250,000 |
Under the amended employment agreement, Mr. Dury has the opportunity to earn commissions for 2017 on the basis below:
Fees on Loans Originated by Mr. Dury
|
Commissions Earned by Mr. Dury | |
|---|---|---|
Under $107,000 |
None | |
Exceeds $107,000 but less than $250,000 |
20% of fees in excess of $107,000 |
|
Exceeds $250,000 but less than $500,000 |
$14,300 plus 20% of fees in excess of $250,000 |
|
Exceeds $500,000 but less than $750,000 |
$64,300 plus 25% of fees in excess of $500,000 |
|
Exceeds $750,000 |
$126,000 plus 30% of fees in excess of $750,000 |
Mr. Dury's employment agreement includes certain restrictive covenants, including a 12-month non-competition period.
Long-Term Incentive Plans
Equity based incentive awards are currently made though our 2017 Equity Incentive Plan (the "2017 Incentive Plan"). We also maintain the Incentive Plan for Merchants Bank of Indiana Executive Officers (the "Prior Incentive Plan"). As of the effective date of the 2017 Equity Incentive Plan, no further awards shall be granted under the Prior Incentive Plan. However, any previously outstanding incentive award granted under the Prior Incentive Plan remains subject to the terms of such plans until the time it is no longer outstanding.
Merchants Bancorp 2017 Equity Incentive Plan
General. The 2017 Equity Incentive Plan was adopted by our Board on June 22, 2017 and approved by our shareholders on July 5, 2017. The 2017 Equity Incentive Plan was designed to ensure availability of equity awards that will assist us in attracting, retaining and rewarding key employees, directors and other service providers. Pursuant to the 2017 Equity Incentive Plan, a committee of the Board (the "Committee") is allowed to grant awards to eligible persons in the form of qualified and non- qualified stock options, restricted stock, restricted stock units, stock appreciation rights and other
118
incentive awards. Up to 1,500,000 shares of common stock are available for issuance under the 2017 Equity Incentive Plan.
Awards vest, become exercisable and contain such other terms and conditions as determined by the Committee and set forth in individual agreements with the participants receiving the awards. Awards to our Chief Executive Officer must have a vesting period of at least three (3) years. The plan enables the Committee to set specific performance criteria, in compliance with the United States Treasury Department's final "Guidance on Sound Incentive Compensation Policies," that must be met before an award vests under the 2017 Equity Incentive Plan. In establishing criteria, the Committee must attempt to balance risk and financial results in a manner that does not encourage participants to expose us to unnecessary or excess risks. At least 50% of any award to the Chief Executive Officer must be performance-based. An award agreement with the Chief Executive Officer also must stipulate that the Chief Executive Officer will hold shares of stock received for at least a 12-month period after vesting requirements are satisfied, unless the Chief Executive Officer incurs a termination of service, in which case the holding period ends on the termination date.
The 2017 Equity Incentive Plan allows for acceleration of vesting and exercise privileges of grants if a change in control occurs and a participant incurs a termination of service without cause following the change in control or in the event of a participant's death or total disability. If a participant's job is terminated for cause, then all unvested awards expire at the date of termination.
Eligibility. All employees and directors of, and service providers to, us and our subsidiaries are eligible to become participants in the Plan, except that non-employees may not be granted incentive stock options. The Committee will determine the specific individuals who will be granted awards under the 2017 Equity Incentive Plan and the type and amount of any such awards.
Options. The Committee may grant incentive stock options and non-qualified stock options to purchase Company common stock at an exercise price determined under the award. Each stock option must be granted pursuant to an award agreement setting forth the terms and conditions of the individual award. Awards of stock options may expire no later than 10 years from the date of grant (and no later than five years from the date of grant in the case of a 10% shareholder with respect to an incentive stock option).
The exercise price of an option generally may not be less than the fair market value of Company common stock on the date the option is granted (or, if greater, the book value of a share of stock). The exercise price of an incentive stock option awarded to a 10% shareholder may not be less than 110% of the fair market value of the stock on the date the option is granted. The exercise price of an option may, however, be higher or lower than the grant date fair market value for an option granted in replacement of an existing award held by an employee, director or service provider of a third party that is acquired by us or one of our subsidiaries. The exercise price of an option may not be decreased after the date of grant nor may an option be surrendered to us as consideration for the grant of a replacement option with a lower exercise price, except as approved by our shareholders, or as adjusted for corporate transactions described above.
Options awarded under the 2017 Equity Incentive Plan will be exercisable in accordance with the terms established by the Committee. Any incentive stock option granted under the 2017 Equity Incentive Plan that does not qualify as an incentive stock option will be deemed to be a non-qualified stock option and the Committee may unilaterally modify any incentive stock option to disqualify it as an incentive stock option. The full purchase price of each share of stock purchased upon the exercise of any option must be paid at the time of exercise of an option. Except as otherwise determined by the Committee, the purchase price of an option may be paid in cash, by personal, certified or cashiers' check, in shares of Company common stock (valued at fair market value as of the day of exercise) either via attestation or actual delivery, by net exercise such that, without the payment of any funds, the net number of shares of stock received will be equal in value to the number of shares of stock as to
119
which the option is being exercised, multiplied by a fraction, the numerator of which is the fair market value less the exercise price, and the denominator of which is such fair market value, by other property deemed acceptable by the Committee, by irrevocably authorizing a third party to sell shares of Company common stock and remit a sufficient portion of the proceeds to us, or by other property deemed acceptable or a combination thereof.
Stock Appreciation Rights. Stock appreciation rights entitle the participant to receive cash and/or stock equal in value to, or based on the value of, the amount by which the fair market value of a specified number of shares on the exercise date exceeds an exercise price established by the Committee. The exercise price for a stock appreciation right generally may not be less than the fair market value of the stock on the date the stock appreciation right is granted, provided, however, that the exercise price may be higher or lower for a stock appreciation right granted in replacement of an existing award held by an employee, director or service provider of a third party that is acquired by us or one of our subsidiaries. Stock appreciation rights will be exercisable in accordance with the terms established by the Committee.
Stock Awards. A stock award is a grant of shares of Company common stock or a right to receive shares of Company common stock (or an equivalent amount of cash or a combination of both) in the future. Such awards may include, but are not limited to, bonus shares, stock units, performance shares, performance units, restricted stock or restricted stock units or any other equity based award as determined by the Committee.
The specific conditions, including the performance measures, performance objectives or period of service requirements that may apply to stock awards are set by the Committee in its discretion.
Cash Incentive Awards. A cash incentive award is the grant of a right to receive a payment of cash (or Company common stock having a value equivalent to the cash otherwise payable), determined on an individual basis or as an allocation of an incentive pool that is contingent on the achievement of performance objectives established by the Committee. The Committee may grant cash incentive awards that may be contingent on achievement of a participant's performance objectives over a specified period established by the Committee. The grant of cash incentive awards may also be subject to such other conditions, restrictions and contingencies, as determined by the Committee.
Dividends. If an award provides a participant with the right to receive dividend payments or dividend equivalent payments with respect to the shares of Company common stock subject to the award, the participant may receive such dividend payments or dividend equivalent payments only upon satisfaction of all vesting requirements under the award. In such an event, dividend payments may be made currently or credited to an account for the participant and may be settled in cash or Company common stock and be subject to restrictions similar to the underlying award.
Forfeiture. Unless specifically provided to the contrary in an award agreement, upon notification of termination of employment for cause, in the case of employees, and termination of service for cause, in the case of non-employee directors or other service providers, any outstanding award held by such employee, non-employee director or service provider will terminate immediately, the award will be forfeited and the participant will have no further rights thereunder.
No Reuse of Shares. Shares of Company common stock underlying an award (including stock awards) under the 2017 Equity Incentive Plan that are forfeited or not delivered to a participant or beneficiary for any reason are deemed to have been delivered for purposes of determining the maximum number of shares available under the 2017 Equity Incentive Plan. Those forfeited or undelivered shares are ineligible for issuance in subsequent awards. If a participant satisfies the payment of the exercise price of an option by net exercise, no offset is made against the number of
120
shares issued for purposes of determining the number of shares counted toward the maximum available under the plan.
Section 162(m) of the Code. Under Section 162(m) of the Internal Revenue Code, the deduction for a publicly held corporation for otherwise deductible compensation to a "covered employee" (the chief executive officer and the next three most highly compensated executive officers (other than the chief financial officer)) is limited to $1 million per year. However, in the case of a corporation that becomes a publicly held corporation in connection with an initial public offering, the $1 million per year deduction limit does not apply during a limited "transition period" to any remuneration paid pursuant to a compensation plan that existed during the period in which the corporation was not publicly held, if the prospectus accompanying the initial public offering disclosed information concerning those plans that satisfied all applicable securities laws then in effect.
We intend to rely on the transition relief described in the immediately preceding paragraph in connection with awards under the 2017 Equity Incentive Plan until the earliest of the four following events: (i) the expiration of the 2017 Equity Incentive Plan; (ii) the material modification of the 2017 Equity Incentive Plan; (iii) the issuance of all stock and other compensation that has been allocated under the 2017 Equity Incentive Plan; or (iv) the first meeting of our shareholders at which directors are to be elected that occurs after the close of the third calendar year following the calendar year in which the initial public offering of our common stock occurs.
Change in Control. Unless otherwise provided in an award agreement, upon the occurrence of a change in control of the Company (as defined in the 2017 Equity Incentive Plan) and a participant's termination of service without cause following the change in control, all outstanding stock options and stock appreciation rights held by the participant will become fully exercisable and all stock awards or cash incentive awards held by the participant will become fully earned and vested. If the vesting of an award is conditioned on achievement of performance measures that are less than 50 percent attained at the time of the change in control, then a portion of the award becomes vested and exercisable. If achievement of performance measures are 50 percent or more attained, then the award becomes fully earned and vested immediately upon the change in control. In the event an award constitutes "deferred compensation" for purposes of Section 409A of the Internal Revenue Code, and the settlement or distribution of benefits under such award are triggered by a change in control followed by termination without cause, such settlement or distribution will be subject to the change in control also constituting a "change in control event" under Section 409A of the Internal Revenue Code.
Amendment and Termination. The 2017 Equity Incentive Plan will remain in effect as long as any awards under it are outstanding; provided, however, that no awards may be granted after the 10 year anniversary of the effective date of the 2017 Equity Incentive Plan. We generally reserve the right to amend or terminate the 2017 Equity Incentive Plan at any time, except that, once our shares have been listed on Nasdaq, the Plan may not be amended without the approval of our shareholders to permit:
- •
- a material increase of the benefits accruing to participants;
- •
- a material increase of the number of shares of stock that may be issued; or
- •
- a material modification of the requirements for participation;
provided, however, that the 2017 Equity Incentive Plan may be amended at any time to conform to any present or future law, including but not limited to amendments to the 2017 Equity Incentive Plan or outstanding awards in order to comply with, or to avoid the application of, Section 409A of the Internal Revenue Code, and related regulations and guidance.
121
U.S. Federal Income Tax Treatment. Under present U.S. federal income tax laws, awards granted under the 2017 Equity Incentive Plan generally should have the following tax consequences:
Non-Qualified Stock Options. The grant of a non-qualified option generally will not result in taxable income to the participant. The participant generally will realize ordinary income at the time of exercise in an amount equal to the excess of the fair market value of the shares acquired over the exercise price for those shares and we will be entitled to a corresponding income tax deduction. Gains or losses realized by the participant upon disposition of such shares generally will be treated as capital gains and losses, with the basis in such shares equal to the fair market value of the shares at the time of exercise.
Incentive Stock Options. The grant of an incentive stock option generally will not result in taxable income to the participant. The exercise of an incentive stock option generally will not result in taxable income to the participant provided that the participant was (without a break in service) an employee during the period beginning on the date of the grant of the option and ending on the date three months prior to the date of exercise (one year prior to the date of exercise if the participant is "disabled," as that term is defined in the Internal Revenue Code).
The excess of the fair market value of the shares at the time of the exercise of an incentive stock option over the exercise price generally will be an adjustment that is included in the calculation of the participant's alternative minimum taxable income for the tax year in which the incentive stock option is exercised. For purposes of determining the participant's alternative minimum income tax liability for the year of disposition of the shares acquired pursuant to the incentive stock option exercise, the participant will have a basis in those shares equal to the fair market value of the shares at the time of exercise.
If the participant does not sell or otherwise dispose of the shares within two years from the date of the grant of the incentive stock option or within one year after the transfer of such stock to the participant, then, upon disposition of such shares, any amount realized in excess of the exercise price generally will be taxed to the participant as capital gain. A capital loss will be recognized to the extent that the amount realized is less than the exercise price.
If the foregoing holding period requirements are not met, the participant generally will realize ordinary income at the time of the disposition of the shares, in an amount equal to the lesser of (i) the excess of the fair market value of the shares on the date of exercise over the exercise price, or (ii) the excess, if any, of the amount realized upon disposition of the shares over the exercise price and we generally will be entitled to a corresponding deduction. If the amount realized exceeds the value of the shares on the date of exercise, any additional amount generally will be capital gain. If the amount realized is less than the exercise price, the participant generally will recognize no income, and a capital loss will be recognized equal to the excess of the exercise price over the amount realized upon the disposition of the shares.
Stock Appreciation Rights. The grant of a stock appreciation right generally will not result in taxable income to the participant. Upon exercise of a stock appreciation right, the fair market value of shares received generally will be taxable to the participant as ordinary income and we will be entitled to a corresponding income tax deduction. Gains and losses realized by the participant upon disposition of any such shares generally will be treated as capital gains and losses, with the basis in such shares equal to the fair market value of the shares at the time of exercise.
Stock Awards. A participant who has been granted a stock award generally will not realize taxable income at the time of grant, provided that the stock subject to the award is not delivered at the time of grant, or if the stock is delivered, it is subject to restrictions that constitute a "substantial risk of forfeiture" for U.S. federal income tax purposes and the participant has not filed an Internal Revenue Code Section 83(b) election to be taxed at the time of grant. Upon the later of delivery or vesting of
122
shares subject to an award (or the filing of a Code Section 83(b) election), the participant generally will realize ordinary income in an amount equal to the then fair market value of those shares and we will be entitled to a corresponding deduction. Gains or losses realized by the participant upon disposition of such shares generally will be treated as capital gains and losses, with the basis in such shares equal to the fair market value of the shares at the time of delivery or vesting (or the filing of an Internal Revenue Code Section 83(b) election). In the case of stock awards settled in cash, the participant generally will realize taxable income at the time the cash is distributed and we will be entitled to a corresponding income tax deduction.
Cash Incentive Awards. A participant generally will realize taxable income at the time the cash incentive award is distributed and we will be entitled to a corresponding deduction.
Withholding of Taxes. All distributions under the 2017 Equity Incentive Plan are subject to withholding of all applicable taxes and the Committee may condition the delivery of any shares or other benefits under the 2017 Equity Incentive Plan on satisfaction of the applicable withholding obligations. Except as otherwise provided by the Committee, such withholding obligations generally may be satisfied through cash payment by the participant, through the surrender of shares of our common stock that the participant already owns or through the surrender of shares of our common stock to which the participant is otherwise entitled under the 2017 Equity Incentive Plan.
Clawback. All awards, amounts or benefits received under the 2017 Equity Incentive Plan are subject to potential cancellation and/or payback to us based on any applicable Company clawback policy or applicable law.
Incentive Plan for Merchants Bank of Indiana Executive Officers
We adopted the Prior Incentive Plan effective January 1, 2016, to align performance objectives for executive officers with our long-term objectives, attract the highest quality executive officers by providing competitive compensation levels, and to retain high-performing executive officers. Under the Prior Incentive Plan, we granted awards to eligible persons in the form of restricted stock or a combination of restricted stock and cash. Following shareholder approval of the 2017 Equity Incentive Plan, no additional grants shall be available to be made under the Prior Incentive Plan. Awards that were granted under Prior Incentive Plan vest, become exercisable and contain such other terms and conditions determined by the Committee and set forth in individual agreements with the executives who received the awards. The Prior Incentive Plan allows for acceleration of vesting and exercise privileges of grants prior to the consummation of a change in control transaction, or the death or total disability of the participant. If a participant's job is terminated for cause, then all unvested awards expire at the date of termination.
Outstanding Equity Awards at Fiscal Year End
The following table provides information for each of our named executive officers regarding outstanding unvested stock awards held by the officers as of December 31, 2016, as adjusted for stock splits.
123
None of our named executive officers had outstanding stock options as of December 31, 2016. Market values are presented as of the end of 2016 (based on the assumed per share fair market value of our common stock of $15.60 on December 31, 2016).
| |
Stock Awards | ||||||
|---|---|---|---|---|---|---|---|
Name
|
Number of Shares or Units of Stock That Have Not Vested(1) (#) |
Market Value of Shares or Units of Stock That Have Not Vested ($) |
|||||
Michael F. Petrie |
— | — | |||||
Michael J. Dunlap |
7,147.50 | $ | 111,501 | ||||
Michael R. Dury |
3,352.50 | 52,299 | |||||
- (1)
- All awards in this column vest in one-third increments on the first, second and third anniversary of the date of grant. These equity awards are accelerated and vest in full upon a change in control. For any increment of an award that vests and would result in a fractional share (due to our 2.5 for 1 stock split), the recipient will be paid cash in lieu of such fractional share as of date that such increment vests.
Director Compensation
The following table sets forth information regarding 2016 compensation for each of our nonemployee directors.
Name
|
Fees Earned or Paid in Cash ($) |
Total ($) |
|||||
|---|---|---|---|---|---|---|---|
Thomas W. Dinwiddie |
$ | 16,500 | $ | 16,500 | |||
Patrick D. O'Brien |
21,500 | 21,500 | |||||
John W. Perry |
23,500 | 23,500 | |||||
David N. Shane |
14,000 | 14,000 | |||||
Non-executive Director fees for 2016 were based upon meeting fees for service on the Company and Bank boards of directors. Non-executive directors were paid $3,000 per meeting for service on the Company board. Members of the Boards' committees, as well as the chairpersons thereof were paid an additional fee of $1,000 and $1,500 per meeting, respectively. No additional compensation was paid to our directors for service as a director of the Bank.
124
CERTAIN RELATIONSHIPS AND RELATED PARTY TRANSACTIONS
In addition to the compensation arrangements with directors and executive officers described in "Executive Compensation" above, the following is a description of transactions since January 1, 2014, to which we have been a party in which the amount involved exceeded or will exceed $120,000, and in which any of our directors, executive officers or beneficial holders of more than five percent of our capital stock, or their immediate family members or entities affiliated with them, had or will have a direct or indirect material interest.
Pending Acquisition of Joy State Bank
On October 31, 2016, we entered into an Agreement and Plan of Merger to acquire Joy State Bank, an Illinois chartered bank located in Joy, Illinois. Since the timing and approval of the transaction was uncertain due to our capital position at September 30, 2016, on December 22, 2016 the Agreement and Plan of Merger was amended and the parties agreed that Michael Petrie and Randall Rogers, two of our directors, would acquire Joy State Bank. The acquisition of Joy State Bank by Messrs. Petrie and Rogers received appropriate regulatory approvals and closed on April 3, 2017. On May 8, 2017, we entered into a Stock Purchase Agreement with Messrs. Petrie and Rogers to acquire Joy State Bank. The Stock Purchase Agreement was approved by our board of directors, and the amendment to the Agreement and Plan of Merger was ratified by our board of directors, with Messrs. Petrie and Rogers abstaining from the vote and were excused from the meeting at the time of the vote. These votes were not considered by the Audit Committee or a special committee. The acquisition is expected to provide access to the Mortgage Partnership Finance (MPF) Program, an attractive program offered through the Federal Home Loan Bank of Chicago which Merchants Bank, as an Indiana chartered state bank, cannot access. We have agreed to pay a purchase price of approximately $5.4 million plus $16,403 for each 30 days after June 30, 2017, prorated to the closing date. The purchase price is equal to the price paid by Messrs. Petrie and Rogers, plus expenses and a cost of funds equal to 3.75%. The acquisition has been approved by the Federal Reserve Bank of Chicago, but remains subject to the approval of the Illinois Department of Financial and Professional Regulation, Division of Banking. We expect to close this acquisition in the first quarter of 2018.
Preferred Stock Issuance
In connection with the private placement of our 8% Non-Cumulative, Perpetual Preferred Stock which we commenced in December 2015, the following directors and executive officers purchased shares of our preferred stock for $1,000 per share: Michael F. Petrie, a director and Chairman and Chief Executive Officer of Merchants, 5,000 shares; Randall D. Rogers, a director and President and Chief Operating Officer of Merchants, 5,000 shares; Patrick D. O'Brien, a director, 1,000 shares; Susan Kucer, Indianapolis Market President of Merchants Bank, 250 shares; and Michael Dury, Execitive Vice President and Chief Operating Officer of P/RMIC 300 shares. We received and aggregate of $11.6 million from such directors and executive officers for such preferred stock. All of these directors and executive officers paid the same purchase price per share as paid by the other investors in our preferred stock offering.
Common Stock Issuance
In connection with our private placement of common stock which we commenced in December 2014, our director, Patrick D. O'Brien, and Executive Vice President and Chief Operating Officer of P/RMIC, Michael Dury, purchased $250,000 and $200,000, respectively, of our common stock. Messrs. O'Brien and Dury paid the same purchase price per share as paid by the other investors in our common stock offering.
125
Employment Relationships with Related Parties
We employ Matt Kaercher, the son-in-law of our Chairman and Chief Executive Officer, Michael F. Petrie, as SVP, Originations of P/RMIC, and Mr. Petrie's brother, John Petrie, as SVP, Chief Underwriter of P/RMIC. Mr. Kaercher's base salary for 2017 is $71,700 and his compensation and benefits for 2016, 2015 and 2014 totaled $413,912, $308,498 and $83,395, respectively, which amounts consisted of a base salary, production bonus and benefits. John Petrie's base salary for 2017 is $114,500 and his compensation and benefits for 2016, 2015 and 2014 totaled $149,991, $144,676 and $138,671, respectively, which amounts consisted of a base salary, a bonus and benefits.
We employ Randall Rogers, Jr., the son of our President and Chief Operating Officer, Randall D. Rogers, as VP, Originator of P/RMIC. Mr. Rogers's base salary for 2017 is $90,400 and his compensation and benefits for 2016, 2015 and 2014 totaled $112,906, $137,811 and $95,961, respectively, which amounts consisted of a base salary, production bonus and benefits.
Legal Services from Related Party
Our former director, Thomas W. Dinwiddie, is a partner with the law firm of Wooden & McLaughlin LLP in Indianapolis, Indiana. Wooden & McLaughlin LLP performs various legal services on our behalf and we paid them $1,362,915 for the six months ended June 30 2017 while Mr. Dinwiddie was a director and $2,084,423, $1,890,458 and $1,813,874 in 2016, 2015 and 2014, respectively.
Ordinary Banking Relationships
Our directors, officers, beneficial owners of more than 5% of our voting securities and their associates were customers of and had transactions with us in the past, and additional transactions with these persons are expected to take place in the future. All outstanding loans and commitments to loan with these persons were made in the ordinary course of business, were made on substantially the same terms, including interest rates and collateral, as those prevailing at the time for comparable loans with persons not related to us or the Bank and did not involve more than the normal risk of collectability or present other unfavorable features. All such loans are approved by the Bank's board of directors in accordance with the bank regulatory requirements. Similarly, all certificates of deposit and depository relationships with these persons were made in the ordinary course of business and involved substantially the same terms, including interest rates, as those prevailing at the time for comparable depository relationships with persons not related to us or the Bank.
Policies and Procedures Regarding Related Party Transactions
Transactions by us or the Bank with related parties are subject to certain regulatory requirements and restrictions, including Sections 23A and 23B of the Federal Reserve Act (which govern certain transactions by the Bank with its affiliates) and the Federal Reserve's Regulation O (which governs certain loans by the Bank to its executive officers, directors and principal shareholders).
Under applicable SEC and Nasdaq rules, related party transactions are transactions in which we are a participant, the amount involved exceeds $120,000 and a related party has or will have a direct or indirect material interest. Our related parties include directors (including nominees for election as directors), executive officers, five percent shareholders and the immediate family members of these persons. In accordance with the Audit Committee Charter, related party transactions are evaluated in accordance with our Code of Conduct. Related party transactions are referred to Audit Committee for approval. In determining whether to approve a related party transaction, the Audit Committee will consider, among other factors, the fairness of the proposed transaction, the direct or indirect nature of the related party's interest in the transaction, the appearance of an improper conflict of interests for any director or executive officer taking into account the size of the transaction and the financial position of the related party, whether the transaction would impair an outside director's independence, the acceptability of the transaction to our regulators and the potential violations of other corporate policies.
126
SECURITY OWNERSHIP OF CERTAIN BENEFICIAL OWNERS AND MANAGEMENT
The following table sets forth information as of October 12, 2017 regarding the beneficial ownership of our common stock, and as adjusted to reflect the completion of this offering:
- •
- each shareholder known by us to beneficially own more than 5% of our outstanding common stock,
- •
- each of our directors,
- •
- each of our named executive officers, and
- •
- all of our directors and executive officers as a group.
We have determined beneficial ownership in accordance with the rules of the SEC. These rules generally provide that a person is the beneficial owner of securities if such person has or shares the power to vote or direct the voting of securities, or to dispose or direct the disposition of securities, or has the right to acquire such powers within 60 days. Except as disclosed in the footnotes to this table, we believe that each person identified in the table has sole voting and investment power over all of the shares shown opposite such person's name.
The percentage of beneficial ownership is based on 21,497,667 shares of our common stock outstanding as of October 12, 2017 and 27,053,222 shares to be outstanding after the completion of this offering (or 27,886,555 shares if the underwriters exercise their option to purchase additional shares in full). The table does not reflect any shares of common stock that may be purchased in this offering, including through the directed share program described under "Underwriting." Because certain shares may have deemed beneficial ownership, such shares are included in the table with ownership by more than one person.
127
The address for each person listed in the table below is: c/o Merchants Bancorp, 11555 North Meridian Street, Suite 400, Carmel, Indiana, 46032.
| |
|
|
Shares Beneficially Owned After the Offering | |||||||||||||
|---|---|---|---|---|---|---|---|---|---|---|---|---|---|---|---|---|
| |
Shares Beneficially Owned Prior to the Offering |
|
If Underwriters' Option Not Exercised |
If Underwriters' Option Exercised in Full |
||||||||||||
Name
|
Number | % | Number | % | % | |||||||||||
5% shareholders: |
||||||||||||||||
Jody J. Petrie(1) |
10,003,050 | 46.53 | % | 10,003,050 | 36.98 | % | 35.87 | % | ||||||||
Mary H. Rogers(2) |
9,639,999 | 44.84 | % | 9,639,999 | 35.63 | % | 34.57 | % | ||||||||
Directors and named executive officers: |
||||||||||||||||
Michael J. Dunlap |
11,425 | * | 11,425 | * | * | |||||||||||
Michael R. Dury |
20,675 | * | 20,675 | * | * | |||||||||||
Scott A. Evans |
575 | * | 575 | * | * | |||||||||||
Sue Anne Gilroy |
— | — | — | — | — | |||||||||||
Patrick D. O'Brien |
25,000 | * | 25,000 | * | * | |||||||||||
John W. Perry |
10,000 | * | 10,000 | * | * | |||||||||||
Michael F. Petrie(3) |
10,003,050 | 46.53 | % | 10,003,050 | 36.98 | % | 35.87 | % | ||||||||
Randall D. Rogers(4) |
9,639,999 | 44.84 | % | 9,639,999 | 35.63 | % | 34.57 | % | ||||||||
Anne E. Sellers |
— | — | — | — | — | |||||||||||
David N. Shane |
5,000 | * | 5,000 | * | * | |||||||||||
All directors and executive officers as a group (16 persons) |
19,726,248 | 91.76 | % | 19,726,248 | 72.92 | % | 70.74 | % | ||||||||
- *
- denotes
less than 1%
- (1)
- Jody
J. Petrie is the wife of Michael F. Petrie and is the sole trustee of the following trusts: The Michael F. Petrie Grantor Retained Annuity Trust (4,957,250
shares); The Julia L. Petrie Irrevocable GST Trust 2010 (950,000 shares); and The Emily J. Petrie Irrevocable GST Trust 2010 (950,000 shares). Mrs. Petrie individually holds 1,436,000 shares
and her beneficial ownership also includes 1,709,800 shares held individually by Mr. Petrie as to which Mrs. Petrie may be deemed to have beneficial ownership. Mrs. Petrie
disclaims beneficial ownership of shares held individually by Mr. Petrie.
- (2)
- Mary
H. Rogers is the wife of Randall D. Rogers and is the sole trustee of the following trusts: The Randall D. Rogers Grantor Retained Annuity Trust (7,624,812
shares); The Katherine H. Rogers Irrevocable GST Trust 2011 (582,000 shares); The Carey Rogers Kulongoski Irrevocable GST Trust 2010 (582,000 shares); and The Randall D. Rogers, Jr. Irrevocable GST
Trust 2011 (582,000 shares). Mrs. Rogers' beneficial ownership also includes 269,187 shares held individually by Mr. Rogers as to which Mrs. Rogers may be deemed to have
beneficial ownership. Mrs. Rogers disclaims beneficial ownership of shares held individually by Mr. Rogers.
- (3)
- Includes
(i) 1,709,800 shares held individually by Mr. Petrie, (ii) 4,957,250 shares held by The Michael F. Petrie Grantor Retained Annuity
Trust of which Jody J. Petrie is the sole trustee and Mr. Petrie is the sole annuitant as to which Mr. Petrie may be deemed to have beneficial ownership, and (iii) an additional
3,336,000 shares held individually by Mrs. Petrie. Mr. Petrie disclaims beneficial ownership of all shares that he does not hold individually.
- (4)
- Includes (i) 269,187 shares held individually by Mr. Rogers, (ii) 7,624,812 shares held by The Randall D. Rogers Grantor Retained Annuity Trust of which Mary H. Rogers is the sole trustee and Mr. Rogers is the sole annuitant as to which Mr. Rogers may be deemed to have beneficial ownership, and (iii) an additional 1,746,000 shares held individually by Mrs. Rogers. Mr. Rogers disclaims beneficial ownership of all shares that he does not hold individually.
128
The following is a summary of the material rights of our capital stock and related provisions of our articles of incorporation, or articles, and bylaws. The following description of our capital stock does not purport to be complete and is subject to, and qualified in its entirety by, our articles and bylaws, which we have included as exhibits to the registration statement of which this prospectus is a part. We urge you to read these documents for a more complete understanding of shareholder rights.
Our articles authorize the issuance of up to 50,000,000 shares of common stock, without par value, and up to 5,000,000 shares of preferred stock, without par value. At October 12, 2017, we had issued and outstanding 21,497,667 shares of our common stock and 41,625 shares of our 8% Non-Cumulative, Perpetual Preferred Stock. We have reserved an additional 1,500,000 shares for issuance in connection with awards that remain available for issuance under our 2017 Equity Incentive Plan.
Common Stock
Governing Documents. Holders of shares of our common stock have the rights set forth in our articles, our bylaws and the IBCL.
Dividends and Distributions. The holders of our common stock are entitled to share equally in any dividends that our board of directors may declare from time to time out of funds legally available for dividends, subject to limitations under Indiana law and any preferential rights of holders of our then outstanding preferred stock.
Ranking. Our common stock ranks junior with respect to dividend rights and rights upon liquidation, dissolution or winding up to all our other securities and indebtedness.
Upon any voluntary or involuntary liquidation, dissolution or winding up, the holders of our common stock are entitled to share equally, on a per share basis, in all of our assets available for distribution, after payment to creditors and subject to any prior distribution rights granted to holders of any then outstanding shares of preferred stock.
Conversion Rights. Our common stock is not convertible into any other shares of our capital stock.
Preemptive Rights. Holders of our common stock do not have any preemptive rights.
Voting Rights. The holders of our common stock are entitled to one vote per share on any matter to be voted on by the shareholders. The holders of our common stock are not entitled to cumulative voting rights with respect to the election of directors. A plurality of the shares voted shall elect all of the directors then standing for election at a meeting of shareholders at which a quorum is present.
Redemption. We have no obligation or right to redeem our common stock.
Stock Exchange Listing. We have applied to list our common stock on the Nasdaq Capital Market under the trading symbol "MBIN."
Preferred Stock
General. Upon authorization of our board of directors, we may issue shares of one or more series of our preferred stock from time to time. Our 8% Non-Cumulative, Perpetual Preferred Stock is currently the only designated series of preferred stock. As of October 12, 2017, 50,000 shares of preferred stock had been designated as 8% Non-Cumulative, Perpetual Preferred Stock and 41,625 shares of our 8% Non-Cumulative, Perpetual Preferred Stock were issued and outstanding. Our articles of incorporation may be amended in accordance with the IBCL to increase the number of authorized shares of preferred stock that we may issue. Our Board of directors may, without any action by holders of common stock and except as may be otherwise provided in the terms of any series of
129
preferred stock of which there are shares outstanding, adopt resolutions to designate and establish a new series of preferred stock. Upon establishing such a series of preferred stock, the Board will determine the number of shares of preferred stock of that series that may be issued and the rights and preferences of that series of preferred stock. The rights of any series of preferred stock may include, among others:
- •
- general or special voting rights;
- •
- preferential liquidation rights;
- •
- preferential cumulative or noncumulative dividend rights;
- •
- redemption or put rights; and
- •
- conversion or exchange rights.
We may issue shares of, or rights to purchase shares of, one or more series of our preferred stock that have been designated from time to time, the terms of which might:
- •
- adversely affect voting or other rights evidenced by, or amounts otherwise payable with respect to, the common stock or other series of
preferred stock;
- •
- discourage an unsolicited proposal to acquire us; or
- •
- facilitate a particular business combination involving us.
Any of these actions could have an anti-takeover effect and discourage a transaction that some or a majority of our shareholders might believe to be in their best interests or in which our shareholders might receive a premium for their stock over our then market price.
Governing Documents. Holders of shares of 8% Non-Cumulative, Perpetual Preferred Stock have the rights set forth in our articles, our bylaws and the IBCL.
Ranking. Our 8% Non-Cumulative, Perpetual Preferred Stock, with respect to dividend rights ranks on a parity with, and with respect to rights upon a liquidation, dissolution and winding up ranks senior to, our common stock.
Dividends and Other Distributions. Subject to certain regulatory restrictions discussed in "Dividend Policy," holders of shares of our 8% Non-Cumulative, Perpetual Preferred Stock are entitled to receive, when, as and if declared by the board of directors, out of funds legally available for the payment of dividends, cash dividends to the same extent and on the same basis as cash dividends as declared by the board of directors with respect to shares of our common stock. Such dividends on shares of 8% Non-Cumulative, Perpetual Preferred Stock are payable on the same dates as dividends on shares of common stock but prior to the payment of any dividends on shares of common stock.
Voting. Holders of our 8% Non-Cumulative, Perpetual Preferred Stock do not have voting rights, except as provided below or as otherwise required by the IBCL. When voting rights are applicable, each holder of our 8% Non-Cumulative, Perpetual Preferred Stock has one vote per share.
So long as any shares of 8% Non-Cumulative, Perpetual Preferred Stock are outstanding, we may not, without the written consent or affirmative vote of the holders of a majority of the outstanding shares of our 8% Non-Cumulative, Perpetual Preferred Stock (i) amend or alter any provision of our articles so as to create or increase materially adversely affect the preferences, rights or powers of our 8% Non-Cumulative, Perpetual Preferred Stock, provided that any such amendment that changes any dividend payable on or liquidation preference of our 8% Non-Cumulative, Perpetual Preferred Stock, (ii) amend or alter any provision of our articles so as to create or increase any class or series of our capital stock ranking senior to our 8% Non-Cumulative, Perpetual Preferred Stock or (iii) exchange or reclassify any shares of our 8% Non-Cumulative, Perpetual Preferred Stock, or a merger or
130
consolidation with another company, except if the shares of our 8% Non-Cumulative, Perpetual Preferred Stock remain outstanding or exchanged into shares of the surviving or resulting entity in case of a merger or consolidation, or such shares remain outstanding and the preferences, rights and powers are not materially less favorable to the holders.
Liquidation Rights. In the event of our liquidation, dissolution or winding up, whether voluntary or involuntary, and before any payment or distribution of our assets (whether capital or surplus) may be made to holders of securities ranking junior to the 8% Non-Cumulative, Perpetual Preferred Stock, the holders of shares of our 8% Non-Cumulative, Perpetual Preferred Stock are entitled to receive $1,000 per share of 8% Non-Cumulative, Perpetual Preferred Stock plus any unpaid dividends whether or not declared.
Conversion Rights. Holders of shares of our 8% Non-Cumulative, Perpetual Preferred Stock do not have conversion rights.
Preemptive Rights. Holders of shares of our 8% Non-Cumulative, Perpetual Preferred Stock do not have any preemptive rights.
Redemption. We have no obligation redeem shares of our 8% Non-Cumulative, Perpetual Preferred Stock. Commencing in December 2020, we may redeem in whole or in part, shares of our 8% Non-Cumulative, Perpetual Preferred Stock for a price equal to $1,000 per share of 8% Non-Cumulative, Perpetual Preferred Stock plus any unpaid dividends whether or not declared.
Stock Exchange Listing. Our preferred stock has not been approved for listing on any stock exchange.
Anti-Takeover Considerations and Special Provisions of Our Articles, Bylaws and Indiana Law
Indiana law and certain provisions of our articles and bylaws could have the effect of delaying or deferring the removal of incumbent directors or delaying, deferring or discouraging another party from acquiring control of us, even if such removal or acquisition would be viewed by our shareholders to be in their best interests. These provisions, summarized below, are intended to encourage persons seeking to acquire control of us to first negotiate with our board of directors. These provisions also serve to discourage hostile takeover practices and inadequate takeover bids. We believe that these provisions are beneficial because the negotiation they encourage could result in improved terms of any unsolicited proposal.
Removal of Directors. Our articles specify that, as permitted by the IBCL, directors may be removed with or without cause by the affirmative votes of a majority of the actual and then in office and by the affirmative vote of a majority of the shares entitled to vote on the election of directors.
Noncumulative Voting for Directors. Our directors are elected by plurality and not cumulative voting, which may make it more difficult for a non-company nominee to be elected to our board of directors.
Authorized But Unissued Capital Stock. We have authorized but unissued shares of common stock and preferred stock, and our board of directors may authorize the issuance of one or more series of preferred stock without shareholder approval. These shares could be used by our board of directors to make it more difficult or to discourage an attempt to obtain control of us through a merger, tender offer, proxy contest or otherwise.
Limitation on Right to Call a Special Meeting of Shareholders. Our bylaws provide that special meetings of shareholders may only be called by our Board, Chairman, or Chief Executive Officer, or by
131
the holders of not less than 25% of our outstanding shares of capital stock entitled to vote for the purpose or purposes for which the meeting is being called.
Advance Notice Provisions. Our bylaws include a provision that permits shareholders of record to make nominations for the election of directors and proposals for any business or matter to be presented at any annual or special meeting of shareholders only if notice of such proposal is given to us not less than 90 days and no more than 120 days prior to the date of the meeting. The advance notice provision gives the board adequate time to respond to the shareholder proposal. If the shareholder fails to provide the notice within the time prescribed under the bylaws, our management can exclude the proposal at the shareholders meeting
Action By Unanimous Written Consent of Shareholders. Our bylaws provide that any action required or permitted to be taken by the holders at a duly called annual or special meeting of the holders of our capital stock may be effected by any consent in writing by all our shareholders.
Filling of Board Vacancies. Our bylaws permit our board of directors to increase, by resolution, the number of persons serving as directors and to fill the vacancies created as a result of the increase by a majority vote of the directors present at the meeting.
Amendment of the Bylaws. Our bylaws provide that our bylaws may be altered, amended or repealed by the affirmative vote of a majority of our actual number of directors without prior notice to or approval by our shareholders. Accordingly, our board could take action to amend our bylaws in a manner that could have the effect of delaying, deferring or discouraging another party from acquiring control of us.
Limits on Acquisition of Additional Shares. Our articles provide that any person who acquires an aggregate of 10% of our then outstanding common stock in connection with a tender or exchange offer, open market purchase or business combination, is required to offer and pay for such additional shares an amount which is at least equal to the highest price paid to acquire shares of our common stock then held by such person unless such subsequent acquisition has been approved by a majority of the board of directors.
Indiana Law Takeover Protections. Indiana's control share acquisitions statute, IBCL Section 23-1-42-1 et seq., provides that unless otherwise indicated in the corporation's articles of incorporation or bylaws, if a shareholder acquires shares of a corporation's voting stock (referred to as control shares) within one of several specified ranges (one-fifth or more but less than one-third, one-third or more but less than a majority, or a majority or more), approval of a majority of the disinterested shareholders must be obtained before the acquiring shareholder may vote the control shares. Under certain circumstances, including in the event that shareholder approval is not obtained, the shares held by the acquirer may be redeemed by the corporation at the fair value of the shares as determined by the control share acquisition provision. The control share acquisition provision does not apply to a plan of merger or share exchange, if the corporation complies with the applicable merger provisions and is a party to the plan of merger or plan of share exchange. Merchants has opted out of the control share acquisition provision.
Indiana's business combination statute, IBCL Section 23-1-43-1 et seq., restricts a business combination between the target corporation and an interested shareholder absent certain statutory exceptions. Under the business combinations provision of the IBCL, any shareholder who acquires a 10%-or-greater ownership position in an Indiana corporation with a class of voting shares registered under Section 12 of the Exchange Act (and that has not opted-out of this provision) is prohibited for a period of five years from completing a business combination (generally a merger, significant asset sale or disposition or significant issuance of additional shares) with the corporation unless, prior to the acquisition of such 10% interest, the board of directors of the corporation approved either the
132
acquisition of such interest or the proposed business combination. If such board approval is not obtained, then five years after a 10% shareholder has become such, a business combination with the 10% shareholder is permitted if all provisions of the articles of the corporation are complied with and either a majority of disinterested shareholders approves the transaction or all shareholders receive a price per share determined in accordance with the fair price criteria of the business combinations provision of the IBCL. An Indiana corporation may elect to remove itself from the protection provided by the Indiana business combinations provision, but such an election remains ineffective for 18 months and does not apply to a combination with a shareholder who acquired a 10% ownership position prior to the election. Merchants has not elected to remove itself from the protections of this provision.
The IBCL and our articles permit directors, in discharging their duties, to consider the best interests of a corporation, to consider the effects of any action on shareholders, employees, suppliers, and customers of the corporation, and communities in which offices or other facilities of the corporation are located, and any other factors the directors consider pertinent. Constituency statutes and our articles give a target's board the discretion to favor a deal that is better for the corporation's employees, the community and local economy over a deal with a higher price, but more detrimental effects to the community.
Limitation on Liability and Indemnification of Officers and Directors
Under the IBCL, an Indiana corporation may indemnify an individual made a party to a proceeding because the individual is or was a director against liability incurred in the proceeding if (i) the individual's conduct was in good faith, (ii) the individual reasonably believed, in the case of conduct in the individual's official capacity with the corporation, that the individual's conduct was in the best interests of the corporation, and in all other cases, that the individual's conduct was at least not opposed to the corporation's best interests, and (iii) in the case of any criminal proceeding, the individual either had reasonable cause to believe that the individual's conduct was lawful, or the individual had no reasonable cause to believe that the individual's conduct was unlawful.
Unless limited by its articles of incorporation, a corporation must indemnify a director who was wholly successful, on the merits or otherwise, in the defense of any proceeding to which the director was a party because the director is or was a director of the corporation against reasonable expenses incurred by the director in defense of the proceeding. In addition, unless limited by its articles of incorporation, an officer of a corporation, whether or not a director, is entitled to mandatory indemnification to the same extent as a director, and a corporation may also indemnify and advance expenses to an officer, employee or agent to the same extent as to a director.
Our articles provide that, to the extent not inconsistent with applicable law, we shall indemnify each of our directors, officers, employees and agents against all liability and reasonable expense that may be incurred by him or her in connection with or resulting from any claim in which he or she may become involved by reason of the fact that he or she is or was a director, officer, employee or agent of us or by reason of any action taken or not taken by him or her in any such capacity, if such person is wholly successful with respect to the claim or, if not wholly successful, then if such person is determined to have acted in good faith, in what he or she reasonably believed to be the best interests of us (or at least not opposed to its best interests) and, in addition, with respect to a criminal claim, is determined to have had reasonable cause to believe that his or her conduct was lawful or had no reasonable cause to believe that his or her conduct was unlawful. Our indemnification extends to attorney fees, disbursements, judgments, fines, penalties or settlements. We may also advance expenses or undertake the defense of a director, officer or employee upon receipt of an undertaking by such person to repay such expenses if it should ultimately be determined that he or she is not entitled to indemnification.
133
In order for a director, officer or employee to be entitled to indemnification, the person must be wholly successful with respect to such claim or either our board of directors acting by a quorum consisting of directors who are not parties to, or who have been wholly successful with respect to such claim, action, suit or proceeding, or independent legal counsel must determine that the director, officer or employee has met the standards of conduct required by our articles.
The IBCL permits us to purchase insurance on behalf of our directors, officers, employees and agents against liabilities arising out of their positions with us, whether or not such liabilities would be within the above indemnification provisions. Pursuant to this authority, we maintain such insurance for the directors, officers and employees of Merchants and its subsidiaries.
Transfer Agent and Registrar
The transfer agent and registrar for our common stock is Computershare, Inc. The transfer agent and registrar's address is 462 South 4th Street, Suite 1600, Louisville, Kentucky 40202 and the telephone number is (800) 962-4284.
134
SHARES ELIGIBLE FOR FUTURE SALE
Prior to this offering, there has been no established public market for our common stock. Future sales of substantial amounts of our common stock in the public market, or the perception that such sales may occur, could adversely affect market prices prevailing from time to time. Furthermore, because only a limited number of shares will be available for sale shortly after this offering due to existing contractual and legal restrictions on resale as described below, there may be sales of substantial amounts of our common stock in the public market after the restrictions lapse. This may adversely affect the prevailing market price and our ability to raise equity capital in the future.
Upon completion of this offering, we will have 27,053,222 shares of common stock outstanding. Of these shares, 5,555,555 shares of our common stock (or 6,388,888 shares if the underwriters exercise their option to purchase additional shares in full) sold in this offering will be freely transferable without restriction or further registration under the Securities Act, except for any shares purchased by our "affiliates," as that term is defined in Rule 144 under the Securities Act. The remaining 21,497,667 shares of our common stock outstanding are "restricted shares" as defined in Rule 144. Restricted shares may be sold in the public market only if registered under the Securities Act or if they qualify for an exemption from registration under Rule 144. As a result of the contractual 180-day lock-up period described below, 20,094,396 of these shares will be available for sale in the public market only after 180 days from the date of this prospectus (generally subject to volume and other offering limitations).
Rule 144
In general, a person who has beneficially owned restricted shares of our common stock for at least six months would be entitled to sell such securities, provided that (i) such person is not deemed to have been one of our affiliates at the time of, or at any time during the 90 days preceding, the sale and (ii) we are subject to the Exchange Act periodic reporting requirements for at least 90 days before the sale. Persons who have beneficially owned restricted shares of our common stock for at least six months but who are our affiliates at the time of, or any time during the 90 days preceding, the sale, would be subject to additional restrictions, by which such person would be entitled to sell within any three-month period only a number of securities that does not exceed the greater of the following:
- •
- 1% of the number of shares of our common stock then outstanding, which will equal approximately 270,532 shares immediately after this offering
(or approximately 278,886 shares if the underwriters exercise their option to purchase additional shares in full); or
- •
- the average weekly trading volume of our common stock on the Nasdaq Capital Market during the four calendar weeks preceding the filing of a notice on Form 144 with respect to the sale;
provided, in each case, that we are subject to the Exchange Act periodic reporting requirements for at least 90 days before the sale. Such sales both by affiliates and by non-affiliates must also comply with the manner of sale and notice provisions of Rule 144 to the extent applicable.
Registration Statement on Form S-8
In connection with or as soon as practicable following the completion of this offering, we intend to file a registration statement with the SEC on Form S-8 to register an aggregate of approximately 1,500,000 shares of our common stock reserved for future issuance under our 2017 Equity Incentive Plan, as described further under "Executive Compensation—2017 Equity Incentive Plan." That registration statement will become effective upon filing and shares of common stock covered by such registration statement will be eligible for sale in the public market immediately after the effective date of such registration statement (unless held by affiliates) subject to the lock-up agreements described below.
135
Lock-up Agreements
Each of our directors, executive officers, and significant shareholders have agreed, and participants in the directed share program will agree, subject to certain exceptions, not to offer, pledge, sell, contract to sell, sell any option or contract to purchase, purchase any option or contract to sell, grant any option, right or warrant for the sale of, otherwise dispose of or transfer any shares of our common stock or any securities convertible into or exchangeable or exercisable for common stock for a period of 180 days after the date of this prospectus, without the prior written consent of Sandler O'Neill & Partners, L.P. and Stephens Inc. on behalf of the underwriters. See "Underwriting." The underwriters do not have any present intention or arrangement to release any shares of our common stock subject to lock-up agreements prior to the expiration of the 180-day lock-up period.
136
MATERIAL UNITED STATES FEDERAL INCOME TAX CONSIDERATIONS FOR NON-U.S. HOLDERS
The following describes the material United States federal income tax consequences relevant to non-U.S. holders, as defined below, of the purchase, ownership and disposition of our common stock. This discussion is based on current provisions of the Internal Revenue Code of 1986, as amended (the "Code"), Treasury regulations and judicial and administrative authority, all of which are subject to change, possibly with retroactive effect. This section does not consider the Medicare contribution tax, net investment tax, state, local, estate, gift, sales, use, excise or foreign tax consequences, nor does it address tax consequences to special classes of investors, including, but not limited to:
- •
- tax-exempt organizations;
- •
- United States expatriates;
- •
- former long-term residents of the United States;
- •
- insurance companies;
- •
- investment funds;
- •
- banks or other financial institutions;
- •
- partnerships or other entities classified as partnerships or other pass-through entities for United States federal income tax purposes;
- •
- dealers or brokers in securities or currencies;
- •
- persons subject to alternative minimum tax;
- •
- traders in securities that elect to use a mark-to-market method of accounting for their securities holdings;
- •
- persons who have acquired our common stock as compensation or otherwise in connection with the performance of services;
- •
- persons that will hold our common stock as a position in a hedge, straddle, synthetic security or other integrated or conversion transaction, a
constructive sale or other risk reduction transaction;
- •
- persons who purchase or sell our common stock as part of a wash sale as defined for federal income tax purposes;
- •
- pension plans;
- •
- tax-qualified retirement plans;
- •
- regulated investment companies;
- •
- real estate investment trusts;
- •
- foreign governments or governmental entities; or
- •
- a person or U.S. investor whose "functional currency" is not the United States dollar.
Tax consequences may vary depending upon the particular status of an investor. The summary is limited to non-U.S. holders who will hold our common stock as "capital assets" as defined in Code Section 1221 (generally, property held for investment). Each potential non-U.S. investor should consult its own tax advisor as to the United States federal, state, local, estate, gift, sales, use, excise, foreign and any other tax consequences of the purchase, ownership and disposition of our common stock.
137
You are a "non-U.S. holder" if you are a beneficial owner of our common stock for United States federal income tax purposes that is:
- (1)
- a
nonresident alien individual as defined for United States federal income tax purposes;
- (2)
- a
foreign corporation (or other entity that is taxable as a foreign corporation) as defined for United States federal income tax purposes;
- (3)
- an
estate whose income falls outside of the federal income tax jurisdiction of the United States; or
- (4)
- a trust if (i) a court within the United States is not able to exercise primary supervision over its administration or no United States person has the authority to control all substantial decisions of the trust, or (ii) that does not have a valid election in place, that is available to certain trusts, to be treated as a U.S. person for U.S. federal income tax purposes.
If an entity or arrangement treated as a partnership for United States federal income tax purposes holds our common stock, the tax treatment of a partner in the partnership will generally depend upon the status of the partner and the activities of the partnership. If you are an entity taxable as a partnership or a partner in such an entity holding our common stock, you should consult your tax advisor as to the United States federal income tax consequences applicable to you.
Distributions
Distributions with respect to our common stock will be treated as dividends when paid to the extent of our current and accumulated earnings and profits as determined for United States federal income tax purposes. Amounts not treated as dividends for U.S. federal income tax purposes will constitute a return of capital and will first be applied against and reduce a holder's tax basis in our common stock, but not below zero. Any excess will be treated as gain realized on the sale or other disposition of our common stock and will be treated as described under the section of this prospectus supplement titled "—Sale or Redemption" below.
Except as described below as income effectively connected with a trade or business and subject to the discussion below regarding backup withholding and FATCA, if you are a non-U.S. holder of our shares, dividends paid to you are subject to withholding of United States federal income tax at a 30% rate or at a lower rate if you are eligible for the benefits of an income tax treaty that provides for a lower rate. Even if you are eligible for a lower treaty rate, we and other payors will generally be required to withhold at a 30% rate (rather than the lower treaty rate) on dividends paid to you, unless you have furnished to us or another payor:
- •
- a valid IRS Form W-8BEN, W-8BEN-E, another applicable variation of Form W-8 or an acceptable substitute form upon which you
certify, under penalties of perjury, your status as a non-U.S. person and your entitlement to the lower treaty rate with respect to such payments, or
- •
- in the case of payments made outside the United States to an offshore account (generally, an account maintained by you at an office or branch of a bank or other financial institution at any location outside the United States), other documentary evidence establishing your entitlement to the lower treaty rate in accordance with Treasury regulations.
If you are eligible for a reduced rate of United States withholding tax under a tax treaty, you may obtain a refund of any amounts withheld in excess of that rate by timely filing an appropriate refund claim with the IRS.
If dividends paid to you are "effectively connected" with your conduct of a trade or business within the United States, and, if required by a tax treaty, the dividends are attributable to a permanent establishment that you maintain in the United States, we and other payors generally are not required to
138
withhold tax from the dividends, provided that you have furnished to us or another payor a properly completed IRS Form W-8ECI or an acceptable substitute form upon which you represent, under penalties of perjury, that:
- •
- you are a non-U.S. person; and
- •
- the dividends are effectively connected with your conduct of a trade or business within the United States and are includible in your gross income.
"Effectively connected" dividends are generally subject to United States federal income tax on a net income basis at applicable U.S. individual or corporate rates. If you are a corporate non-U.S. holder, "effectively connected" dividends that you receive may, under certain circumstances, also be subject to a "branch profits tax" at a 30% rate, or such lower rate as may be specified by an applicable income tax treaty.
Sale or Redemption
Subject to the discussion below regarding backup withholding and FATCA, as a non-U.S. holder, you generally will not be subject to United States federal income or withholding tax on gain realized on the sale, exchange (including a redemption that is treated as an exchange) or other disposition of our common stock unless as a nonresident alien individual (i) you hold our shares as a capital asset and are present in the United States for 183 or more days in the taxable year of the sale or disposition and certain other conditions exist, (ii) the gain is "effectively connected" with your conduct of a trade or business in the United States, and the gain is attributable to a permanent establishment that you maintained in the United States, if required by an applicable income tax treaty as a condition for taxation on a net income basis in the United States, or (iii) our common stock constitutes a U.S. real property interest by reason of our becoming a "United States real property holding corporation," or USRPHC, for United States federal income tax purposes at any time within the shorter of the five-year period preceding your disposition of, or your holding period for, our common stock.
We believe that we are not currently and will not become a USRPHC. However, because the determination of whether we are a USRPHC depends on the fair market value of our U.S. real property relative to the fair market value of our other business assets, there can be no assurance that we will not become a USRPHC in the future. Even if we become a USRPHC, however, as long as our common stock is regularly traded on an established securities market, such common stock will be treated as U.S. real property interests only if you actually or constructively hold more than 5% of such regularly traded common stock at any time during the shorter of the five-year period preceding your disposition of, or your holding period for, our common stock. Net gain from the sale of a U.S. real property interest is taxed as "effectively connected" with a trade or business in the United States and thus subject to taxation at U.S. graduated rates on such income. In the event your common stock is subject to treatment as a U.S. real property interest, if you are a non-U.S. holder, you will be required to pay a flat 15% tax through withholding on the amount realized from the sale, which may be reduced by applicable beneficial treaty provisions.
If you are a holder of common stock that is not treated as a U.S. real property interest and are an individual non-U.S. holder described in (i) above, you will be required to pay a flat 30% tax on the gain derived from the sale, which tax may be offset by U.S.-source capital losses for the taxable year. If you are a non-U.S. holder described in (ii) above, you will be required to pay tax on the net gain derived from the sale under regular graduated United States federal income tax rates. If you are a corporate non-U.S. holder, "effectively connected" gains that you recognize may also, under certain circumstances, be subject to a "branch profits tax" at a 30% rate or at a lower rate as may be specified by an applicable income tax treaty.
139
Information Reporting and Backup Withholding
If you are a non-U.S. holder, you are generally exempt from backup withholding and information reporting requirements (other than certain information reporting required for distribution payments on IRS Form 1042-S) with respect to:
- •
- dividend payments, and
- •
- the payment of the proceeds from the sale of common shares effected at a United States office of a broker,
as long as the income is otherwise exempt from United States federal income tax, and:
- •
- the payor or broker does not have actual knowledge or reason to know that you are a United States person and you have furnished to the payor or
broker:
- •
- a valid IRS Form W-8BEN, Form W-8BEN-E or applicable variation of Form W-8 (or an acceptable substitute form)
upon which you certify, under penalties of perjury, that you are (or, in the case of a non-U.S. holder that is an estate or trust, such forms certifying that each beneficiary of the estate or trust
is) a non-United States person, or
- •
- other documentation upon which it may rely to treat the payments as made to a non-United States person in accordance with U.S.
Treasury regulations, or
- •
- an exemption to withholding is established (such as your designated status as a corporation).
Payment of the proceeds from the sale of common shares effected at a foreign office of a broker generally will not be subject to information reporting or backup withholding. However, a sale of shares effected at a foreign office of a broker will be subject to information reporting and backup withholding if:
- •
- the proceeds are transferred to an account maintained by you in the United States,
- •
- the payments of proceeds or the confirmation of sale is mailed to you at a United States address, or,
- •
- the sale has some other specified connection with the United States as provided in the U.S. Treasury regulations,
unless the broker does not have actual knowledge or reason to know that you are a United States person and the documentation requirements described above are met or you otherwise establish an exemption.
In addition, a sale of common stock will be subject to information reporting (but not backup withholding) if it is effected at a foreign office of a broker that is:
- •
- a United States person,
- •
- a controlled foreign corporation for United States tax purposes, a foreign person 50% or more of whose gross income from all sources is effectively connected with the conduct of a United States trade or business for a specified three-year period, or a foreign partnership with certain U.S. connections engaged in the conduct of a trade or business in the United States,
unless the broker does not have actual knowledge or reason to know that you are a United States person and the documentation requirements described above are met or you otherwise establish an exemption. Backup withholding will apply if the sale is subject to information reporting and the broker has actual knowledge that you are a United States person.
Payment of dividends (including any redemption treated as a dividend for U.S. income tax purposes) or the payment of proceeds of a sale of our common stock within the United States or
140
conducted through certain United States-related financial intermediaries and any tax withheld on those payments are subject to information reporting requirements. These information reporting requirements apply regardless of whether withholding was reduced or eliminated by an applicable income tax treaty. Under the provisions of an applicable income tax treaty or agreement, copies of the information returns reporting such dividends and withholding may also be made available to the tax authorities in the resident country of the non-U.S. holder. Any amount withheld under the backup withholding rules from a payment to a non-U.S. holder is allowable as a credit against the non-U.S. holder's United States federal income tax liability for the year in which the withholding occurred, which may entitle the non-U.S. holder to a refund, provided that the non-U.S. holder files a claim for refund on a timely basis with the IRS. Moreover, certain penalties may be imposed by the IRS on a non-U.S. holder who is required to furnish information but does not do so in the proper manner. Non-U.S. holders should consult their tax advisors regarding the application of backup withholding in their particular circumstances and the availability of and procedure for obtaining an exemption from backup withholding under current Treasury regulations.
Withholding on Payments to Foreign Financial Entities and Other Foreign Entities
Withholding taxes may be imposed under Sections 1471 through 1474 of the Code (commonly referred to as the Foreign Account Tax Compliance Act, or FATCA) on certain types of payments made to non-U.S. financial institutions and certain other non-U.S. entities. Specifically, a 30% withholding tax may be imposed on dividends paid on, or gross proceeds from the sale or other disposition of, our common stock paid to a "foreign financial institution" or a "non-financial foreign entity" (each as defined in the Code), unless (1) the foreign financial institution is subject to certain due diligence and reporting obligations, (2) the non-financial foreign entity either certifies it does not have any "substantial United States owners" (as defined in the Code) or furnishes identifying information regarding each substantial United States owner, or (3) the foreign financial institution or non-financial foreign entity otherwise complies with, or qualifies for an exemption from, these rules. If the payee is a foreign financial institution and is subject to the due diligence and reporting requirements in (1) above, it must either (i) enter into an agreement with the United States Department of the Treasury (a "FATCA Agreement"), or (ii) be subject to and comply with applicable foreign law enacted in connection with an intergovernmental agreement between the United States and a foreign jurisdiction (an "IGA"), in either case, requiring, among other things, that it identify accounts held by certain "specified United States persons" or United States owned foreign entities, and annually report certain information about such accounts. If our common stock is held by a foreign financial institution that enters into (or is otherwise subject to) a FATCA Agreement, such foreign financial institution (or, in certain cases, a person paying amounts to such foreign financial institution) generally will be required, subject to certain exceptions, to withhold tax on payments of dividends and proceeds described above made to (1) a person (including an individual) that fails to comply with certain information requests, (2) a foreign financial institution that has not entered into (and is not otherwise subject to), and is not in compliance with a FATCA Agreement and is not in compliance with FATCA pursuant to applicable foreign law enacted in connection with an IGA, or (3) a person who is not otherwise exempt from FATCA requirements.
Withholding under FATCA generally applies to (i) current payments of dividends on our common stock and (ii) payments of gross proceeds from the sale or other disposition of such stock on or after January 1, 2019.
If withholding is required under FATCA on a payment related to our common stock, investors that otherwise would not be subject to withholding (or that otherwise would be entitled to a reduced rate of withholding) generally will be required to seek a refund or credit from the IRS on a timely basis in order to obtain the benefit of such exemption or reduction.
Each non-U.S. holder should consult its own tax advisor regarding the potential application of withholding under FATCA to its investment in our common stock.
141
We are offering the shares of our common stock described in this prospectus in an underwritten offering in which we and Sandler O'Neill & Partners, L.P. and Stephens Inc., as representatives of the underwriters named below, will enter into an underwriting agreement with respect to the shares of our common stock being offered. Subject to the terms and conditions contained in the underwriting agreement, the underwriters named below have agreed, severally and not jointly, to purchase the respective number of shares of our common stock set forth opposite their respective names below:
Underwriter
|
Number of Shares |
|||
|---|---|---|---|---|
Sandler O'Neill & Partners, L.P. |
||||
Stephens Inc. |
||||
Raymond James & Associates, Inc. |
||||
SunTrust Robinson Humphrey, Inc. |
||||
| | | | | |
Total |
5,555,555 | |||
The underwriting agreement provides that the underwriters' obligation to purchase shares of our common stock depends on the satisfaction of the conditions contained in the underwriting agreement, including, among others:
- •
- the representations and warranties made by us are true and agreements have been performed;
- •
- there is no material adverse change in their determination in the financial markets or in our business; and
- •
- we deliver customary closing documents.
Subject to these conditions, the underwriters are committed to purchase and pay for all of the shares of our common stock offered by this prospectus, if any such shares are purchased. However, the underwriters are not obligated to take or pay for the shares of our common stock covered by the underwriters' option to purchase additional shares described below, unless and until that option is exercised. The underwriting agreement also provides that if an underwriter defaults, the purchase commitments of non-defaulting underwriters may be increased or this offering may be terminated.
Commission and Discounts
Shares of our common stock sold by the underwriters to the public will be offered at the initial public offering price set forth on the cover of this prospectus. Any shares of our common stock sold by the underwriters to securities dealers may be sold at a discount of up to $ per share from the initial public offering price. Any of these securities dealers may resell any shares of our common stock purchased from the underwriters to other brokers or dealers at a discount of up to $ per share from the initial public offering price. If all of the shares of our common stock are not sold at the initial public offering price, the representative may change the offering price and the other selling terms. Sales of shares of our common stock made outside of the United States may be made by affiliates of the underwriters. The underwriters reserve the right to reject an order for the purchase of shares, in whole or in part.
142
The following table shows the initial public offering price, underwriting discount and proceeds before expenses to us. The information assumes either no exercise or full exercise by the underwriters of their option to purchase additional shares:
| |
Per Share | No Exercise | Full Exercise | |||||||
|---|---|---|---|---|---|---|---|---|---|---|
Public offering price |
$ | $ | $ | |||||||
Underwriting discount |
||||||||||
Proceeds to us, before expenses |
||||||||||
In addition to the underwriting discounts, we estimate the expenses of this offering to be approximately $1.43 million and are payable by us.
Option to Purchase Additional Shares
We have granted the underwriters an option to purchase up to 833,333 additional shares of our common stock, on the same terms set forth above. The underwriters may exercise this option, in whole or from time to time in part, made in connection with this offering. The underwriters have 30 days from the date of this prospectus to exercise this option. If the underwriters exercise this option, each underwriter will be obligated, subject to the conditions in the underwriting agreement, to purchase a number of additional shares of our common stock proportionate to such underwriter's initial amount relative to the total amount reflected next to their name in the table above. We will be obligated to sell these shares of common stock to the underwriters to the extent the option to purchase additional shares is exercised.
Indemnification and Contribution
We have agreed to indemnify the underwriters, and persons who control the underwriters, against certain liabilities, including liabilities under the Securities Act, and to contribute to payments that the underwriters may be required to make in respect of these liabilities.
Lock-up Agreements
Our directors, our executive officers, and certain other current shareholders have entered, and participants in the directed share program will enter, into lock-up agreements with the underwriters. Under these agreements, we and each of these persons will not, without the prior written approval of the representative, subject to limited exceptions,
- •
- offer, pledge, sell, contract to sell, sell any option or contract to purchase, purchase any option or contract to sell, grant any option,
right or warrant for the sale of, or otherwise dispose of or transfer any of our common stock or any securities convertible into or exchangeable or exercisable for our common stock, whether now owned
or hereafter acquired or with respect to which such person has or hereafter acquires the power of disposition, or file any registration statement under the Securities Act, with respect to any of the
foregoing;
- •
- enter into any swap or any other agreement or any transaction that transfers, in whole or in part, directly or indirectly, the economic
consequence of ownership of our common stock whether any such swap or transaction is to be settled by delivery of our common stock or other securities, in cash or otherwise; or
- •
- publicly disclose the intention to make any such offer, pledge, sale or disposition, or to enter into any such swap, hedge, transaction or other arrangement.
These restrictions will be in effect for a period of 180 days after the date of the underwriting agreement. At any time and without public notice, the representatives may, in their sole discretion, waive or release all or some of the securities from these lock-up agreements. In addition, the
143
restrictions described above will not apply to certain transfers of the locked-up shares, so long as the transferee agrees, among other things, to be bound by the terms of the lock-up agreement. Such transfers permitted under the lock-up agreement include, but are not limited to transfers of shares of our common stock:
- •
- as a bona fide gift or gifts including through a distribution by a trust, family limited partnership, corporation or other entity;
- •
- to any corporation, trust or family limited partnership for the benefit of the transferor or his or her immediate family; and
- •
- to us, to satisfy any tax withholding obligations of the transferor, or to satisfy the exercise price of stock options by the transferor, upon the exercise or vesting of equity awards outstanding or hereinafter granted under any exercise by the transferor of stock options or vesting of outstanding restricted stock awards or other similar equity incentive awards that have been granted by us prior to, and are outstanding as of, the date hereof (or are granted after the date hereof pursuant to a plan or arrangement that is in place prior to the date hereof).
These restrictions will apply to common stock owned now or acquired later by the person executing the agreement or for which the person executing the agreement later acquires the power of disposition.
Pricing of the Offering
This is the initial public offering of our common stock and no public market currently exists for our shares. The initial public offering price will be determined by negotiations among us and the representative of the underwriters. In addition to prevailing market conditions, among the factors to be considered in determining the initial public offering price of our common stock will be our historical performance, estimates of our business potential and our earnings prospects, an assessment of our management and the consideration of the above factors in relation to market valuation of companies in related businesses. The estimated initial public offering price range set forth on the cover page of this preliminary prospectus is subject to change as a result of market conditions and other factors. An active trading market for the shares of our common stock may not develop. It is also possible that the shares will not trade in the public market at or above the initial public offering price following the completion of this offering.
Exchange Listing
We have applied to list our common stock on the Nasdaq Capital Market under the symbol "MBIN."
Directed Share Program
At our request, the underwriters have reserved for sale, at the initial public offering price, up to 277,777 shares of the common stock being offered by this prospectus, to our directors, officers, employees and other individuals that have a business relationship with us, including current shareholders and customers, and their family members who have expressed an interest in purchasing our common stock in this offering. The number of shares available for sale to the general public in the offering will be reduced to the extent these persons purchase the reserved shares. Any reserved shares not so purchased will be offered by the underwriters to the general public on the same terms as the other shares. Any shares sold in the directed share program will be subject to the 180-day lock-up agreements described above.
144
Price Stabilization, Short Positions and Penalty Bids
To facilitate this offering and in accordance with Regulation M under the Exchange Act, or Regulation M, the underwriters may engage in transactions that stabilize, maintain, or otherwise affect the price of our common stock, including:
- •
- stabilizing transactions;
- •
- short sales; and
- •
- purchases to cover positions created by short sales.
Stabilizing transactions consist of bids or purchases made for the purpose of preventing or retarding a decline in the market price of our common stock while this offering is in progress. These transactions may also include making short sales of our common stock, which involve the sale by the underwriters of a greater number of shares of common stock than they are required to purchase in this offering. Short sales may be "covered short sales," which are short positions in an amount not greater than the underwriters' option to purchase additional shares referred to above, or may be "naked short sales," which are short positions in excess of that amount.
The underwriters may close out any covered short position either by exercising their option to purchase additional shares, in whole or in part, or by purchasing shares in the open market. In making this determination, the underwriters will consider, among other things, the price of shares available for purchase in the open market compared to the price at which they may purchase shares through their option to purchase additional shares. The underwriters must close out any naked short position by purchasing shares in the open market. A naked short position is more likely to be created if the underwriters are concerned that there may be downward pressure on the price of our common stock in the open market that could adversely affect investors who purchased in this offering.
As an additional means of facilitating our initial public offering, the underwriters may bid for, and purchase, shares of our common stock in the open market. The underwriting syndicate also may reclaim selling concessions allowed to an underwriter or a dealer for distributing shares of our common stock in this offering, if the syndicate repurchases previously distributed shares of our common stock to cover syndicate short positions or to stabilize the price of our common stock.
As a result of these activities, the price of our common stock may be higher than the price that otherwise might exist in the open market. If these activities are commenced, they may be discontinued by the underwriters at any time without notice. The underwriters may carry out these transactions on the Nasdaq Capital Market, in the over-the-counter market or otherwise.
Passive Market Making
In connection with this offering, the underwriters may engage in passive market making transactions in our common stock on the Nasdaq Capital Market in accordance with Rule 103 of Regulation M during a period before the commencement of offers or sales of our common stock and extending through the completion of the distribution of this offering. A passive market maker must generally display its bid at a price not in excess of the highest independent bid of that security. However, if all independent bids are lowered below the passive market maker's bid, the passive market maker may continue to bid and effect purchases at a price exceeding the then highest independent bid until specified purchase limits are exceeded, at which time such bid must be lowered to an amount no higher than the then highest independent bid. Passive market making may cause the price of our common stock to be higher than the price that otherwise would exist in the open market in the absence of those transactions. The underwriters and selling shareholders engaged in passive market making are not required to engage in passive market making and may end passive market making activities at any time.
145
Electronic Distribution
This prospectus may be made available in electronic format on websites or through other online services maintained by one or more of the underwriters, or their affiliates. Other than this prospectus in electronic format, information on such websites and any information contained in any other website maintained by the underwriters or any of their affiliates is not part of this prospectus or registration statement of which the prospectus forms a part, has not been approved or endorsed by us or the underwriters, in their capacities as underwriters and should not be relied on by investors.
Affiliations
The underwriters and their respective affiliates are full service financial institutions engaged in various activities, which may include securities trading, commercial and investment banking, financial advisory, investment management, investment advisory, investment research, principal investment, hedging, financing, loan referrals, valuation and brokerage activities. From time to time, the underwriters and/or their respective affiliates have directly and indirectly engaged, and may in the future engage, in various financial advisory, investment banking loan referrals and commercial banking services with us and our affiliates, for which they received or paid, or may receive or pay, customary compensation, fees and expense reimbursement. In the ordinary course of their various business activities, the underwriters and their respective affiliates may make or hold a broad array of investments and actively trade debt and equity securities (or related derivative securities) and financial instruments (including bank loans) for their own account and for the accounts of their customers, and those investment and securities activities may involve securities and/or instruments of ours. The underwriters and their respective affiliates may also make investment recommendations and/or publish or express independent research views in respect of those securities or instruments and may at any time hold, or recommend to clients that they acquire, long and/or short positions in those securities and instruments.
146
The validity of the shares of common stock being offered by this prospectus will be passed upon for us by Krieg DeVault LLP, Indianapolis, Indiana. Covington & Burling, LLP, Washington D.C., is acting as counsel for the underwriters in connection with this offering.
The consolidated financial statements of Merchants Bancorp and subsidiaries as of December 31, 2016 and 2015 and for each of the years in the two-year period ended December 31, 2016 have been included herein in reliance upon the report of BKD LLP, independent registered public accounting firm, appearing elsewhere herein, and upon the authority of said firm as experts in accounting and auditing.
WHERE YOU CAN FIND MORE INFORMATION
We have filed with the SEC a registration statement on Form S-1 under the Securities Act with respect to our common stock offered hereby. This prospectus, which constitutes part of the registration statement, does not contain all of the information set forth in the registration statement or the exhibits or schedules filed therewith. Some items are omitted in accordance with the rules and regulations of the SEC. For further information about us and our common stock that we propose to sell in this offering, we refer you to the registration statement and the exhibits and schedules filed as a part of the registration statement. Statements or summaries in this prospectus as to the contents of any contract or other document referred to in this prospectus are not necessarily complete and, where that contract or document is filed as an exhibit to the registration statement, each statement or summary is qualified in all respects by reference to the exhibit to which the reference relates. You may read and copy the registration statement, including the exhibits and schedules to the registration statement, at the SEC's Public Reference Room at 100 F Street, N.E., Room 1580, Washington, D.C. 20549. Please call the SEC at 1-800-SEC-0330 for further information on the operation of the Public Reference Room. Our filings with the SEC, including the registration statement, are also available to you for free on the SEC's internet website at www.sec.gov.
Following the offering, we will become subject to the informational and reporting requirements of the Exchange Act and, in accordance with those requirements, will file reports and proxy and information statements and other information with the SEC. You will be able to inspect and copy these reports and proxy and information statements and other information at the addresses set forth above. We intend to furnish to our shareholders our annual reports containing our audited consolidated financial statements certified by an independent public accounting firm.
We also maintain an internet site at www.merchantsbankofindiana.com. Information on, or accessible through, our website is not part of this prospectus.
147
Index to Consolidated Financial Statements of
Merchants Bancorp
Contents
***
All financial statement schedules have been omitted as the required information either is not applicable or is included in the financial statements or related notes.
F-1
Report of Independent Registered Public Accounting Firm
Board
of Directors and Shareholders
Merchants Bancorp
Carmel, Indiana
We have audited the accompanying consolidated balance sheets of Merchants Bancorp (the "Company") as of December 31, 2016 and 2015, and the related consolidated statements of income, comprehensive income, shareholders' equity and cash flows for each of the years then ended. The Company's management is responsible for these financial statements. Our responsibility is to express an opinion on these financial statements based on our audits.
We conducted our audits in accordance with the standards of the Public Company Accounting Oversight Board (United States). Those standards require that we plan and perform the audits to obtain reasonable assurance about whether the financial statements are free of material misstatement. The Company is not required to have, nor were we engaged to perform, an audit of its internal control over financial reporting. Our audits included consideration of internal control over financial reporting as a basis for designing auditing procedures that are appropriate in the circumstances, but not for the purpose of expressing an opinion on the effectiveness of the Company's internal control over financial reporting. Accordingly, we express no such opinion. Our audits also included examining, on a test basis, evidence supporting the amounts and disclosures in the financial statements, assessing the accounting principles used and significant estimates made by management and evaluating the overall financial statement presentation. We believe that our audits provide a reasonable basis for our opinion.
In our opinion, the consolidated financial statements referred to above present fairly, in all material respects, the financial position of the Company as of December 31, 2016, and 2015, and the results of its operations and its cash flows for each of the years then ended, in conformity with accounting principles generally accepted in the United States of America.
/s/
BKD, LLP
BKD, LLP
Indianapolis,
Indiana
July 25, 2017
F-2
Merchants Bancorp
Consolidated Balance Sheets
June 30, 2017 (unaudited) and December 31, 2016 and 2015
(In thousands, except
share data)
| |
|
December 31, | ||||||||
|---|---|---|---|---|---|---|---|---|---|---|
| |
June 30, 2017 |
|||||||||
| |
2016 | 2015 | ||||||||
Assets |
||||||||||
Cash and due from banks |
$ | 17,373 | $ | 10,036 | $ | 11,673 | ||||
Interest-earning demand accounts |
399,181 | 435,665 | 435,128 | |||||||
| | | | | | | | | | | |
Cash and cash equivalents |
416,554 | 445,701 | 446,801 | |||||||
Securities purchased under agreements to resell |
5,335 |
5,392 |
5,514 |
|||||||
Trading securities |
145,056 | 137,675 | 107,869 | |||||||
Available for sale securities |
378,295 | 325,874 | 254,456 | |||||||
Federal Home Loan Bank (FHLB) stock |
7,539 | 7,539 | 7,539 | |||||||
Loans held for sale |
983,420 | 764,503 | 620,583 | |||||||
Loans receivable, net of allowance for losses of $6,865, $6,250 and $5,422, respectively |
1,064,001 | 935,546 | 756,790 | |||||||
Premises and equipment, net |
4,795 | 4,851 | 3,972 | |||||||
Mortgage servicing rights |
57,557 | 53,670 | 55,553 | |||||||
Interest receivable |
6,059 | 5,368 | 4,600 | |||||||
Goodwill |
523 | 523 | 523 | |||||||
Other assets and receivables |
22,366 | 31,870 | 5,242 | |||||||
| | | | | | | | | | | |
Total assets |
$ | 3,091,500 | $ | 2,718,512 | $ | 2,269,442 | ||||
| | | | | | | | | | | |
| | | | | | | | | | | |
| | | | | | | | | | | |
Liabilities and Shareholders' Equity |
||||||||||
Liabilities |
||||||||||
Deposits |
||||||||||
Noninterest bearing |
$ | 633,083 | $ | 566,631 | $ | 664,540 | ||||
Interest bearing |
2,138,418 | 1,861,990 | 1,374,980 | |||||||
| | | | | | | | | | | |
Total deposits |
2,771,501 | 2,428,621 | 2,039,520 | |||||||
Borrowings |
56,633 | 57,006 | 57,490 | |||||||
Interest payable |
2,097 | 1,791 | 1,843 | |||||||
Deferred and current tax liabilities, net |
18,615 | 17,363 | 18,195 | |||||||
Other liabilities |
16,141 | 7,443 | 4,194 | |||||||
| | | | | | | | | | | |
Total liabilities |
2,864,987 | 2,512,224 | 2,121,242 | |||||||
| | | | | | | | | | | |
Commitments and Contingencies |
||||||||||
Shareholders' Equity |
||||||||||
Common stock, without par value |
||||||||||
Authorized—50,000,000 shares |
||||||||||
Issued and outstanding—21,114,400 shares at June 30, 2017 and 21,111,200 shares at December 31, 2016 and 2015 |
20,103 | 20,061 | 20,061 | |||||||
Preferred stock—$1,000 per share, without par value |
||||||||||
Authorized—5,000,000 shares |
||||||||||
Issued and outstanding—41,625 shares at June 30, 2017 and December 31, 2016 and 10,000 shares at December 31, 2015 |
41,581 | 41,581 | 10,000 | |||||||
Retained earnings |
165,386 | 145,274 | 118,371 | |||||||
Accumulated other comprehensive loss |
(557 | ) | (628 | ) | (232 | ) | ||||
| | | | | | | | | | | |
Total shareholders' equity |
226,513 | 206,288 | 148,200 | |||||||
| | | | | | | | | | | |
Total liabilities and shareholders' equity |
$ | 3,091,500 | $ | 2,718,512 | $ | 2,269,442 | ||||
| | | | | | | | | | | |
| | | | | | | | | | | |
| | | | | | | | | | | |
See Notes to Consolidated Financial Statements
F-3
Merchants Bancorp
Consolidated Statements of Income
Six Months Ended June 30, 2017 and 2016 (unaudited) and
Years Ended December 31, 2016 and 2015
(In thousands, except share and per share data)
| |
Six Months Ended June 30, |
Years Ended December 31, |
|||||||||||
|---|---|---|---|---|---|---|---|---|---|---|---|---|---|
| |
2017 | 2016 | 2016 | 2015 | |||||||||
Interest Income |
|||||||||||||
Loans |
$ | 34,805 | $ | 28,066 | $ | 62,563 | $ | 49,006 | |||||
Investment securities: |
|||||||||||||
Trading |
2,824 | 1,499 | 4,516 | 3,579 | |||||||||
Available for sale |
1,916 | 1,568 | 3,249 | 2,361 | |||||||||
Federal Home Loan Bank stock |
160 | 160 | 320 | 308 | |||||||||
Other |
1,766 | 1,128 | 2,291 | 1,091 | |||||||||
| | | | | | | | | | | | | | |
Total interest income |
41,471 | 32,421 | 72,939 | 56,345 | |||||||||
| | | | | | | | | | | | | | |
Interest Expense |
|||||||||||||
Deposits |
8,511 | 4,960 | 11,663 | 7,346 | |||||||||
Borrowed funds |
3,705 | 3,642 | 7,305 | 6,944 | |||||||||
| | | | | | | | | | | | | | |
Total interest expense |
12,216 | 8,602 | 18,968 | 14,290 | |||||||||
| | | | | | | | | | | | | | |
Net interest income |
29,255 | 23,819 | 53,971 | 42,055 | |||||||||
Provision for loan losses |
480 | 480 | 960 | 960 | |||||||||
| | | | | | | | | | | | | | |
Net Interest Income After Provision for Loan Losses |
28,775 | 23,339 | 53,011 | 41,095 | |||||||||
| | | | | | | | | | | | | | |
Noninterest Income |
|||||||||||||
Gain on sale of loans |
20,609 | 6,610 | 24,755 | 24,803 | |||||||||
Loan servicing fees |
2,384 | 2,091 | 280 | 836 | |||||||||
Mortgage warehouse fees |
1,258 | 1,178 | 3,015 | 1,193 | |||||||||
Gains on sale of investments available for sale (includes $0, $0, $24 and $0, respectively, related to accumulated other comprehensive earnings reclasifications) |
— | — | 24 | — | |||||||||
Other income |
466 | 72 | 430 | 176 | |||||||||
| | | | | | | | | | | | | | |
Total noninterest income |
24,717 | 9,951 | 28,504 | 27,008 | |||||||||
| | | | | | | | | | | | | | |
Noninterest Expense |
|||||||||||||
Salaries and employee benefits |
9,067 | 6,271 | 14,313 | 11,962 | |||||||||
Loan expenses |
1,953 | 1,906 | 4,251 | 2,735 | |||||||||
Occupancy and equipment |
754 | 672 | 1,344 | 1,248 | |||||||||
Professional fees |
530 | 739 | 1,298 | 675 | |||||||||
Deposit insurance expense |
474 | 590 | 1,149 | 1,077 | |||||||||
Technology expense |
506 | 421 | 985 | 702 | |||||||||
Other expense |
1,618 | 1,564 | 3,380 | 2,523 | |||||||||
| | | | | | | | | | | | | | |
Total noninterest expense |
14,902 | 12,163 | 26,720 | 20,922 | |||||||||
| | | | | | | | | | | | | | |
Income Before Income Taxes |
38,590 | 21,127 | 54,795 | 47,181 | |||||||||
Provision for Income Taxes (includes $0, $0, $10 and $0, respectively, related to income tax expense for reclassification items) |
14,702 | 8,353 | 21,668 | 18,798 | |||||||||
| | | | | | | | | | | | | | |
Net Income |
$ | 23,888 | $ | 12,774 | $ | 33,127 | $ | 28,383 | |||||
| | | | | | | | | | | | | | |
| | | | | | | | | | | | | | |
| | | | | | | | | | | | | | |
Basic earnings per share |
$ | 1.05 | $ | 0.59 | $ | 1.47 | $ | 1.35 | |||||
| | | | | | | | | | | | | | |
| | | | | | | | | | | | | | |
| | | | | | | | | | | | | | |
Diluted earnings per share |
$ | 1.05 | $ | 0.59 | $ | 1.47 | $ | 1.35 | |||||
| | | | | | | | | | | | | | |
| | | | | | | | | | | | | | |
| | | | | | | | | | | | | | |
Weighted-average shares outstanding |
|||||||||||||
Basic |
21,114,400 | 21,111,200 | 21,111,208 | 21,075,475 | |||||||||
| | | | | | | | | | | | | | |
| | | | | | | | | | | | | | |
| | | | | | | | | | | | | | |
Diluted |
21,119,411 | 21,112,283 | 21,113,435 | 21,075,475 | |||||||||
| | | | | | | | | | | | | | |
| | | | | | | | | | | | | | |
| | | | | | | | | | | | | | |
Dividends per share |
$ | 0.10 | $ | 0.10 | $ | 0.20 | $ | 0.20 | |||||
| | | | | | | | | | | | | | |
| | | | | | | | | | | | | | |
| | | | | | | | | | | | | | |
See Notes to Consolidated Financial Statements
F-4
Merchants Bancorp
Consolidated Statements of Comprehensive Income
Six Months Ended June 30, 2017 and 2016 (unaudited) and
Years Ended December 31, 2016 and 2015
(In thousands)
| |
Six Months Ended June 30, |
Years Ended December 31, |
|||||||||||
|---|---|---|---|---|---|---|---|---|---|---|---|---|---|
| |
2017 | 2016 | 2016 | 2015 | |||||||||
Net Income |
$ | 23,888 | $ | 12,774 | $ | 33,127 | $ | 28,383 | |||||
Other Comprehensive Income (Loss): |
|||||||||||||
Net change in unrealized losses on investment securities available for sale, net of (taxes) benefits of $(50), $(196), $262 and $25, respectively |
71 |
293 |
(382 |
) |
(39 |
) |
|||||||
Less: Reclassification adjustment for gains included in net income, net of tax expense of $10 |
— |
— |
14 |
— |
|||||||||
| | | | | | | | | | | | | | |
Other comprehensive income (loss) for the period |
71 | 293 | (396 | ) | (39 | ) | |||||||
| | | | | | | | | | | | | | |
Comprehensive Income |
$ | 23,959 | $ | 13,067 | $ | 32,731 | $ | 28,344 | |||||
| | | | | | | | | | | | | | |
| | | | | | | | | | | | | | |
| | | | | | | | | | | | | | |
See Notes to Consolidated Financial Statements
F-5
Merchants Bancorp
Consolidated Statements of Shareholders' Equity
Six Months Ended June 30, 2017 (unaudited) and
Years Ended December 31, 2016 and 2015
(In thousands, except share and per share data)
| |
Common Stock | Preferred Stock | |
Accumulated Other Comprehensive Income (Loss) |
|
|||||||||||||||||
|---|---|---|---|---|---|---|---|---|---|---|---|---|---|---|---|---|---|---|---|---|---|---|
| |
Retained Earnings |
|
||||||||||||||||||||
| |
Shares | Amount | Shares | Amount | Total | |||||||||||||||||
Balance, January 1, 2015 |
20,703,700 | $ | 16,120 | — | $ | — | $ | 94,210 | $ | (193 | ) | $ | 110,137 | |||||||||
Net income |
— | — | — | — | 28,383 | — | 28,383 | |||||||||||||||
Issuance of preferred stock |
— | — | 10,000 | 10,000 | — | — | 10,000 | |||||||||||||||
Issuance of common stock, net of offering expenses of $134 |
407,500 | 3,941 | — | — | — | — | 3,941 | |||||||||||||||
Dividends on common stock, $0.20 per share |
— | — | — | — | (4,222 | ) | — | (4,222 | ) | |||||||||||||
Other comprehensive loss |
— | — | — | — | — | (39 | ) | (39 | ) | |||||||||||||
| | | | | | | | | | | | | | | | | | | | | | | |
Balance, December 31, 2015 |
21,111,200 | 20,061 | 10,000 | 10,000 | 118,371 | (232 | ) | 148,200 | ||||||||||||||
Net income |
— | — | — | — | 33,127 | — | 33,127 | |||||||||||||||
Issuance of preferred stock, net of offering expenses of $44 |
— | — | 31,625 | 31,581 | — | — | 31,581 | |||||||||||||||
Dividends on preferred stock |
— | — | — | — | (2,002 | ) | — | (2,002 | ) | |||||||||||||
Dividends on common stock, $0.20 per share |
— | — | — | — | (4,222 | ) | — | (4,222 | ) | |||||||||||||
Other comprehensive loss |
— | — | — | — | — | (396 | ) | (396 | ) | |||||||||||||
| | | | | | | | | | | | | | | | | | | | | | | |
Balance, December 31, 2016 |
21,111,200 | 20,061 | 41,625 | 41,581 | 145,274 | (628 | ) | 206,288 | ||||||||||||||
Net income |
— | — | — | — | 23,888 | — | 23,888 | |||||||||||||||
Shares issued for stock compensation plan |
3,200 | 42 | — | — | — | — | 42 | |||||||||||||||
Dividends on preferred stock |
— | — | — | — | (1,665 | ) | — | (1,665 | ) | |||||||||||||
Dividends on common stock, $0.10 per share |
— | — | — | — | (2,111 | ) | — | (2,111 | ) | |||||||||||||
Other comprehensive income |
— | — | — | — | — | 71 | 71 | |||||||||||||||
| | | | | | | | | | | | | | | | | | | | | | | |
Balance, June 30, 2017 |
21,114,400 | $ | 20,103 | 41,625 | $ | 41,581 | $ | 165,386 | $ | (557 | ) | $ | 226,513 | |||||||||
| | | | | | | | | | | | | | | | | | | | | | | |
| | | | | | | | | | | | | | | | | | | | | | | |
| | | | | | | | | | | | | | | | | | | | | | | |
See Notes to Consolidated Financial Statements
F-6
Merchants Bancorp
Consolidated Statements of Cash Flows
Six Months Ended June 30, 2017 and 2016 (unaudited) and
Years Ended December 31,
2016 and 2015
(In thousands)
| |
Six Months Ended June 30, |
Years Ended December 31, |
|||||||||||
|---|---|---|---|---|---|---|---|---|---|---|---|---|---|
| |
2017 | 2016 | 2016 | 2015 | |||||||||
Operating activities: |
|||||||||||||
Net income |
$ | 23,888 | $ | 12,774 | $ | 33,127 | $ | 28,383 | |||||
Items not requiring cash: |
|||||||||||||
Depreciation |
131 | 138 | 278 | 301 | |||||||||
Provision for loan losses |
480 | 480 | 960 | 960 | |||||||||
Deferred tax, net |
1,837 | (528 | ) | (1,436 | ) | 482 | |||||||
Gain on sale of securities |
— | — | (24 | ) | — | ||||||||
Gain on sale of loans |
(20,609 | ) | (6,610 | ) | (24,755 | ) | (24,803 | ) | |||||
Proceeds from sales of loans |
9,343,295 | 8,266,467 | 20,022,010 | 15,773,893 | |||||||||
Loans originated and purchased for sale |
(9,546,607 | ) | (8,458,649 | ) | (20,145,855 | ) | (15,639,872 | ) | |||||
Change in mortgage servicing rights for paydowns and fair value adjustments |
2,082 | 1,420 | 7,628 | 5,361 | |||||||||
Net change in: |
|||||||||||||
Trading securities |
(7,381 | ) | (14,585 | ) | (29,806 | ) | (24,912 | ) | |||||
Interest receivable and other assets |
10,890 | (3,895 | ) | (16,170 | ) | (1,360 | ) | ||||||
Interest payable and and other liabilities |
8,371 | 1,149 | 4,073 | (519 | ) | ||||||||
Other |
50 | 26 | 199 | 414 | |||||||||
| | | | | | | | | | | | | | |
Net cash provided by (used in) operating activities |
(183,573 | ) | (201,813 | ) | (149,771 | ) | 118,328 | ||||||
| | | | | | | | | | | | | | |
Investing activities: |
|||||||||||||
Net change in securities purchased under agreements to resell |
57 | 65 | 122 | (933 | ) | ||||||||
Purchases of available-for-sale securities |
(94,988 | ) | (184,918 | ) | (290,396 | ) | (361,139 | ) | |||||
Proceeds from sales of available-for-sale securities |
— | — | 7,371 | — | |||||||||
Proceeds from calls, maturities and paydowns of available-for-sale securities |
42,679 | 135,999 | 210,967 | 328,833 | |||||||||
Purchases of loans |
(69,970 | ) | (30,864 | ) | (75,249 | ) | (70,396 | ) | |||||
Net change in loans receivable |
(58,965 | ) | (79,216 | ) | (119,075 | ) | (244,199 | ) | |||||
Proceeds from sale of home equity loans held for investment |
— | — | 14,900 | — | |||||||||
Purchase of Federal Home Loan Bank stock |
— | — | — | (2,250 | ) | ||||||||
Proceeds from sale of Federal Home Loan Bank stock |
— | — | — | 2,208 | |||||||||
Proceeds from sale of assets |
— | — | 40 | — | |||||||||
Purchases of premises and equipment |
(218 | ) | (117 | ) | (1,204 | ) | (322 | ) | |||||
Purchases of mortgage servicing rights |
(1,134 | ) | (319 | ) | (1,357 | ) | (1,135 | ) | |||||
Purchase of limited partnership interests |
(1,829 | ) | — | (11,126 | ) | — | |||||||
Other investing activities |
63 | (429 | ) | (295 | ) | — | |||||||
| | | | | | | | | | | | | | |
Net cash used in investing activities |
(184,305 | ) | (159,799 | ) | (265,302 | ) | (349,333 | ) | |||||
| | | | | | | | | | | | | | |
Financing activities: |
|||||||||||||
Net change in deposits |
342,880 | 208,101 | 389,101 | 428,801 | |||||||||
Proceeds from line of credit borrowing |
— | — | — | 10,000 | |||||||||
Proceeds from Federal Home Loan Bank advances |
239,250 | 100,000 | 220,000 | 288,619 | |||||||||
Repayment of Federal Home Loan Bank advances |
(239,623 | ) | (100,460 | ) | (220,485 | ) | (288,988 | ) | |||||
Proceeds from issuance of common stock |
— | — | — | 3,941 | |||||||||
Proceeds from issuance of preferred stock |
— | 18,525 | 31,581 | 10,000 | |||||||||
Dividends |
(3,776 | ) | (2,518 | ) | (6,224 | ) | (4,222 | ) | |||||
| | | | | | | | | | | | | | |
Net cash provided by financing activities |
338,731 | 223,648 | 413,973 | 448,151 | |||||||||
| | | | | | | | | | | | | | |
Net Change in Cash and Cash Equivalents |
(29,147 | ) | (137,946 | ) | (1,100 | ) | 217,146 | ||||||
Cash and Cash Equivalents, Beginning of Period |
445,701 | 446,801 | 446,801 | 229,655 | |||||||||
| | | | | | | | | | | | | | |
Cash and Cash Equivalents, End of Period |
$ | 416,554 | $ | 308,837 | $ | 445,701 | $ | 446,801 | |||||
| | | | | | | | | | | | | | |
| | | | | | | | | | | | | | |
| | | | | | | | | | | | | | |
Additional Cash Flows Information: |
|||||||||||||
Interest paid |
$ | 11,910 | $ | 8,678 | $ | 17,799 | $ | 14,234 | |||||
Income taxes paid |
13,499 | 8,516 | 22,230 | 19,474 | |||||||||
The accompanying notes are an integral part of these financial statements.
F-7
Merchants Bancorp
Notes to Consolidated Financial Statements
Six Months Ended June 30, 2017 and 2016 (unaudited) and
Years Ended
December 31, 2016 and 2015
Note 1: Nature of Operations and Summary of Significant Accounting Policies
Nature of Operations and Principles of Consolidation
The accompanying consolidated financial statements include the accounts of Merchants Bancorp, a registered bank holding company (the "Company") and its wholly owned subsidiary, Merchants Bank of Indiana (the "Bank") and the Bank's subsidiaries, P/R Mortgage and Investment Corp. ("P/RMIC"), Ash Realty Holdings, LLC ("Ash Realty"), Natty Mac Funding, Inc. ("NMF"), and MBI Midtown West, LLC ("MMW") (collectively referred to as "Company"). All significant intercompany accounts and transactions have been eliminated in consolidation.
The Bank operates under an Indiana state bank charter and provides full banking services. As a state bank, the Bank is subject to the regulation of the Indiana Department of Financial Institutions and the Federal Deposit Insurance Corporation. The Company is further subject to regulations of the Federal Reserve Board governing bank holding companies.
The Bank operates from four locations in Indiana, including Lynn, Spartanburg, Carmel and Indianapolis. The Bank generates commercial, mortgage and consumer loans and receives deposits from customers located primarily in Hamilton, Randolph and surrounding counties in Indiana. The Bank's loans are generally secured by specific items of collateral including real property, consumer assets and business assets. The Bank's Mortgage Warehousing segment funds and participates in single family and multi-family, agency eligible loans across the nation.
P/RMIC was formed on August 3, 1990, in the state of Indiana. P/RMIC is primarily engaged in mortgage banking, specializing in lending for multi-family rental properties and healthcare facilities. It is an FHA approved mortgagee and Ginnie Mae issuer.
Effective August 3, 2012, the Bank established a qualifying subsidiary, Ash Realty, for the purpose of acquiring, holding and liquidating real estate acquired by the Bank as a result of various foreclosures.
NMF was formed on April 15, 2014, in the state of Indiana. NMF provides loan participations and participation warehouse financing to Stonegate Mortgage Corporation ("Stonegate"), its subsidiaries, and customers. Stonegate was acquired by Home Point Financial Corporation ("Home Point") effective May 31, 2017.
MMW was formed in 2016 to hold land and improvements for a proposed new headquarters building.
Use of Estimates
The preparation of financial statements in conformity with accounting principles generally accepted in the United States of America requires management to make estimates and assumptions that affect the reported amounts of assets and liabilities and disclosure of contingent assets and liabilities at the date of the financial statements and the reported amounts of revenues and expenses during the reporting period. Actual results could differ from those estimates.
Material estimates that are particularly susceptible to significant change relate to the determination of the allowance for loan losses, loan servicing rights and fair values of financial instruments.
F-8
Merchants Bancorp
Notes to Consolidated Financial Statements (Continued)
Six Months Ended June 30, 2017 and 2016 (unaudited) and
Years Ended December 31, 2016 and 2015
Note 1: Nature of Operations and Summary of Significant Accounting Policies (Continued)
Interim Financial Statements
The interim financial statements at June 30, 2017, and for the six month periods ended June 30, 2017 and 2016, are unaudited and reflect all normal recurring adjustments that are, in the opinion of management, necessary for a fair presentation of the results of operations for the interim periods presented. The results of operations for the six months ended June 30, 2017, are not necessarily indicative of the results to be achieved for the remainder of the year ending December 31, 2017, or any other period.
Cash and Cash Equivalents
The Company considers all liquid investments with original maturities of three months or less to be cash equivalents. Cash equivalents consist primarily of cash amounts due from depository institutions, interest-bearing deposits in other banks, money market accounts, and federal funds sold.
At June 30, 2017, the Company's cash accounts exceeded federally insured limits by approximately $408.1 million. Included in this amount is approximately $387.5 million with the Federal Reserve Bank and $4.0 million with the Federal Home Loan Bank of Indianapolis.
At December 31, 2016, the Company's cash accounts exceeded federally insured limits by approximately $437.5 million. Included in this amount is approximately $426.1 million with the Federal Reserve Bank and $2.8 million with the Federal Home Loan Bank of Indianapolis.
Securities purchased under agreements to resell
Securities purchased pursuant to a simultaneous agreement (RRA) to resell the same securities at a specified price and date generally have maturity dates of 90 days or less and are carried at cost. Every 90 days the RRAs rollover.
Trading Activities
The Company engages in trading activities. Securities that are held principally for resale in the near term are recorded in the trading assets account at fair value with changes in fair value recorded in earnings. Trading securities include FHA participation certificates. Interest is included in net interest income. The unrealized gains included in trading securities totaled $1.9 million, $1.7 million and $1.7 million at June 30, 2017 and December 31, 2016 and 2015, respectively.
Securities
Certain debt securities that management has the positive intent and ability to hold to maturity are classified as "held to maturity" and recorded at amortized cost. Trading securities are recorded at fair value with changes in fair value included in earnings. Securities not classified as held to maturity or trading, including equity securities with readily determinable fair values, are classified as "available for sale" and recorded at fair value, with unrealized gains and losses excluded from earnings and reported in other comprehensive income. Purchase premiums and discounts are recognized in interest income
F-9
Merchants Bancorp
Notes to Consolidated Financial Statements (Continued)
Six Months Ended June 30, 2017 and 2016 (unaudited) and
Years Ended December 31, 2016 and 2015
Note 1: Nature of Operations and Summary of Significant Accounting Policies (Continued)
using the interest method over the terms of the securities. Gains and losses on the sale of securities are recorded on the trade date and are determined using the specific identification method.
For debt securities with fair value below amortized cost when the Company does not intend to sell a debt security, and it is more likely than not the Company will not have to sell the security before recovery of its cost basis, it recognizes the credit component of an other-than-temporary impairment of a debt security in earnings and the remaining portion in other comprehensive income. For held-to-maturity debt securities, the amount of other-than-temporary impairment recorded in other comprehensive income for the noncredit portion of a previous other-than-temporary impairment is amortized prospectively over the remaining life of the security on the basis of the timing of future estimated cash flows of the security.
Loans Held for Sale under Mortgage Banking Activities
The Company uses participation agreements to fund mortgage loans held for sale from closing or purchase until sale to an investor. Under a participation agreement the Company elects to purchase a participation interest of up to 100% in individual loans. The Company shares proportionately in the interest income and the credit risk until the loan is sold to an investor. The Company holds the collateral until it is sent under a bailee arrangement to the investor. Typical investors are large financial institutions or government agencies.
Interest earned from the time of funding to the time of sale is recognized as interest income as accrued. Fees earned agreements are recognized when collected as noninterest income.
Mortgage loans originated and intended for sale in the secondary market are carried at the lower of cost or fair value in the aggregate. Net unrealized losses, if any, are recognized through a valuation allowance and included in noninterest income. Gains and losses on loan sales are recorded in noninterest income, and generally direct loan origination costs and fees are deferred at origination of the loan and are recognized in noninterest income upon sale of the loan.
The gain on sale of loans in the income statement includes placement and origination fees, capitalized mortgage servicing rights, trading gains and losses and other related income.
Loans
Loans that management has the intent and ability to hold for the foreseeable future or until maturity or payoff are reported at their outstanding principal balances adjusted for unearned income, charge-offs, the allowance for loan losses, any unamortized deferred fees or costs on originated loans and unamortized premiums or discounts on purchased loans.
For loans amortized at cost, interest income is accrued based on the unpaid principal balance.
The accrual of interest on loans is discontinued at the time the loan is 90 days past due unless the credit is well-secured and in process of collection. Past-due status is based on contractual terms of the loan. In all cases, loans are placed on nonaccrual or charged off at an earlier date if collection of principal or interest is considered doubtful.
F-10
Merchants Bancorp
Notes to Consolidated Financial Statements (Continued)
Six Months Ended June 30, 2017 and 2016 (unaudited) and
Years Ended December 31, 2016 and 2015
Note 1: Nature of Operations and Summary of Significant Accounting Policies (Continued)
All interest accrued but not collected for loans that are placed on nonaccrual or charged off is reversed against interest income. The interest on these loans is applied to the principal balance until the loan can be returned to an accrual status. Loans are returned to accrual status when all the principal and interest amounts contractually due are brought current and future payments are reasonably assured.
For all loan portfolio segments, the Company promptly charges off loans, or portions thereof, when available information confirms that specific loans are uncollectable based on information that includes, but is not limited to, (1) the deteriorating financial condition of the borrower, (2) declining collateral values, and/or (3) legal action, including bankruptcy, that impairs the borrower's ability to adequately meet its obligations. For impaired loans that are considered to be solely collateral dependent, a partial charge-off is recorded when a loss has been confirmed by an updated appraisal or other appropriate valuation of the collateral.
When cash payments are received on impaired loans in each loan class, the Company records the payment as interest income unless collection of the remaining recorded principal amount is doubtful, at which time payments are used to reduce the principal balance of the loan. Troubled debt restructured loans recognize interest income on an accrual basis at the renegotiated rate if the loan is in compliance with the modified terms.
The Company uses warehouse loans or credit to fund mortgage loans held for sale from closing until sale to an investor. Under a warehousing arrangement the Company funds a mortgage loan as secured financing. The warehousing arrangement is secured by the underlying mortgages and a combination of deposits, personal guarantees and advance rates.
The Company holds the collateral until it is sent under a bailee arrangement instructing the investor to send proceeds to the Company. Typical investors are large financial institutions or government agencies.
Interest earned from the time of funding to the time of sale is recognized as interest income as accrued. Fees earned agreements are recognized when collected as noninterest income.
Allowance for Loan Losses
The allowance for loan losses is established as losses are estimated to have occurred through a provision for loan losses charged to income. Loan losses are charged against the allowance when management believes the uncollectability of a loan balance is confirmed. Subsequent recoveries, if any, are credited to the allowance.
The allowance for loan losses is evaluated on a regular basis by management and is based upon management's periodic review of the collectability of the loans in light of historical experience, the nature and volume of the loan portfolio, adverse situations that may affect the borrower's ability to repay, estimated value of any underlying collateral and prevailing economic conditions. This evaluation is inherently subjective as it requires estimates that are susceptible to significant revision as more information becomes available.
F-11
Merchants Bancorp
Notes to Consolidated Financial Statements (Continued)
Six Months Ended June 30, 2017 and 2016 (unaudited) and
Years Ended December 31, 2016 and 2015
Note 1: Nature of Operations and Summary of Significant Accounting Policies (Continued)
The allowance consists of allocated and general components. The allocated component relates to loans that are classified as impaired. For those loans that are classified as impaired, an allowance is established when the discounted cash flows (or collateral value or observable market price) of the impaired loan is lower than the carrying value of that loan. The general component covers non-classified loans and is based on historical charge-off experience and expected loss given default derived from the Company's internal risk rating process. Other adjustments may be made to the allowance for pools of loans after an assessment of internal or external influences on credit quality that are not fully reflected in the historical loss or risk rating data.
A loan is considered impaired when, based on current information and events, it is probable that the Company will be unable to collect the scheduled payments of principal or interest when due according to the contractual terms of the loan agreement. Factors considered by management in determining impairment include payment status, collateral value and the probability of collecting scheduled principal and interest payments when due. Loans that experience insignificant payment delays and payment shortfalls generally are not classified as impaired. Management determines the significance of payment delays and payment shortfalls on a case-by-case basis, taking into consideration all of the circumstances surrounding the loan and the borrower, including the length of the delay, the reasons for the delay, the borrower's prior payment record and the amount of the shortfall in relation to the principal and interest owed. Impairment is measured on a loan-by-loan basis for commercial and construction loans by either the present value of expected future cash flows discounted at the loan's effective interest rate, the loan's obtainable market price or the fair value of the collateral if the loan is collateral dependent. For impaired loans where the Company utilizes discounted cash flows to determine the level of impairment, the Company includes the entire change in the present value of cash flows as bad debt expense.
Groups of loans with similar risk characteristics are collectively evaluated for impairment based on the group's historical loss experience adjusted for changes in trends, conditions and other relevant factors that affect repayment of the loans. Accordingly, the Company does not separately identify individual consumer and residential loans for impairment measurements, unless such loans are the subject of a restructuring agreement due to financial difficulties of the borrower.
In the course of working with borrowers, the Company may choose to restructure the contractual terms of certain loans. In restructuring the loan, the Company attempts to work out an alternative payment schedule with the borrower in order to optimize collectability of the loan. A troubled debt restructuring (TDR) occurs when, for economic or legal reasons related to a borrower's financial difficulties, the Company grants a concession to the borrower that it would not otherwise consider. Terms may be modified to fit the ability of the borrower to repay in line with its current financial status, and the restructuring of the loan may include the transfer of assets from the borrower to satisfy the debt, a modification of loan terms, or a combination of the two.
Nonaccrual loans, including TDRs that have not met the six month minimum performance criterion, are reported as non-performing loans. For all loan classes, it is the Company's policy to have any restructured loans which are on nonaccrual status prior to being restructured remain on nonaccrual status until six months of satisfactory borrower performance, at which time management would consider its return to accrual status. A loan is generally classified as nonaccrual when the Company believes that
F-12
Merchants Bancorp
Notes to Consolidated Financial Statements (Continued)
Six Months Ended June 30, 2017 and 2016 (unaudited) and
Years Ended December 31, 2016 and 2015
Note 1: Nature of Operations and Summary of Significant Accounting Policies (Continued)
receipt of principal and interest is questionable under the terms of the loan agreement. Most generally, this is at 90 or more days past due.
With regard to determination of the amount of the allowance for credit losses, restructured loans are considered to be impaired. As a result, the determination of the amount of impaired loans for each portfolio segment within troubled debt restructurings is the same as detailed previously above.
Premises and Equipment
Depreciable assets are stated at cost less accumulated depreciation. Depreciation is charged to expense using the straight-line method for premises and the declining balance method for furniture, fixtures and equipment over the estimated useful lives of the assets.
The estimated useful lives for premises and equipment are as follows:
Buildings |
10 to 40 years | |
Leasehold improvements |
5 to 39 years | |
Furniture, fixtures and equipment |
3 - 7 years | |
Vehicles |
5 years |
Expenditures for property and equipment and for renewals or betterments that extend the originally estimated economic life of the assets are capitalized. Expenditures for maintenance and repairs are charged to expense. When an asset is retired or otherwise disposed of, the cost and accumulated depreciation are removed from the accounts and any gain or loss is included in the results of operations.
Federal Home Loan Bank Stock
Federal Home Loan Bank (FHLB) stock is a required investment for institutions that are members of a FHLB. The required investment in the common stock is based on a predetermined formula, carried at cost and evaluated for impairment.
Other Real Estate Owned
Assets acquired through, or in lieu of, loan foreclosure are held for sale and are initially recorded at fair value less cost to sell at the date of foreclosure, establishing a new cost basis. Subsequent to foreclosure, valuations are periodically performed by management and the assets are carried at the lower of carrying amount or fair value less cost to sell. Revenue and expenses from operations and changes in the valuation allowance are included in net income or expense from other real estate.
Mortgage Servicing Rights
Mortgage servicing assets are recognized separately when rights are acquired through purchase or through sale of financial assets. Under the servicing assets and liabilities accounting guidance (ASC 860-50), servicing rights resulting from the sale or securitization of loans originated by the Company are initially measured at fair value at the date of transfer. The Company has elected to
F-13
Merchants Bancorp
Notes to Consolidated Financial Statements (Continued)
Six Months Ended June 30, 2017 and 2016 (unaudited) and
Years Ended December 31, 2016 and 2015
Note 1: Nature of Operations and Summary of Significant Accounting Policies (Continued)
initially and subsequently measure the mortgage servicing rights for mortgage loans using the fair value method. Under the fair value method, the servicing rights are carried in the balance sheet at fair value and the changes in fair value are reported in earnings in the period in which the changes occur.
Fair value is based on market prices for comparable mortgage servicing contracts, when available, or alternatively, is based on a valuation model that calculates the present value of estimated future net servicing income. The valuation model is from an independent third party and it incorporates assumptions that market participants would use in estimating future net servicing income, such as the cost to service, the discount rate, the custodial earnings rate, an inflation rate, ancillary income, prepayment speeds, prepayment penalties, and default rates and losses. These variables change from quarter to quarter as market conditions and projected interest rates change, and may have an adverse impact on the value of the mortgage-servicing right and may result in a reduction to noninterest income.
Servicing fee income is recorded for fees earned for servicing loans. The fees are based on a contractual percentage of the outstanding principal or a fixed amount per loan and are recorded as income when earned. The change in the fair value of the mortgage-servicing rights is netted against loan servicing fee income.
Goodwill
Goodwill is tested annually for impairment or more frequently if impairment indicators are present. If the implied fair value of goodwill is lower than its carrying amount, a goodwill impairment is indicated and goodwill is written down to its implied fair value. Subsequent increases in goodwill value are not recognized in the financial statements.
Investment in Qualified Affordable Housing Limited Partnerships
The Company has elected to account for its investment in affordable housing tax credit limited partnerships using the proportional amortization method described in FASB ASU 2014-01, "Investments—Equity Method and Joint Ventures (Topic 323): Accounting for Investments in Qualified Affordable Housing Projects (A Consensus of the FASB Emerging Issues Task Force)." Under the proportional amortization method, an investor amortizes the initial cost of the investment to income tax expense in proportion to the tax credits and other tax benefits received and recognizes the net investment performance in the income statement as a component of income tax expense. The investment in the limited partnerships is included in other assets in the consolidated balance sheets.
Income Taxes
The Company accounts for income taxes in accordance with income tax accounting guidance (ASC 740, Income Taxes). The income tax accounting guidance results in two components of income tax expense: current and deferred. Current income tax expense reflects taxes to be paid or refunded for the current period by applying the provisions of the enacted tax law to the taxable income or excess of deductions over revenues. The Company determines deferred income taxes using the liability (or balance sheet) method. Under this method, the net deferred tax asset or liability is based on the tax
F-14
Merchants Bancorp
Notes to Consolidated Financial Statements (Continued)
Six Months Ended June 30, 2017 and 2016 (unaudited) and
Years Ended December 31, 2016 and 2015
Note 1: Nature of Operations and Summary of Significant Accounting Policies (Continued)
effects of the differences between the book and tax bases of assets and liabilities, and enacted changes in tax rates and laws are recognized in the period in which they occur. Deferred income tax expense results from changes in deferred tax assets and liabilities between periods. Deferred tax assets are reduced by a valuation allowance if, based on the weight of evidence available, it is more likely than not that some portion or all of a deferred tax asset will not be realized.
Uncertain tax positions are recognized if it is more likely than not, based on the technical merits, that the tax position will be realized or sustained upon examination. The term more likely than not means a likelihood of more than 50 percent; the terms examined and upon examination also include resolution of the related appeals or litigation processes, if any. A tax position that meets the more-likely-than-not recognition threshold is initially and subsequently measured as the largest amount of tax benefit that has a greater than 50 percent likelihood of being realized upon settlement with a taxing authority that has full knowledge of all relevant information. The determination of whether or not a tax position has met the more-likely-than-not recognition threshold considers the facts, circumstances and information available at the reporting date and is subject to management's judgment. With a few exceptions, the Company is no longer subject to U.S. federal, state and local or non-U.S. income tax examinations by tax authorities for years before 2014.
The Company recognizes interest and penalties, if any, on income taxes as a component of income tax expense.
The Company files consolidated income tax returns with its subsidiaries.
Earnings Per Share
Basic earnings per share is the Company's net income available to common shareholders, which represents net income less dividends paid or payable to preferred stock shareholders, if any, divided by the weighted-average number of common shares outstanding during each period. Diluted earnings per share is calculated in the same manner as basic earnings per share, but also reflects the issuance of additional common shares that would have been diluted if such shares had been outstanding, as well as any adjustment to income that would result from the assumed issuance.
Share-based Compensation Plan
The Company has a restricted stock plan that provides for annual awards of shares to certain members of senior management based upon the Company's performance and attainment of certain performance goals established by the Board of Directors. Share awards are valued at the estimated fair value on the date of the award and generally vest over three years. Compensation expense for the awards is recognized in the consolidated financial statements ratably over the vesting period.
Comprehensive Income
Comprehensive income consists of net income and other comprehensive income (loss), net of applicable income taxes. Other comprehensive income (loss) and accumulated other comprehensive income consist entirely of unrealized appreciation (depreciation) on available-for-sale investment securities.
F-15
Merchants Bancorp
Notes to Consolidated Financial Statements (Continued)
Six Months Ended June 30, 2017 and 2016 (unaudited) and
Years Ended December 31, 2016 and 2015
Note 1: Nature of Operations and Summary of Significant Accounting Policies (Continued)
Reclassifications
Certain reclassifications have been made to the 2016 and 2015 financial statements to conform to the financial statement presentation as of and for the six months ended June 30, 2017. These reclassifications had no effect on net income.
Note 2: Restriction on Cash and Due From Banks
The Company is required to maintain reserve funds in cash and/or on deposit with the Federal Reserve Bank. The reserve required at June 30, 2017 and December 31, 2016 was $101.2 million and $109.5 million, respectively.
Note 3: Securities
The amortized cost and approximate fair values, together with gross unrealized gains and losses, of securities are as follows:
| |
June 30, 2017 | ||||||||||||
|---|---|---|---|---|---|---|---|---|---|---|---|---|---|
| |
Amortized Cost |
Gross Unrealized Gains |
Gross Unrealized Losses |
Approximate Fair Value |
|||||||||
| |
(In thousands) |
||||||||||||
Available-for-sale securities: |
|||||||||||||
Treasury notes |
$ | 1,000 | $ | — | $ | — | $ | 1,000 | |||||
Federal agencies |
352,058 | — | 936 | 351,122 | |||||||||
Municipals |
|||||||||||||
Mortgage-backed—Government-sponsored entity (GSE)—residential |
26,173 | — | — | 26,173 | |||||||||
| | | | | | | | | | | | | | |
Total available-for-sale securities |
$ | 379,231 | $ | — | $ | 936 | $ | 378,295 | |||||
| | | | | | | | | | | | | | |
| | | | | | | | | | | | | | |
| | | | | | | | | | | | | | |
| |
December 31, 2016 | ||||||||||||
|---|---|---|---|---|---|---|---|---|---|---|---|---|---|
| |
Amortized Cost |
Gross Unrealized Gains |
Gross Unrealized Losses |
Approximate Fair Value |
|||||||||
| |
(In thousands) |
||||||||||||
Available-for-sale securities: |
|||||||||||||
Treasury notes |
$ | 999 | $ | — | $ | — | $ | 999 | |||||
Federal agencies |
290,050 | — | 1,057 | 288,993 | |||||||||
Municipals |
9,500 | — | — | 9,500 | |||||||||
Mortgage-backed—Government-sponsored entity (GSE)—residential |
26,382 | — | — | 26,382 | |||||||||
| | | | | | | | | | | | | | |
Total available-for-sale securities |
$ | 326,931 | $ | — | $ | 1,057 | $ | 325,874 | |||||
| | | | | | | | | | | | | | |
| | | | | | | | | | | | | | |
| | | | | | | | | | | | | | |
F-16
Merchants Bancorp
Notes to Consolidated Financial Statements (Continued)
Six Months Ended June 30, 2017 and 2016 (unaudited) and
Years Ended December 31, 2016 and 2015
Note 3: Securities (Continued)
| |
December 31, 2015 | ||||||||||||
|---|---|---|---|---|---|---|---|---|---|---|---|---|---|
| |
Amortized Cost |
Gross Unrealized Gains |
Gross Unrealized Losses |
Approximate Fair Value |
|||||||||
| |
(In thousands) |
||||||||||||
Available-for-sale securities: |
|||||||||||||
Treasury notes |
$ | 998 | $ | — | $ | 6 | $ | 992 | |||||
Federal agencies |
208,601 | 33 | 556 | 208,078 | |||||||||
Municipals |
9,500 | — | — | 9,500 | |||||||||
Mortgage-backed—Government-sponsored entity (GSE)—residential |
35,746 | 140 | — | 35,886 | |||||||||
| | | | | | | | | | | | | | |
Total available-for-sale securities |
$ | 254,845 | $ | 173 | $ | 562 | $ | 254,456 | |||||
| | | | | | | | | | | | | | |
| | | | | | | | | | | | | | |
| | | | | | | | | | | | | | |
The amortized cost and fair value of available-for-sale securities at June 30, 2017 and December 31, 2016 by contractual maturity, are shown below. Expected maturities will differ from contractual maturities because issuers may have the right to call or prepay obligations with or without call or prepayment penalties.
| |
June 30, 2017 | December 31, 2016 | |||||||||||
|---|---|---|---|---|---|---|---|---|---|---|---|---|---|
| |
Amortized Cost |
Fair Value |
Amortized Cost |
Fair Value |
|||||||||
| |
(In thousands) |
||||||||||||
Within one year |
$ | 104,773 | $ | 104,610 | $ | 68,482 | $ | 68,426 | |||||
After one through five years |
248,285 | 247,512 | 232,067 | 231,066 | |||||||||
After five through ten years |
— | — | — | — | |||||||||
After ten years |
— | — | — | — | |||||||||
| | | | | | | | | | | | | | |
|
353,058 | 352,122 | 300,549 | 299,492 | |||||||||
Mortgage-backed—Government-sponsored entity (GSE)—residential |
26,173 | 26,173 | 26,382 | 26,382 | |||||||||
| | | | | | | | | | | | | | |
|
$ | 379,231 | $ | 378,295 | $ | 326,931 | $ | 325,874 | |||||
| | | | | | | | | | | | | | |
| | | | | | | | | | | | | | |
| | | | | | | | | | | | | | |
Certain investments in debt securities are reported in the financial statements at an amount less than their historical cost. Total fair value of these investments at June 30, 2017 and at December 31, 2016 and 2015, was $351.1 million, $275.1 million and $125.8 million, respectively, which is approximately 93%, 85% and 49%, respectively, of the Company's available-for-sale investment portfolio.
F-17
Merchants Bancorp
Notes to Consolidated Financial Statements (Continued)
Six Months Ended June 30, 2017 and 2016 (unaudited) and
Years Ended December 31, 2016 and 2015
Note 3: Securities (Continued)
The following tables show the Company's gross unrealized losses and fair value of the Company's investments with unrealized losses that are not deemed to be other-than-temporarily impaired, aggregated by investment class and length of time that individual securities have been in a continuous unrealized loss position at June 30, 2017, and December 31, 2016 and 2015:
| |
June 30, 2017 | ||||||||||||||||||
|---|---|---|---|---|---|---|---|---|---|---|---|---|---|---|---|---|---|---|---|
| |
Less than 12 Months | 12 Months or Longer |
Total | ||||||||||||||||
| |
Fair Value |
Gross Unrealized Losses |
Fair Value |
Gross Unrealized Losses |
Fair Value |
Gross Unrealized Losses |
|||||||||||||
| |
(In thousands) |
||||||||||||||||||
Available-for-sale securities: |
|||||||||||||||||||
Federal agencies |
$ | 346,683 | $ | 924 | $ | 4,439 | $ | 12 | $ | 351,122 | $ | 936 | |||||||
| | | | | | | | | | | | | | | | | | | | |
| | | | | | | | | | | | | | | | | | | | |
| | | | | | | | | | | | | | | | | | | | |
| |
December 31, 2016 | ||||||||||||||||||
|---|---|---|---|---|---|---|---|---|---|---|---|---|---|---|---|---|---|---|---|
| |
Less than 12 Months | 12 Months or Longer |
Total | ||||||||||||||||
| |
Fair Value |
Gross Unrealized Losses |
Fair Value |
Gross Unrealized Losses |
Fair Value |
Gross Unrealized Losses |
|||||||||||||
| |
(In thousands) |
||||||||||||||||||
Available-for-sale securities: |
|||||||||||||||||||
Federal agencies |
$ | 275,143 | $ | 1,057 | $ | — | $ | — | $ | 275,143 | $ | 1,057 | |||||||
| | | | | | | | | | | | | | | | | | | | |
| | | | | | | | | | | | | | | | | | | | |
| | | | | | | | | | | | | | | | | | | | |
| |
December 31, 2015 | ||||||||||||||||||
|---|---|---|---|---|---|---|---|---|---|---|---|---|---|---|---|---|---|---|---|
| |
Less than 12 Months | 12 Months or Longer |
Total | ||||||||||||||||
| |
Fair Value |
Gross Unrealized Losses |
Fair Value |
Gross Unrealized Losses |
Fair Value |
Gross Unrealized Losses |
|||||||||||||
| |
(In thousands) |
||||||||||||||||||
Available-for-sale securities: |
|||||||||||||||||||
Treasury notes |
$ | 992 | $ | 6 | $ | — | $ | — | $ | 992 | $ | 6 | |||||||
Federal agencies |
124,798 | 556 | — | — | 124,798 | 556 | |||||||||||||
| | | | | | | | | | | | | | | | | | | | |
|
$ | 125,790 | $ | 562 | $ | — | $ | — | $ | 125,790 | $ | 562 | |||||||
| | | | | | | | | | | | | | | | | | | | |
| | | | | | | | | | | | | | | | | | | | |
| | | | | | | | | | | | | | | | | | | | |
Unrealized losses on securities have not been recognized to income because the Company has the intent and ability to hold the securities for the foreseeable future, and the decline in fair value is primarily due to increased market interest rates. The fair value is expected to recover as the bonds approach the maturity date.
Proceeds from the sale of securities available for sale during the year ended December 31, 2016 were $7.4 million. Gross gains of $24,000 were realized on 2016 sales. No securities available-for-sale were sold during the six months ended June 30, 2017 and 2016, or during the year ended December 31, 2015.
F-18
Merchants Bancorp
Notes to Consolidated Financial Statements (Continued)
Six Months Ended June 30, 2017 and 2016 (unaudited) and
Years Ended December 31, 2016 and 2015
Note 4: Loans and Allowance for Loan Losses
Classes of loans at June 30, 2017, and at December 31, 2016 and 2015, include:
| |
|
December 31, | ||||||||
|---|---|---|---|---|---|---|---|---|---|---|
| |
June 30, 2017 |
|||||||||
| |
2016 | 2015 | ||||||||
| |
(In thousands) |
|||||||||
Mortgage warehouse lines of credit |
$ | 245,876 | $ | 275,039 | $ | 281,746 | ||||
Residential real estate |
289,932 | 235,759 | 199,065 | |||||||
Multi-family and healthcare financing |
315,076 | 261,031 | 145,082 | |||||||
Commercial & commercial real estate |
162,138 | 113,812 | 83,688 | |||||||
Agricultural production and real estate |
48,594 | 46,763 | 44,772 | |||||||
Consumer & margin loans |
9,250 | 9,392 | 7,859 | |||||||
| | | | | | | | | | | |
|
1,070,866 | 941,796 | 762,212 | |||||||
Less |
||||||||||
Allowance for loan losses |
6,865 | 6,250 | 5,422 | |||||||
| | | | | | | | | | | |
Loans Receivable |
$ | 1,064,001 | $ | 935,546 | $ | 756,790 | ||||
| | | | | | | | | | | |
| | | | | | | | | | | |
| | | | | | | | | | | |
Risk characteristics applicable to each segment of the loan portfolio are described as follows.
Mortgage Warehouse Lines of Credit (MTG WHLOC): Under its warehouse program, the Company provides warehouse financing arrangements to approved mortgage companies for the origination and sale of residential mortgage loans and to a lesser extent multi-family loans. Agency eligible, governmental and jumbo residential mortgage loans that are secured by mortgages placed on existing one to four family dwellings may be originated or purchased and placed on each mortgage warehouse line.
As a secured line of credit, collateral pledged to the Company secures each individual mortgage until the lender sells the loan in the secondary market. A traditional secured warehouse line of credit typically carries a base interest rate of 30-day LIBOR or the Wall Street Journal Prime Rate plus a margin.
Risk is evident if there is a change in the fair value of mortgage loans originated by mortgage bankers during the time in warehouse, the sale of which is the expected source of repayment of the borrowings under a warehouse line of credit.
Residential Real Estate Loans (RES RE): The real estate loans are secured by owner-occupied 1-4 family residences. Repayment of residential real estate loans is primarily dependent on the personal income and credit rating of the borrowers.
Multi-Family and Healthcare Financing (MF RE): The Company engages in multi-family and healthcare financing, including construction loans, specializing in originating and servicing loans for multi-family rental and senior living properties. In addition, the Company originates loans secured by an assignment of federal income tax credits by partnerships invested in multi-family real estate projects. Construction and land loans are generally based upon estimates of costs and estimated value of the completed project and include independent appraisal reviews and a financial analysis of the developers
F-19
Merchants Bancorp
Notes to Consolidated Financial Statements (Continued)
Six Months Ended June 30, 2017 and 2016 (unaudited) and
Years Ended December 31, 2016 and 2015
Note 4: Loans and Allowance for Loan Losses (Continued)
and property owners. Sources of repayment of these loans may include permanent loans, sales of developed property or an interim loan commitment from the Bank until permanent financing is obtained. These loans are considered to be higher risk than other real estate loans due to their ultimate repayment being sensitive to interest rate changes, general economic conditions and the availability of long-term financing. Credit risk in these loans may be impacted by the creditworthiness of a borrower, property values and the local economy in the Company's market area. Repayment of these loans depends on the successful operation of a business or property and the borrower's cash flows.
Commercial Lending and Commercial Real Estate Loans (CML & CRE): The commercial lending and commercial real estate portfolio includes loans to commercial customers for use in financing working capital needs, equipment purchases and expansions, as well as loans to commercial customers to finance land and improvements. The loans in this category are repaid primarily from the cash flow of a borrower's principal business operation. Credit risk in these loans is driven by creditworthiness of a borrower and the economic conditions that impact the cash flow stability from business operations.
Agricultural Production and Real Estate Loans (AG & AGRE): Agricultural production loans are generally comprised of seasonal operating lines of credit to grain farmers to plant and harvest corn and soybeans and term loans to fund the purchase of equipment. The Company also offers long-term financing to purchase agricultural real estate. Specific underwriting standards have been established for agricultural-related loans including the establishment of projections for each operating year based on industry-developed estimates of farm input costs and expected commodity yields and prices. Operating lines are typically written for one year and secured by the crop and other farm assets as considered necessary. The Company is approved to sell agricultural loans in the secondary market through the Federal Agricultural Mortgage Corporation and uses this relationship to manage interest rate risk within the portfolio.
Consumer and Margin Loans (CON & MAR): Consumer loans are those loans secured by household goods. Margin loans are those loans secured by marketable securities. The term and maximum amount for these loans are determined by considering the purpose of the loan, the margin (advance percentage against value) in all collateral, the primary source of repayment, and the borrower's other related cash flow.
F-20
Merchants Bancorp
Notes to Consolidated Financial Statements (Continued)
Six Months Ended June 30, 2017 and 2016 (unaudited) and
Years Ended December 31, 2016 and 2015
Note 4: Loans and Allowance for Loan Losses (Continued)
The following tables present by portfolio segment, the activity in the allowance for loan losses for the six month periods ended June 30, 2017 and 2016, and the recorded investment in loans and impairment method as of June 30, 2017:
| |
At or For the Six Months Ended June 30, 2017 | |||||||||||||||||||||
|---|---|---|---|---|---|---|---|---|---|---|---|---|---|---|---|---|---|---|---|---|---|---|
| |
MTG WHLOC |
RES RE | MF RE | CML & CRE |
AG & AGRE |
CON & MAR |
TOTAL | |||||||||||||||
| |
(In thousands) |
|||||||||||||||||||||
Allowance for loan losses |
||||||||||||||||||||||
Balance, beginning of period |
$ | 373 | $ | 2,170 | 1,962 | $ | 1,374 | $ | 269 | $ | 102 | $ | 6,250 | |||||||||
Provision for loan losses |
(92 | ) | (232 | ) | 464 | 370 | 2 | (32 | ) | 480 | ||||||||||||
Loans charged to the allowance |
— | — | — | — | — | — | — | |||||||||||||||
Recoveries of loans previously charged off |
— | — | — | 101 | — | 34 | 135 | |||||||||||||||
| | | | | | | | | | | | | | | | | | | | | | | |
Balance, end of period |
$ | 281 | $ | 1,938 | $ | 2,426 | $ | 1,845 | $ | 271 | $ | 104 | $ | 6,865 | ||||||||
| | | | | | | | | | | | | | | | | | | | | | | |
| | | | | | | | | | | | | | | | | | | | | | | |
| | | | | | | | | | | | | | | | | | | | | | | |
Ending balance:individually evaluated for impairment |
$ | — | $ | — | $ | — | $ | — | $ | 16 | $ | — | $ | 16 | ||||||||
| | | | | | | | | | | | | | | | | | | | | | | |
| | | | | | | | | | | | | | | | | | | | | | | |
| | | | | | | | | | | | | | | | | | | | | | | |
Ending balance:collectively evaluated for impairment |
$ | 281 | $ | 1,938 | $ | 2,426 | $ | 1,845 | $ | 255 | $ | 104 | $ | 6,849 | ||||||||
| | | | | | | | | | | | | | | | | | | | | | | |
| | | | | | | | | | | | | | | | | | | | | | | |
| | | | | | | | | | | | | | | | | | | | | | | |
Loans |
||||||||||||||||||||||
Ending balance |
$ | 245,876 | $ | 289,932 | 315,076 | $ | 162,138 | $ | 48,594 | $ | 9,250 | $ | 1,070,866 | |||||||||
| | | | | | | | | | | | | | | | | | | | | | | |
| | | | | | | | | | | | | | | | | | | | | | | |
| | | | | | | | | | | | | | | | | | | | | | | |
Ending balance individually evaluated for impairment |
$ | — | $ | 301 | $ | — | $ | 3,162 | $ | 282 | $ | — | $ | 3,745 | ||||||||
| | | | | | | | | | | | | | | | | | | | | | | |
| | | | | | | | | | | | | | | | | | | | | | | |
| | | | | | | | | | | | | | | | | | | | | | | |
Ending balance collectively evaluated for impairment |
$ | 245,876 | $ | 289,631 | $ | 315,076 | $ | 158,976 | $ | 48,312 | $ | 9,250 | $ | 1,067,121 | ||||||||
| | | | | | | | | | | | | | | | | | | | | | | |
| | | | | | | | | | | | | | | | | | | | | | | |
| | | | | | | | | | | | | | | | | | | | | | | |
| |
For the Six Months Ended June 30, 2016 | |||||||||||||||||||||
|---|---|---|---|---|---|---|---|---|---|---|---|---|---|---|---|---|---|---|---|---|---|---|
| |
MTG WHLOC |
RES RE | MF RE | CML & CRE |
AG & AGRE |
CON & MAR |
TOTAL | |||||||||||||||
| |
(In thousands) |
|||||||||||||||||||||
Allowance for loan losses |
||||||||||||||||||||||
Balance, beginning of period |
$ | 704 | $ | 2,212 | 1,308 | $ | 908 | $ | 222 | $ | 68 | $ | 5,422 | |||||||||
Provision for loan losses |
66 | (373 | ) | 429 | 335 | 1 | 22 | 480 | ||||||||||||||
Loans charged to the allowance |
— | — | — | — | — | — | — | |||||||||||||||
Recoveries of loans previously charged off |
— | — | — | — | — | — | — | |||||||||||||||
| | | | | | | | | | | | | | | | | | | | | | | |
Balance, end of period |
$ | 770 | $ | 1,839 | $ | 1,737 | $ | 1,243 | $ | 223 | $ | 90 | $ | 5,902 | ||||||||
| | | | | | | | | | | | | | | | | | | | | | | |
| | | | | | | | | | | | | | | | | | | | | | | |
| | | | | | | | | | | | | | | | | | | | | | | |
F-21
Merchants Bancorp
Notes to Consolidated Financial Statements (Continued)
Six Months Ended June 30, 2017 and 2016 (unaudited) and
Years Ended December 31, 2016 and 2015
Note 4: Loans and Allowance for Loan Losses (Continued)
The following tables present by loan portfolio segment, the activity in the allowance for loan losses for the years ended December 31, 2016 and 2015, and the recorded investment in loans and impairment method as of December 31, 2016 and 2015:
| |
At or For the Year Ended December 31, 2016 | |||||||||||||||||||||
|---|---|---|---|---|---|---|---|---|---|---|---|---|---|---|---|---|---|---|---|---|---|---|
| |
MTG WHLOC |
RES RE | MF RE | CML & CRE |
AG & AGRE |
CON & MAR |
TOTAL | |||||||||||||||
| |
(In thousands) |
|||||||||||||||||||||
Allowance for loan losses |
||||||||||||||||||||||
Balance, beginning of year |
$ | 704 | $ | 2,212 | 1,308 | $ | 908 | $ | 222 | $ | 68 | $ | 5,422 | |||||||||
Provision for loan losses |
(331 | ) | 90 | 654 | 466 | 47 | 34 | 960 | ||||||||||||||
Transfer out |
— | (132 | ) | — | — | — | — | (132 | ) | |||||||||||||
Loans charged to the allowance |
— | — | — | — | — | — | — | |||||||||||||||
Recoveries of loans previously charged off |
— | — | — | — | — | — | — | |||||||||||||||
| | | | | | | | | | | | | | | | | | | | | | | |
Balance, end of year |
$ | 373 | $ | 2,170 | $ | 1,962 | $ | 1,374 | $ | 269 | $ | 102 | $ | 6,250 | ||||||||
| | | | | | | | | | | | | | | | | | | | | | | |
| | | | | | | | | | | | | | | | | | | | | | | |
| | | | | | | | | | | | | | | | | | | | | | | |
Ending balance: individually evaluated for impairment |
$ | — | $ | 30 | $ | — | $ | — | $ | 11 | $ | — | $ | 41 | ||||||||
| | | | | | | | | | | | | | | | | | | | | | | |
| | | | | | | | | | | | | | | | | | | | | | | |
| | | | | | | | | | | | | | | | | | | | | | | |
Ending balance: collectively evaluated for impairment |
$ | 373 | $ | 2,140 | $ | 1,962 | $ | 1,374 | $ | 258 | $ | 102 | $ | 6,209 | ||||||||
| | | | | | | | | | | | | | | | | | | | | | | |
| | | | | | | | | | | | | | | | | | | | | | | |
| | | | | | | | | | | | | | | | | | | | | | | |
Loans |
||||||||||||||||||||||
Ending balance |
$ | 275,039 | $ | 235,759 | 261,031 | $ | 113,812 | $ | 46,763 | $ | 9,392 | $ | 941,796 | |||||||||
| | | | | | | | | | | | | | | | | | | | | | | |
| | | | | | | | | | | | | | | | | | | | | | | |
| | | | | | | | | | | | | | | | | | | | | | | |
Ending balance individually evaluated for impairment |
$ | — | $ | 343 | $ | — | $ | 5,022 | $ | 203 | $ | — | $ | 5,568 | ||||||||
| | | | | | | | | | | | | | | | | | | | | | | |
| | | | | | | | | | | | | | | | | | | | | | | |
| | | | | | | | | | | | | | | | | | | | | | | |
Ending balance collectively evaluated for impairment |
$ | 275,039 | $ | 235,416 | $ | 261,031 | $ | 108,790 | $ | 46,560 | $ | 9,392 | $ | 936,228 | ||||||||
| | | | | | | | | | | | | | | | | | | | | | | |
| | | | | | | | | | | | | | | | | | | | | | | |
| | | | | | | | | | | | | | | | | | | | | | | |
F-22
Merchants Bancorp
Notes to Consolidated Financial Statements (Continued)
Six Months Ended June 30, 2017 and 2016 (unaudited) and
Years Ended December 31, 2016 and 2015
Note 4: Loans and Allowance for Loan Losses (Continued)
| |
At or For the Year Ended December 31, 2015 | |||||||||||||||||||||
|---|---|---|---|---|---|---|---|---|---|---|---|---|---|---|---|---|---|---|---|---|---|---|
| |
MTG WHLOC |
RES RE | MF RE | CML & CRE |
AG & AGRE |
CON & MAR |
TOTAL | |||||||||||||||
| |
(In thousands) |
|||||||||||||||||||||
Allowance for loan losses |
||||||||||||||||||||||
Balance, beginning of year |
$ | 475 | $ | 1,806 | 689 | $ | 1,163 | $ | 275 | $ | 50 | $ | 4,458 | |||||||||
Provision for loan losses |
229 | 405 | 619 | (258 | ) | (53 | ) | 18 | 960 | |||||||||||||
Loans charged to the allowance |
— | — | — | — | — | — | — | |||||||||||||||
Recoveries of loans previously charged off |
— | 1 | — | 3 | — | — | 4 | |||||||||||||||
| | | | | | | | | | | | | | | | | | | | | | | |
Balance, end of year |
$ | 704 | $ | 2,212 | 1,308 | $ | 908 | $ | 222 | $ | 68 | $ | 5,422 | |||||||||
| | | | | | | | | | | | | | | | | | | | | | | |
| | | | | | | | | | | | | | | | | | | | | | | |
| | | | | | | | | | | | | | | | | | | | | | | |
Ending balance: individually evaluated for impairment |
$ | — | $ | 30 | $ | — | $ | 81 | $ | — | $ | — | $ | 111 | ||||||||
| | | | | | | | | | | | | | | | | | | | | | | |
| | | | | | | | | | | | | | | | | | | | | | | |
| | | | | | | | | | | | | | | | | | | | | | | |
Ending balance: collectively evaluated for impairment |
$ | 704 | $ | 2,182 | $ | 1,308 | $ | 827 | $ | 222 | $ | 68 | $ | 5,311 | ||||||||
| | | | | | | | | | | | | | | | | | | | | | | |
| | | | | | | | | | | | | | | | | | | | | | | |
| | | | | | | | | | | | | | | | | | | | | | | |
Loans |
||||||||||||||||||||||
Ending balance |
$ | 281,746 | $ | 199,065 | $ | 145,082 | $ | 83,688 | $ | 44,772 | $ | 7,859 | $ | 762,212 | ||||||||
| | | | | | | | | | | | | | | | | | | | | | | |
| | | | | | | | | | | | | | | | | | | | | | | |
| | | | | | | | | | | | | | | | | | | | | | | |
Ending balance individually evaluated for impairment |
$ | — | $ | 66 | $ | — | $ | 181 | $ | — | $ | — | $ | 247 | ||||||||
| | | | | | | | | | | | | | | | | | | | | | | |
| | | | | | | | | | | | | | | | | | | | | | | |
| | | | | | | | | | | | | | | | | | | | | | | |
Ending balance |
$ | 281,746 | $ | 198,999 | $ | 145,082 | $ | 83,507 | $ | 44,772 | $ | 7,859 | $ | 761,965 | ||||||||
| | | | | | | | | | | | | | | | | | | | | | | |
| | | | | | | | | | | | | | | | | | | | | | | |
| | | | | | | | | | | | | | | | | | | | | | | |
Internal Risk Categories
In adherence with policy, the Company uses the following internal risk grading categories and definitions for loans:
Average or above—Loans to borrowers of satisfactory financial strength or better. Earnings performance is consistent with primary and secondary sources of repayment that are well defined and adequate to retire the debt in a timely and orderly fashion. These businesses would generally exhibit satisfactory asset quality and liquidity with moderate leverage, average performance to their peer group and experienced management in key positions. These loans are disclosed as "Acceptable and Above" in the following table.
Acceptable—Loans to borrowers involving more than average risk and which contain certain characteristics that require some supervision and attention by the lender. Asset quality is acceptable,
F-23
Merchants Bancorp
Notes to Consolidated Financial Statements (Continued)
Six Months Ended June 30, 2017 and 2016 (unaudited) and
Years Ended December 31, 2016 and 2015
Note 4: Loans and Allowance for Loan Losses (Continued)
but debt capacity is modest and little excess liquidity is available. The borrower may be fully leveraged and unable to sustain major setbacks. Covenants are structured to ensure adequate protection. Borrower's management may have limited experience and depth. This category includes loans which are highly leveraged due to regulatory constraints, as well as loans involving reasonable exceptions to policy. These loans are disclosed as "Acceptable and Above" in the following table.
Special Mention (Watch)—This is a loan that is sound and collectable but contains considerable risk. Loans classified as special mention have a potential weakness that deserves management's close attention. If left uncorrected, these potential weaknesses may result in deterioration of the repayment prospects for the loan or of the institution's credit position at some future date.
Substandard—Loans classified as substandard are inadequately protected by the current net worth and paying capacity of the obligor or of the collateral pledged, if any. Loans so classified have a well-defined weakness or weaknesses that jeopardize the liquidation of the debt. They are characterized by the distinct possibility that the institution will sustain some loss if the deficiencies are not corrected.
Doubtful—Loans classified as doubtful have all the weaknesses inherent in those classified as substandard, with the added characteristic that the weaknesses make collection or liquidation in full, on the basis of currently existing facts, conditions, and values, highly questionable and improbable.
The following tables present the credit risk profile of the Bank's loan portfolio based on internal rating category and payment activity as of June 30, 2017 and December 31, 2016 and 2015:
| |
June 30, 2017 | |||||||||||||||||||||
|---|---|---|---|---|---|---|---|---|---|---|---|---|---|---|---|---|---|---|---|---|---|---|
| |
MTG WHLOC | RES RE | MF RE | CML & CRE |
AG & AGRE |
CON & MAR |
TOTAL | |||||||||||||||
| |
(in thousands) |
|||||||||||||||||||||
Special Mention (Watch) |
$ | — | $ | 211 | $ | — | $ | 9,444 | $ | 876 | $ | 1,887 | $ | 12,418 | ||||||||
Substandard |
— | 341 | — | 4,682 | 282 | — | 5,305 | |||||||||||||||
Doubtful |
— | — | — | — | — | — | — | |||||||||||||||
Acceptable and Above |
245,876 | 289,380 | 315,076 | 148,012 | 47,436 | 7,363 | 1,053,143 | |||||||||||||||
| | | | | | | | | | | | | | | | | | | | | | | |
Total |
$ | 245,876 | $ | 289,932 | $ | 315,076 | $ | 162,138 | $ | 48,594 | $ | 9,250 | $ | 1,070,866 | ||||||||
| | | | | | | | | | | | | | | | | | | | | | | |
| | | | | | | | | | | | | | | | | | | | | | | |
| | | | | | | | | | | | | | | | | | | | | | | |
| |
December 31, 2016 | |||||||||||||||||||||
|---|---|---|---|---|---|---|---|---|---|---|---|---|---|---|---|---|---|---|---|---|---|---|
| |
MTG WHLOC |
RES RE | MF RE | CML & CRE |
AG & AGRE |
CON & MAR |
TOTAL | |||||||||||||||
| |
(In thousands) |
|||||||||||||||||||||
Special Mention (Watch) |
$ | — | $ | 214 | $ | — | $ | 7,150 | $ | — | $ | 2,158 | $ | 9,522 | ||||||||
Substandard |
— | 343 | — | 4,986 | 203 | — | 5,532 | |||||||||||||||
Doubtful |
— | — | — | — | — | — | — | |||||||||||||||
Acceptable and Above |
275,039 | 235,202 | 261,031 | 101,676 | 46,560 | 7,234 | 926,742 | |||||||||||||||
| | | | | | | | | | | | | | | | | | | | | | | |
Total |
$ | 275,039 | $ | 235,759 | $ | 261,031 | $ | 113,812 | $ | 46,763 | $ | 9,392 | $ | 941,796 | ||||||||
| | | | | | | | | | | | | | | | | | | | | | | |
| | | | | | | | | | | | | | | | | | | | | | | |
| | | | | | | | | | | | | | | | | | | | | | | |
F-24
Merchants Bancorp
Notes to Consolidated Financial Statements (Continued)
Six Months Ended June 30, 2017 and 2016 (unaudited) and
Years Ended December 31, 2016 and 2015
Note 4: Loans and Allowance for Loan Losses (Continued)
| |
December 31, 2015 | |||||||||||||||||||||
|---|---|---|---|---|---|---|---|---|---|---|---|---|---|---|---|---|---|---|---|---|---|---|
| |
MTG WHLOC |
RES RE | MF RE | CML & CRE |
AG & AGRE |
CON & MAR |
TOTAL | |||||||||||||||
| |
(In thousands) |
|||||||||||||||||||||
Special Mention (Watch) |
$ | — | $ | 1,088 | $ | — | $ | 4,007 | $ | — | $ | 2,332 | $ | 7,427 | ||||||||
Substandard |
— | 106 | — | 2,820 | — | — | 2,926 | |||||||||||||||
Doubtful |
— | — | — | — | — | — | — | |||||||||||||||
Acceptable and Above |
281,746 | 197,871 | 145,082 | 76,861 | 44,772 | 5,527 | 751,859 | |||||||||||||||
| | | | | | | | | | | | | | | | | | | | | | | |
Total |
$ | 281,746 | $ | 199,065 | $ | 145,082 | $ | 83,688 | $ | 44,772 | $ | 7,859 | $ | 762,212 | ||||||||
| | | | | | | | | | | | | | | | | | | | | | | |
| | | | | | | | | | | | | | | | | | | | | | | |
| | | | | | | | | | | | | | | | | | | | | | | |
The Bank evaluates the loan risk grading system definitions and allowance for loan loss methodology on an ongoing basis. No significant changes were made to either during the past year.
The following tables present the Bank's loan portfolio aging analysis of the recorded investment in loans as of June 30, 2017 and December 31, 2016 and 2015:
| |
June 30, 2017 | ||||||||||||||||||
|---|---|---|---|---|---|---|---|---|---|---|---|---|---|---|---|---|---|---|---|
| |
30 - 59 Days Past Due |
60 - 89 Days Past Due |
Greater Than 90 Days |
Total Past Due |
Current | Total Loans |
|||||||||||||
| |
(In thousands) |
||||||||||||||||||
MTG WHLOC |
$ | — | $ | — | $ | — | $ | — | $ | 245,876 | $ | 245,876 | |||||||
RES RE |
40 | — | 301 | 341 | 289,591 | 289,932 | |||||||||||||
MF RE |
— | 4,420 | — | 4,420 | 310,656 | 315,076 | |||||||||||||
CML & CRE |
— | 78 | 2,636 | 2,714 | 159,424 | 162,138 | |||||||||||||
AG & AGRE |
79 | — | 236 | 315 | 48,279 | 48,594 | |||||||||||||
CON & MAR |
— | — | — | — | 9,250 | 9,250 | |||||||||||||
| | | | | | | | | | | | | | | | | | | | |
|
$ | 119 | $ | 4,498 | $ | 3,173 | $ | 7,790 | $ | 1,063,076 | $ | 1,070,866 | |||||||
| | | | | | | | | | | | | | | | | | | | |
| | | | | | | | | | | | | | | | | | | | |
| | | | | | | | | | | | | | | | | | | | |
| |
December 31, 2016 | ||||||||||||||||||
|---|---|---|---|---|---|---|---|---|---|---|---|---|---|---|---|---|---|---|---|
| |
30 - 59 Days Past Due |
60 - 89 Days Past Due |
Greater Than 90 Days |
Total Past Due |
Current | Total Loans |
|||||||||||||
| |
(In thousands) |
||||||||||||||||||
MTG WHLOC |
$ | — | $ | — | $ | — | $ | — | $ | 275,039 | $ | 275,039 | |||||||
RES RE |
40 | — | 881 | 921 | 234,838 | 235,759 | |||||||||||||
MF RE |
— | — | — | — | 261,031 | 261,031 | |||||||||||||
CML & CRE |
43 | 2,018 | 899 | 2,960 | 110,852 | 113,812 | |||||||||||||
AG & AGRE |
101 | 86 | 107 | 294 | 46,469 | 46,763 | |||||||||||||
CON & MAR |
— | — | — | — | 9,392 | 9,392 | |||||||||||||
| | | | | | | | | | | | | | | | | | | | |
|
$ | 184 | $ | 2,104 | $ | 1,887 | $ | 4,175 | $ | 937,621 | $ | 941,796 | |||||||
| | | | | | | | | | | | | | | | | | | | |
| | | | | | | | | | | | | | | | | | | | |
| | | | | | | | | | | | | | | | | | | | |
F-25
Merchants Bancorp
Notes to Consolidated Financial Statements (Continued)
Six Months Ended June 30, 2017 and 2016 (unaudited) and
Years Ended December 31, 2016 and 2015
Note 4: Loans and Allowance for Loan Losses (Continued)
| |
December 31, 2015 | ||||||||||||||||||
|---|---|---|---|---|---|---|---|---|---|---|---|---|---|---|---|---|---|---|---|
| |
30 - 59 Days Past Due |
60 - 89 Days Past Due |
Greater Than 90 Days |
Total Past Due |
Current | Total Loans |
|||||||||||||
| |
(In thousands) |
||||||||||||||||||
MTG WHLOC |
$ | — | $ | — | $ | — | $ | — | $ | 281,746 | $ | 281,746 | |||||||
RES RE |
281 | — | 671 | 952 | 198,113 | 199,065 | |||||||||||||
MF RE |
— | — | — | — | 145,082 | 145,082 | |||||||||||||
CML & CRE |
726 | 45 | 181 | 952 | 82,736 | 83,688 | |||||||||||||
AG & AGRE |
363 | 100 | 35 | 498 | 44,274 | 44,772 | |||||||||||||
CON & MAR |
— | — | — | — | 7,859 | 7,859 | |||||||||||||
| | | | | | | | | | | | | | | | | | | | |
|
$ | 1,370 | $ | 145 | $ | 887 | $ | 2,402 | $ | 759,810 | $ | 762,212 | |||||||
| | | | | | | | | | | | | | | | | | | | |
| | | | | | | | | | | | | | | | | | | | |
| | | | | | | | | | | | | | | | | | | | |
A loan is considered impaired, in accordance with the impairment accounting guidance (ASC 310-10-35-16), when based on current information and events, it is probable the Company will be unable to collect all amounts due from the borrower in accordance with the contractual terms of the loan. Impaired loans include nonperforming commercial loans but also include loans modified in troubled debt restructurings.
The following tables present impaired loans and specific valuation allowance information based on class level as of June 30, 2017 and December 31, 2016 and 2015:
| |
June 30, 2017 | |||||||||||||||||||||
|---|---|---|---|---|---|---|---|---|---|---|---|---|---|---|---|---|---|---|---|---|---|---|
| |
MTG WHLOC |
RES RE | MF RE | CML & CRE |
AG & AGRE |
CON & MAR |
TOTAL | |||||||||||||||
| |
(In thousands) |
|||||||||||||||||||||
Impaired loans without a specific allowance: |
||||||||||||||||||||||
Recorded investment |
$ | — | $ | 301 | $ | — | $ | 3,162 | $ | — | $ | — | $ | 3,463 | ||||||||
Unpaid principal balance |
— | 301 | — | 3,162 | — | — | 3,463 | |||||||||||||||
Impaired loans with a specific allowance: |
||||||||||||||||||||||
Recorded investment |
— | — | — | — | 282 | — | 282 | |||||||||||||||
Unpaid principal balance |
— | — | — | — | 282 | — | 282 | |||||||||||||||
Specific allowance |
— | — | — | — | 16 | — | 16 | |||||||||||||||
Total impaired loans: |
||||||||||||||||||||||
Recorded investment |
— | 301 | — | 3,162 | 282 | — | 3,745 | |||||||||||||||
Unpaid principal balance |
— | 301 | — | 3,162 | 282 | — | 3,745 | |||||||||||||||
Specific allowance |
— | — | — | — | 16 | — | 16 | |||||||||||||||
F-26
Merchants Bancorp
Notes to Consolidated Financial Statements (Continued)
Six Months Ended June 30, 2017 and 2016 (unaudited) and
Years Ended December 31, 2016 and 2015
Note 4: Loans and Allowance for Loan Losses (Continued)
| |
December 31, 2016 | |||||||||||||||||||||
|---|---|---|---|---|---|---|---|---|---|---|---|---|---|---|---|---|---|---|---|---|---|---|
| |
WHLOC | RES RE | MF RE | CRE | AGRE | MAR | TOTAL | |||||||||||||||
| |
(In thousands) |
|||||||||||||||||||||
Impaired loans without a specific allowance: |
||||||||||||||||||||||
Recorded investment |
$ | — | $ | 280 | $ | — | $ | 5,022 | $ | — | $ | — | $ | 5,302 | ||||||||
Unpaid principal balance |
— | 280 | — | 5,022 | — | — | 5,302 | |||||||||||||||
Impaired loans with a specific allowance: |
||||||||||||||||||||||
Recorded investment |
— | 63 | — | — | 203 | — | 266 | |||||||||||||||
Unpaid principal balance |
— | 63 | — | — | 203 | — | 266 | |||||||||||||||
Specific allowance |
— | 30 | — | — | 11 | — | 41 | |||||||||||||||
Total impaired loans: |
||||||||||||||||||||||
Recorded investment |
— | 343 | — | 5,022 | 203 | — | 5,568 | |||||||||||||||
Unpaid principal balance |
— | 343 | — | 5,022 | 203 | — | 5,568 | |||||||||||||||
Specific allowance |
— | 30 | — | — | 11 | — | 41 | |||||||||||||||
| |
December 31, 2015 | |||||||||||||||||||||
|---|---|---|---|---|---|---|---|---|---|---|---|---|---|---|---|---|---|---|---|---|---|---|
| |
MTG WHLOC |
RES RE | MF RE | CML & CRE |
AG & AGRE |
CON & MAR |
TOTAL | |||||||||||||||
| |
(In thousands) |
|||||||||||||||||||||
Impaired loans without a specific allowance: |
||||||||||||||||||||||
Recorded investment |
$ | — | $ | — | $ | — | $ | — | $ | — | $ | — | $ | — | ||||||||
Unpaid principal balance |
— | — | — | — | — | — | — | |||||||||||||||
Impaired loans with a specific allowance: |
||||||||||||||||||||||
Recorded investment |
— | 66 | — | 181 | — | — | 247 | |||||||||||||||
Unpaid principal balance |
— | 66 | — | 181 | — | — | 247 | |||||||||||||||
Specific allowance |
— | 30 | — | 81 | — | — | 111 | |||||||||||||||
Total impaired loans: |
||||||||||||||||||||||
Recorded investment |
— | 66 | — | 181 | — | — | 247 | |||||||||||||||
Unpaid principal balance |
— | 66 | — | 181 | — | — | 247 | |||||||||||||||
Specific allowance |
— | 30 | — | 81 | — | — | 111 | |||||||||||||||
F-27
Merchants Bancorp
Notes to Consolidated Financial Statements (Continued)
Six Months Ended June 30, 2017 and 2016 (unaudited) and
Years Ended December 31, 2016 and 2015
Note 4: Loans and Allowance for Loan Losses (Continued)
The following tables present by portfolio class, information related to the average recorded investment and interest income recognized on impaired loans for the six month periods ended June 30, 2017 and 2016, and the years ended December 31, 2016 and 2015:
| |
June 30, 2017 | |||||||||||||||||||||
|---|---|---|---|---|---|---|---|---|---|---|---|---|---|---|---|---|---|---|---|---|---|---|
| |
MTG WHLOC | RES RE | MF RE | CML & CRE | AG & AGRE | CON & MAR | TOTAL | |||||||||||||||
| |
(In thousands) |
|||||||||||||||||||||
Average recorded investment in impaired loans |
$ | — | $ | 308 | $ | — | $ | 3,567 | $ | 282 | $ | — | $ | 4,157 | ||||||||
Interest income recognized |
— | — | — | 10 | — | — | 10 | |||||||||||||||
| |
June 30, 2016 | |||||||||||||||||||||
|---|---|---|---|---|---|---|---|---|---|---|---|---|---|---|---|---|---|---|---|---|---|---|
| |
MTG WHLOC | RES RE | MF RE | CML & CRE | AG & AGRE | CON & MAR | TOTAL | |||||||||||||||
| |
(In thousands) |
|||||||||||||||||||||
Average recorded investment in impaired loans |
$ | — | $ | 65 | $ | — | $ | 486 | $ | — | $ | — | $ | 551 | ||||||||
Interest income recognized |
— | — | — | 23 | — | — | 23 | |||||||||||||||
| |
December 31, 2016 | |||||||||||||||||||||
|---|---|---|---|---|---|---|---|---|---|---|---|---|---|---|---|---|---|---|---|---|---|---|
| |
MTG WHLOC |
RES RE | MF RE | CML & CRE |
AG & AGRE |
CON & MAR |
TOTAL | |||||||||||||||
| |
(In thousands) |
|||||||||||||||||||||
Average recorded investment in impaired loans |
$ | — | $ | 155 | $ | — | $ | 2,222 | $ | 17 | $ | — | $ | 2,394 | ||||||||
Interest income recognized |
— | — | — | 39 | — | — | 39 | |||||||||||||||
| |
December 31, 2015 | |||||||||||||||||||||
|---|---|---|---|---|---|---|---|---|---|---|---|---|---|---|---|---|---|---|---|---|---|---|
| |
MTG WHLOC |
RES RE | MF RE | CML & CRE |
AG & AGRE |
CON & MAR |
TOTAL | |||||||||||||||
| |
(In thousands) |
|||||||||||||||||||||
Average recorded investment in impaired loans |
$ | — | $ | 68 | $ | — | $ | 205 | — | $ | — | $ | 273 | |||||||||
Interest income recognized |
— | — | — | — | — | — | — | |||||||||||||||
F-28
Merchants Bancorp
Notes to Consolidated Financial Statements (Continued)
Six Months Ended June 30, 2017 and 2016 (unaudited) and
Years Ended December 31, 2016 and 2015
Note 4: Loans and Allowance for Loan Losses (Continued)
The following table presents the Company's nonaccrual loans and loans past due 90 days or more and still accruing at June 30, 2017 and December 31, 2016 and 2015.
| |
|
|
December 31, | ||||||||||||||||
|---|---|---|---|---|---|---|---|---|---|---|---|---|---|---|---|---|---|---|---|
| |
June 30, 2017 | 2016 | 2015 | ||||||||||||||||
| |
Nonaccrual | Total Loans > 90 Days & Accruing |
Nonaccrual | Total Loans > 90 Days & Accruing |
Nonaccrual | Total Loans > 90 Days & Accruing |
|||||||||||||
| |
(In thousands) |
||||||||||||||||||
MTG WHLOC |
$ | — | $ | — | $ | — | $ | — | $ | — | $ | — | |||||||
RES RE |
301 | — | 303 | 578 | 66 | 605 | |||||||||||||
MF RE |
— | — | — | — | — | — | |||||||||||||
CML & CRE |
627 | 2,009 | 899 | — | 181 | — | |||||||||||||
AG & AGRE |
282 | — | — | 107 | — | 35 | |||||||||||||
CON & MAR |
— | — | — | — | — | — | |||||||||||||
| | | | | | | | | | | | | | | | | | | | |
|
$ | 1,210 | $ | 2,009 | $ | 1,202 | $ | 685 | $ | 247 | $ | 640 | |||||||
| | | | | | | | | | | | | | | | | | | | |
| | | | | | | | | | | | | | | | | | | | |
| | | | | | | | | | | | | | | | | | | | |
There were no troubled debt restructurings at or during the six month periods ended June 30, 2017 and 2016, or during the years ended December 31, 2016 or 2015.
There were no residential loans in process of foreclosure at June 30, 2017 and December 31, 2016 and 2015.
Note 5: Premises and Equipment
Major classifications of premises and equipment, stated at cost, are as follows:
| |
|
December 31, | ||||||||
|---|---|---|---|---|---|---|---|---|---|---|
| |
June 30, 2017 |
|||||||||
| |
2016 | 2015 | ||||||||
| |
(In thousands) |
|||||||||
Land |
$ | 2,260 | $ | 2,260 | $ | 1,370 | ||||
Buildings |
3,140 | 3,140 | 3,118 | |||||||
Leasehold improvements |
71 | 71 | 71 | |||||||
Furniture, fixtures and equipment |
1,970 | 1,895 | 2,360 | |||||||
| | | | | | | | | | | |
Total cost |
7,441 | 7,366 | 6,919 | |||||||
Accumulated depreciation |
(2,646 | ) | (2,515 | ) | (2,947 | ) | ||||
| | | | | | | | | | | |
Net premises and equipment |
$ | 4,795 | $ | 4,851 | $ | 3,972 | ||||
| | | | | | | | | | | |
| | | | | | | | | | | |
| | | | | | | | | | | |
F-29
Merchants Bancorp
Notes to Consolidated Financial Statements (Continued)
Six Months Ended June 30, 2017 and 2016 (unaudited) and
Years Ended December 31, 2016 and 2015
Note 6: Loan Servicing
Mortgage loans serviced for others are not included in the accompanying consolidated balance sheets and represent agency eligible multi-family loans. The risks inherent in mortgage servicing assets relate primarily to changes in prepayments that result from shifts in mortgage interest rates. Call protection is in place to deter from prepayments on a 10-year sliding scale. The unpaid principal balances of mortgage and other loans serviced for others were $4.4 billion, $4.0 billion and $3.8 billion at June 30, 2017, December 31, 2016 and 2015, respectively. Mortgage loans sub-serviced for others are not included in the accompanying balance sheets. The unpaid principal balances of loans sub-serviced for others were $1.8 billion, $1.4 billion and $588.7 million at June 30, 2017, December 31, 2016 and 2015, respectively.
The following summarizes the activity in mortgage servicing rights measured using the fair value method for the six month periods ended June 30, 2017 and 2016, and the years ended December 31, 2016 and 2015:
| |
For the Six Months Ended June 30, |
For the Year Ended December 31, |
|||||||||||
|---|---|---|---|---|---|---|---|---|---|---|---|---|---|
| |
2017 | 2016 | 2016 | 2015 | |||||||||
| |
(In thousands) |
||||||||||||
Balance, beginning of period |
$ | 53,670 | $ | 55,553 | $ | 55,553 | $ | 52,913 | |||||
Additions |
|||||||||||||
Purchased servicing |
1,133 | 319 | 1,357 | 1,135 | |||||||||
Originated servicing |
4,836 | 970 | 4,388 | 6,866 | |||||||||
Subtractions |
|||||||||||||
Paydowns |
(2,730 | ) | (1,717 | ) | (4,230 | ) | (5,177 | ) | |||||
Changes in fair value due to changes in valuation inputs or assumptions used in the valuation model |
648 | 297 | (3,398 | ) | (184 | ) | |||||||
| | | | | | | | | | | | | | |
Balance, end of period |
$ | 57,557 | $ | 55,422 | $ | 53,670 | $ | 55,553 | |||||
| | | | | | | | | | | | | | |
| | | | | | | | | | | | | | |
| | | | | | | | | | | | | | |
Contractually specified servicing fees for retained, purchased and sub-serviced loans were $4.5 million and $3.5 million for the six month periods ended June 30, 2017 and 2016, respectively and $7.5 million and $6.2 million for the years ended December 31, 2016 and 2015, respectively.
In connection with certain loan servicing and sub-servicing agreements, P/RMIC is to reconcile the payments received monthly on these loans, for principal and interest, taxes, insurance, and reserves for replacements. The funds are required to be maintained in separate trust accounts and not commingled with P/RMIC's general operating funds. At June 30, 2017 and December 31, 2016 and 2015, P/RMIC held restricted escrow funds for these loans, amounting to $457.9 million, $378.5 million and $336.8 million, respectively.
F-30
Merchants Bancorp
Notes to Consolidated Financial Statements (Continued)
Six Months Ended June 30, 2017 and 2016 (unaudited) and
Years Ended December 31, 2016 and 2015
Note 7: Goodwill
There were no changes in the carrying amount of goodwill for the six months ended June 30, 2017 and 2016, or the years ended December 31, 2016 and 2015. The carrying amount of goodwill for these periods was as follows:
| |
June 30, | December 31, | |||||||||||
|---|---|---|---|---|---|---|---|---|---|---|---|---|---|
| |
2017 | 2016 | 2016 | 2015 | |||||||||
| |
(In thousands) |
||||||||||||
Balance, beginning of period |
$ | 523 | $ | 523 | $ | 523 | $ | 523 | |||||
Goodwill acquired during the period |
— | — | — | — | |||||||||
Impairment losses |
— | — | — | — | |||||||||
| | | | | | | | | | | | | | |
Balance, end of the period |
$ | 523 | $ | 523 | $ | 523 | $ | 523 | |||||
| | | | | | | | | | | | | | |
| | | | | | | | | | | | | | |
| | | | | | | | | | | | | | |
Goodwill is tested for impairment as of year-end, or more frequently if events and circumstances exist, that indicate a goodwill impairment test should be performed. Goodwill is attributed to the Banking segment. Based upon management's assessment and evaluation of goodwill at year-end, the likelihood that an impairment of the current carrying amount of goodwill has occurred is considered remote.
Note 8: Other Assets and Receivables
The following items are included in other assets and receivables in the consolidated balance sheets.
Investment in Qualified Affordable Housing Limited Partnerships
The Company invests in qualified affordable housing limited partnerships. At June 30, 2017 and December 31, 2016 and 2015, the balance of the investments for qualified affordable housing limited partnerships was $14.7 million, $12.9 million and $1.7 million, respectively. The Company expects to contribute an additional $4.1 million related to the partnerships outstanding at June 30, 2017 and December 31, 2016; however, the Company is not obligated to contribute additional capital at those dates, as such payments are based on certain development, operational and/or tax credit benchmarks. During the years ended December 31, 2016 and 2015, the Company did not record amortization expense, tax credits or other benefits related to these investments. The Company expects to receive tax credits and other benefits beginning in 2017 and will begin amortization based on the proportional amortization method.
Other Receivables
At June 30, 2017, the Company had short-term receivables of $1.4 million, consisting primarily of prepaid escrow amounts. These receivables were collected in July and August 2017. At December 31, 2016 and 2015, the Company had short-term receivables of $14.1 million and $2.5 million, respectively. These receivables primarily represented prepaid trading and settlement fees paid to a third-party broker that were collected at the time of applicable GNMA security settlements with the remaining amounts collected in the normal course of business.
Other items included in other assets and receivables on the balance sheet are not significant.
F-31
Merchants Bancorp
Notes to Consolidated Financial Statements (Continued)
Six Months Ended June 30, 2017 and 2016 (unaudited) and
Years Ended December 31, 2016 and 2015
Note 9: Deposits
Deposits were comprised of the following at June 30, 2017 and December 31, 2016 and 2015:
| |
|
December 31, | ||||||||
|---|---|---|---|---|---|---|---|---|---|---|
| |
June 30, 2017 |
|||||||||
| |
2016 | 2015 | ||||||||
| |
(In thousands) |
|||||||||
Demand deposits |
$ | 1,206,450 | $ | 1,067,771 | $ | 773,234 | ||||
Savings deposits |
1,248,023 | 1,194,607 | 862,839 | |||||||
Certificates of deposit |
317,028 | 166,243 | 403,447 | |||||||
| | | | | | | | | | | |
Total deposits |
$ | 2,771,501 | $ | 2,428,621 | $ | 2,039,520 | ||||
| | | | | | | | | | | |
| | | | | | | | | | | |
| | | | | | | | | | | |
At June 30, 2017 and December 31, 2016, the scheduled maturities of time deposits are as follows:
| |
June 30, 2017 |
December 31, 2016 | |||||
|---|---|---|---|---|---|---|---|
| |
(In thousands) |
||||||
Due within one year |
$ | 315,029 | $ | 164,467 | |||
Due in one year to two years |
664 | 627 | |||||
Due in two years to three years |
536 | 365 | |||||
Due in three years to four years |
104 | 10 | |||||
Due in four years to five years |
695 | 774 | |||||
| | | | | | | | |
|
$ | 317,028 | $ | 166,243 | |||
| | | | | | | | |
| | | | | | | | |
| | | | | | | | |
Certificates of deposit of $250,000 or more totaled $56.0 million at June 30, 2017, $27.8 million at December 31, 2016 and $22.9 million at December 31, 2015.
Brokered deposit amounts at June 30, 2017 and December 31, 2016 and 2015, were as follows:
| |
|
December 31, | ||||||||
|---|---|---|---|---|---|---|---|---|---|---|
| |
June 30, 2017 |
|||||||||
| |
2016 | 2015 | ||||||||
| |
(In thousands) |
|||||||||
Brokered certificates of deposit |
$ | 254,704 | $ | 127,000 | $ | 367,198 | ||||
Brokered savings deposits |
411,960 | 450,570 | 170,806 | |||||||
Brokered deposit on demand accounts |
20,646 | 60,509 | — | |||||||
| | | | | | | | | | | |
|
$ | 687,310 | $ | 638,079 | $ | 538,004 | ||||
| | | | | | | | | | | |
| | | | | | | | | | | |
| | | | | | | | | | | |
Note 10: Borrowings
Borrowings were comprised of the following at June 30, 2017, December 31, 2016 and 2015:
| |
|
December 31, | ||||||||
|---|---|---|---|---|---|---|---|---|---|---|
| |
June 30, 2017 |
|||||||||
| |
2016 | 2015 | ||||||||
| |
(In thousands) |
|||||||||
Line of credit |
$ | 25,000 | $ | 25,000 | $ | 25,000 | ||||
Short-term subordinated debt |
30,000 | 30,000 | 30,000 | |||||||
FHLB advances |
1,633 | 2,006 | 2,490 | |||||||
| | | | | | | | | | | |
Total borrowings |
$ | 56,633 | $ | 57,006 | $ | 57,490 | ||||
| | | | | | | | | | | |
| | | | | | | | | | | |
| | | | | | | | | | | |
F-32
Merchants Bancorp
Notes to Consolidated Financial Statements (Continued)
Six Months Ended June 30, 2017 and 2016 (unaudited) and
Years Ended December 31, 2016 and 2015
Note 10: Borrowings (Continued)
The Company has a revolving line of credit ("LOC") with a bank for up to $25.0 million with an outstanding balance at both June 30, 2017 and December 31, 2016 of $25.0 million. The interest rate on the note is LIBOR Rate plus 1.85%, or 3.07% at June 30, 2017 and 2.485% at December 31, 2016. The LOC is collateralized by a pledge and first lien security interest in and to all of the issued and outstanding common stock of Merchants Bank of Indiana, the 100% owned subsidiary of the Company. The agreement also requires the Bank to maintain at all times a Tier 1 Leverage Ratio of not less than 8% and is tested on a quarterly basis. The LOC was amended effective June 2, 2017, which extended the maturity date to June 1, 2018.
The Company entered into an agreement with Stonegate (a significant customer of the Bank) on April 15, 2014 and amended on September 25, 2014. Stonegate agreed to invest up to $30.0 million in the Company's subordinated debt. The Company, in turn, agreed to form and fund NMF, a wholly owned subsidiary of the Bank, and the Bank pledged 100% of the shares of NMF stock to Stonegate in consideration for Stonegate's investment in the Company's subordinated debt, with the shares serving as the sole collateral for such debt. The subordinated debt balance as of both June 30, 2017 and December 31, 2016 was $30.0 million, with a maturity date of March 31, 2018. Interest on the debt is paid quarterly at a rate equal to one-month LIBOR, plus 350 basis points, plus additional interest equal to 49% of the earnings of NMF. Stonegate was acquired by Home Point Financial Corporation effective May 31, 2017.
FHLB advances are secured by mortgage loans totaling $62.2 million, $64.3 million and $62.0 million at June 30, 2017, December 31, 2016 and 2015, respectively. In addition, available for sale securities and securities purchased under agreements to resell with a carrying value of $382.6 million, $320.1 million and $249.5 million were pledged as of June 30, 2017 and December 31, 2016 and 2015, respectively. At June 30, 2017, the FHLB advances had interest rates ranging from 2.27% to 4.74%, and at December 31, 2016, the FHLB advances had interest rates ranging from 2.00% to 4.74%, and were subject to restrictions or penalties in the event of prepayment.
Maturities of FHLB advances were as follows at June 30, 2017 and December 31, 2016:
| |
June 30, 2017 |
December 31, 2016 |
|||||
|---|---|---|---|---|---|---|---|
| |
(In thousands) |
||||||
Due within one year |
$ | 412 | $ | 394 | |||
Due in one year to two years |
304 | 417 | |||||
Due in two years to three years |
54 | 305 | |||||
Due in three years to four years |
56 | 55 | |||||
Due in four years to five years |
58 | — | |||||
Thereafter |
749 | 835 | |||||
| | | | | | | | |
|
$ | 1,633 | $ | 2,006 | |||
| | | | | | | | |
| | | | | | | | |
| | | | | | | | |
F-33
Merchants Bancorp
Notes to Consolidated Financial Statements (Continued)
Six Months Ended June 30, 2017 and 2016 (unaudited) and
Years Ended December 31, 2016 and 2015
Note 11: Income Taxes
The provision for income taxes includes these components for the six month periods ended June 30, 2017 and 2016 and the years ended December 31, 2016 and 2015:
| |
Six Months Ended June 30, |
Year Ended December 31, |
|||||||||||
|---|---|---|---|---|---|---|---|---|---|---|---|---|---|
| |
2017 | 2016 | 2016 | 2015 | |||||||||
| |
(In thousands) |
||||||||||||
Income tax expense |
|||||||||||||
Current tax payable |
|||||||||||||
Federal |
$ | 11,231 | $ | 7,043 | $ | 18,627 | $ | 15,022 | |||||
State |
1,634 | 1,838 | 4,477 | 3,293 | |||||||||
Deferred tax payable |
|||||||||||||
Federal |
1,628 | (19 | ) | (441 | ) | 604 | |||||||
State |
209 | (509 | ) | (995 | ) | (121 | ) | ||||||
| | | | | | | | | | | | | | |
Income tax expense |
$ | 14,702 | $ | 8,353 | $ | 21,668 | $ | 18,798 | |||||
| | | | | | | | | | | | | | |
| | | | | | | | | | | | | | |
| | | | | | | | | | | | | | |
Effective tax rate |
38.1 | % | 39.5 | % | 39.5 | % | 39.8 | % | |||||
| | | | | | | | | | | | | | |
| | | | | | | | | | | | | | |
| | | | | | | | | | | | | | |
A reconciliation of income tax expense at the statutory rate to the Company's actual income tax expense for the six month periods ended June 30, 2017 and 2016, and the years ended December 31, 2016 and 2015, is shown below:
| |
Six Months Ended June 30, |
Year Ended December 31, |
|||||||||||
|---|---|---|---|---|---|---|---|---|---|---|---|---|---|
| |
2017 | 2016 | 2016 | 2015 | |||||||||
| |
(In thousands) |
||||||||||||
Computed at the statutory rate (35%) |
$ | 13,507 | $ | 7,394 | $ | 19,178 | $ | 16,513 | |||||
Increase resulting from |
|||||||||||||
State income taxes |
1,195 | 864 | 2,264 | 2,062 | |||||||||
Other |
— | 95 | 226 | 223 | |||||||||
| | | | | | | | | | | | | | |
Actual tax expense |
$ | 14,702 | $ | 8,353 | $ | 21,668 | $ | 18,798 | |||||
| | | | | | | | | | | | | | |
| | | | | | | | | | | | | | |
| | | | | | | | | | | | | | |
F-34
Merchants Bancorp
Notes to Consolidated Financial Statements (Continued)
Six Months Ended June 30, 2017 and 2016 (unaudited) and
Years Ended December 31, 2016 and 2015
Note 11: Income Taxes (Continued)
The tax effects of temporary differences related to deferred taxes shown on the balance sheet were:
| |
|
December 31, | ||||||||
|---|---|---|---|---|---|---|---|---|---|---|
| |
June 30, 2017 |
|||||||||
| |
2016 | 2015 | ||||||||
| |
(In thousands) |
|||||||||
Deferred tax assets |
||||||||||
Allowance for loan losses |
$ | 2,701 | $ | 2,482 | $ | 2,287 | ||||
Unrealized loss on available-for-sale securities |
379 | 429 | 157 | |||||||
State tax |
290 | 330 | 907 | |||||||
Other |
210 | 470 | 368 | |||||||
| | | | | | | | | | | |
Total assets |
3,580 | 3,711 | 3,719 | |||||||
| | | | | | | | | | | |
Deferred tax liabilities |
||||||||||
Depreciation |
(304 | ) | (272 | ) | (247 | ) | ||||
Mortgage-servicing rights |
(20,610 | ) | (19,009 | ) | (20,736 | ) | ||||
Other |
(160 | ) | (37 | ) | (51 | ) | ||||
| | | | | | | | | | | |
Total liabilities |
(21,074 | ) | (19,318 | ) | (21,034 | ) | ||||
| | | | | | | | | | | |
Net deferred tax liability |
$ | (17,494 | ) | $ | (15,607 | ) | $ | (17,315 | ) | |
| | | | | | | | | | | |
| | | | | | | | | | | |
| | | | | | | | | | | |
Note 12: Regulatory Matters
The Company and Bank are subject to various regulatory capital requirements administered by the federal banking agencies. Failure to meet minimum capital requirements can initiate certain mandatory, and possibly additional discretionary, actions by federal and state banking regulators that, if undertaken, could have a direct material effect on the Company's financial statements. Under capital adequacy guidelines and the regulatory framework for prompt corrective action, the Company and Bank must meet specific capital guidelines that involve quantitative measures of the Company's and Bank's assets, liabilities and certain off-balance-sheet items as calculated under regulatory accounting practices. The Company's and Bank's capital amounts and classification are also subject to qualitative judgments by the regulators about components, risk weightings and other factors. Furthermore, the Company's and Bank's regulators could require adjustments to regulatory capital not reflected in these financial statements.
Quantitative measures established by regulation to ensure capital adequacy require the Company and Bank to maintain minimum amounts and ratios (set forth in the table below). Management believes, as of June 30, 2017 and December 31, 2016 and 2015, that the Company and Bank met all capital adequacy requirements to which they were subject.
As of June 30, 2017 and December 31, 2016, the most recent notifications from the Federal Reserve Board and the Federal Deposit Insurance Corporation categorized the Company as well capitalized and Bank as well capitalized under the regulatory framework for prompt corrective action, respectively. To be categorized as well capitalized, the Company must maintain minimum total risk-based, Tier I risk-based and Tier I leverage ratios as set forth in the table. There are no conditions
F-35
Merchants Bancorp
Notes to Consolidated Financial Statements (Continued)
Six Months Ended June 30, 2017 and 2016 (unaudited) and
Years Ended December 31, 2016 and 2015
Note 12: Regulatory Matters (Continued)
or events since that notification that management believes have changed the Company's and Bank's category.
The Company's and Bank's actual capital amounts and ratios are also presented in the following tables.
| |
Actual | Minimum Amount Required for Adequately Capitalized(1) |
Minimum Amount To Be Well Capitalized(1) |
||||||||||||||||
|---|---|---|---|---|---|---|---|---|---|---|---|---|---|---|---|---|---|---|---|
| |
Amount | Ratio | Amount | Ratio | Amount | Ratio | |||||||||||||
| |
(Dollars in thousands) |
||||||||||||||||||
June 30, 2017 |
|||||||||||||||||||
Total capital(1) (to risk-weighted assets) |
|||||||||||||||||||
Company |
$ | 217,887 | 9.6 | % | $ | 182,382 | 8.0 | % | $ | — | N/A | ||||||||
Bank |
273,944 | 12.0 | % | 182,304 | 8.0 | % | 227,880 | 10.0 | % | ||||||||||
Tier 1 capital(1) (to risk-weighted assets) |
|||||||||||||||||||
Company |
210,964 | 9.3 | % | 136,787 | 6.0 | % | — | N/A | |||||||||||
Bank |
267,021 | 11.7 | % | 136,728 | 6.0 | % | 182,304 | 8.0 | % | ||||||||||
Common Equity Tier 1 capital(1) |
|||||||||||||||||||
Company |
169,383 | 7.4 | % | 102,590 | 4.5 | % | — | N/A | |||||||||||
Bank |
267,021 | 11.7 | % | 102,546 | 4.5 | % | 148,122 | 6.5 | % | ||||||||||
Tier 1 capital(1) (to average assets) |
|||||||||||||||||||
Company |
210,964 | 7.4 | % | 114,085 | 4.0 | % | — | N/A | |||||||||||
Bank |
267,021 | 9.3 | % | 114,376 | 4.0 | % | 142,970 | 5.0 | % | ||||||||||
- (1)
- As defined by regulatory agencies.
F-36
Merchants Bancorp
Notes to Consolidated Financial Statements (Continued)
Six Months Ended June 30, 2017 and 2016 (unaudited) and
Years Ended December 31, 2016 and 2015
Note 12: Regulatory Matters (Continued)
| |
Actual | Minimum Amount Required for Adequately Capitalized(1) |
Minimum Amount To Be Well Capitalized(1) |
||||||||||||||||
|---|---|---|---|---|---|---|---|---|---|---|---|---|---|---|---|---|---|---|---|
| |
Amount | Ratio | Amount | Ratio | Amount | Ratio | |||||||||||||
| |
(Dollars in thousands) |
||||||||||||||||||
December 31, 2016 |
|||||||||||||||||||
Total capital(1) (to risk-weighted assets) |
|||||||||||||||||||
Company |
$ | 201,496 | 10.6 | % | $ | 151,459 | 8.0 | % | $ | — | N/A | ||||||||
Bank |
255,539 | 13.5 | % | 151,332 | 8.0 | % | 189,165 | 10.0 | % | ||||||||||
Tier I capital(1) (to risk-weighted assets) |
|||||||||||||||||||
Company |
195,188 | 10.3 | % | 113,594 | 6.0 | % | — | N/A | |||||||||||
Bank |
249,231 | 13.2 | % | 113,499 | 6.0 | % | 151,332 | 8.0 | % | ||||||||||
Common Equity Tier I capital(1) |
|||||||||||||||||||
Company |
153,607 | 8.1 | % | 85,196 | 4.5 | % | — | N/A | |||||||||||
Bank |
249,231 | 13.2 | % | 85,124 | 4.5 | % | 122,957 | 6.5 | % | ||||||||||
Tier I capital(1) (to average assets) |
|||||||||||||||||||
Company |
195,188 | 6.6 | % | 118,082 | 4.0 | % | — | N/A | |||||||||||
Bank |
249,231 | 8.4 | % | 118,258 | 4.0 | % | 147,822 | 5.0 | % | ||||||||||
- (1)
- As defined by regulatory agencies.
F-37
Merchants Bancorp
Notes to Consolidated Financial Statements (Continued)
Six Months Ended June 30, 2017 and 2016 (unaudited) and
Years Ended December 31, 2016 and 2015
Note 12: Regulatory Matters (Continued)
| |
Actual | Minimum Amount Required for Adequately Capitalized(1) |
Minimum Amount To Be Well Capitalized(1) |
||||||||||||||||
|---|---|---|---|---|---|---|---|---|---|---|---|---|---|---|---|---|---|---|---|
| |
Amount | Ratio | Amount | Ratio | Amount | Ratio | |||||||||||||
| |
(Dollars in thousands) |
||||||||||||||||||
December 31, 2015 |
|||||||||||||||||||
Total capital(1) (to risk-weighted assets) |
|||||||||||||||||||
Company |
$ | 144,819 | 9.6 | % | $ | 121,176 | 8.0 | % | $ | — | N/A | ||||||||
Bank |
200,667 | 13.3 | % | 121,135 | 8.0 | % | 151,418 | 10.0 | % | ||||||||||
Tier I capital(1) (to risk-weighted assets) |
|||||||||||||||||||
Company |
139,339 | 9.2 | % | 90,882 | 6.0 | % | — | N/A | |||||||||||
Bank |
195,187 | 12.9 | % | 90,851 | 6.0 | % | 121,135 | 8.0 | % | ||||||||||
Common Equity Tier I capital(1) |
|||||||||||||||||||
Company |
129,339 | 8.5 | % | 68,161 | 4.5 | % | — | N/A | |||||||||||
Bank |
195,187 | 12.9 | % | 68,138 | 4.5 | % | 98,422 | 6.5 | % | ||||||||||
Tier I capital(1) (to average assets) |
|||||||||||||||||||
Company |
139,339 | 6.1 | % | 91,531 | 4.0 | % | — | N/A | |||||||||||
Bank |
195,187 | 8.5 | % | 91,599 | 4.0 | % | 114,498 | 5.0 | % | ||||||||||
- (1)
- As defined by regulatory agencies.
Beginning January 1, 2015, a new Basel III Capital Rule applied to the Bank. The following table lists the capital categories and ratios determined by the Board of Governors of the Federal Reserve System and the Federal Deposit Insurance Corporation.
Capital Category
|
Total Risk-based Capital ratio |
Tier 1 Risk-based Capital ratio |
Common Equity Tier 1 Risk-based Capital ratio |
Tier 1 Leverage ratio |
|||||||||
|---|---|---|---|---|---|---|---|---|---|---|---|---|---|
Well capitalized |
10 | % | 8 | % | 6.5 | % | 5 | % | |||||
Adequately capitalized |
8 | 6 | 4.5 | 4 | |||||||||
Undercapitalized |
< 8 | < 6 | < 4.5 | < 4 | |||||||||
Significantly undercapitalized |
< 6 | < 4 | < 3 | < 3 | |||||||||
Critically undercapitalized |
Tangible Equity/Total Assets </= 2 | % | |||||||||||
The Basel III Capital Rules, among other things, (i) introduced a new capital measure called "Common Equity Tier 1" (CET1), (ii) specified that Tier 1 capital consist of CET1 and "Additional Tier 1 Capital" instruments meeting specified requirements, (iii) defined CET1 narrowly by requiring that most deductions/adjustments to regulatory capital measures be made to CET1 and not to the other components of capital and (iv) expanded the scope of the deductions/adjustments as compared to existing regulations.
F-38
Merchants Bancorp
Notes to Consolidated Financial Statements (Continued)
Six Months Ended June 30, 2017 and 2016 (unaudited) and
Years Ended December 31, 2016 and 2015
Note 12: Regulatory Matters (Continued)
Implementation of the deductions and other adjustments to CET1 began on January 1, 2015, and are being phased in over a four-year period (beginning at 40% on January 1, 2015, and an additional 20% per year thereafter). Under the new rule, in order to avoid limitations on capital distributions, including dividend payments and certain discretionary bonus payments to executive officers, a banking organization must hold a capital conservation buffer composed of CET1 capital above its minimum risk-based capital requirements. The implementation of the capital conservation buffer began on January 1, 2016, at the 0.625% level and is being phased in over a four-year period (increasing by that amount on each subsequent January 1 until it reaches 2.5% on January 1, 2019).
The Company's principal source of funds for dividend payments to shareholders is dividends received from the Bank. Banking regulations limit the maximum amount of dividends that a bank may pay without requesting prior approval of regulatory agencies. Under these regulations, the amount of dividends that may be paid in any calendar year is limited to the Bank's retained net income (as defined) for the current year plus those for the previous two years, subject to the capital requirements described above. At June 30, 2017 and December 31, 2016, the amount available, without prior regulatory approval, for dividends from the Bank was $64.8 million and $44.5 million, respectively.
Note 13: Earnings Per Share
Earnings per share were computed as follows for the six month periods ended June 30, 2017 and 2016, and the years ended December 31, 2016 and 2015.
| |
Six Month Periods Ended June 30, | ||||||||||||||||||
|---|---|---|---|---|---|---|---|---|---|---|---|---|---|---|---|---|---|---|---|
| |
2017 | 2016 | |||||||||||||||||
| |
Net Income |
Weighted- Average Shares |
Per Share Amount |
Net Income |
Weighted- Average Shares |
Per Share Amount |
|||||||||||||
| |
(In thousands) |
|
|
(In thousands) |
|
|
|||||||||||||
Net income |
$ | 23,888 | $ | 12,774 | |||||||||||||||
Dividends on preferred stock |
(1,665 | ) | (407 | ) | |||||||||||||||
| | | | | | | | | | | | | | | | | | | | |
Net income allocated to common shareholders |
$ | 22,223 | $ | 12,367 | |||||||||||||||
| | | | | | | | | | | | | | | | | | | | |
| | | | | | | | | | | | | | | | | | | | |
| | | | | | | | | | | | | | | | | | | | |
Basic earnings per share |
21,114,400 | $ | 1.05 | 21,111,200 | $ | 0.59 | |||||||||||||
| | | | | | | | | | | | | | | | | | | | |
| | | | | | | | | | | | | | | | | | | | |
| | | | | | | | | | | | | | | | | | | | |
Effect of dilutive securities—restricted stock awards |
5,011 | 1,083 | |||||||||||||||||
| | | | | | | | | | | | | | | | | | | | |
Diluted earnings per share |
21,119,411 | $ | 1.05 | 21,112,283 | $ | 0.59 | |||||||||||||
| | | | | | | | | | | | | | | | | | | | |
| | | | | | | | | | | | | | | | | | | | |
| | | | | | | | | | | | | | | | | | | | |
F-39
Merchants Bancorp
Notes to Consolidated Financial Statements (Continued)
Six Months Ended June 30, 2017 and 2016 (unaudited) and
Years Ended December 31, 2016 and 2015
Note 13: Earnings Per Share (Continued)
| |
Year Ended December 31, | ||||||||||||||||||
|---|---|---|---|---|---|---|---|---|---|---|---|---|---|---|---|---|---|---|---|
| |
2016 | 2015 | |||||||||||||||||
| |
Net Income |
Weighted- Average Shares |
Per Share Amount |
Net Income |
Weighted- Average Shares |
Per Share Amount |
|||||||||||||
| |
(In thousands) |
|
|
(In thousands) |
|
|
|||||||||||||
Net income |
$ | 33,127 | $ | 28,383 | |||||||||||||||
Dividends on preferred stock |
(2,002 | ) | — | ||||||||||||||||
| | | | | | | | | | | | | | | | | | | | |
Net income allocated to common shareholders |
$ | 31,125 | $ | 28,383 | |||||||||||||||
| | | | | | | | | | | | | | | | | | | | |
| | | | | | | | | | | | | | | | | | | | |
| | | | | | | | | | | | | | | | | | | | |
Basic earnings per share |
21,111,208 | $ | 1.47 | 21,075,475 | $ | 1.35 | |||||||||||||
| | | | | | | | | | | | | | | | | | | | |
| | | | | | | | | | | | | | | | | | | | |
| | | | | | | | | | | | | | | | | | | | |
Effect of dilutive securities—restricted stock awards |
2,227 | — | |||||||||||||||||
| | | | | | | | | | | | | | | | | | | | |
Diluted earnings per share |
21,113,435 | $ | 1.47 | 21,075,475 | $ | 1.35 | |||||||||||||
| | | | | | | | | | | | | | | | | | | | |
| | | | | | | | | | | | | | | | | | | | |
| | | | | | | | | | | | | | | | | | | | |
Note 14: Stock Splits
On July 5, 2017, the Company approved an increase of authorized common shares to 50.0 million shares, and declared a 2.5-for-1 stock split effective July 6, 2017. In February 2016, the Company declared a 2-for-1 stock split effective March 31, 2016. The presentation of authorized common shares has been retrospectively adjusted to give effect to the increase, and all share and per share amounts have been retrospectively adjusted to give effect to these splits.
Note 15: Private Placement Common Stock Offering
On February 2, 2015, the Company issued 407,500 shares of its common stock. Gross proceeds to the Company from the offering were $4.1 million, and net proceeds after offering expenses were $3.9 million.
Note 16: Private Placement Offering of Preferred Stock
During 2016 the Company issued 31,625 shares of non-cumulative, perpetual preferred stock at $1,000 per share for a total of $31.6 million and net proceeds after offering expenses were $31.6 million. During the fourth quarter of 2015, the Company issued 10,000 shares of non-cumulative, perpetual preferred stock to certain related parties at $1,000 per share for a total of $10.0 million. All preferred shares are non-voting. The preferred shares have an 8% yield and dividends are payable quarterly.
Note 17: Related Party Transactions
The Company has entered into transactions with certain directors, executive officers and their affiliates or associates (related parties). Such transactions were made in the ordinary course of business on substantially the same terms and conditions, including interest rates and collateral, as those
F-40
Merchants Bancorp
Notes to Consolidated Financial Statements (Continued)
Six Months Ended June 30, 2017 and 2016 (unaudited) and
Years Ended December 31, 2016 and 2015
Note 17: Related Party Transactions (Continued)
prevailing at the same time for comparable transactions with other customers, and did not, in the opinion of management, involve more than normal credit risk or present other unfavorable features.
Deposits from related parties held by the Company at June 30, 2017, December 31, 2016 and 2015 totaled $5.9 million, $7.5 million and $7.1 million, respectively.
In 2016, the Company purchased a 30% ownership in one of its key loan processing vendors. The investment is accounted for using the equity method of accounting. Fees paid to this company during the six months ended June 30, 2017 and the year ended December 31, 2016 were $1.8 million and $3.7 million. At June 30, 2017 and December 31, 2016, $330,000 and $353,000 was accrued for services received.
The Company retained a law firm of which a Board member of the Bank, and previously the Company through July 5, 2017, is a partner. Services rendered are primarily related to documentation of current loan originations, and loan collections from the Bank's borrowers. Fees paid to the law firm totaled $1.4 million and $789,000 for the six months ended June 30, 2017 and 2016, and $2.1 million and $1.9 million for the years ended December 31, 2016 and 2015, respectively.
On May 8, 2017, the Company entered into a stock purchase agreement to acquire Joy State Bank ("JSB") from the Chairman/Chief Executive Officer and the President/Chief Operating Officer of the Company. At June 30, 2017, JSB had total assets of $42.6 million. On October 31, 2016, the Bank had entered into an Agreement and Plan of Merger to acquire JSB. Because the timing and regulatory approval of the transaction was uncertain due to the Company's capital position at September 30, 2016, the parties agreed that Messrs. Petrie and Rogers, two of the Company's directors and executive officers, would acquire JSB. The acquisition of JSB by the Messrs. Petrie and Rogers closed on April 3, 2017. The May 8, 2017, stock purchase agreement provides for the Bank to pay a purchase price equal to approximately $5.4 million plus an approximate cost of funds of $16,000 for each 30 days after June 30, 2017, prorated to the closing date. The purchase price is equal to the price paid by Messrs. Petrie and Rogers, plus expenses and a cost of funds equal to 3.75%. The acquisition is subject to approval of the Federal Reserve Bank of Chicago, which approval has been obtained, and the Illinois Department of Financial and Professional Regulation, Division of Banking, which is pending. The acquisition is expected to close in the first quarter of 2018.
Note 18: Employee Benefits
Effective January 1, 2016, the Company discontinued its SIMPLE IRA plan and began offering a 401(k) plan. Pursuant to the plan agreement, matching contributions equal to 100% of the employees' elective deferrals which do not exceed 3% of the employees' compensation will be made unless management elects to make either the alternative matching contribution or the non-elective contribution. Employer contributions to the plans were $157,000 and $124,000 for the six month periods ended June 30, 2017 and 2016, and $245,000 and $178,000 for the years ended December 31, 2016 and 2015, respectively.
F-41
Merchants Bancorp
Notes to Consolidated Financial Statements (Continued)
Six Months Ended June 30, 2017 and 2016 (unaudited) and
Years Ended December 31, 2016 and 2015
Note 19: Share-Based Payment Plan
During 2016, the Board of Directors adopted an incentive restricted stock plan for certain executive officers of the Company. Awards may be earned subject to certain performance metrics and the participating executive officer may elect annually to receive the plan benefit in the form of Company common shares or a combination of 50% each of common shares and cash. During March 2017, the Company issued 3,200 shares pursuant to the plan. Expense recognized for the plan totaled $70,000 for the six months ended June 30, 2017 and $57,000 for the year ended December 31, 2016. No expense was recognized for the plan during the six months ended June 30, 2016. At both June 30, 2017 and December 31, 2016, there were 17,910 unvested shares awarded under the plan. Unrecognized compensation cost totaled $216,000 and $286,000 at June 30, 2017 and December 31, 2016, respectively.
Note 20: Disclosures About Fair Value of Assets and Liabilities
Fair value is the price that would be received to sell an asset or paid to transfer a liability in an orderly transaction between market participants at the measurement date. Fair value measurements must maximize the use of observable inputs and minimize the use of unobservable inputs. There is a hierarchy of three levels of inputs that may be used to measure fair value:
| Level 1 | Quoted prices in active markets for identical assets or liabilities | ||
Level 2 |
Observable inputs other than Level 1 prices, such as quoted prices for similar assets or liabilities; quoted prices in markets that are not active; or other inputs that are observable or can be corroborated by observable market data for substantially the full term of the assets or liabilities |
||
Level 3 |
Unobservable inputs supported by little or no market activity and are significant to the fair value of the assets or liabilities |
F-42
Merchants Bancorp
Notes to Consolidated Financial Statements (Continued)
Six Months Ended June 30, 2017 and 2016 (unaudited) and
Years Ended December 31, 2016 and 2015
Note 20: Disclosures About Fair Value of Assets and Liabilities (Continued)
Recurring Measurements
The following tables present the fair value measurements of assets recognized in the accompanying balance sheets measured at fair value on a recurring basis and the level within the fair value hierarchy in which the fair value measurements fall at June 30, 2017 and December 31, 2016 and 2015:
| |
Fair Value Measurements Using | ||||||||||||
|---|---|---|---|---|---|---|---|---|---|---|---|---|---|
Assets
|
Fair Value | Quoted Prices in Active Markets for Identical Assets (Level 1) |
Significant Other Observable Inputs (Level 2) |
Significant Unobservable Inputs (Level 3) |
|||||||||
| |
(In thousands) |
||||||||||||
June 30, 2017 |
|||||||||||||
Trading Securities |
$ | 145,056 | $ | — | $ | 145,056 | $ | — | |||||
Available-for-sale securities: |
|||||||||||||
Treasury notes |
1,000 | 1,000 | — | — | |||||||||
Federal agencies |
351,122 | — | 351,122 | — | |||||||||
Mortgage-backed—Government-sponsored entity (GSE)—residential |
26,173 | — | 26,173 | — | |||||||||
Mortgage servicing rights |
57,557 | — | — | 57,557 | |||||||||
December 31, 2016 |
|||||||||||||
Trading securities |
$ | 137,675 | $ | — | $ | 137,675 | $ | — | |||||
Available-for-sale securities: |
|||||||||||||
Treasury notes |
999 | 999 | — | — | |||||||||
Federal agencies |
288,993 | — | 288,993 | — | |||||||||
Municipals |
9,500 | 9,500 | |||||||||||
Mortgage-backed—Government-sponsored entity (GSE)—residential |
26,382 | — | 26,382 | — | |||||||||
Mortgage servicing rights |
53,670 | — | — | 53,670 | |||||||||
December 31, 2015 |
|||||||||||||
Trading securities |
$ | 107,869 | $ | — | $ | 107,869 | $ | — | |||||
Available-for-sale securities: |
|||||||||||||
Treasury notes |
992 | 992 | — | — | |||||||||
Federal agencies |
208,078 | — | 208,078 | — | |||||||||
Municipals |
9,500 | 9,500 | |||||||||||
Mortgage-backed—Government-sponsored entity (GSE)—residential |
33,886 | — | 35,886 | — | |||||||||
Mortgage servicing rights |
55,553 | — | — | 55,553 | |||||||||
Following is a description of the valuation methodologies and inputs used for assets measured at fair value on a recurring basis and recognized in the accompanying balance sheets, as well as the general classification of such assets pursuant to the valuation hierarchy. There have been no significant changes in the valuation techniques during the six months ended June 30, 2017 and the years ended
F-43
Merchants Bancorp
Notes to Consolidated Financial Statements (Continued)
Six Months Ended June 30, 2017 and 2016 (unaudited) and
Years Ended December 31, 2016 and 2015
Note 20: Disclosures About Fair Value of Assets and Liabilities (Continued)
December 31, 2016 and 2015. For assets classified within Level 3 of the fair value hierarchy, the process used to develop the reported fair value is described below.
Trading and Available-for-Sale Securities
Where quoted market prices are available in an active market, securities are classified within Level 1 of the valuation hierarchy. If quoted market prices are not available, then fair values are estimated by using quoted prices of securities with similar characteristics or independent asset pricing services and pricing models, the inputs of which are market-based or independently sourced market parameters, including, but not limited to, yield curves, interest rates, volatilities, prepayments, defaults, cumulative loss projections and cash flows. Such securities are classified in Level 2 of the valuation hierarchy including federal agencies, mortgage-backed securities, and FHA participation certificates. In certain cases where Level 1 or Level 2 inputs are not available, securities are classified within Level 3 of the hierarchy.
Mortgage Servicing Rights
Mortgage servicing rights do not trade in an active, open market with readily observable prices. Accordingly, fair value is estimated using discounted cash flow models having significant inputs of discount rate, prepayment speed and default rate. Due to the nature of the valuation inputs, mortgage servicing rights are classified within Level 3 of the hierarchy.
The Chief Financial Officer's (CFO) office contracts with a pricing specialist to generate fair value estimates on an annual basis. The CFO's office challenges the reasonableness of the assumptions used and reviews the methodology to ensure the estimated fair value complies with accounting standards generally accepted in the United States.
F-44
Merchants Bancorp
Notes to Consolidated Financial Statements (Continued)
Six Months Ended June 30, 2017 and 2016 (unaudited) and
Years Ended December 31, 2016 and 2015
Note 20: Disclosures About Fair Value of Assets and Liabilities (Continued)
Level 3 Reconciliation
The following is a reconciliation of the beginning and ending balances of recurring fair value measurements recognized in the accompanying balance sheets using significant unobservable (Level 3) inputs:
| |
|
Year Ended December 31, | ||||||||
|---|---|---|---|---|---|---|---|---|---|---|
| |
Six Months Ended June 30, 2017 |
|||||||||
| |
2016 | 2015 | ||||||||
| |
(In thousands) |
|||||||||
Balance, beginning of period |
$ | 53,670 | $ | 55,553 | $ | 52,913 | ||||
Additions |
||||||||||
Purchased servicing |
1,133 | 1,357 | 1,135 | |||||||
Retained servicing |
4,836 | 4,388 | 6,866 | |||||||
Subtractions |
||||||||||
Paydowns—Amortization |
(2,730 | ) | (4,230 | ) | (5,177 | ) | ||||
Changes in fair value due to changes in valuation inputs or assumptions used in the valuation model |
648 | (3,398 | ) | (184 | ) | |||||
| | | | | | | | | | | |
Balance, end of period |
$ | 57,557 | $ | 53,670 | $ | 55,553 | ||||
| | | | | | | | | | | |
| | | | | | | | | | | |
| | | | | | | | | | | |
Nonrecurring Measurements
The following table presents the fair value measurement of assets and liabilities measured at fair value on a nonrecurring basis and the level within the fair value hierarchy in which the fair value measurements fall at June 30, 2017 and December 31, 2016 and 2015:
| |
Fair Value Measurements Using | ||||||||||||
|---|---|---|---|---|---|---|---|---|---|---|---|---|---|
Assets
|
Fair Value | Quoted Prices in Active Markets for Identical Assets (Level 1) |
Significant Other Observable Inputs (Level 2) |
Significant Unobservable Inputs (Level 3) |
|||||||||
| |
(In thousands) |
||||||||||||
June 30, 2017 |
|||||||||||||
Impaired loans |
$ | — | $ | — | $ | — | $ | — | |||||
December 31, 2016 |
|||||||||||||
Impaired loans |
$ | 225 | $ | — | $ | — | $ | 225 | |||||
December 31, 2015 |
|||||||||||||
Impaired loans |
$ | 136 | $ | — | $ | — | $ | 136 | |||||
Following is a description of the valuation methodologies and inputs used for assets measured at fair value on a nonrecurring basis and recognized in the accompanying balance sheet, as well as the general classification of such assets pursuant to the valuation hierarchy. For assets classified within Level 3 of the fair value hierarchy, the process used to develop the reported fair value is described below.
F-45
Merchants Bancorp
Notes to Consolidated Financial Statements (Continued)
Six Months Ended June 30, 2017 and 2016 (unaudited) and
Years Ended December 31, 2016 and 2015
Note 20: Disclosures About Fair Value of Assets and Liabilities (Continued)
Collateral-Dependent Impaired Loans, Net of Allowance for Loan Losses
The estimated fair value of collateral-dependent impaired loans is based on the appraised fair value of the collateral, less estimated cost to sell. Collateral-dependent impaired loans are classified within Level 3 of the fair value hierarchy.
The Company considers the appraisal or evaluation as the starting point for determining fair value and then considers other factors and events in the environment that may affect the fair value. Appraisals of the collateral underlying collateral-dependent loans are obtained when the loan is determined to be collateral-dependent and subsequently as deemed necessary by the Chief Credit Officer's (CCO) office. Appraisals are reviewed for accuracy and consistency by the CCO's office. Appraisers are selected from the list of approved appraisers maintained by management. The appraised values are reduced by discounts to consider lack of marketability and estimated cost to sell if repayment or satisfaction of the loan is dependent on the sale of the collateral. These discounts and estimates are developed by the CCO's office by comparison to historical results.
F-46
Merchants Bancorp
Notes to Consolidated Financial Statements (Continued)
Six Months Ended June 30, 2017 and 2016 (unaudited) and
Years Ended December 31, 2016 and 2015
Note 20: Disclosures About Fair Value of Assets and Liabilities (Continued)
Unobservable (Level 3) Inputs:
The following table presents quantitative information about unobservable inputs used in recurring and nonrecurring Level 3 fair value measurements other than goodwill.
| |
Fair Value | Valuation Technique |
Unobservable Inputs |
Range | |||||
|---|---|---|---|---|---|---|---|---|---|
| |
(In thousands) |
|
|
|
|||||
At June 30, 2017: |
|||||||||
Collateral-dependent impaired loans |
$ | — | Market comparable properties |
Marketability discount |
N/A | ||||
Mortgage servicing rights |
57,577 | Discounted cash flow | Discount rate | 8.0% - 15.0% | |||||
|
Constant prepayment rate |
1% - 17% | |||||||
At December 31, 2016: |
|
|
|
||||||
Collateral-dependent impaired loans |
$ | 225 | Market comparable properties |
Marketability discount |
40% | ||||
Mortgage servicing rights |
53,670 | Discounted cash flow | Discount rate | 8.0% - 15.0% | |||||
|
Constant prepayment rate |
0% - 25% | |||||||
At December 31, 2015: |
|
|
|
||||||
Collateral-dependent impaired loans |
$ | 136 | Market comparable properties |
Marketability discount |
9.0% - 40.0% | ||||
Mortgage servicing rights |
55,553 | Discounted cash flow | Discount rate | 8.0% - 15.0% | |||||
|
Constant prepayment rate |
0% - 25% | |||||||
Sensitivity of Significant Unobservable Inputs
The following is a discussion of the sensitivity of significant unobservable inputs, the interrelationships between those inputs and other unobservable inputs used in recurring fair value measurement and of how those inputs might magnify or mitigate the effect of changes in the unobservable inputs on the fair value measurement.
Mortgage Servicing Rights
The significant unobservable inputs used in the fair value measurement of the Company's mortgage servicing rights are discount rates and constant prepayment rates. Significant increases or decreases in any of those inputs in isolation would result in a significantly different fair value measurement.
F-47
Merchants Bancorp
Notes to Consolidated Financial Statements (Continued)
Six Months Ended June 30, 2017 and 2016 (unaudited) and
Years Ended December 31, 2016 and 2015
Note 20: Disclosures About Fair Value of Assets and Liabilities (Continued)
Fair Value of Financial Instruments
The following tables present estimated fair values of the Company's financial instruments and the level within the fair value hierarchy in which the fair value measurements fall at June 30, 2017 and December 31, 2016 and 2015.
| |
|
Fair Value Measurements Using | ||||||||||||||
|---|---|---|---|---|---|---|---|---|---|---|---|---|---|---|---|---|
Assets
|
Carrying Value |
Fair Value |
Quoted Prices in Active Markets for Identical Assets (Level 1) |
Significant Other Observable Inputs (Level 2) |
Significant Unobservable Inputs (Level 3) |
|||||||||||
| |
(In thousands) |
|||||||||||||||
June 30, 2017 |
||||||||||||||||
Financial assets: |
||||||||||||||||
Cash and cash equivalents |
$ | 416,554 | $ | 416,554 | $ | 416,554 | $ | — | $ | — | ||||||
Securities purchased under agreement to resell |
5,335 | 5,335 | — | 5,335 | — | |||||||||||
FHLB Stock |
7,539 | 7,539 | — | 7,539 | — | |||||||||||
Loan held for sale |
983,420 | 983,420 | — | 983,420 | — | |||||||||||
Loans, net |
1,064,001 | 1,065,942 | — | — | 1,065,942 | |||||||||||
Interest receivable |
6,059 | 6,059 | — | 6,059 | — | |||||||||||
Financial liabilities: |
||||||||||||||||
Deposits |
2,771,501 | 2,771,314 | 2,454,473 | 316,841 | — | |||||||||||
Line of credit |
25,000 | 25,000 | — | 25,000 | — | |||||||||||
Short-term subordinated debt |
30,000 | 30,000 | — | 30,000 | — | |||||||||||
FHLB advances |
1,633 | 1,667 | — | 1,667 | — | |||||||||||
Interest payable |
2,097 | 2,097 | — | 2,097 | — | |||||||||||
December 31, 2016 |
||||||||||||||||
Financial assets: |
||||||||||||||||
Cash and cash equivalents |
$ | 445,701 | $ | 445,701 | $ | 445,701 | $ | — | $ | — | ||||||
Securities purchased under agreement to resell |
5,392 | 5,392 | — | 5,392 | — | |||||||||||
FHLB Stock |
7,539 | 7,539 | — | 7,539 | — | |||||||||||
Loans held for sale |
764,503 | 764,503 | — | 764,503 | — | |||||||||||
Loans, net |
935,546 | 935,287 | — | 935,287 | ||||||||||||
Interest receivable |
5,368 | 5,368 | — | 5,368 | — | |||||||||||
Financial liabilities: |
||||||||||||||||
Deposits |
2,428,621 | 2,428,478 | 2,262,378 | 166,100 | — | |||||||||||
Line of credit |
25,000 | 25,000 | — | 25,000 | — | |||||||||||
Short-term subordinated debt |
30,000 | 30,000 | — | 30,000 | — | |||||||||||
FHLB advances |
2,006 | 2,031 | — | 2,031 | — | |||||||||||
Interest payable |
1,791 | 1,791 | — | 1,791 | — | |||||||||||
F-48
Merchants Bancorp
Notes to Consolidated Financial Statements (Continued)
Six Months Ended June 30, 2017 and 2016 (unaudited) and
Years Ended December 31, 2016 and 2015
Note 20: Disclosures About Fair Value of Assets and Liabilities (Continued)
| |
|
Fair Value Measurements Using | ||||||||||||||
|---|---|---|---|---|---|---|---|---|---|---|---|---|---|---|---|---|
Assets
|
Carrying Value |
Fair Value |
Quoted Prices in Active Markets for Identical Assets (Level 1) |
Significant Other Observable Inputs (Level 2) |
Significant Unobservable Inputs (Level 3) |
|||||||||||
| |
|
(In thousands) |
||||||||||||||
December 31, 2015 |
||||||||||||||||
Financial assets: |
||||||||||||||||
Cash and cash equivalents |
$ | 446,801 | $ | 446,801 | $ | 446,801 | $ | — | $ | — | ||||||
Securities purchased under agreement to resell |
5,514 | 5,514 | — | 5,514 | — | |||||||||||
FHLB Stock |
7,539 | 7,539 | — | 7,539 | — | |||||||||||
Loans held for sale |
620,583 | 620,583 | — | 620,583 | — | |||||||||||
Loans, net |
756,790 | 755,912 | — | — | 755,912 | |||||||||||
Interest receivable |
4,600 | 4,600 | — | 4,600 | — | |||||||||||
Financial liabilities: |
||||||||||||||||
Deposits |
2,039,520 | 2,039,371 | 1,636,073 | 403,298 | — | |||||||||||
Line of credit |
25,000 | 25,000 | — | 25,000 | — | |||||||||||
Short-term subordinated debt |
30,000 | 30,000 | — | 30,000 | — | |||||||||||
FHLB advances |
2,490 | 2,526 | — | 2,526 | — | |||||||||||
Interest payable |
1,843 | 1,843 | — | 1,843 | — | |||||||||||
The following methods were used to estimate the fair value of all other financial instruments recognized in the accompanying balance sheets at amounts other than fair value.
Cash and Cash Equivalents and Securities Purchased Under Agreement to Resell
The carrying amount approximates fair value.
Federal Home Loan Bank Stock
The fair value of FHLB stock is based on the price at which it may be sold to the FHLB.
Loans Held For Sale
The carrying amount approximates fair value due to the insignificant time between origination and date of sale.
Loans
Fair value is estimated by discounting the future cash flows using the market rates at which similar notes would be made to borrowers with similar credit ratings and for the same remaining maturities. The market rates used are based on current rates the Company would impose for similar loans and reflect a market participant assumption about risks associated with nonperformance, illiquidity, and the structure and term of the loans along with local economic and market conditions.
F-49
Merchants Bancorp
Notes to Consolidated Financial Statements (Continued)
Six Months Ended June 30, 2017 and 2016 (unaudited) and
Years Ended December 31, 2016 and 2015
Note 20: Disclosures About Fair Value of Assets and Liabilities (Continued)
Interest Receivable and Payable
The carrying amount approximates fair value. The carrying amount is determined using the interest rate, balance and last payment date.
Deposits
The fair values of noninterest-bearing demand and savings accounts are equal to the amount payable on demand at the balance sheet date. Fair values for fixed-rate certificates and time deposits are estimated using a discounted cash flow calculation that applies interest rates currently being offered on certificates to a schedule of expected monthly maturities on such time deposits.
Line of Credit and Short-term Subordinated Debt
The carrying amount approximates fair value.
Federal Home Loan Bank Advances
Fair value is estimated by discounting the future cash flows using rates of similar advances with similar maturities. These rates were obtained from current rates offered by the FHLB.
Off-Balance Sheet Commitments
Commitments include commitments to purchase and originate mortgage loans, commitments to sell mortgage loans and standby letters of credit and are generally of a short-term nature. The fair value of such commitments are based on fees currently charged to similar agreements, taking into account the remaining terms of the agreements and the counterparties' credit standing. The fair value of commitments to extend credit and letters of credit is not presented in the previous table since the fair value is considered to be insignificant.
Note 21: Significant Estimates and Concentrations
Accounting principles generally accepted in the United States of America require disclosure of certain significant estimates and current vulnerabilities due to certain concentrations. Estimates related to the provision and allowance for loan losses are reflected in the footnotes regarding loans and the allowance for loan losses (Notes 1 and 4). Estimates related to mortgage servicing rights are reflected in the notes on mortgage servicing rights and loan servicing (Notes 1 and 6). Estimates related to fair values are reflected in the footnote regarding fair values (Note 20). Current vulnerabilities due to certain concentrations of credit risk are discussed in the footnote on commitments and credit risk (Note 22). Other significant estimates and concentrations not discussed in those footnotes include:
Mortgage-backed Securities and Secondary Mortgage Market Programs
P/RMIC is involved in government programs for issuing mortgage-backed securities (MBS). The objective of these programs is to facilitate secondary market activities in order to provide funding for the multi-family mortgage market.
F-50
Merchants Bancorp
Notes to Consolidated Financial Statements (Continued)
Six Months Ended June 30, 2017 and 2016 (unaudited) and
Years Ended December 31, 2016 and 2015
Note 21: Significant Estimates and Concentrations (Continued)
P/RMIC is subject to cancellation of secondary mortgage market programs, rapid increases in general interest rates, and competition associated with conventional mortgage programs. In addition, P/RMIC could be responsible for covering shortfalls in amounts due to investors for delinquencies or foreclosures. No amounts have been reported in the consolidated financial statements since management believes that no near term financial losses will be incurred and these MBS programs will not be significantly affected by the controlling regulatory bodies.
Major Customer
The Company has a major customer of the Mortgage Warehousing segment, whose business represented $6.6 million and $7.3 million, or 10% and 17% of total revenues, for the six months ended June 30, 2017 and 2016, respectively, and $14.7 million and $17.2 million, or 15% and 21% of total revenues, for the years ended December 31, 2016 and 2015, respectively.
Note 22: Commitments and Credit Risk
In the normal course of business the Company enters into funding commitments with customers who have applied for single and multi-family residential loans. The customers must meet certain credit and underwriting criteria before the Company is required to fund the loans. The Company entered into commitments to fund loans pending closing of $300.6 million and $263.8 million at June 30, 2017 and December 31, 2016, respectively. Closing and funding of the majority of these loans is contingent upon various performance criteria by the potential borrower and the commitment may be rescinded by the Company. The Company enters into a corresponding sales commitment if it is the Company's intent to close the loan and to sell the loan after closing.
The Company, through the Warehouse Financing segment, has line of credit agreements with its non-depository financial institution customers engaged in mortgage lending. Funds drawn on the lines of credit are used by the borrowers to fund the loans they originate. The customers' loans must meet certain credit and underwriting criteria before the Company will fund the draw requests on the lines of credit, and the draw requests can be denied by the Company. The outstanding amounts available on these lines of credit totaled $548.4 million, $586.9 million and $471.7 million at June 30, 2017, December 31, 2016 and 2015, respectively.
Additionally, in the normal course of business the Company has outstanding unfunded commitments and contingent liabilities, such as commitments to extend credit and standby letters of credit, which are not included in the accompanying financial statements. The Company's exposure to credit loss in the event of nonperformance by the other party to the financial instruments for commitments to extend credit and standby letters of credit is represented by the contractual or notional amount of those instruments. The Company uses the same credit policies in making such commitments as it does for instruments that are included in the statement of financial condition.
F-51
Merchants Bancorp
Notes to Consolidated Financial Statements (Continued)
Six Months Ended June 30, 2017 and 2016 (unaudited) and
Years Ended December 31, 2016 and 2015
Note 22: Commitments and Credit Risk (Continued)
Financial instruments, whose contract amount represents credit risk, were as follows at June 30, 2017 and December 31, 2016 and 2015:
| |
|
December 31, | ||||||||
|---|---|---|---|---|---|---|---|---|---|---|
| |
June 30, 2017 |
|||||||||
| |
2016 | 2015 | ||||||||
| |
(In thousands) |
|||||||||
Commitments to extend credit |
$ | 421,798 | $ | 307,944 | $ | 144,205 | ||||
Irrevocable standby letters of credit |
26,000 | 26,000 | 28,400 | |||||||
Commitment letters of credit |
28,364 | 32,669 | 34,023 | |||||||
Commitments to extend credit are agreements to lend to a customer as long as there is no violation of any condition established in the contract. Commitments generally have fixed expiration dates or other termination clauses and may require payment of a fee. Since many of the commitments are expected to expire without being drawn upon, the total commitment amounts do not necessarily represent future cash requirements. The Company evaluates each customer's credit worthiness on a case-by-case basis. The amount of collateral obtained, if deemed necessary by the Bank upon extension of credit, is based on management's credit evaluation. Collateral held varies but may include accounts receivable, inventory, property and equipment, and income-producing commercial properties.
Commitment letters of credit are conditional commitments issued by the Bank for a fee to guarantee the performance of a customer to a third party. Standby letters of credit generally have fixed expiration dates or other termination clauses. The credit risk involved in issuing letters of credit is essentially the same as that involved in extending loan commitments to customers. The Bank's policy for obtaining collateral and/or guarantees and the nature thereof is generally the same as that involved extending commitments to its customers.
The Company has not been required to fund nor has incurred any losses on any letter of credit commitment during the six months ended June 30, 2017 and the years ended December 31, 2016 or 2015.
The Company has several noncancellable operating leases, primarily for office space, that expire over the next 4-8 years. Rental expense for these leases was $366,000 and $348,000 for the six months ended June 30, 2017 and 2016, respectively, and $696,000 and $574,000 for the years ended December 31, 2016 and 2015, respectively.
F-52
Merchants Bancorp
Notes to Consolidated Financial Statements (Continued)
Six Months Ended June 30, 2017 and 2016 (unaudited) and
Years Ended December 31, 2016 and 2015
Note 22: Commitments and Credit Risk (Continued)
Future minimum lease payments under operating leases as of June 30, 2017 and December 31, 2016 are as follows:
| |
June 30, 2017 |
December 31, 2016 |
|||||
|---|---|---|---|---|---|---|---|
| |
(In thousands) |
||||||
Due within one year |
$ | 720 | $ | 665 | |||
Due in one year to two years |
735 | 679 | |||||
Due in two years to three years |
749 | 693 | |||||
Due in three years to four years |
682 | 707 | |||||
Due in four years to five years |
256 | 392 | |||||
Thereafter |
587 | 702 | |||||
| | | | | | | | |
Total minimum lease payments |
$ | 3,729 | $ | 3,838 | |||
| | | | | | | | |
| | | | | | | | |
| | | | | | | | |
The Company and its subsidiaries are parties to various claims and proceedings arising in the normal course of business. Currently, we are defendants in a litigation matter pending in Indiana state court for breach of contract related to a warehouse credit facility. Management, after consultation with legal counsel, believes that the liabilities, if any, arising from such proceedings and claims will not be material to the consolidated financial position or results of operations.
Note 23: Segment Information
Our business segments are defined as Multi-family Mortgage Banking, Mortgage Warehousing, and Banking. The reportable business segments are consistent with the internal reporting and evaluation of the principal lines of business of the Company. The Multi-family Mortgage Banking segment originates and services government sponsored mortgages for multi-family and healthcare facilities. The Mortgage Warehousing segment funds agency eligible residential loans from origination or purchase to sale in the secondary market, as well as commercial loans to non-depository financial institutions. The Banking segment provides a wide range of financial products and services to consumers and businesses, including commercial, commercial real estate, mortgage and other consumer loan products; letters of credit; various types of deposit products, including checking, savings and time deposit accounts. Other includes general and administrative expenses that provide services to all segments; internal funds transfer pricing offsets resulting from allocations to/from the other segments; certain elimination entries and investments in qualified affordable housing limited partnerships. All operations are domestic.
F-53
Merchants Bancorp
Notes to Consolidated Financial Statements (Continued)
Six Months Ended June 30, 2017 and 2016 (unaudited) and
Years Ended December 31, 2016 and 2015
Note 23: Segment Information (Continued)
The tables below present selected business segment financial information as of and for the six months ended June 30, 2017 and 2016, and as of and for the years ended December 31, 2016 and 2015.
| |
Multi-family Mortgage Banking |
Mortgage Warehousing |
Banking | Other | Total | |||||||||||
|---|---|---|---|---|---|---|---|---|---|---|---|---|---|---|---|---|
| |
(In thousands) |
|||||||||||||||
Six Months Ended June 30, 2017 |
||||||||||||||||
Interest Income |
||||||||||||||||
Loans held for sale |
$ | — | $ | 15,967 | $ | — | $ | — | $ | 15,967 | ||||||
Mortgage warehouse lines of credit |
— | 4,334 | — | — | 4,334 | |||||||||||
Residential real estate |
— | — | 4,975 | — | 4,975 | |||||||||||
Multi-family residential real estate |
— | — | 5,131 | — | 5,131 | |||||||||||
Commercial and commercial real estate |
— | 787 | 2,210 | — | 2,997 | |||||||||||
Agricultural production and real estate |
— | — | 1,051 | — | 1,051 | |||||||||||
Consumer and margin loans |
142 | 11 | 197 | — | 350 | |||||||||||
Investment securities and other |
37 | 1,413 | 5,216 | — | 6,666 | |||||||||||
| | | | | | | | | | | | | | | | | |
Total interest income |
179 | 22,512 | 18,780 | — | 41,471 | |||||||||||
Interest Expense |
||||||||||||||||
Deposits |
— | 2,428 | 6,083 | — | 8,511 | |||||||||||
Internal funds transfer charge |
— | 337 | 212 | (549 | ) | — | ||||||||||
Borrowings |
— | 3,316 | 47 | 342 | 3,705 | |||||||||||
| | | | | | | | | | | | | | | | | |
Total interest expense |
— | 6,081 | 6,342 | (207 | ) | 12,216 | ||||||||||
| | | | | | | | | | | | | | | | | |
Net interest income |
179 | 16,431 | 12,438 | 207 | 29,255 | |||||||||||
Provision for loan losses |
— | 405 | 75 | — | 480 | |||||||||||
| | | | | | | | | | | | | | | | | |
Net interest income after provision for loan losses |
179 | 16,026 | 12,363 | 207 | 28,775 | |||||||||||
Noninterest income |
||||||||||||||||
Gain on sale of loans |
20,064 | — | 545 | — | 20,609 | |||||||||||
Loan servicing fees |
2,384 | — | — | — | 2,384 | |||||||||||
Warehouse fee income |
— | 1,258 | — | — | 1,258 | |||||||||||
Other income |
— | 45 | 421 | — | 466 | |||||||||||
| | | | | | | | | | | | | | | | | |
Total noninterest income |
22,448 | 1,303 | 966 | — | 24,717 | |||||||||||
Noninterest expense |
||||||||||||||||
Salaries and employee benefits |
3,497 | 943 | 2,946 | 1,681 | 9,067 | |||||||||||
Loan expenses |
— | 1,780 | 173 | — | 1,953 | |||||||||||
Occupancy and equipment |
189 | 92 | 363 | 110 | 754 | |||||||||||
Professional fees |
106 | 208 | 147 | 69 | 530 | |||||||||||
Deposit insurance |
— | 137 | 337 | — | 474 | |||||||||||
Technology expense |
27 | 197 | 275 | 7 | 506 | |||||||||||
Other expense |
553 | 373 | 277 | 415 | 1,618 | |||||||||||
| | | | | | | | | | | | | | | | | |
Noninterst expense |
4,372 | 3,730 | 4,518 | 2,282 | 14,902 | |||||||||||
| | | | | | | | | | | | | | | | | |
Income before income taxes |
18,255 | 13,599 | 8,811 | (2,075 | ) | 38,590 | ||||||||||
Income taxes |
6,955 | 5,181 | 3,357 | (791 | ) | 14,702 | ||||||||||
| | | | | | | | | | | | | | | | | |
Net income |
$ | 11,300 | $ | 8,418 | $ | 5,454 | $ | (1,284 | ) | $ | 23,888 | |||||
| | | | | | | | | | | | | | | | | |
| | | | | | | | | | | | | | | | | |
| | | | | | | | | | | | | | | | | |
Total assets |
$ | 117,862 | $ | 1,288,717 | $ | 1,671,054 | $ | 13,867 | $ | 3,091,500 | ||||||
| | | | | | | | | | | | | | | | | |
| | | | | | | | | | | | | | | | | |
| | | | | | | | | | | | | | | | | |
F-54
Merchants Bancorp
Notes to Consolidated Financial Statements (Continued)
Six Months Ended June 30, 2017 and 2016 (unaudited) and
Years Ended December 31, 2016 and 2015
Note 23: Segment Information (Continued)
| |
Multi-family Mortgage Banking |
Mortgage Warehousing |
Banking | Other | Total | |||||||||||
|---|---|---|---|---|---|---|---|---|---|---|---|---|---|---|---|---|
| |
(In thousands) |
|||||||||||||||
Six Months Ended June 30, 2016 |
||||||||||||||||
Interest Income |
||||||||||||||||
Loans held for sale |
$ | — | $ | 13,091 | $ | — | $ | — | $ | 13,091 | ||||||
Mortgage warehouse lines of credit |
— | 4,838 | — | — | 4,838 | |||||||||||
Residential real estate |
— | — | 3,852 | — | 3,852 | |||||||||||
Multi-family residential real estate |
— | — | 2,858 | — | 2,858 | |||||||||||
Commercial and commercial real estate |
— | 581 | 1,324 | — | 1,905 | |||||||||||
Agricultural production and real estate |
— | — | 1,284 | — | 1,284 | |||||||||||
Consumer and margin loans |
62 | 11 | 165 | — | 238 | |||||||||||
Investment securities and other |
3 | 870 | 3,482 | — | 4,355 | |||||||||||
| | | | | | | | | | | | | | | | | |
Total interest income |
65 | 19,391 | 12,965 | — | 32,421 | |||||||||||
Interest Expense |
||||||||||||||||
Deposits |
— | 930 | 4,030 | — | 4,960 | |||||||||||
Internal funds transfer charge |
— | 967 | (1,408 | ) | 441 | — | ||||||||||
Borrowings |
— | 3,320 | 34 | 288 | 3,642 | |||||||||||
| | | | | | | | | | | | | | | | | |
Total interest expense |
— | 5,217 | 2,656 | 729 | 8,602 | |||||||||||
| | | | | | | | | | | | | | | | | |
Net interest income |
65 | 14,174 | 10,309 | (729 | ) | 23,819 | ||||||||||
Provision for loan losses |
— | 286 | 194 | — | 480 | |||||||||||
| | | | | | | | | | | | | | | | | |
Net interest income after provision for loan losses |
65 | 13,888 | 10,115 | (729 | ) | 23,339 | ||||||||||
Noninterest income |
||||||||||||||||
Gain on sale of loans |
5,799 | — | 811 | — | 6,610 | |||||||||||
Loan servicing fees |
2,091 | — | — | — | 2,091 | |||||||||||
Warehouse fee income |
— | 1,178 | — | — | 1,178 | |||||||||||
Other income |
— | — | 72 | — | 72 | |||||||||||
| | | | | | | | | | | | | | | | | |
Total noninterest income |
7,890 | 1,178 | 883 | — | 9,951 | |||||||||||
Noninterest expense |
||||||||||||||||
Salaries and employee benefits |
2,363 | 884 | 2,247 | 777 | 6,271 | |||||||||||
Loan expenses |
(3 | ) | 1,636 | 273 | — | 1,906 | ||||||||||
Occupancy and equipment |
141 | 81 | 338 | 112 | 672 | |||||||||||
Professional fees |
61 | 195 | 94 | 389 | 739 | |||||||||||
Deposit insurance |
— | 177 | 413 | — | 590 | |||||||||||
Technology expense |
9 | 149 | 252 | 11 | 421 | |||||||||||
Other expense |
566 | 359 | 265 | 374 | 1,564 | |||||||||||
| | | | | | | | | | | | | | | | | |
Noninterest expense |
3,137 | 3,481 | 3,882 | 1,663 | 12,163 | |||||||||||
| | | | | | | | | | | | | | | | | |
Income before income taxes |
4,818 | 11,585 | 7,116 | (2,392 | ) | 21,127 | ||||||||||
Income taxes |
1,905 | 4,580 | 2,813 | (945 | ) | 8,353 | ||||||||||
| | | | | | | | | | | | | | | | | |
Net income |
$ | 2,913 | $ | 7,005 | $ | 4,303 | $ | (1,447 | ) | $ | 12,774 | |||||
| | | | | | | | | | | | | | | | | |
| | | | | | | | | | | | | | | | | |
| | | | | | | | | | | | | | | | | |
Total assets |
$ | 92,749 | $ | 1,138,638 | $ | 1,271,277 | $ | 4,310 | $ | 2,506,974 | ||||||
| | | | | | | | | | | | | | | | | |
| | | | | | | | | | | | | | | | | |
| | | | | | | | | | | | | | | | | |
F-55
Merchants Bancorp
Notes to Consolidated Financial Statements (Continued)
Six Months Ended June 30, 2017 and 2016 (unaudited) and
Years Ended December 31, 2016 and 2015
Note 23: Segment Information (Continued)
| |
Multi-family Mortgage Banking |
Mortgage Warehousing |
Banking | Other | Total | |||||||||||
|---|---|---|---|---|---|---|---|---|---|---|---|---|---|---|---|---|
| |
(In thousands) |
|||||||||||||||
Year Ended December 31, 2016 |
||||||||||||||||
Interest Income |
||||||||||||||||
Loans held for sale |
$ | — | $ | 28,252 | $ | — | $ | — | $ | 28,252 | ||||||
Mortgage warehouse lines of credit |
— | 11,792 | — | — | 11,792 | |||||||||||
Residential real estate |
— | — | 7,970 | — | 7,970 | |||||||||||
Multi-family residential real estate |
— | — | 7,480 | — | 7,480 | |||||||||||
Commercial and commercial real estate |
— | 895 | 3,150 | — | 4,045 | |||||||||||
Agricultural production and real estate |
— | — | 2,413 | — | 2,413 | |||||||||||
Consumer and margin loans |
231 | 22 | 358 | — | 611 | |||||||||||
Investment securities and other |
6 | 2,391 | 7,979 | — | 10,376 | |||||||||||
| | | | | | | | | | | | | | | | | |
Total interest income |
237 | 43,352 | 29,350 | — | 72,939 | |||||||||||
Interest Expense |
||||||||||||||||
Deposits |
— | 2,969 | 8,694 | — | 11,663 | |||||||||||
Internal funds transfer charge |
— | 1,616 | (2,215 | ) | 599 | — | ||||||||||
Borrowings |
— | 6,650 | 67 | 588 | 7,305 | |||||||||||
| | | | | | | | | | | | | | | | | |
Total interest expense |
— | 11,235 | 6,546 | 1,187 | 18,968 | |||||||||||
| | | | | | | | | | | | | | | | | |
Net interest income |
237 | 32,117 | 22,804 | (1,187 | ) | 53,971 | ||||||||||
Provision for loan losses |
— | (247 | ) | 1,207 | — | 960 | ||||||||||
| | | | | | | | | | | | | | | | | |
Net interest income after provision for loan losses |
237 | 32,364 | 21,597 | (1,187 | ) | 53,011 | ||||||||||
Noninterest income |
||||||||||||||||
Gain on sale of loans |
22,516 | — | 2,239 | — | 24,755 | |||||||||||
Loan servicing fees |
280 | — | — | — | 280 | |||||||||||
Warehouse fee income |
— | 3,015 | — | — | 3,015 | |||||||||||
Other income |
2 | 205 | 247 | — | 454 | |||||||||||
| | | | | | | | | | | | | | | | | |
Total noninterest income |
22,798 | 3,220 | 2,486 | — | 28,504 | |||||||||||
Noninterest expense |
||||||||||||||||
Salaries and employee benefits |
5,814 | 1,723 | 4,944 | 1,832 | 14,313 | |||||||||||
Loan expenses |
— | 3,766 | 485 | — | 4,251 | |||||||||||
Occupancy and equipment |
303 | 180 | 632 | 229 | 1,344 | |||||||||||
Professional fees |
109 | 501 | 261 | 427 | 1,298 | |||||||||||
Deposit insurance |
— | 343 | 806 | — | 1,149 | |||||||||||
Technology expense |
27 | 416 | 535 | 7 | 985 | |||||||||||
Other expense |
1,221 | 801 | 720 | 638 | 3,380 | |||||||||||
| | | | | | | | | | | | | | | | | |
Noninterest expense |
7,474 | 7,730 | 8,383 | 3,133 | 26,720 | |||||||||||
| | | | | | | | | | | | | | | | | |
Income before income taxes |
15,561 | 27,854 | 15,700 | (4,320 | ) | 54,795 | ||||||||||
Income taxes |
6,153 | 11,015 | 6,208 | (1,708 | ) | 21,668 | ||||||||||
| | | | | | | | | | | | | | | | | |
Net income |
$ | 9,408 | $ | 16,839 | $ | 9,492 | $ | (2,612 | ) | $ | 33,127 | |||||
| | | | | | | | | | | | | | | | | |
| | | | | | | | | | | | | | | | | |
| | | | | | | | | | | | | | | | | |
Total assets |
$ | 98,553 | $ | 1,060,723 | $ | 1,545,783 | $ | 13,453 | $ | 2,718,512 | ||||||
| | | | | | | | | | | | | | | | | |
| | | | | | | | | | | | | | | | | |
| | | | | | | | | | | | | | | | | |
F-56
Merchants Bancorp
Notes to Consolidated Financial Statements (Continued)
Six Months Ended June 30, 2017 and 2016 (unaudited) and
Years Ended December 31, 2016 and 2015
Note 23: Segment Information (Continued)
| |
Multi-family Mortgage Banking |
Mortgage Warehousing |
Banking | Other | Total | |||||||||||
|---|---|---|---|---|---|---|---|---|---|---|---|---|---|---|---|---|
| |
(In thousands) |
|||||||||||||||
Year Ended December 31, 2015 |
||||||||||||||||
Interest Income |
||||||||||||||||
Loans held for sale |
$ | — | $ | 25,452 | $ | — | $ | — | $ | 25,452 | ||||||
Mortgage warehouse lines of credit |
— | 7,363 | — | — | 7,363 | |||||||||||
Residential real estate |
— | 56 | 5,818 | — | 5,874 | |||||||||||
Multi-family residential real estate |
— | — | 3,251 | — | 3,251 | |||||||||||
Commercial and commercial real estate |
— | 2,068 | 2,097 | — | 4,165 | |||||||||||
Agricultural production and real estate |
— | — | 2,309 | — | 2,309 | |||||||||||
Consumer and margin loans |
304 | 22 | 266 | — | 592 | |||||||||||
Investment securities and other |
5 | 1,869 | 5,465 | — | 7,339 | |||||||||||
| | | | | | | | | | | | | | | | | |
Total interest income |
309 | 36,830 | 19,206 | — | 56,345 | |||||||||||
Interest Expense |
||||||||||||||||
Deposits |
— | 440 | 6,906 | — | 7,346 | |||||||||||
Internal funds transfer charge |
— | 2,719 | (3,500 | ) | 781 | — | ||||||||||
Borrowings |
— | 6,447 | 85 | 412 | 6,944 | |||||||||||
| | | | | | | | | | | | | | | | | |
Total interest expense |
— | 9,606 | 3,491 | 1,193 | 14,290 | |||||||||||
| | | | | | | | | | | | | | | | | |
Net interest income |
309 | 27,224 | 15,715 | (1,193 | ) | 42,055 | ||||||||||
Provision for loan losses |
— | (47 | ) | 1,007 | — | 960 | ||||||||||
| | | | | | | | | | | | | | | | | |
Net interest income after provision for loan losses |
309 | 27,271 | 14,708 | (1,193 | ) | 41,095 | ||||||||||
Noninterest income |
||||||||||||||||
Gain on sale of loans |
23,913 | — | 890 | — | 24,803 | |||||||||||
Loan servicing fees |
836 | — | — | — | 836 | |||||||||||
Warehouse fee income |
— | 1,193 | — | — | 1,193 | |||||||||||
Other income |
— | — | 176 | — | 176 | |||||||||||
| | | | | | | | | | | | | | | | | |
Total noninterest income |
24,749 | 1,193 | 1,066 | — | 27,008 | |||||||||||
Noninterest expense |
||||||||||||||||
Salaries and employee benefits |
5,018 | 1,713 | 3,941 | 1,290 | 11,962 | |||||||||||
Loan expenses |
2 | 2,558 | 175 | — | 2,735 | |||||||||||
Occupancy and equipment |
269 | 169 | 673 | 137 | 1,248 | |||||||||||
Professional fees |
116 | 193 | 168 | 198 | 675 | |||||||||||
Deposit insurance |
— | 319 | 758 | — | 1,077 | |||||||||||
Technology expense |
29 | 167 | 493 | 13 | 702 | |||||||||||
Other expense |
878 | 584 | 805 | 256 | 2,523 | |||||||||||
| | | | | | | | | | | | | | | | | |
Noninterest expense |
6,312 | 5,703 | 7,013 | 1,894 | 20,922 | |||||||||||
| | | | | | | | | | | | | | | | | |
Income before income taxes |
18,746 | 22,761 | 8,761 | (3,087 | ) | 47,181 | ||||||||||
Income taxes |
7,469 | 9,068 | 3,491 | (1,230 | ) | 18,798 | ||||||||||
| | | | | | | | | | | | | | | | | |
Net income |
$ | 11,277 | $ | 13,693 | $ | 5,270 | $ | (1,857 | ) | $ | 28,383 | |||||
| | | | | | | | | | | | | | | | | |
| | | | | | | | | | | | | | | | | |
| | | | | | | | | | | | | | | | | |
Total assets |
$ | 87,188 | $ | 924,731 | $ | 1,253,402 | $ | 4,121 | $ | 2,269,442 | ||||||
| | | | | | | | | | | | | | | | | |
| | | | | | | | | | | | | | | | | |
| | | | | | | | | | | | | | | | | |
F-57
Merchants Bancorp
Notes to Consolidated Financial Statements (Continued)
Six Months Ended June 30, 2017 and 2016 (unaudited) and
Years Ended December 31, 2016 and 2015
Note 24: Condensed Financial Information (Parent Company Only)
Presented below is condensed financial information of the Company as to financial position as of June 30, 2017 and December 31, 2016 and 2015, and results of operations and cash flows for the six month periods ended June 30, 2017 and 2016 and the years ended December 31, 2016 and 2015:
| |
|
December 31, | ||||||||
|---|---|---|---|---|---|---|---|---|---|---|
| |
June 30, 2017 | |||||||||
| |
2016 | 2015 | ||||||||
| |
(In thousands) |
|||||||||
Assets |
||||||||||
Cash and cash equivalents |
$ | 3,410 | $ | 158 | $ | 155 | ||||
Investment in subsidiary |
275,298 | 254,883 | 202,346 | |||||||
Other assets |
4,657 | 7,904 | 2,419 | |||||||
| | | | | | | | | | | |
Total assets |
$ | 283,365 | $ | 262,945 | $ | 204,920 | ||||
| | | | | | | | | | | |
| | | | | | | | | | | |
| | | | | | | | | | | |
Liabilities |
||||||||||
Lines of credit |
$ | 25,000 | $ | 25,000 | $ | 25,000 | ||||
Short-term subordinated debt |
30,000 | 30,000 | 30,000 | |||||||
Other liabilities |
1,851 | 1,657 | 1,720 | |||||||
| | | | | | | | | | | |
Total liabilities |
56,851 | 56,657 | 56,720 | |||||||
Shareholders' Equity |
226,514 | 206,288 | 148,200 | |||||||
| | | | | | | | | | | |
Total liabilities and shareholders' equity |
$ | 283,365 | $ | 262,945 | $ | 204,920 | ||||
| | | | | | | | | | | |
| | | | | | | | | | | |
| | | | | | | | | | | |
F-58
Merchants Bancorp
Notes to Consolidated Financial Statements (Continued)
Six Months Ended June 30, 2017 and 2016 (unaudited) and
Years Ended December 31, 2016 and 2015
Note 24: Condensed Financial Information (Parent Company Only) (Continued)
Condensed Statements of Income and Comprehensive Income
| |
Six Months Ended June 30, |
Year Ended December 31, |
|||||||||||
|---|---|---|---|---|---|---|---|---|---|---|---|---|---|
| |
2017 | 2016 | 2016 | 2015 | |||||||||
| |
(In thousands) |
||||||||||||
Income |
|||||||||||||
Interest income |
$ | — | $ | — | $ | — | $ | 1 | |||||
Dividends and return of capital from subsidiary |
6,208 | 6,767 | 16,223 | 9,416 | |||||||||
Other Income |
27 | — | 196 | — | |||||||||
| | | | | | | | | | | | | | |
Total income |
6,235 | 6,767 | 16,419 | 9,417 | |||||||||
| | | | | | | | | | | | | | |
Expenses |
|||||||||||||
Interest expense |
3,658 | 3,609 | 7,237 | 6,859 | |||||||||
Salaries and employee benefits |
527 | 30 | 77 | 73 | |||||||||
Professional fees |
23 | 112 | 138 | 90 | |||||||||
Other |
70 | 29 | 33 | 22 | |||||||||
| | | | | | | | | | | | | | |
Total expense |
4,278 | 3,780 | 7,485 | 7,044 | |||||||||
| | | | | | | | | | | | | | |
Income Before Income Tax and Equity in Undistributed Income of Subsidiary |
1,957 | 2,987 | 8,934 | 2,373 | |||||||||
Income Tax Benefit |
(1,629 | ) | (1,497 | ) | (2,885 | ) | (2,807 | ) | |||||
| | | | | | | | | | | | | | |
Income Before Equity in Undistributed Income of Subsidiary |
3,586 | 4,484 | 11,819 | 5,180 | |||||||||
Equity in Undistributed Income of Subsidiary |
20,302 | 8,290 | 21,308 | 23,203 | |||||||||
| | | | | | | | | | | | | | |
Net Income |
$ | 23,888 | $ | 12,774 | $ | 33,127 | $ | 28,383 | |||||
| | | | | | | | | | | | | | |
| | | | | | | | | | | | | | |
| | | | | | | | | | | | | | |
Comprehensive Income |
$ | 23,959 | $ | 13,067 | $ | 32,731 | $ | 28,344 | |||||
| | | | | | | | | | | | | | |
| | | | | | | | | | | | | | |
| | | | | | | | | | | | | | |
F-59
Merchants Bancorp
Notes to Consolidated Financial Statements (Continued)
Six Months Ended June 30, 2017 and 2016 (unaudited) and
Years Ended December 31, 2016 and 2015
Note 24: Condensed Financial Information (Parent Company Only) (Continued)
Condensed Statements of Cash Flows
| |
Six Months Ended June 30, |
Year Ended December 31, |
|||||||||||
|---|---|---|---|---|---|---|---|---|---|---|---|---|---|
| |
2017 | 2016 | 2016 | 2015 | |||||||||
| |
(In thousands) |
||||||||||||
Operating Activities |
|||||||||||||
Net income |
$ | 23,888 | $ | 12,774 | $ | 33,127 | $ | 28,383 | |||||
Adjustments to reconcile net income to net cash used in operating activities |
(16,860 | ) | (9,832 | ) | (26,561 | ) | (25,357 | ) | |||||
| | | | | | | | | | | | | | |
Net cash provided by operating activities |
7,028 | 2,942 | 6,566 | 3,026 | |||||||||
| | | | | | | | | | | | | | |
Investing Activities |
|||||||||||||
Contributed capital to subsidiary |
— | (18,525 | ) | (31,625 | ) | (23,971 | ) | ||||||
Other investing activity |
— | (429 | ) | (295 | ) | — | |||||||
| | | | | | | | | | | | | | |
Net cash used in investing activities |
— | (18,954 | ) | (31,920 | ) | (23,971 | ) | ||||||
| | | | | | | | | | | | | | |
Financing Activities |
|||||||||||||
Net change in short-term borrowings |
— | — | — | 10,000 | |||||||||
Dividends paid |
(3,776 | ) | (2,518 | ) | (6,224 | ) | (4,222 | ) | |||||
Proceeds from issuance of common stock |
— | — | — | 3,941 | |||||||||
Proceeds from issuance of preferred stock |
— | 18,525 | 31,581 | 10,000 | |||||||||
| | | | | | | | | | | | | | |
Net cash provided by (used in) financing activities |
(3,776 | ) | 16,007 | 25,357 | 19,719 | ||||||||
| | | | | | | | | | | | | | |
Net Change in Cash and Due From Banks |
3,252 | (5 | ) | 3 | (1,226 | ) | |||||||
Cash and Due From Banks at Beginning of Year |
158 | 155 | 155 | 1,381 | |||||||||
| | | | | | | | | | | | | | |
Cash and Due From Banks at End of Year |
$ | 3,410 | $ | 150 | $ | 158 | $ | 155 | |||||
| | | | | | | | | | | | | | |
| | | | | | | | | | | | | | |
| | | | | | | | | | | | | | |
Note 25: Recent Accounting Pronouncements
The Company is an emerging growth company and as such will be subject to the effective dates noted for the private companies if they differ from the effective dates noted for public companies.
FASB ASU 2014-09, Revenue from Contracts with Customers
In May 2014, the Financial Accounting Standards Board (the "FASB") issued Accounting Standards Update ("ASU") 2014-09, "Revenue from Contracts with Customers," which requires an entity to recognize the amount of revenue to which it expects to be entitled for the transfer of promised goods or services to customers. The ASU will replace most existing revenue recognition guidance in U.S. GAAP when it becomes effective. In March, 2016 the FASB issued ASU 2016-08, "Principal versus Agent Considerations (Reporting Revenue Gross versus Net)," which clarifies the guidance in determining revenue recognition as principal versus agent. In April 2016, the FASB issued ASU 2016-10, "Identifying Performance Obligations and Licensing," which provides guidance in accounting for immaterial performance obligations and shipping and handling. In May 2016, the FASB
F-60
Merchants Bancorp
Notes to Consolidated Financial Statements (Continued)
Six Months Ended June 30, 2017 and 2016 (unaudited) and
Years Ended December 31, 2016 and 2015
Note 25: Recent Accounting Pronouncements (Continued)
issued ASU 2016-12, "Narrow-Scope Improvements and Practical Expedients," which provides clarification on assessing the collectability criterion, presentation of sales taxes, measurement date for noncash consideration and completed contracts at transition. This ASU also provides a practical expedient for contract modifications.
The amendments are effective, as to the Company, for annual reporting periods beginning after December 15, 2018, and for interim reporting periods within annual periods beginning after December 15, 2019. The Company is currently evaluating the impact of adopting the guidance.
FASB ASU 2016-01, Recognition and Measurement of Financial Assets and Financial Liabilities
In January 2016, the FASB issued ASU 2016-01, "Recognition and Measurement of Financial Assets and Financial Liabilities." For public business entities, the amendments in this update include the elimination of the requirement to disclose the method(s) and significant assumptions used to estimate fair value that is required to be disclosed for financial instruments measured at amortized cost on the balance sheet, the requirement to use the exit price notion when measuring fair value of financial instruments for disclosure purposes, the requirement to present separately in other comprehensive income the portion of the total change in the fair value of a liability resulting from a change in the instrument-specific credit risk when the entity has elected to measure the liability at fair value in accordance with the fair value option for financial instruments, the requirement for separate presentation of financial assets and financial liabilities by measurement category and form of financial asset (that is, securities or loans and receivables) on the balance sheet or accompanying notes to the financial statements, and the amendments clarify that an entity should evaluate the need for a valuation allowance on a deferred tax asset related to available-for-sale securities in combination with the entity's other deferred tax assets.
The amendments in this update are effective, as to the Company, for fiscal years beginning after December 15, 2018, and interim periods within years beginning after December 15, 2019. Early adoption of the amendments in this update is not permitted, except that early application by public business entities to financial statements of fiscal years or interim periods that have not yet been issued or, by all other entities, that have not yet been made available for issuance, are permitted as of the beginning of the fiscal year of adoption for the following amendment: An entity should present separately in other comprehensive income the portion of the total change in the fair value of a liability resulting from a change in the instrument-specific credit risk if the entity has elected to measure the liability at fair value in accordance with the fair value option for financial instruments. An entity should apply the amendments to this update by means of a cumulative-effect adjustment to the balance sheet as of the beginning of the fiscal year of adoption. Management is currently evaluating the impact of adopting this guidance on the Company's financial statements, however adoption of ASU No. 2016-01 is not expected to have a material impact on the Company's financial position or results of operations.
F-61
Merchants Bancorp
Notes to Consolidated Financial Statements (Continued)
Six Months Ended June 30, 2017 and 2016 (unaudited) and
Years Ended December 31, 2016 and 2015
Note 25: Recent Accounting Pronouncements (Continued)
FASB ASU 2016-02, Leases
In February 2016, the FASB issued ASU 2016-02, "Leases." Under the new guidance, lessees will be required to recognize the following for all leases (with the exception of short-term leases) at the commencement date:
- •
- A lease liability, which is a lessee's obligation to make lease payments arising from a lease, measured on a discounted basis; and
- •
- A right-of-use asset, which is an asset that represents the lessee's right to use, or control the use of, a specified asset for the lease term.
Under the new guidance, lessor accounting is largely unchanged. Certain targeted improvements were made to align, where necessary, lessor accounting with the lessee accounting model and Topic 606, "Revenue from Contracts with Customers."
The new lease guidance simplified the accounting for sale and leaseback transactions primarily because lessees must recognize lease assets and lease liabilities. Lessees will no longer be provided with a source of off-balance sheet financing.
The amendments in ASU 2016-02 are effective, as to the Company, for years beginning after December 15, 2019, and for interim periods for years beginning after January 1, 2020. Lessees (for capital and operating leases) and lessors (for sales-type, direct financing, and operating leases) must apply a modified retrospective transition approach for leases existing at, or entered into after, the beginning of the earliest comparative period presented in the financial statements. The modified retrospective approach would not require any transition accounting for leases that expired before the earliest comparative period presented. Lessees and lessors may not apply a full retrospective transition approach. Management is currently evaluating the impact of adopting this guidance on the Company's financial statements.
FASB ASU 2016-09 Share-Based Payments.
In March 2016, the FASB issued ASU 2016-09 "Share-Based Payments." The guidance in this ASU simplifies several aspects of the accounting for share-based payment award transactions, including the income tax consequences, the classification of awards as either equity or liabilities, and the classification on the statement of cash flows. Additionally, the guidance simplifies two areas specific to entities other than public business entities allowing them apply a practical expedient to estimate the expected term for all awards with performance or service conditions that have certain characteristics and also allowing them to make a one-time election to switch from measuring all liability-classified awards at fair value to measuring them at intrinsic value. The amendments are effective for annual periods beginning after December 15, 2017 and interim periods within annual periods beginning after December 15, 2018. Management does not believe the changes will have a material effect on the Company's financial position and results of operations.
F-62
Merchants Bancorp
Notes to Consolidated Financial Statements (Continued)
Six Months Ended June 30, 2017 and 2016 (unaudited) and
Years Ended December 31, 2016 and 2015
Note 25: Recent Accounting Pronouncements (Continued)
FASB ASU 2016-13, Financial Instruments—Credit Losses
In June 2016, the FASB issued ASU 2016-13, "Financial Instruments—Credit Losses". The amendments in this ASU replace the incurred loss model with a methodology that reflects expected credit losses over the life of the loan and requires consideration of a broader range of reasonable and supportable information to calculate credit loss estimates. ASU 2016-13 replaces the incurred loss impairment methodology with a new methodology that reflects expected credit losses over the lives of the loans and requires consideration of a broader range of information to inform credit loss estimates. The ASU requires an organization to estimate all expected credit losses for financial assets measured at amortized cost, including loans and held-to-maturity debt securities, based on historical experience, current conditions, and reasonable and supportable forecasts. Additional disclosures are required. ASU 2016-13 is effective, as to the Company, for fiscal years beginning after December 15, 2020, and interim periods within those fiscal years beginning after December 15, 2021. Management expects that the implementation of this ASU may increase the balance of the allowance for loan losses and is continuing to evaluate the potential impact on the Company's financial position and results of operations.
FASB ASU No. 2017-04: Intangibles—Goodwill and Other (Topic 350)
In January 2017, the FASB issued ASU 2017-04, "Intangibles—Goodwill and Other (Topic 350)." This ASU simplifies the test for goodwill impairment. Specifically, these amendments eliminate Step 2 from the goodwill impairment test, and also eliminate the requirements for any reporting unit with a zero or negative carrying amount to perform a qualitative assessment and, if it fails that qualitative test, to perform Step 2 of the goodwill impairment test. The amendments in this ASU are effective for annual goodwill impairment tests in fiscal years beginning after December 15, 2021. Management does not believe the changes will have a material effect on the Company's financial position and results of operations.
FASB ASU 2017-08, Premium Amortization on Purchased Callable Debt
In March 2017, the FASB issued ASU 2017-08, "Premium Amortization on Purchased Callable Debt." This ASU applies to all entities that hold investments in callable debt securities that have an amortized cost basis in excess of the amount that is repayable by the issuer at the earliest call date (that is, at a premium). The ASU requires the premium to be amortized to the earliest call date, not the maturity date. The amendments do not require an accounting change for securities held at a discount; the discount continues to be amortized to maturity. ASU 2017-08 is effective as to the Company for years beginning after December 15, 2019 and interim periods within years beginning after December 15, 2020. Early adoption is permitted. Management is currently evaluating the impact of adopting this guidance and does not expect the ASU to have a material effect on the Company's financial position or results of operations.
F-63
Merchants Bancorp
Notes to Consolidated Financial Statements (Continued)
Six Months Ended June 30, 2017 and 2016 (unaudited) and
Years Ended December 31, 2016 and 2015
Note 26: Subsequent Events
Acquisition of RICHMAC
The Bank entered into an agreement dated June 26, 2017 to acquire 100% of the equity interests of RICHMAC Funding, LLC, ("RICHMAC") a Delaware limited liability company, which is a national multifamily housing mortgage lender. For the year ended December 31, 2016, RICHMAC had total revenues of $8.2 million and net income of $2.0 million. The acquisition is expected to provide P/RMIC access to affordable multi-family finance programs through the Federal National Mortgage Association (FNMA) and the Federal Home Loan Mortgage Corporation (FHLMC), as well as servicing a portfolio of Government National Mortgage Association (GNMA), FNMA Delegated Underwriting and Servicing (DUS) and FHLMC loans. The acquisition is expected to allow P/RMIC to provide additional product offerings to current customers as well as broaden the origination network into attractive markets where the Bank does not currently have a presence. The agreement provides that the purchase price is payable in shares of Company common stock with a value of $8.0 million and is subject to increase for the fair value of servicing rights added by RICHMAC for the period after the agreement date and up to the closing date. The Company closed the acquisition on August 15, 2017 and issued 383,271 shares of our common stock in exchange for 100% of the equity interest of RICHMAC. Certain fair value measurements and the purchase price allocation have not been completed due to the timing of the acquisition. Review of the estimated fair values of assets acquired (including intangible assets) and liabilities assumed will occur during the measurement period.
Other Subsequent Events
As previously discussed in Note 14, Stock Splits, on July 5, 2017, the Company approved an increase of authorized common shares to 50.0 million shares, and declared a 2.5-for-1 stock split effective July 6, 2017. The presentation of authorized common shares has been retrospectively adjusted for the increase, and all share and per share amounts have been retrospectively adjusted to give effect to the stock split.
On July 5, 2017, the Company approved the Merchants Bancorp 2017 Equity Incentive Plan (the "2017 Plan") that provides for awards of up to 1.5 million shares to Company directors, employees and other service providers. The 2017 Plan provides for awards of stock options, restricted stock, restricted stock units, stock appreciation rights, and other incentive awards, or an equivalent amount of cash. No awards have been made under the 2017 Plan. The 2017 Plan replaces the existing plan described in Note 19, and no further awards will be made under that plan, although existing awards will paid through the vesting periods.
Subsequent events have been evaluated through the date of the Independent Auditor's Report, which is the date the consolidated financial statements were available to be issued. No other material events were noted.
F-64
5,555,555 Shares
Common Stock
PROSPECTUS
, 2017
Sandler O'Neill + Partners, L.P.
Stephens Inc.
Raymond James
SunTrust Robinson Humphrey
Through and including , 2017 (25 days after the date of this prospectus), all dealers that effect transactions in our common stock, whether or not participating in this offering, may be required to deliver a prospectus. This delivery requirement is in addition to the obligation of dealers to deliver a prospectus when acting as underwriters and with respect to their unsold allotments or subscriptions.
PART II—INFORMATION NOT REQUIRED IN PROSPECTUS
Item 13. Other Expenses of Issuance and Distribution.
The following table sets forth costs and expenses, other than underwriting discounts and commissions, in connection with the sale of shares of our common stock being registered, all of which will be paid by us. All amounts shown are estimates, except for the SEC registration fee, the FINRA filing fee and the Nasdaq listing fee.
| |
Amount | |||
|---|---|---|---|---|
SEC registration fee |
$ | 13,329 | ||
FINRA filing fee |
17,750 | |||
Nasdaq listing fee |
75,000 | |||
Legal fees and expenses |
700,000 | |||
Accounting fees and expenses |
225,000 | |||
Printing fees and expenses |
350,000 | |||
Miscellaneous expenses |
50,000 | |||
| | | | | |
Total |
$ | 1,431,079 | ||
| | | | | |
| | | | | |
| | | | | |
Item 14. Indemnification of Directors and Officers.
Merchants Bancorp ("Merchants") is an Indiana corporation. Merchants' officers and directors are and will be indemnified under Indiana law and the First Amended and Restated Articles of Incorporation of Merchants against certain liabilities. Chapter 37 of the Indiana Business Corporation Law (the "IBCL") requires a corporation, unless limited by its articles of incorporation, to indemnify a director or an officer of the corporation who is wholly successful, on the merits or otherwise, in the defense of any threatened, pending or completed action, suit or proceeding, whether civil, criminal, administrative, or investigative and whether formal or informal, against reasonable expenses, including counsel fees, incurred in connection with the proceeding. Merchants' Amended and Restated Articles of Incorporation do not contain any provision limiting such indemnification.
The IBCL also permits a corporation to indemnify a director, officer, employee, or agent who is made a party to a proceeding because the person was a director, officer, employee, or agent of the corporation against liability incurred in the proceeding if (i) the individual's conduct was in good faith, and (ii) the individual reasonably believed (A) in the case of conduct in the individual's official capacity with the corporation, that the conduct was in the corporation's best interests, and (B) in all other cases, that the individual's conduct was at least not opposed to the corporation's best interests, and (iii) in the case of a criminal proceeding, the individual either (A) had reasonable cause to believe the individual's conduct was lawful, or (B) had no reasonable cause to believe the individual's conduct was unlawful. The IBCL also permits a corporation to pay for or reimburse reasonable expenses incurred before the final disposition of the proceeding and permits a court of competent jurisdiction to order a corporation to indemnify a director or officer if the court determines that the person is fairly and reasonably entitled to indemnification in view of all the relevant circumstances, whether or not the person met the standards for indemnification otherwise provided in the IBCL.
Merchants' First Amended and Restated Articles of Incorporation require it to provide indemnification to its officers and directors to the fullest extent authorized by the IBCL and to pay for or reimburse reasonable expenses incurred before the final disposition of the proceeding as authorized by the IBCL. Merchants' First Amended and Restated Articles of Incorporation also authorize it to maintain insurance at its expense to protect itself and any of its directors, officers, employees or agents or those of another corporation, partnership, joint venture, trust, or other entity against expense, liability or loss, whether or not Merchants would have the power to indemnify such person against such
II-1
expense, liability or loss under the IBCL. Merchants currently maintains officer and director liability insurance.
Reference is made to the form of underwriting agreement to be filed as Exhibit 1.1 hereto for provisions providing that the underwriters are obligated under certain circumstances to indemnify our directors, officers and controlling persons against certain liabilities under the Securities Act of 1933, as amended (the "Securities Act").
Item 15. Recent Sales of Unregistered Securities.
The following sets forth information regarding unregistered securities that were sold within the past three years.
Common Stock Offering. In 2014, we commenced an offering of its common stock. In connection with the offering, in December 2014 and February 2015, we issued an aggregate of 703,700 shares and 407,500 shares, respectively, of common stock to accredited investors. The cash proceeds from the sale of common stock were used for general corporate purposes. The aggregate offering price of the shares of common stock was $11,112,000. Keefe, Bruyette, & Woods, Inc. and City Securities Corporation acted as placement agents and received an aggregate of $371,011 for concessions, fees and expenses related this transaction. The common stock was issued under an exemption from registration pursuant to Section 4(a)(2) of the Securities Act and Rule 506 of Regulation D promulgated thereunder as a transaction by an issuer not involving any public offering.
Preferred Stock Offerings. In December 2015, we issued an aggregate of 10,000 shares of preferred stock to related parties which qualified as accredited investors. The cash proceeds from the sale of preferred stock were used for general corporate purposes. The aggregate offering price of the shares of preferred stock was $10,000,000. No underwriters or placement agents were engaged in the offering. The preferred stock was issued under an exemption from registration pursuant to Section 4(a)(2) of the Securities Act as a transaction by an issuer not involving any public offering.
In 2016, we commenced an offering of its preferred stock. In connection with this offering, in June 2016 and July 2016, we issued an aggregate of 18,525 shares and 13,100 shares, respectively, of preferred stock to accredited and non-accredited investors. The cash proceeds from the sale of preferred stock were used for general corporate purposes. The aggregate offering price of the shares of preferred stock was $31,625,000. No underwriters or placement agents were engaged in the offering. The preferred stock was issued under an exemption from registration pursuant to Section 4(a)(2) of the Securities Act and Rule 506 of Regulation D promulgated thereunder as a transaction by an issuer not involving any public offering.
RICHMAC Funding, LLC Acquisition. In August 2017, we issued an aggregate of 383,271 shares of common stock in exchange for 100% of the equity interests of RICHMAC Funding, LLC pursuant to a Member Interests Purchase Agreement dated June 26, 2017. No underwriters or placement agents were engaged in the offering. The common stock was issued under an exemption from registration pursuant to Section 4(a)(2) of the Securities Act and Rule 506 of Regulation D promulgated thereunder as a transaction by an issuer not involving any public offering.
Item 16. Exhibits and Financial Statement Schedules.
(a) Exhibits. The Exhibit Index at the end of this Registration Statement is incorporated herein by reference.
(b) Financial Statement Schedules. All schedules have been omitted as not applicable or not required under the rules of Regulation S-X.
II-2
The undersigned registrant hereby undertakes to provide to the underwriters at the closing specified in the underwriting agreement certificates in such denominations and registered in such names as required by the underwriters to permit prompt delivery to each purchaser.
Insofar as indemnification for liabilities arising under the Securities Act may be permitted to directors, officers and controlling persons of the registrant pursuant to the foregoing provisions, or otherwise, the registrant has been advised that in the opinion of the SEC such indemnification is against public policy as expressed in the Securities Act and is, therefore, unenforceable. In the event that a claim for indemnification against such liabilities (other than the payment by the registrant of expenses incurred or paid by a director, officer or controlling person of the registrant in the successful defense of any action, suit or proceeding) is asserted by such director, officer or controlling person in connection with the securities being registered, the registrant will, unless in the opinion of its counsel the matter has been settled by controlling precedent, submit to a court of appropriate jurisdiction the question whether such indemnification by it is against public policy as expressed in the Securities Act and will be governed by the final adjudication of such issue.
The undersigned registrant hereby undertakes that:
- (1)
- For
purposes of determining any liability under the Securities Act, the information omitted from the form of prospectus filed as part of this registration statement
in reliance upon Rule 430A and contained in a form of prospectus filed by the registrant pursuant to Rule 424(b)(1) or (4) or 497(h) under the Securities Act shall be deemed to be
part of this registration statement as of the time it was declared effective.
- (2)
- For the purpose of determining any liability under the Securities Act, each post-effective amendment that contains a form of prospectus shall be deemed to be a new registration statement relating to the securities offered therein and the offering of such securities at that time shall be deemed to be the initial bona fide offering thereof.
II-3
II-4
| Exhibit Number |
Description | ||
|---|---|---|---|
| 23.1 | Consent of BKD, LLP. | ||
23.2 |
Consent of Krieg DeVault LLP (included as part of Exhibit 5.1). |
||
24.1 |
* |
Power of Attorney (included on the signature page to the Registration Statement). |
|
- *
- Previously
filed.
- †
- Schedules have been omitted pursuant to Item 601(b)(2) of Regulation S-K. Merchants hereby undertakes to furnish supplementally copies of any of the omitted schedules upon request by the U.S. Securities and Exchange Commission; provided, however, that Merchants may request confidential treatment pursuant to Rule 24b-2 of the Securities Exchange Act of 1934, as amended, for any schedules so furnished.
II-5
Pursuant to the requirements of the Securities Act of 1933, the registrant has duly caused this registration statement to be signed on its behalf by the undersigned, thereunto duly authorized, in the City of Carmel, State of Indiana, on October 16, 2017.
|
MERCHANTS BANCORP | |||
|
By: |
/s/ MICHAEL F. PETRIE |
||
Pursuant to the requirements of the Securities Act of 1933, this registration statement has been signed by the following persons in the capacities and on the dates indicated.
Signature
|
Title
|
Date
|
||||
|---|---|---|---|---|---|---|
/s/ MICHAEL F. PETRIE |
Director (Chairman); Chief Executive Officer (Principal Executive Officer) |
October 16, 2017 |
||||
|
|
|
||||
|
|
|
||||
|
|
|
||||
|
|
|
||||
|
|
|
||||
|
|
|
||||
|
|
|
||||
|
|
|
||||
|
|
|
||||
II-6
Signature
|
Title
|
Date
|
||||
|---|---|---|---|---|---|---|
* |
Director |
October 16, 2017 |
||||
|
|
|
|
|||
II-7