Attached files
| file | filename |
|---|---|
| 8-K - FIRST HORIZON CORP | c89527_8k.htm |
Exhibit 99.1

First Horizon National Corporation Third Quarter 2017 Earnings October 13, 2017
Disclaimers and Other Information 2 Forward - Looking Statements This communication contains certain “forward - looking statements” within the meaning of the Private Securities Litigation Reform Act of 1995 with respect to our beliefs, plans, goals, expectations, and estimates. Forward - looking statements are not a representation of historical information, but instead pertain to future operatio ns, strategies, financial results or other developments. The words “believe,” “expect,” “anticipate,” “intend,” “estimate,” “should,” “is likely,” “will,” “going forward,” and other expressions that indi cat e future events and trends identify forward - looking statements. Forward - looking statements are necessarily based upon estimates and assumptions that are inherently subject to significant busin ess, operational, economic and competitive uncertainties and contingencies, many of which are beyond the control of First Horizon and Capital Bank Financial Corp. (“Capital Bank”), which an nounced a proposed transaction on May 4, 2017, and many of which, with respect to future business decisions and actions, are subject to change. Examples of uncertainties and contingencies include, am ong other important factors: global, general, and local economic and business conditions, including economic recession or depression; expectations of and actual timing and amount of interest rat e m ovements, including the slope and shape of the yield curve, which can have a significant impact on a financial services institution; market and monetary fluctuations, including fluctuations in mo rtg age markets; inflation or deflation; customer, investor, competitor, regulatory, and legislative responses to any or all of these conditions; demand for First Horizon’s and Capital Bank’s produc t o fferings; the actions of the Securities and Exchange Commission (SEC), the Financial Accounting Standards Board (FASB), the Office of the Comptroller of the Currency (OCC), the Board of Governors of t he Federal Reserve System (Federal Reserve), the Federal Deposit Insurance Corporation (FDIC), the Financial Industry Regulatory Authority (FINRA), the U.S. Department of the Treasury (Treas ury ), the Municipal Securities Rulemaking Board (MSRB), the Consumer Financial Protection Bureau (CFPB), the Financial Stability Oversight Council (Council), the Public Company Accounting Oversi ght Board (PCAOB), and other regulators and agencies, including in connection with the regulatory approval process associated with the merger; pending, threatened, or possible future regulatory, administ rat ive, and judicial outcomes, actions, and proceedings; current or future Executive orders; changes in laws and regulations applicable to First Horizon and Capital Bank; the possibility that the prop ose d transaction will not close when expected or at all because required regulatory or other approvals are not received or other conditions to the closing are not satisfied on a timely basis or at a ll; the possibility that the anticipated benefits of the transaction will not be realized when expected or at all, including as a result of the impact of, or problems arising from, the integration of the tw o c ompanies or as a result of the strength of the economy and competitive factors in the areas where First Horizon and Capital Bank do business; the possibility that the transaction may be more expensive to com plete than anticipated, including as a result of unexpected factors or events; diversion of management’s attention from ongoing business operations and opportunities; potential adverse reactions o r c hanges to business or employee relationships, including those resulting from the announcement or completion of the transaction; First Horizon’s and Capital Bank’s success in executing their respect ive business plans and strategies and managing the risks involved in the foregoing; and other factors that may affect future results of First Horizon and Capital Bank. Additional factors that could cause results to differ materially from those contemplated by forward - looking statements can be fo und in First Horizon’s Annual Report on Form 10 - K for the year ended December 31, 2016, and in its subsequent Quarterly Reports on Form 10 - Q filed with the SEC and available in the “Investor Relati ons” section of First Horizon’s website, http://www.firsthorizon.com, under the heading “SEC Filings” and in other documents First Horizon files with the SEC, and in Capital Bank’s Annual Report on Form 10 - K for the year ended December 31, 2016 and in its subsequent Quarterly Reports on Form 10 - Q filed with the SEC and available in the “Investor Relations” section of Capital Bank’s website, w ww.CapitalBank - US.com, under the heading “Financials & Filings” and in other documents Capital Bank files with the SEC. Important Other Information In connection with the proposed transaction, First Horizon has filed with the SEC a Registration Statement on Form S - 4 (No. 333 - 219052) and a definitive Joint Proxy Statement of First Horizon and Capital Bank and a Prospectus of First Horizon, as well as other relevant documents concerning the proposed transaction. The pro posed transaction involving First Horizon and Capital Bank has been approved by First Horizon’s shareholders and Capital Bank’s stockholders, but remains subject to other customary conditions t o c losing. This communication does not constitute an offer to sell or the solicitation of an offer to buy any securities. SHAREHOLDERS OF FIRST HORIZON AND CAPITAL BANK ARE URGED TO READ THE REGISTRA TIO N STATEMENT AND THE JOINT PROXY STATEMENT/PROSPECTUS REGARDING THE TRANSACTION AND ANY OTHER RELEVANT DOCUMENTS FILED WITH THE SEC, AS WELL AS ANY AMENDMENTS OR SUPPLEMENTS TO THOSE DOCUMENTS, BECAUSE THEY DO AND WILL CONTAIN IMPORTANT INFORMATION. Shareholders may obtain a free copy of the definitive joint proxy sta tem ent/prospectus, as well as other filings containing information about First Horizon and Capital Bank, without charge, at the SEC’s website (http://www.sec.gov).

3 Third Quarter 2017 Highlights Good Business Momentum with Strong Loan Growth; Capital Bank Integration on Track All comparisons 3Q17 vs 3Q16, unless otherwise noted. 1 Adjusted EPS, Adjusted ROA, ROTCE and Adjusted ROTCE are Non - GAAP numbers and are reconciled in the appendix. Adjusted numbers e xclude notable items as outlined on slide 15. 2 ROA and ROTCE are annualized numbers. 3 Pre - provision net revenue is not a GAAP number but is used in regulatory stress test reporting. The presentation of PPNR follows the regula tor y definition . Reported EPS / Adj. EPS 1 $ 0.28 / $0.32 ROA / Adj. ROA 1,2 0.99% / 1.08% ROTCE / Adj. ROTCE 1,2 12.2 % / 13.5% 3 Q17 Highlights ▪ Good Business Momentum and Higher Returns ▪ EPS up 4%, Adjusted EPS up 22% 1 ▪ ROTCE up 27 bps, Adjusted ROTCE up 205 bps 1,2 ▪ ROA up 2 bps, Adjusted ROA up 15 bps 1,2 ▪ Strong Loan, Deposit and Net Interest Income Growth ▪ Total average commercial loans up 11 %; average noninterest - bearing deposits up 9% ▪ Net interest income up 13% ▪ Net interest margin at 3.19%, up 23 bps ▪ Regional Banking Growth and Positive Operating Leverage Continue ▪ PPNR up 11% 3 ; Revenue up 7% ▪ Average loans up 9%; Average deposits up 8% ▪ Efficiency ratio improved to 55% ▪ Maintains #1 deposit market share in Tennessee; deposit growth outpaces overall market ▪ Capital Bank Integration on Track ▪ Expected to accelerate achievement of Bonefish goals ▪ Work ongoing to identify cost saves and revenue opportunities ▪ Anticipate 4Q17 merger close, with expected systems conversion in mid - 2018

FINANCIAL RESULTS 4
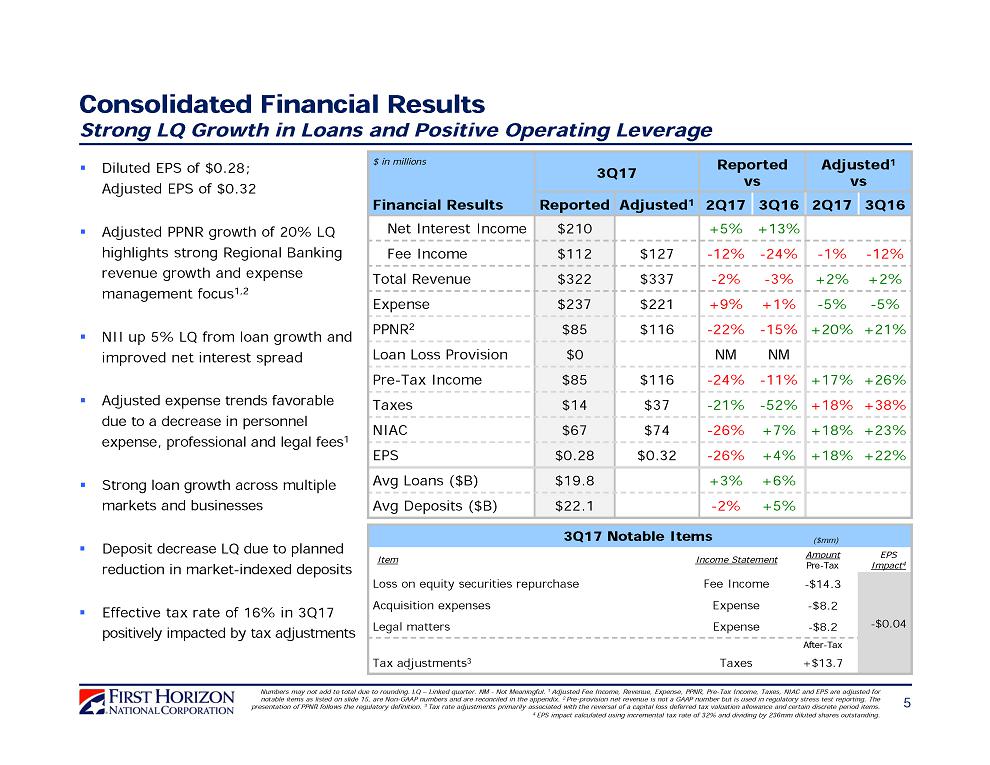
Consolidated Financial Results Strong LQ Growth in Loans and Positive Operating Leverage 5 Numbers may not add to total due to rounding. LQ – Linked quarter. NM - Not Meaningful. 1 Adjusted Fee Income , Revenue, Expense, PPNR, Pre - Tax Income, Taxes, NIAC and EPS are adjusted for notable items as listed on slide 15, are Non - GAAP numbers and are reconciled i n the appendix . 2 Pre - provision net revenue is not a GAAP number but is used in regulatory stress test reporting. The presentation of PPNR follows the regulatory definition . 3 Tax rate adjustments primarily associated with the reversal of a capital loss deferred tax valuation allowance and certain di scr ete period items. 4 EPS impact calculated using incremental tax rate of 32% and dividing by 236mm diluted shares outstanding. ▪ Diluted EPS of $0.28; Adjusted EPS of $0.32 ▪ Adjusted PPNR growth of 20% LQ highlights strong Regional Banking revenue growth and expense management focus 1,2 ▪ NII up 5% LQ from loan growth and improved net interest spread ▪ Adjusted expense trends favorable due to a decrease in personnel expense, professional and legal fees 1 ▪ Strong loan growth across multiple markets and businesses ▪ Deposit decrease LQ due to planned reduction in market - indexed deposits ▪ Effective tax rate of 16% in 3Q17 positively impacted by tax adjustments 3Q17 Notable Items Item Income Statement Amount Pre - Tax EPS Impact 4 Loss on equity securities repurchase Fee Income - $14.3 - $0.04 Acquisition expenses Expense - $8.2 Legal matters Expense - $8.2 After - Tax Tax adjustments 3 Taxes +$13.7 ($mm) $ in millions 3Q17 Reported vs Adjusted 1 vs Financial Results Reported Adjusted 1 2Q17 3Q16 2Q17 3Q16 Net Interest Income $210 +5% +13% Fee Income $112 $127 - 12% - 24% - 1% - 12% Total Revenue $322 $337 - 2% - 3% +2% +2% Expense $237 $221 +9% +1% - 5% - 5% PPNR 2 $85 $116 - 22% - 15% +20% +21% Loan Loss Provision $0 NM NM Pre - Tax Income $85 $116 - 24% - 11% +17% +26% Taxes $14 $37 - 21% - 52% +18% +38% NIAC $67 $74 - 26% +7% +18% +23% EPS $0.28 $0.32 - 26% +4% +18% +22% Avg Loans ($B) $19.8 +3% +6% Avg Deposits ($B) $22.1 - 2% +5%

Business Segment Performance Regional Banking Continues to Drive Consolidated Earnings 6 ($0.07) ($0.07) ($0.07) ($0.02) ($0.07) $0.02 $0.01 $0.02 $0.07 $0.02 $0.04 $0.02 $0.01 $0.02 $0.02 $0.28 $0.27 $0.27 $0.31 $0.31 3Q16 4Q16 1Q17 2Q17 3Q17 Regional Banking Fixed Income Non-Strategic Corporate $0.28 $0.27 $0.23 $0.23 $0.38 ▪ Strong Regional Banking profitability and growth driving majority of company earnings ▪ Fixed Income provides modest, but consistently positive contribution ▪ Average daily revenue at $715k in 3Q17 vs $723k in 2Q17 ▪ Non - Strategic continues to make positive contribution ▪ Corporate segment includes asset liability management, central money book, securities portfolio and institutional expenses Reported EPS Contribution by Segment 1 Numbers may not add to total due to rounding. 1 Segment EPS impacts are Non - GAAP numbers and are reconciled in the appendix. EPS impacts are calculated using segment net income divided by the average diluted shares outstanding in each respective quar ter . Non - Strategic segment includes mortgage repurchase reserve release of $20mm in 2Q17. Corporate reflects $3mm of non - controlling interest and $1.6mm of preferred stock dividends in each quarter.

$185 $196 $190 $201 $210 2.80% 2.90% 3.00% 3.10% 3.20% $170 $180 $190 $200 $210 3Q16 4Q16 1Q17 2Q17 3Q17 NII (left axis) NIM (right axis) 7 NII and NIM Trends Remain Strong Driven by Loan Growth And Continued Funding Optimization ▪ NII up 5% LQ, 13% YOY, driven by: ▪ Average total loan growth of 3% LQ and 6% YOY ▪ Higher short - term rates and improving net interest spread ▪ NIM at 3.19%, up 12 bps LQ due to: ▪ Lower excess cash levels ▪ Higher short - term rates ▪ Net interest spread improves 9 bps LQ ▪ Overall consumer & commercial deposit beta of - 3% LQ NII and NIM Linked - Quarter Change Drivers LQ – Linked Quarter. YOY - Year over Year. Numbers may not add to total due to rounding. 1 NII sensitivity analysis uses FHN’s balance sheet as of 9.30.2017. Bps impact assumes increase in Fed Funds rate. ($ in millions) NII NIM 2Q17 $200.7 3.07% Increased Loan Balances +$5.3 - Higher Rates +$2.6 +4bp More Days in 3Q +$1.7 - Increase in Fixed Income Loan HFS & Trading Inventory +$1.5 +3bp Lower Excess Cash Balances +$0.0 +7bp Other - $2.0 - 2bp 3Q17 $209.8 3.19% Loan Growth and Higher Rates Drive NII and NIM Improvement Net Interest Income Sensitivity Impact 1 $210 mm NII +13% +1.0% +$9mm +2.1% +$17mm +4.1% +$34mm 0% 1% 2% 3% 4% 5% +25bps +50bps +100bps

$ in millions 3Q17 Reported vs Adjusted 2 vs Financial Results Reported Adjusted 2 2Q17 3Q16 2Q17 3Q16 Net Interest Income $209 +4% +10% Fee Income $64 - 1% - 1% Total Revenue $274 +3% +7% Expense $150 $146 - 1% +4% - 4% - 2% PPNR 1 $123 $128 +8% +11% +12% +20% Loan Loss Provision $9 NM * Pre - Tax Income $115 $119 +1% +12% +5% +22% NIAC $73 $76 +1% +13% +5% +22% Efficiency Ratio 55% 53% - 234 bps - 176 bps - 386 bps - 505 bps Average Loans ($B) $18.4 +4% +9% Average Deposits ($B) $20.1 * +8% 8 Numbers may not add to total due to rounding. LQ – Linked Quarter. YOY - Year over Year. * - less than 1%. 1 Pre - provision net revenue is not a GAAP number but is used in regulatory stress test reporting. The presentation of PPNR follows the regulatory definition. 2 Adjusted Expense, PPNR, Pre - Tax Income, NIAC and Efficiency Ratio a re adjusted for notable items as listed on slide 15, are Non - GAAP numbers and are reconciled i n the appendix . ▪ Adjusted PPNR up 12% LQ, 20% YOY, demonstrating improved operating leverage ▪ Revenue up 3% LQ, 7% YOY ▪ NII up 4% LQ and 10% YOY, driven by loan growth in specialty banking areas ▪ Pre - tax income steady LQ, up 12% YOY; adjusted pre - tax income up 5% LQ and 22% YOY ▪ Adjusted efficiency ratio at 53% in 3Q17, improvement of 386 bps LQ and 505 bps YOY from continuing focus on disciplined growth and expense control ▪ Average loans up 4% LQ, up 9% YOY, maintaining disciplined underwriting and emphasis on economic profitability Strong Regional Banking Profitability and Growth Led by Continued Balance Sheet Growth Driving Higher NII and Efficiency Gains Strong YOY Average Deposit and Loan Growth $18. 6B $20. 1B 3Q16 3Q17 +8% Average Deposits $16. 8B $18. 4B 3Q16 3Q17 +9% Average Loans
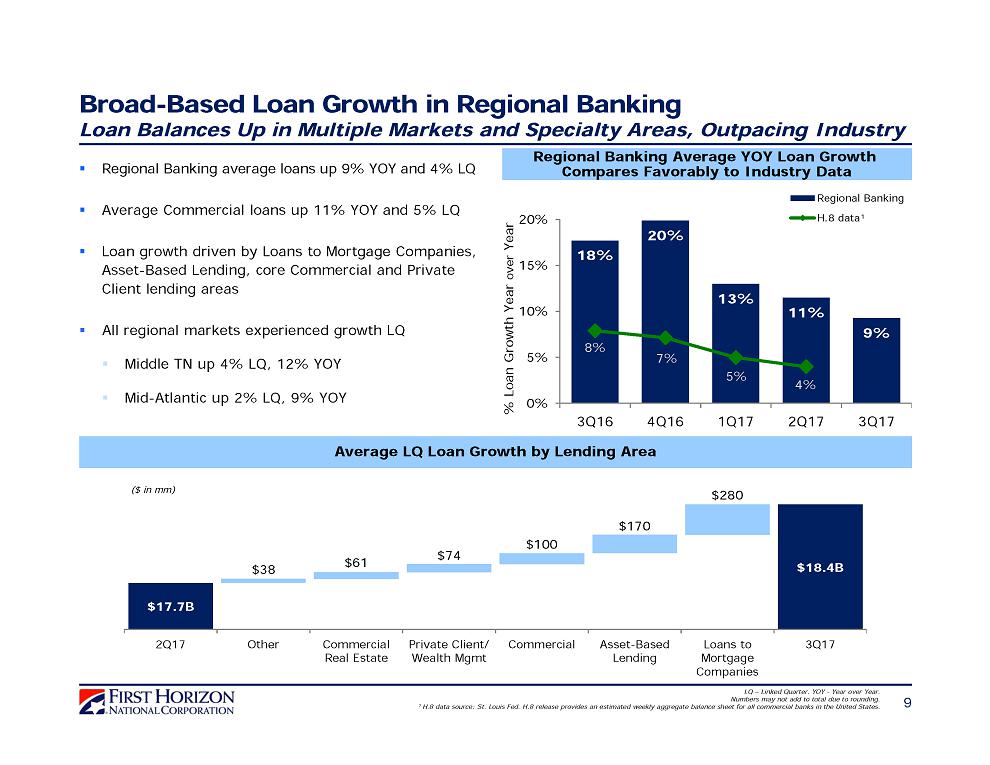
9 Broad - Based Loan Growth in Regional Banking Loan Balances Up in Multiple Markets and Specialty Areas, Outpacing Industry LQ – Linked Quarter. YOY - Year over Year. Numbers may not add to total due to rounding. 1 H.8 data source: St. Louis Fed. H.8 release provides an estimated weekly aggregate balance sheet for all commercial banks in the United States. ▪ Regional Banking average loans up 9% YOY and 4% LQ ▪ Average Commercial loans up 11% YOY and 5 % LQ ▪ Loan growth driven by Loans to Mortgage Companies, Asset - Based Lending, core Commercial and Private Client lending areas ▪ All regional markets experienced growth LQ ▪ Middle TN up 4% LQ, 12% YOY ▪ Mid - Atlantic up 2% LQ, 9% YOY Regional Banking Average YOY Loan Growth Compares Favorably to Industry Data Average LQ Loan Growth by Lending Area $17.7B $18.4B 2Q17 Other Commercial Real Estate Private Client/ Wealth Mgmt Commercial Asset-Based Lending Loans to Mortgage Companies 3Q17 $38 $61 $74 $100 $170 $280 ($ in mm) 18% 20% 13% 11% 9% 8% 7% 5% 4% 0% 5% 10% 15% 20% 3Q16 4Q16 1Q17 2Q17 3Q17 Regional Banking H.8 data¹ % Loan Growth Year over Year

10 Segment Allowance for Loan Losses $151 $154 $156 $153 $156 $50 $48 $46 $44 $39 0.5% 0.7% 0.9% 1.1% 1.3% 1.5% $100 $140 $180 $220 3Q16 4Q16 1Q17 2Q17 3Q17 Regional Banking Non-Strategic Consolidated Ratio (Right Axis) Net Charge - Offs Asset Quality Remains Excellent S table Credit Trends Reflect Strong Underwriting Discipline -0.05% 0.00% 0.05% 0.10% 0.15% 0.20% -$3 $0 $3 $6 $9 3Q16 4Q16 1Q17 2Q17 3Q17 NCOs $ Provision $ NCO %¹ (Right Axis) $9mm ▪ Regional Banking allowance to loans ratio stable while Non - Strategic ratio decreasing ▪ NPAs decreased 3% LQ and 19% YOY ▪ Net charge - offs of $2mm in 3Q17 vs $3mm in 2Q17 and $2mm in 3Q16 ▪ Commercial (C&I and CRE) net charge - offs were $2.8mm for the quarter ▪ Gross charge - offs were $3.7mm with recoveries of $ 0.9mm Numbers may not add to total due to rounding. LQ – Linked Quarter. YOY - Year over Year. 1 Net charge - off % is annualized and as % of average loans. 2 NPAs as % of period - end loans + OREO and 30+ Del as % of period - end loans. Asset Quality Highlights $202 $202 $202 $197 $195 ($ in millions) 3Q16 4Q16 1Q17 2Q17 3Q17 Provision/ (Credit) $4 - ($1) ($2) - Charge - offs $10 $11 $8 $10 $11 Recoveries ($8) ($12) ($9) ($7) ($8) Net Charge - Offs/ (Recoveries) $2 ($1) ($1) $3 $2 $220mm

Capital Bank Integration on Track 11 Integration Progress ▪ Integration team formed with leads from both organizations in all functional areas ▪ Target Operating Models developed for all lines of business and departments ▪ Talent from both organizations identified for top three tiers of organization ▪ Cost save and revenue opportunity identification in process 2Q17 2H17 1H18 2019 ▪ Regulatory applications & S - 4 filed ▪ Employee communications & integration planning begin ▪ Shareholder approval received ▪ Anticipated deal close in 4Q17 ▪ Agreement to divest 2 branches with DOJ and Fed ▪ Branding transition ▪ Systems conversion ▪ Fully - phased in cost saves realized ▪ Focus on achieving revenue synergies Anticipated Integration Timeline

12 3Q17 Reported (GAAP) Adjusted 3 Long - Term Targets ROTCE 1 12.2% 13.5% 15.0%+ ROA 1 0.99% 1.08% 1.10 – 1.30% CET1 2 10.0% 8.0 – 9.0% NIM 1 3.19% 3.25 – 3.50% NCO / Average Loans 1 0.05% 0.20 - 0.60% Fee Income / Revenue 35% 30 - 40% Efficiency Ratio 74% 66% 60 - 65% 1 ROTCE, ROA, NIM, and NCO / Average Loans are annualized. ROTCE is a Non - GAAP number and reconciled in the appendix. 2 Current quarter is an estimate. 3 Adjusted ROTCE, ROA and Efficiency Ratio are Non - GAAP and are reconciled to the comparative GAAP numbers ROE, ROA and Efficiency Ratio in the appendix. Building Long - Term Earnings Power: Bonefish Targets Focused on Growing Our Company Selectively and Profitably While Positioning Our Balance Sheet for Sustainable, Higher Returns in the Long Term Risk Adjusted Margin Total Assets Earning Assets Pre-tax Income Tax Rate Annualized Net Charge-Offs 0.20% - 0.60% % Fee Income 30% - 40% Efficiency Ratio 60% - 65% Return on Tangible Common Equity 15%+ Equity / Assets Common Equity Tier 1 8% - 9% Return on Assets 1.10% - 1.30% Net Interest Margin 3.25% - 3.50%
13 Building the Foundation for Attractive Long - Term Earnings Power ▪ Good business momentum with strong loan growth ▪ Expanding banking relationships with emphasis on economic profit ▪ Continuing to grow balance sheet profitably and prudently ▪ Focusing on expense discipline, improving operating leverage ▪ Optimizing use of capital deployment ▪ Capital Bank merger integration on track Successfully Executing on Key Priorities FHN Is Well Positioned For Attractive Long - Term Earnings Power
APPENDIX 14
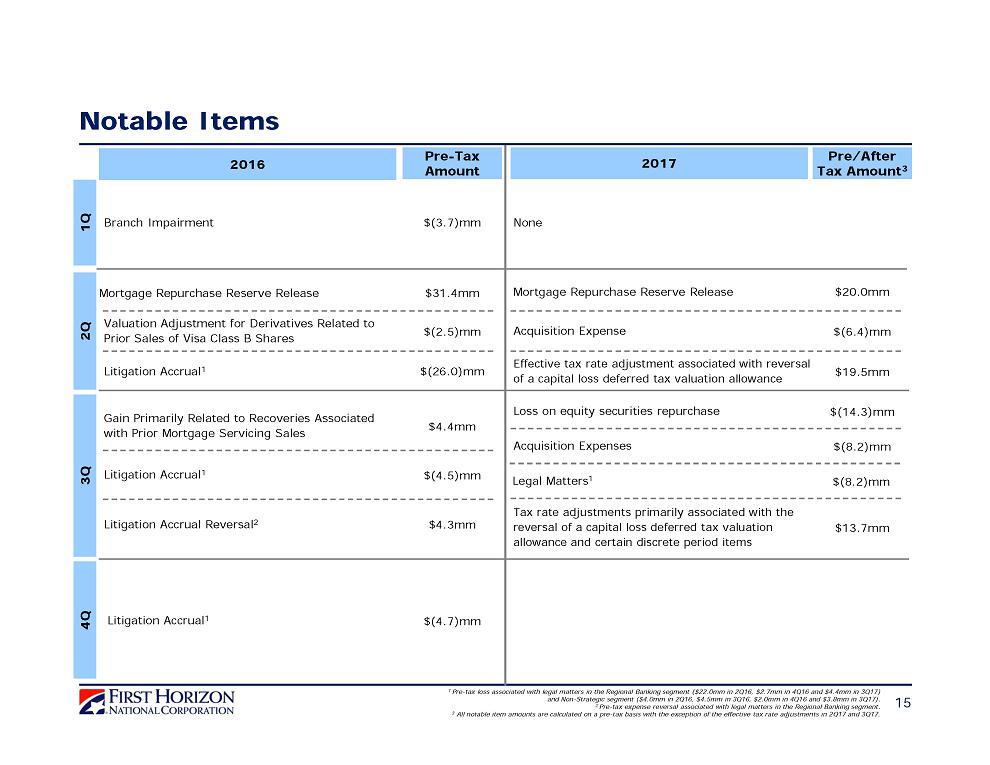
Notable Items 15 1Q 2Q 3Q 1 Pre - tax loss associated with legal matters in the Regional Banking segment ($22.0mm in 2Q16, $2.7mm in 4Q16 and $4.4mm in 3Q17) and Non - Strategic segment ($4.0mm in 2Q16, $4.5mm in 3Q16, $2.0mm in 4Q16 and $3.8mm in 3Q17). 2 Pre - tax expense reversal associated with legal matters in the Regional Banking segment. 3 All notable item amounts are calculated on a pre - tax basis with the exception of the effective tax rate adjustments in 2Q17 and 3Q17. 4Q 2016 Pre - Tax Amount Branch Impairment $(3.7)mm $(26.0)mm Litigation Accrual 1 Valuation Adjustment for Derivatives Related to Prior Sales of Visa Class B Shares $(2.5)mm $4.4mm Gain Primarily Related to Recoveries Associated with Prior Mortgage Servicing Sales Litigation Accrual 1 Litigation Accrual Reversal 2 $(4.5)mm $4.3mm Litigation Accrual 1 $(4.7)mm 2017 Pre/After Tax Amount 3 None $20.0mm Mortgage Repurchase Reserve Release Effective tax rate adjustment associated with reversal of a capital loss deferred tax valuation allowance $19.5mm Acquisition Expense $(6.4)mm Mortgage Repurchase Reserve Release $31.4mm $(14.3)mm Loss on equity securities repurchase Acquisition Expenses $(8.2)mm $13.7mm Tax rate adjustments primarily associated with the reversal of a capital loss deferred tax valuation allowance and certain discrete period items Legal Matters 1 $(8.2)mm

16 Strengthens Hold of #1 Deposit Market Share in Tennessee First Tennessee Bank Grew Deposits Faster Than Overall Footprint Market Source: FDIC. Data as of 6.30.17. Numbers and percentages may not add to total due to rounding. Regional markets include only co unties in which First Tennessee operates financial centers . 1 West Tennessee total includes market - indexed deposits. 2 West Tennessee and East Tennessee markets include $0.6B of deposits in Mississippi and Georgia within the Memphis and Chattan oog a metropolitan statistical areas. Those deposits are not included in the Tennessee state total. FDIC Deposit Market Share Market Rank Market FHN Market Share 2017 FHN Deposits YOY Deposit Growth 2017 2016 FHN Overall Market #1 Tennessee 14.4% 14.3% $21.3B 1 #1 West Tennessee 1 34.3% 34.8% $10.0B 2 5.3% 6.7% #1 East Tennessee 22.4% 21.6% $7.5B 2 7.8% 4.0% #5 Middle Tennessee 7.8% 7.5% $4.4B 2 14.6% 10.2% 6.7% 7.7%

17 3 Q17 Credit Quality Summary by Portfolio Numbers may not add to total due to rounding. Data as of 9.30.2017. NM - Not meaningful. 1 Credit card, Permanent Mortgage, and Other. 2 Credit card, OTC, and Other Consumer. 3 Non - performing loan % excludes held - for - sale loans. 4 Net charge - offs are annualized. 5 Exercised clean - up calls on jumbo securitizations in 1Q13, 3Q12, 2Q11, and 4Q10, which are now on balance sheet in the Corporate segment. ($ in millions) CRE HE & HELOC Other 1 Total Permanent Mortgage Commercial (C&I & Other) HE & HELOC Permanent Mortgage Other 2 Total Period End Loans $12,373 $2,251 $3,714 $450 $18,788 $58 $419 $656 $239 $6 $20,166 30+ Delinquency 0.28% 0.02% 0.38% 0.85% 0.28% 4.22% - 2.80% 1.20% 1.44% 0.38% Dollars $34 $0 $14 $4 $52 $2 - $18 $3 $0 $76 NPL 3 % 0.13% 0.07% 0.61% 0.10% 0.22% 3.75% 0.74% 8.26% 10.39% 1.92% 0.62% Dollars $16 $2 $23 $0 $41 $2 $3 $54 $25 $0 $125 Net Charge-offs 4 % 0.10% NM 0.04% 2.19% 0.12% NM NM NM NM 1.14% 0.05% Dollars $3 ($0) $0 $2 $6 NM ($0) ($3) ($0) $0 $2 Allowance $97 $30 $17 $13 $156 NM $1 $24 $13 $0 $195 Allowance / Loans % 0.78% 1.32% 0.46% 2.79% 0.83% NM 0.32% 3.66% 5.62% 0.69% 0.97% Allowance / Net Charge-offs 7.83x NM 11.04x 1.27x 6.85x NM NM NM NM 0.60x 20.55x Commercial (C&I & Other) FHNC Regional Banking Corporate 5 Non-Strategic

18 Solid Core Deposit Base Provides Funding Advantage Asset Sensitivity Remains Intact Data as of 9.30.2017 , unless otherwise noted. Numbers/Percentages may not add to total due to rounding . 1 Deposit beta equals change in average interest rate paid divided by change in average Fed funds rate. ▪ Total average deposits up 5% YOY, down 2% LQ, represent 85% of total funding ▪ YOY increase primarily from commercial DDA and retail deposit growth ▪ LQ decrease due to reduction in market - indexed deposits ▪ Regional bank average deposits up 8% YOY, flat LQ ▪ Total deposit beta improved from 22% in 2Q17 to 11% in 3Q17 ▪ Overall consumer and commercial deposit beta of - 3% LQ ▪ Overall deposit beta from 3Q15 to 3Q17 is 24%; total deposit beta over rate cycle assumed at 40% Total Average Deposit Beta Overview Average Deposit Composition [CELLRANG E] [CELLRANG E] [CELLRANG E] [CELLRANG E] [CELLRANG E] [CELLRANG E] [CELLRANG E] [CELLRANG E] [CELLRANG E] [CELLRANG E] [CELLRANG E] [CELLRANG E] [CELLRANG E] [CELLRANG E] [CELLRANG E] [CELLRANG E] [CELLRANG E] [CELLRANG E] [CELLRANG E] [CELLRANG E] $0B $5B $10B $15B $20B $25B 3Q16 4Q16 1Q17 2Q17 3Q17 Consumer Interest Non-Interest Market-Indexed Commercial Interest Rate Paid Beta 1 2Q17 3Q17 Consumer Interest 0.23 0.22 - 9% Commercial Interest 0.62 0.69 30% Market - Indexed 0.94 1.16 103% Non - Interest - - - Total Deposits 0.34 0.36 11%

19 Select C&I and CRE Portfolio Metrics Data as of 9.30.2017. Numbers may not add to total due to rounding. CRE retail exposure categories defined in the appendix. CRE: Retail Portfolio CRE: Collateral Type CRE: Geographic Distribution Retail 22% [CATE GORY NAME] [VALU E] TN 27% NC 20% TX 12% Industrial 12% Office 18% Land 1% Multi - Family 31% Other 20% GA 11% SC 6% Regional Banking 3Q17 Average Commercial Loans Healthcare 3% Correspondent 3% Energy 1% Specialty Lending Areas Commercial Real Estate 16% Loans to Mortgage Companies 14% Franchise Finance 5% Commercial 32% Asset - Based Lending 13% Anchor ed 35% Single - Tenant 22% Unanc hored 16% Shado w Anchor ed 19% Power Center 8% Loans to Mortgage Companies Volume Remains Strong $2.5 $2.0 $1.5 $2.1 $2.0 $2.2 $2.2 $1.3 $1.6 $1.9 3Q16 4Q16 1Q17 2Q17 3Q17 PE Balance Avg Balance ($B)
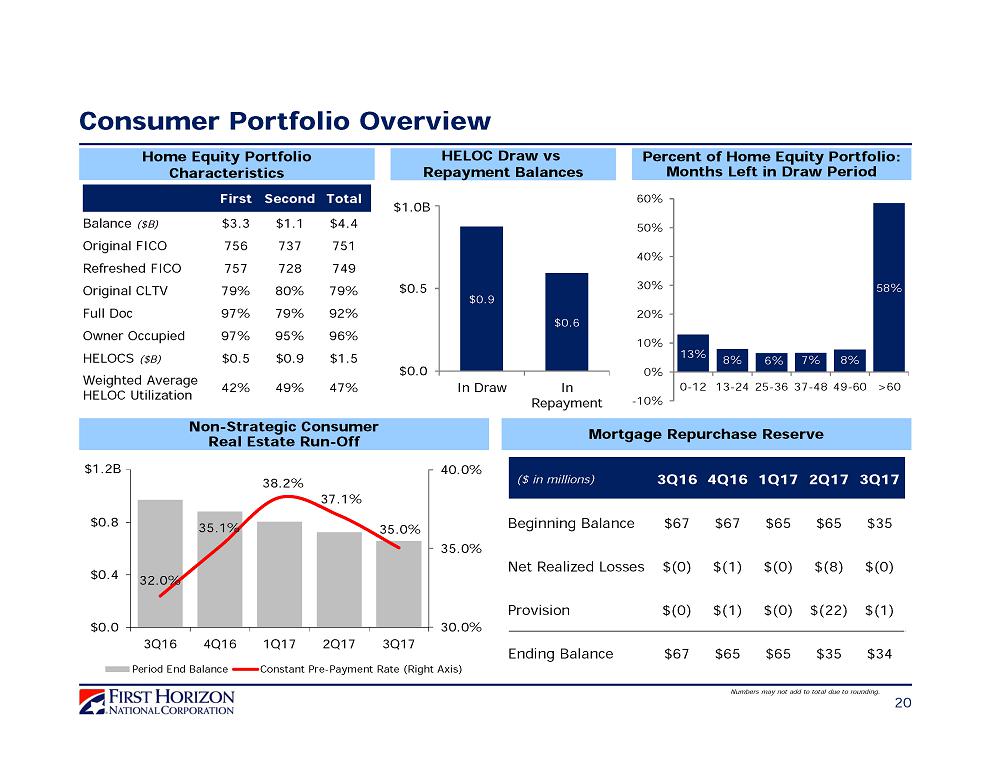
20 Consumer Portfolio Overview $0.9 $0.6 $0.0 $0.5 $1.0 In Draw In Repayment HELOC Draw vs Repayment Balances Percent of Home Equity Portfolio: Months Left in Draw Period 13% 8% 6% 7% 8% 58% -10% 0% 10% 20% 30% 40% 50% 60% 0-12 13-24 25-36 37-48 49-60 >60 Home Equity Portfolio Characteristics 32.0% 35.1% 38.2% 37.1% 35.0% 30.0% 35.0% 40.0% $0.0 $0.4 $0.8 $1.2 3Q16 4Q16 1Q17 2Q17 3Q17 Period End Balance Constant Pre-Payment Rate (Right Axis) Non - Strategic Consumer Real Estate Run - Off $1.2B $1.0B Numbers may not add to total due to rounding. ($ in millions) 3Q16 4Q16 1Q17 2Q17 3Q17 Beginning Balance $67 $67 $65 $65 $35 Net Realized Losses $(0) $(1) $(0) $(8) $(0) Provision $(0) $(1) $(0) $(22) $(1) Ending Balance $67 $65 $65 $35 $34 Mortgage Repurchase Reserve First Second Total Balance ($B) $3.3 $1.1 $4.4 Original FICO 756 737 751 Refreshed FICO 757 728 749 Original CLTV 79% 80% 79% Full Doc 97% 79% 92% Owner Occupied 97% 95% 96% HELOCS ($B) $0.5 $0.9 $1.5 Weighted Average HELOC Utilization 42% 49% 47%

Reconciliation to GAAP Financials 21 Slides in this presentation use non - GAAP information of return on tangible common equity and segment earnings per share. That information is not presented according to generally accepted accounting principles (GAAP ) and is reconciled to GAAP information below. Numbers may not add to total due to rounding. YOY – Year over Year. Retail CRE Type Definitions Anchored: Multi tenant property having one or more retail tenant and several smaller regional and/or local tenants Shadow Anchored: Multi tenant retail property on a parcel legally separate from that occupied by an adjacent anchor tenant Unanchored: Unanchored Retail Strip or Outlet Center, similar to shadow anchored retail except they lack an adjacent anchor tenant Single Tenant: Free standing building leased and occupied by a Single Credit Tenant Power Center: Typically , an open retail property containing at least 250,000 square feet and dominated by at least 75% large big box anchor retailers ($ in millions) YOY Return on Tangible Common Equity (ROTCE) 3Q17 3Q16 Change Average Total Equity (GAAP) $2,867 $2,718 Less: Average Noncontrolling Interest (GAAP) $295 $295 Less: Preferred Stock (GAAP) $96 $96 Average Common Equity (GAAP) (a) $2,476 $2,327 Less: Average Intangible Assets (GAAP) $281 $214 Average Tangible Common Equity (Non-GAAP) (b) $2,195 $2,113 Annualized Net Income Available to Common (GAAP) (c) $267 $251 Return on Average Common Equity (ROE) (GAAP) (c/a) 10.8% 10.8% * Return on Average Tangible Common Equity (ROTCE) (Non-GAAP) (c/b) 12.2% 11.9% 0.27% Regional Banking Net Income (GAAP) (a) $73 $73 $65 $63 $65 Fixed Income Net Income (GAAP) (b) $6 $4 $2 $4 $10 Non-Strategic Net Income (GAAP) (c) $6 $16 $4 $3 $4 Corporate Net Income (GAAP) ($13) $2 ($12) ($12) ($11) Less: Net Income Attributable to Noncontrolling Interest and Preferred Stock Dividends (GAAP) $4 $4 $4 $4 $4 Corporate Net Income Available to Common Shareholders (Non-GAAP) (d) ($18) ($2) ($17) ($17) ($16) Net Income Available to Common Shareholders (GAAP) $67 $91 $54 $53 $63 Average Diluted Shares in Millions (GAAP) (e) 236 236 237 236 234 Regional Banking Earnings Per Share (Non-GAAP) (a/e) $0.31 $0.31 $0.27 $0.27 $0.28 Fixed Income Earnings Per Share (Non-GAAP) (b/e) $0.02 $0.02 $0.01 $0.02 $0.04 Non-Strategic Earnings Per Share (Non-GAAP) (c/e) $0.02 $0.07 $0.02 $0.01 $0.02 Corporate Earnings Per Share (Non-GAAP) (d/e) ($0.07) ($0.02) ($0.07) ($0.07) ($0.07) Total Earnings Per Share (GAAP) $0.28 $0.38 $0.23 $0.23 $0.27 Segment Earnings Per Share 3Q17 2Q17 1Q17 4Q16 3Q16
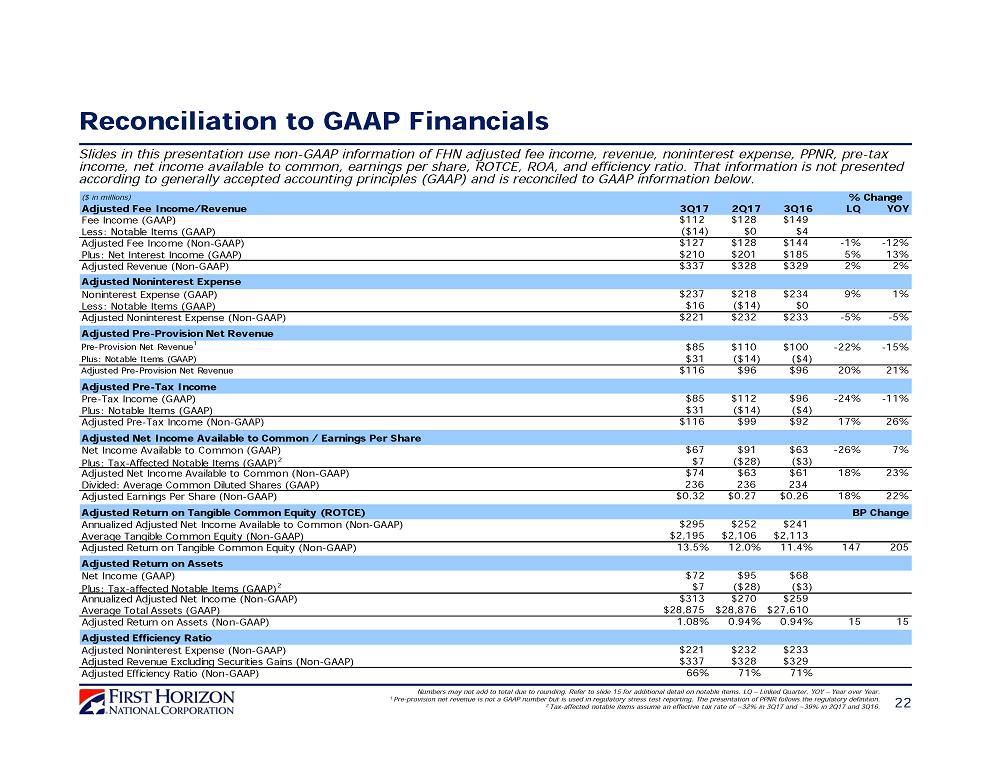
Reconciliation to GAAP Financials 22 Slides in this presentation use non - GAAP information of FHN adjusted fee income, revenue, noninterest expense, PPNR, pre - tax income, net income available to common, earnings per share, ROTCE, ROA, and efficiency ratio. That information is not presented according to generally accepted accounting principles (GAAP ) and is reconciled to GAAP information below. Numbers may not add to total due to rounding. Refer to slide 15 for additional detail on notable items. LQ – Linked Quarter. YOY – Year over Year. 1 Pre - provision net revenue is not a GAAP number but is used in regulatory stress test reporting. The presentation of PPNR follows the regulatory definition. 2 Tax - affected notable items assume an effective tax rate of ~32% in 3Q17 and ~39% in 2Q17 and 3Q16. ($ in millions) Adjusted Fee Income/Revenue 3Q17 2Q17 3Q16 LQ YOY Fee Income (GAAP) $112 $128 $149 Less: Notable Items (GAAP) ($14) $0 $4 Adjusted Fee Income (Non-GAAP) $127 $128 $144 -1% -12% Plus: Net Interest Income (GAAP) $210 $201 $185 5% 13% Adjusted Revenue (Non-GAAP) $337 $328 $329 2% 2% Adjusted Noninterest Expense Noninterest Expense (GAAP) $237 $218 $234 9% 1% Less: Notable Items (GAAP) $16 ($14) $0 Adjusted Noninterest Expense (Non-GAAP) $221 $232 $233 -5% -5% Adjusted Pre-Provision Net Revenue Pre-Provision Net Revenue 1 $85 $110 $100 -22% -15% Plus: Notable Items (GAAP) $31 ($14) ($4) Adjusted Pre-Provision Net Revenue $116 $96 $96 20% 21% Adjusted Pre-Tax Income Pre-Tax Income (GAAP) $85 $112 $96 -24% -11% Plus: Notable Items (GAAP) $31 ($14) ($4) Adjusted Pre-Tax Income (Non-GAAP) $116 $99 $92 17% 26% Adjusted Net Income Available to Common / Earnings Per Share Net Income Available to Common (GAAP) $67 $91 $63 -26% 7% Plus: Tax-Affected Notable Items (GAAP) 2 $7 ($28) ($3) Adjusted Net Income Available to Common (Non-GAAP) $74 $63 $61 18% 23% Divided: Average Common Diluted Shares (GAAP) 236 236 234 Adjusted Earnings Per Share (Non-GAAP) $0.32 $0.27 $0.26 18% 22% Adjusted Return on Tangible Common Equity (ROTCE) Annualized Adjusted Net Income Available to Common (Non-GAAP) $295 $252 $241 Average Tangible Common Equity (Non-GAAP) $2,195 $2,106 $2,113 Adjusted Return on Tangible Common Equity (Non-GAAP) 13.5% 12.0% 11.4% 147 205 Adjusted Return on Assets Net Income (GAAP) $72 $95 $68 Plus: Tax-affected Notable Items (GAAP) 2 $7 ($28) ($3) Annualized Adjusted Net Income (Non-GAAP) $313 $270 $259 Average Total Assets (GAAP) $28,875 $28,876 $27,610 Adjusted Return on Assets (Non-GAAP) 1.08% 0.94% 0.94% 15 15 Adjusted Efficiency Ratio Adjusted Noninterest Expense (Non-GAAP) $221 $232 $233 Adjusted Revenue Excluding Securities Gains (Non-GAAP) $337 $328 $329 Adjusted Efficiency Ratio (Non-GAAP) 66% 71% 71% % Change BP Change
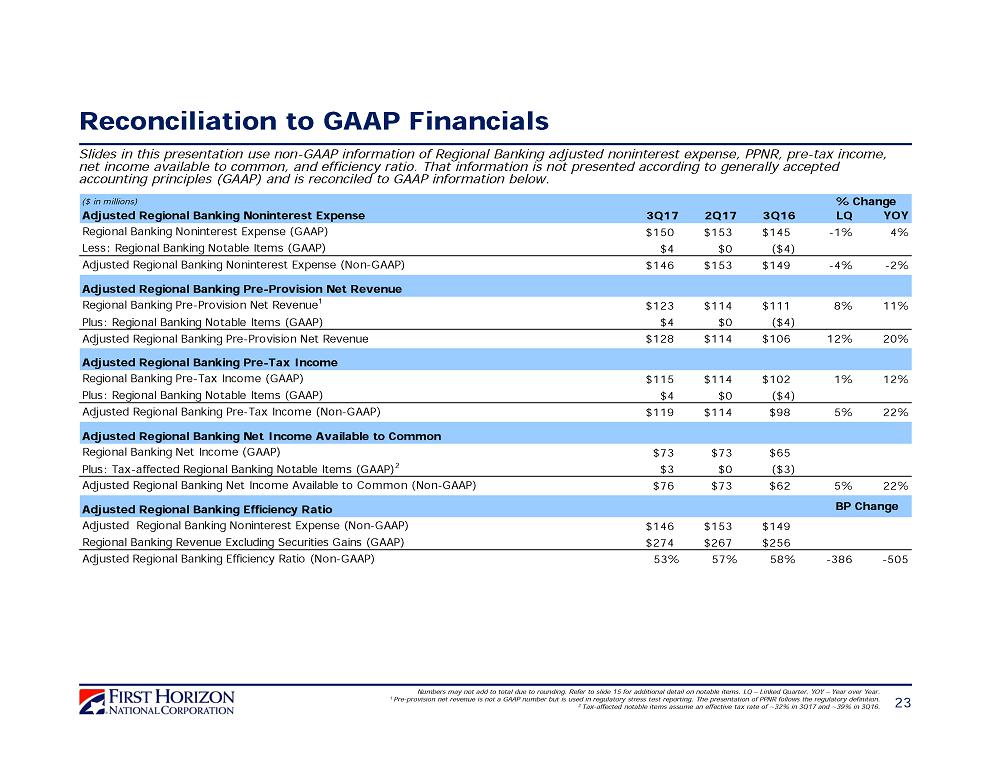
Reconciliation to GAAP Financials 23 Slides in this presentation use non - GAAP information of Regional Banking adjusted noninterest expense, PPNR, pre - tax income, net income available to common, and efficiency ratio. That information is not presented according to generally accepted accounting principles (GAAP ) and is reconciled to GAAP information below. Numbers may not add to total due to rounding. Refer to slide 15 for additional detail on notable items. LQ – Linked Quarter. YOY – Year over Year. 1 Pre - provision net revenue is not a GAAP number but is used in regulatory stress test reporting. The presentation of PPNR follows the regulatory definition. 2 Tax - affected notable items assume an effective tax rate of ~32% in 3Q17 and ~39% in 3Q16. ($ in millions) Adjusted Regional Banking Noninterest Expense 3Q17 2Q17 3Q16 LQ YOY Regional Banking Noninterest Expense (GAAP) $150 $153 $145 -1% 4% Less: Regional Banking Notable Items (GAAP) $4 $0 ($4) Adjusted Regional Banking Noninterest Expense (Non-GAAP) $146 $153 $149 -4% -2% Adjusted Regional Banking Pre-Provision Net Revenue Regional Banking Pre-Provision Net Revenue 1 $123 $114 $111 8% 11% Plus: Regional Banking Notable Items (GAAP) $4 $0 ($4) Adjusted Regional Banking Pre-Provision Net Revenue $128 $114 $106 12% 20% Adjusted Regional Banking Pre-Tax Income Regional Banking Pre-Tax Income (GAAP) $115 $114 $102 1% 12% Plus: Regional Banking Notable Items (GAAP) $4 $0 ($4) Adjusted Regional Banking Pre-Tax Income (Non-GAAP) $119 $114 $98 5% 22% Regional Banking Net Income (GAAP) $73 $73 $65 Plus: Tax-affected Regional Banking Notable Items (GAAP) 2 $3 $0 ($3) Adjusted Regional Banking Net Income Available to Common (Non-GAAP) $76 $73 $62 5% 22% Adjusted Regional Banking Efficiency Ratio Adjusted Regional Banking Noninterest Expense (Non-GAAP) $146 $153 $149 Regional Banking Revenue Excluding Securities Gains (GAAP) $274 $267 $256 Adjusted Regional Banking Efficiency Ratio (Non-GAAP) 53% 57% 58% -386 -505 BP Change Adjusted Regional Banking Net Income Available to Common % Change