Attached files
| file | filename |
|---|---|
| 8-K - 8-K - TABLE TRAC INC | tv476869_8k.htm |
Exhibit 99.1

Table Trac , Inc. 2017 Shareholder Meeting October 12, 2017

Certain statements that may be made today will be considered “forward looking” as that term is defined under the rules of the Securities and Exchange Commission (SEC), and are therefore subject to the safe harbor created by such rules . Although the Company believes the expectations reflected in any forward looking information and statements are reasonable, such forward looking information and statements involve risks and uncertainties that could lead actual results to differ from those contained in today’s presentation materials and discussion . The general factors impacting future results are discussed in detail in the Company’s SEC filings, The forward looking information and statements in this presentation speak only as of the date hereof and the Company undertakes no obligation to update the information contained in this report unless required by law . Table Trac , Inc. (OTCQB: TBTC) Safe Harbor Statement
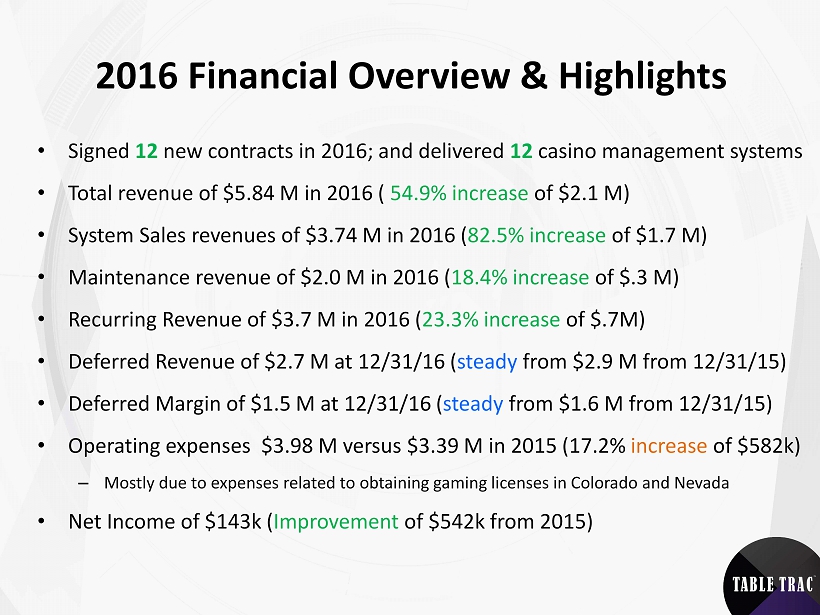
2016 Financial Overview & Highlights • Signed 12 new contracts in 2016; and delivered 12 casino management systems • Total revenue of $5.84 M in 2016 ( 54.9% increase of $2.1 M) • System Sales revenues of $3.74 M in 2016 ( 82.5% increase of $1.7 M ) • Maintenance revenue of $2.0 M in 2016 ( 18.4% increase of $.3 M) • Recurring Revenue of $ 3.7 M in 2016 ( 23.3% increase of $.7M) • Deferred Revenue of $2.7 M at 12/31/16 ( steady from $2.9 M from 12/31/15) • Deferred Margin of $1.5 M at 12/31/16 ( steady from $1.6 M from 12/31/15) • Operating expenses $3.98 M versus $3.39 M in 2015 (17.2% i ncrease of $582k) – Mostly due to expenses related to obtaining gaming licenses in Colorado and Nevada • Net Income of $143k ( Improvement of $542k from 2015)
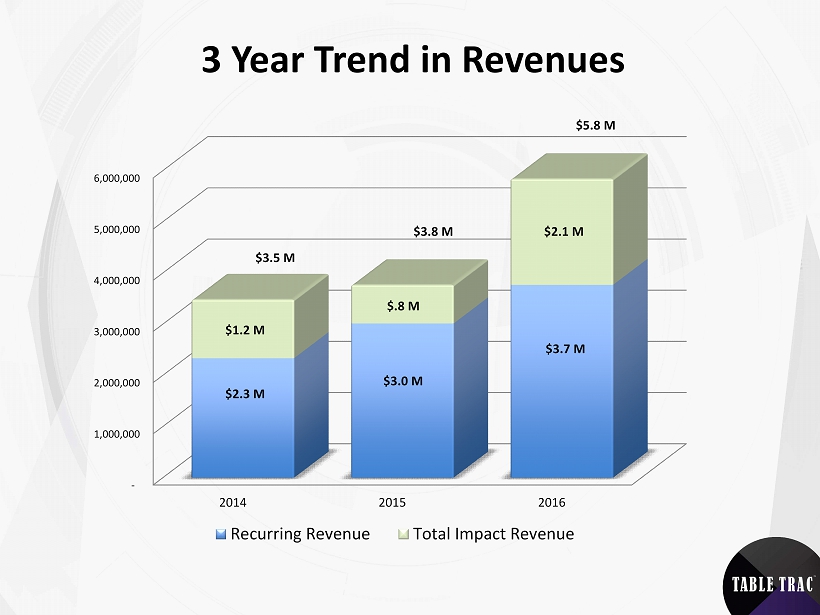
3 Year Trend in Revenues - 1,000,000 2,000,000 3,000,000 4,000,000 5,000,000 6,000,000 2014 2015 2016 Recurring Revenue Total Impact Revenue $1.2 M $5.8 M $3.8 M $3.5 M $3.7 M $3.0 M $2.3 M $.8 M $2.1 M

Recurring Revenues – Maintenance vs. System - 500,000 1,000,000 1,500,000 2,000,000 2,500,000 3,000,000 3,500,000 4,000,000 2014 2015 2016 Maintenance Revenue System Sales - Month to Month Revenue $1.3 M $ 3.0 M $1.7 M $1.3 M $1.0 M $2.0 M $1.7 M $ 3.7 M $2.3 M

Recurring Revenues / Cash vs. Operating Expenses - 500,000 1,000,000 1,500,000 2,000,000 2,500,000 3,000,000 3,500,000 4,000,000 2014 2015 2016 Recurring Revenues / Cash Receipts Total Operating Expenses $2.3 M $ 3.0 M $2.9 M $ 3.4 M $4.0 M $ 3.7 M

2017 Year To Date Highlights
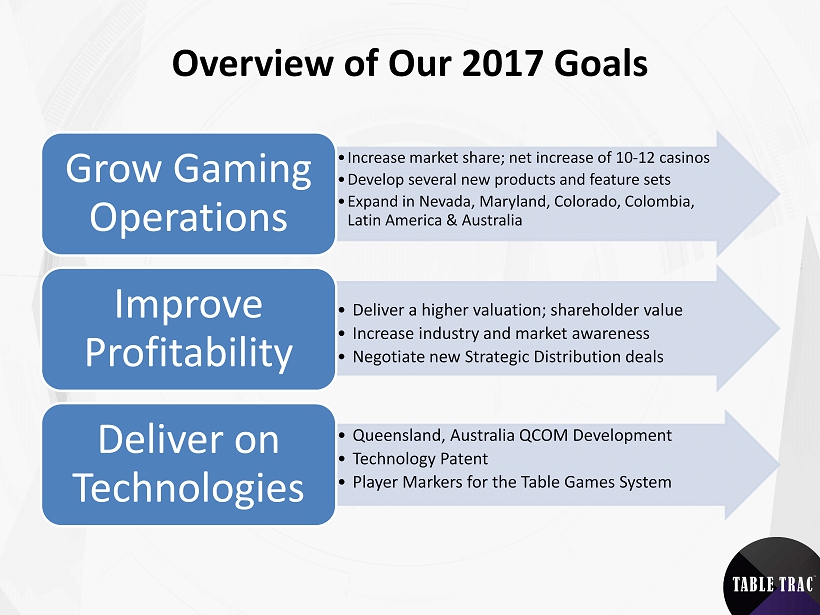
Overview of Our 2017 Goals • Increase market share; net increase of 10 - 12 casinos • Develop several new products and feature sets • Expand in Nevada, Maryland, Colorado, Colombia, Latin America & Australia Grow Gaming Operations • Deliver a higher valuation; shareholder value • Increase industry and market awareness • Negotiate new Strategic Distribution deals Improve Profitability • Queensland, Australia QCOM Development • Technology Patent • Player Markers for the Table Games System Deliver on Technologies
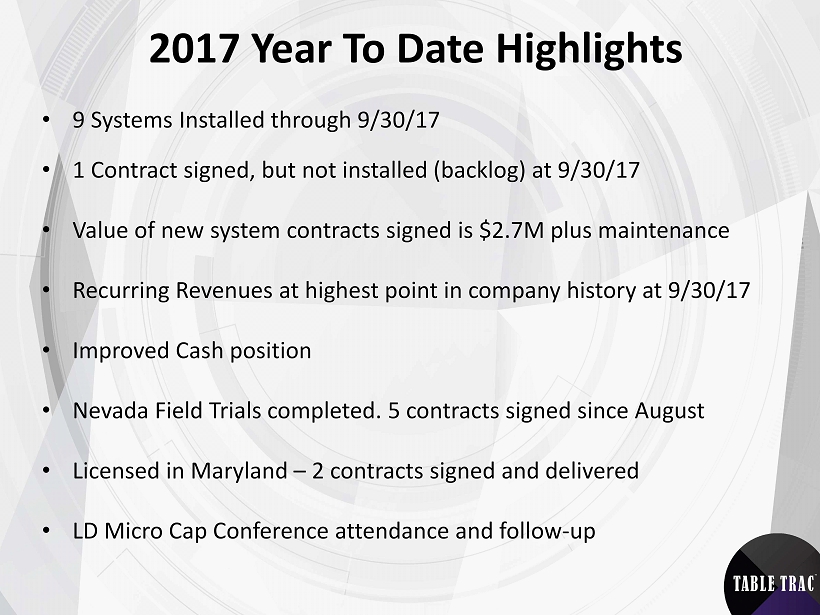
2017 Year To Date Highlights • 9 Systems Installed through 9/30/17 • 1 Contract signed, but not installed (backlog) at 9/30/17 • Value of new system contracts signed is $2.7M plus maintenance • Recurring Revenues at highest point in company history at 9/30/17 • Improved Cash position • Nevada Field Trials completed. 5 contracts signed since August • Licensed in Maryland – 2 contracts signed and delivered • LD Micro Cap Conference attendance and follow - up

Technology Update • Casino System Version 4.4 passed NGCB Field Trail August 9th • 4 Nevada installations complete • 1 Nevada project in backlog as of September 30th • Australia • Queensland QCOM development nearly complete, operational • Provisional Patent Filed • Player Markers added into Table Games System • Reporting updates in progress to meet Nevada, Colorado requirements • To BMM lab by early 2018
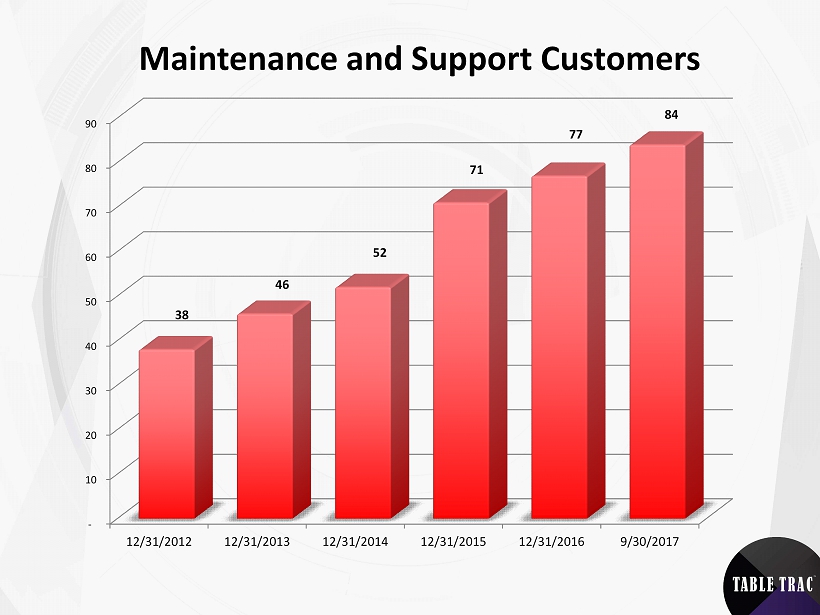
Maintenance and Support Customers - 10 20 30 40 50 60 70 80 90 12/31/2012 12/31/2013 12/31/2014 12/31/2015 12/31/2016 9/30/2017 38 46 71 84 52 77
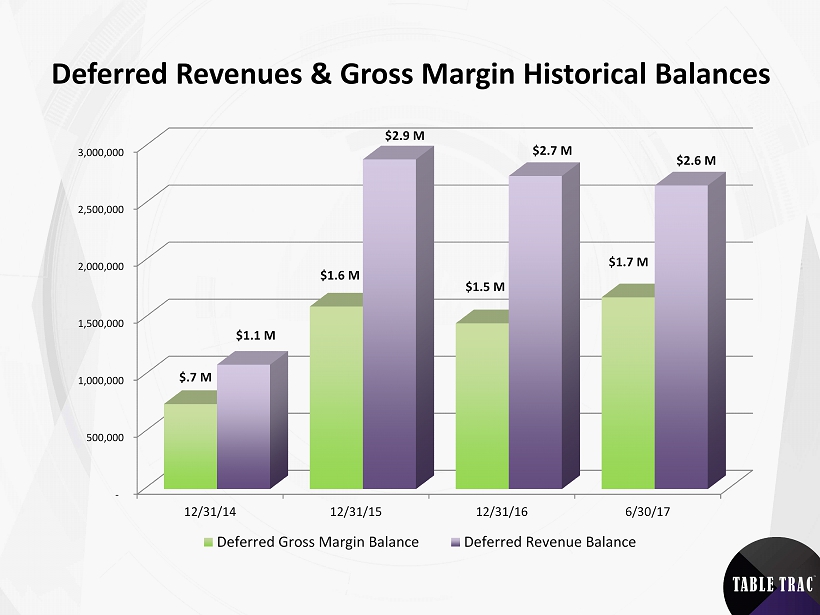
- 500,000 1,000,000 1,500,000 2,000,000 2,500,000 3,000,000 12/31/14 12/31/15 12/31/16 6/30/17 Deferred Gross Margin Balance Deferred Revenue Balance Deferred Revenues & Gross Margin Historical Balances $1.1 M $2.9 M $2.7 M $2.6 M $.7 M $1.6 M $1.5 M $1.7 M

Accounts Receivable Historical Balances $- $500,000 $1,000,000 $1,500,000 $2,000,000 $2,500,000 $3,000,000 $3,500,000 $4,000,000 $4,500,000 $5,000,000 12/31/2014 12/31/2015 12/31/2016 6/30/2017 $2.9 M $4.0 M $4.2 M $4.7 M

Table Trac , Inc. 2017 Shareholder Meeting - Questions - Thank You