Attached files
| file | filename |
|---|---|
| EX-99.1 - HONEYWELL INTERNATIONAL INC | c89514_ex99-1.htm |
| 8-K - HONEYWELL INTERNATIONAL INC | c89514_8k.htm |
Exhibit 99.2
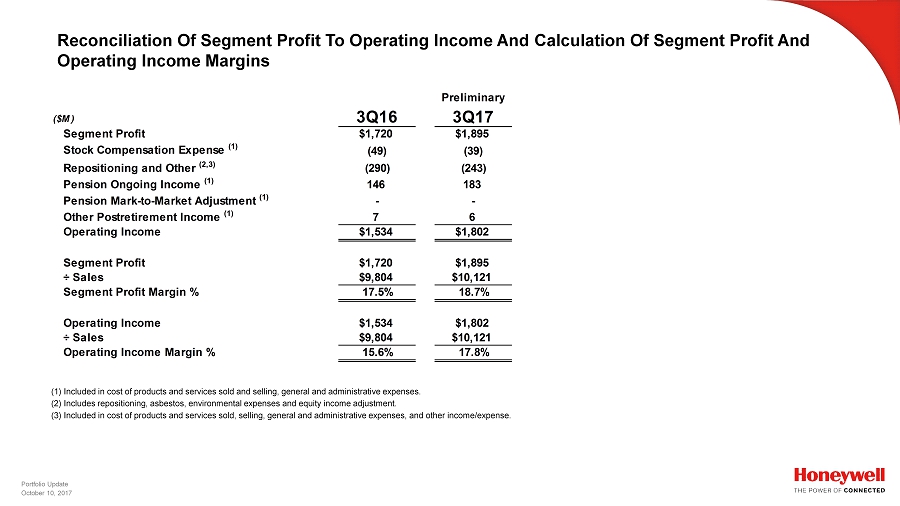
Portfolio Update October 10, 2017 Reconciliation Of Segment Profit To Operating Income And Calculation Of Segment Profit And Operating Income Margins (1) Included in cost of products and services sold and selling, general and administrative expenses. (2) Includes repositioning, asbestos, environmental expenses and equity income adjustment. (3) Included in cost of products and services sold, selling, general and administrative expenses, and other income/expense. Preliminary ($M) 3Q16 3Q17 Segment Profit $1,720 $1,895 Stock Compensation Expense (1) (49) (39) Repositioning and Other (2,3) (290) (243) Pension Ongoing Income (1) 146 183 Pension Mark-to-Market Adjustment (1) - - Other Postretirement Income (1) 7 6 Operating Income $1,534 $1,802 Segment Profit $1,720 $1,895 ÷ Sales $9,804 $10,121 Segment Profit Margin % 17.5% 18.7% Operating Income $1,534 $1,802 ÷ Sales $9,804 $10,121 Operating Income Margin % 15.6% 17.8%

Portfolio Update October 10, 2017 Reconciliation Of Cash Provided By Operating Activities To Free Cash Flow And Calculation Of Free Cash Flow Conversion Preliminary Preliminary ($M) 3Q17 YTD3Q16 YTD3Q17 Cash Provided by Operating Activities $1,407 $3,456 $3,794 Expenditures for Property, Plant and Equipment (212) (749) (613) Free Cash Flow $1,195 $2,707 $3,181 Free Cash Flow $1,195 $2,707 $3,181 ÷ Net Income Attributable to Honeywell 1,348 3,775 4,066 Free Cash Flow Conversion % 89% 72% 78%