Attached files
| file | filename |
|---|---|
| EX-99.2 - EX-99.2 - TIDEWATER INC | tdw-ex992_6.htm |
| 8-K - 8-K - TIDEWATER INC | tdw-8k_20170926.htm |

2017 Johnson Rice Energy Conference Jeff Platt President and CEO Joseph Bennett Executive VP and Chief Investor Relations Officer September 26, 2017 Exhibit 99.1
FORWARD-LOOKING STATEMENTS In accordance with the safe harbor provisions of the Private Securities Litigation Reform Act of 1995, the Company notes that certain statements set forth in this presentation provide other than historical information and are forward looking. The actual achievement of any forecasted results, or the unfolding of future economic or business developments in a way anticipated or projected by the Company, involve numerous risks and uncertainties that may cause the Company’s actual performance to be materially different from that stated or implied in the forward-looking statement. Among those risks and uncertainties, many of which are beyond the control of the Company, include, without limitation, fluctuations in worldwide energy demand and oil and gas prices; fleet additions by competitors and industry overcapacity; changes in capital spending by customers in the energy industry for offshore exploration, development and production; changing customer demands for different vessel specifications, which may make some of our older vessels technologically obsolete for certain customer projects or in certain markets; uncertainty of global financial market conditions and difficulty accessing credit or capital; acts of terrorism and piracy; significant weather conditions; unsettled political conditions, war, civil unrest and governmental actions, such as expropriation or enforcement of customs or other laws that are not well-developed or consistently enforced, especially in higher political risk countries where we operate; foreign currency fluctuations; labor changes proposed by international conventions; increased regulatory burdens and oversight; and enforcement of laws related to the environment, labor and foreign corrupt practices. Readers should consider all of these risks factors, as well as other information contained in the Company’s form 10-K’s and 10-Q’s. 2017 Johnson Rice Energy Conference | ©2017 TIDEWATER INC.
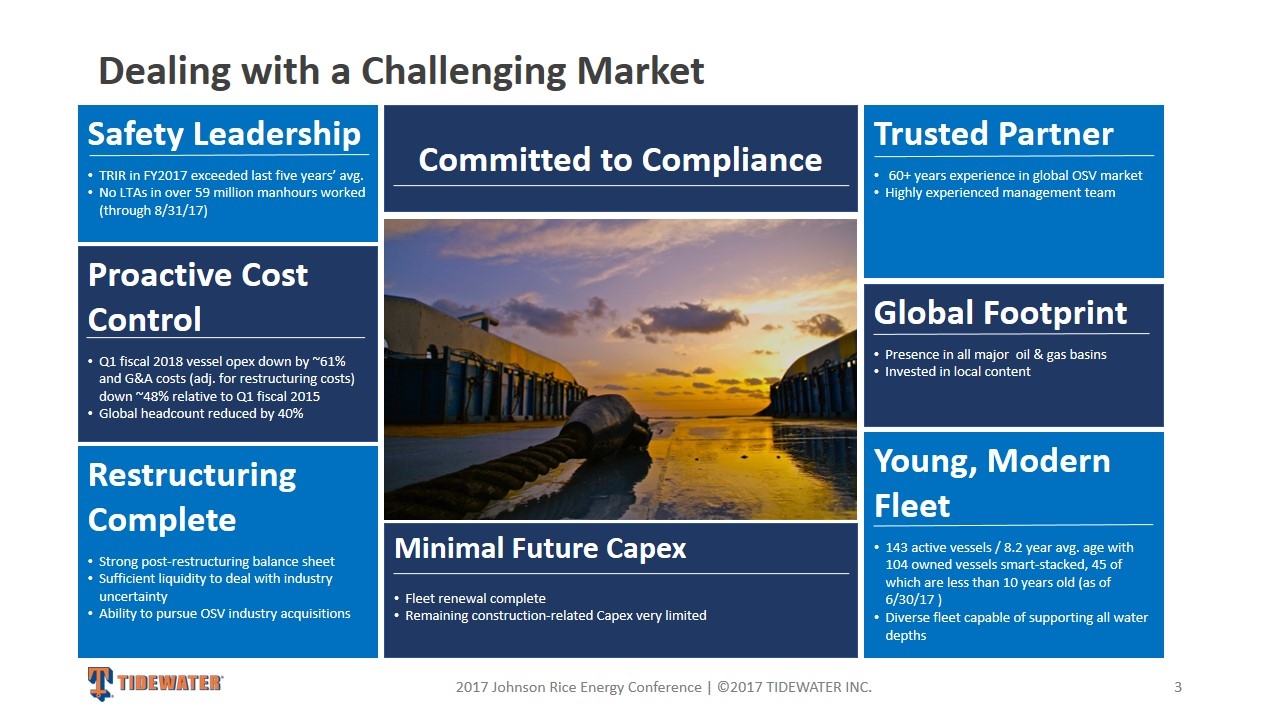
Dealing with a Challenging Market 2017 Johnson Rice Energy Conference | ©2017 TIDEWATER INC. Safety Leadership TRIR in FY2017 exceeded last five years’ avg. No LTAs in over 59 million manhours worked (through 8/31/17) Trusted Partner 60+ years experience in global OSV market Highly experienced management team Committed to Compliance Global Footprint Presence in all major oil & gas basins Invested in local content Minimal Future Capex Fleet renewal complete Remaining construction-related Capex very limited Young, Modern Fleet 143 active vessels / 8.2 year avg. age with 104 owned vessels smart-stacked, 45 of which are less than 10 years old (as of 6/30/17 ) Diverse fleet capable of supporting all water depths Restructuring Complete Strong post-restructuring balance sheet Sufficient liquidity to deal with industry uncertainty Ability to pursue OSV industry acquisitions Proactive Cost Control Q1 fiscal 2018 vessel opex down by ~61% and G&A costs (adj. for restructuring costs) down ~48% relative to Q1 fiscal 2015 Global headcount reduced by 40%
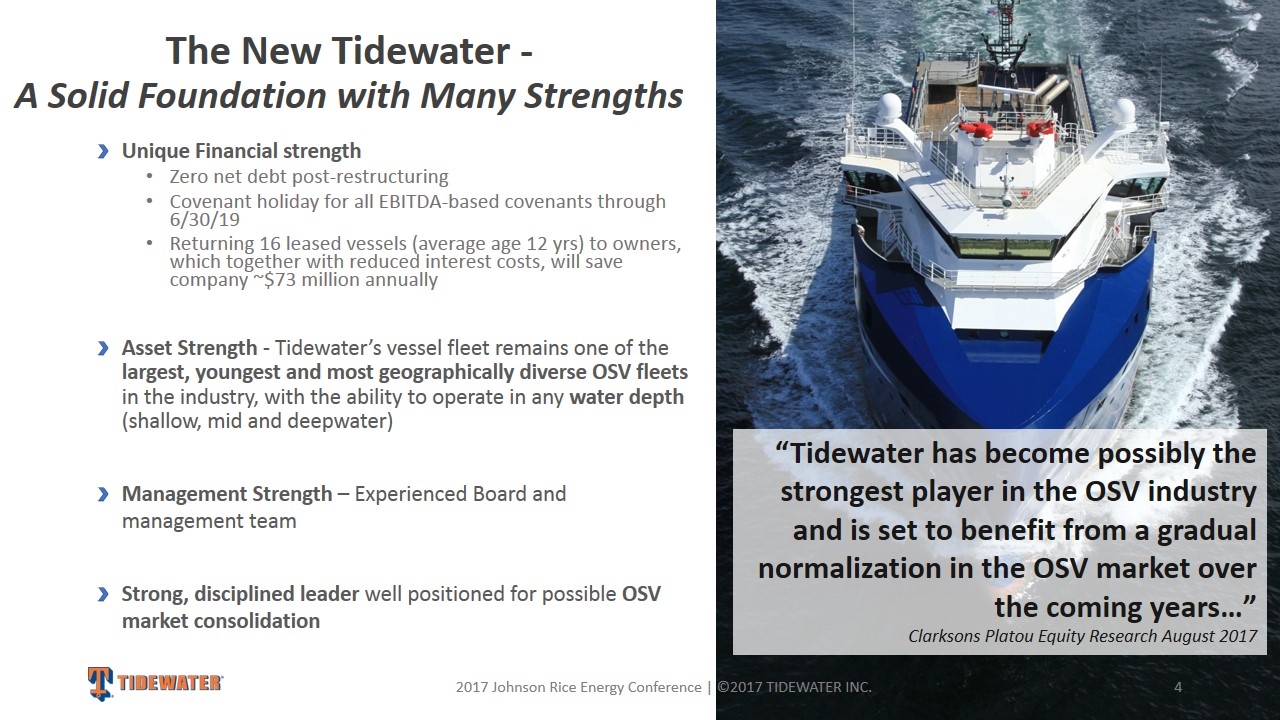
The New Tidewater - A Solid Foundation with Many Strengths Unique Financial strength Zero net debt post-restructuring Covenant holiday for all EBITDA-based covenants through 6/30/19 Returning 16 leased vessels (average age 12 yrs) to owners, which together with reduced interest costs, will save company ~$73 million annually Asset Strength - Tidewater’s vessel fleet remains one of the largest, youngest and most geographically diverse OSV fleets in the industry, with the ability to operate in any water depth (shallow, mid and deepwater) Management Strength – Experienced Board and management team Strong, disciplined leader well positioned for possible OSV market consolidation 2017 Johnson Rice Energy Conference | ©2017 TIDEWATER INC. “Tidewater has become possibly the strongest player in the OSV industry and is set to benefit from a gradual normalization in the OSV market over the coming years…” Clarksons Platou Equity Research August 2017
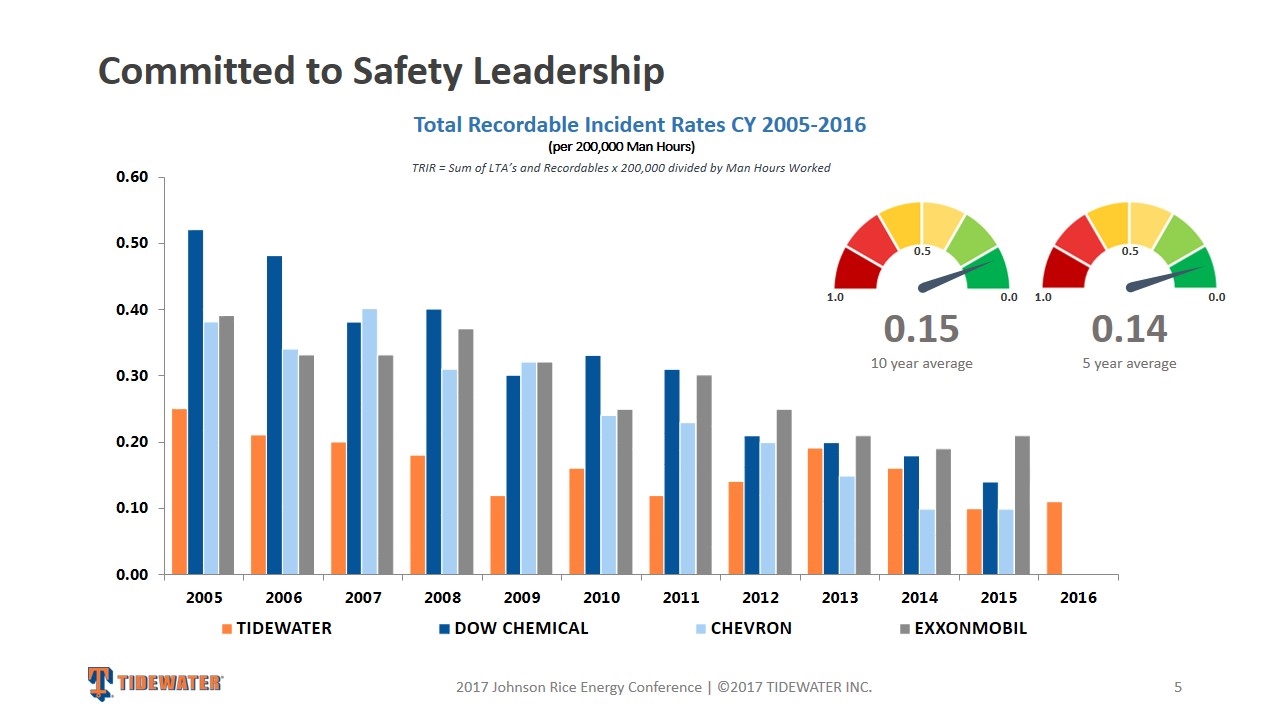
Committed to Safety Leadership 2017 Johnson Rice Energy Conference | ©2017 TIDEWATER INC. Total Recordable Incident Rates CY 2005-2016 (per 200,000 Man Hours) TRIR = Sum of LTA’s and Recordables x 200,000 divided by Man Hours Worked 0.0 1.0 0.5 0.0 1.0 0.5 0.15 10 year average 0.14 5 year average
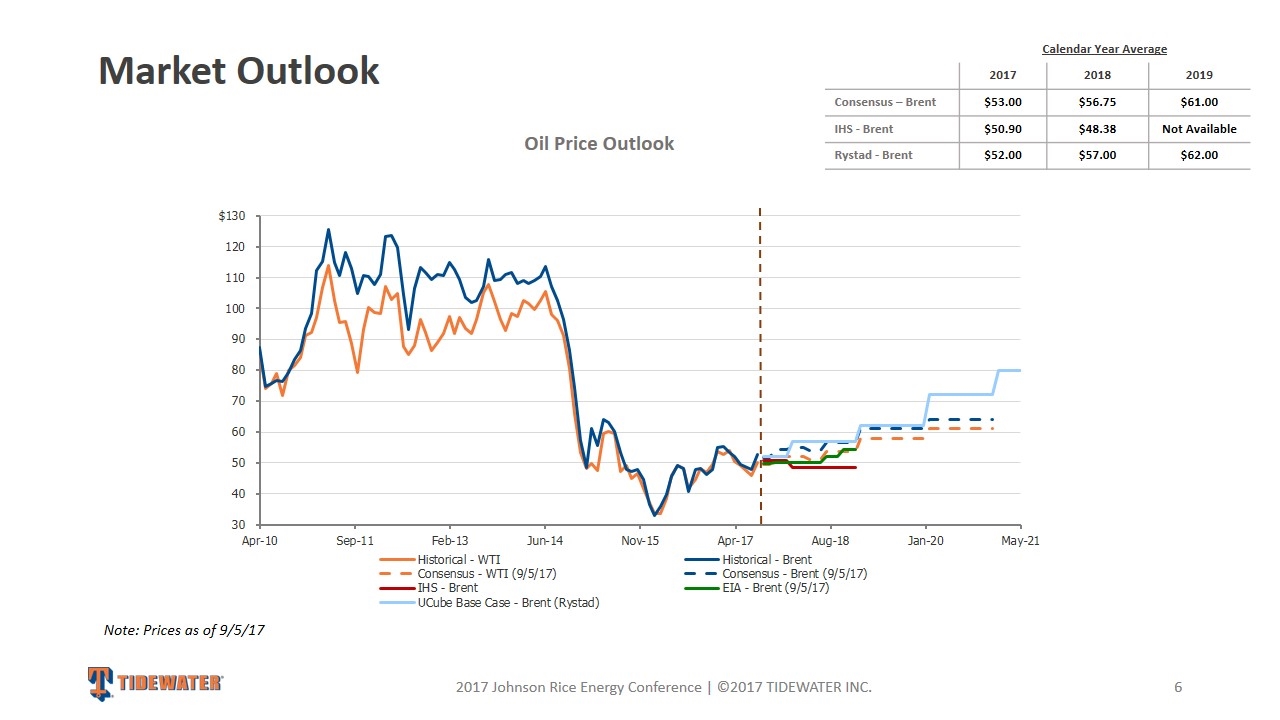
Market Outlook 2017 Johnson Rice Energy Conference | ©2017 TIDEWATER INC. Oil Price Outlook Note: Prices as of 9/5/17 Calendar Year Average 2017 2018 2019 Consensus – Brent $53.00 $56.75 $61.00 IHS - Brent $50.90 $48.38 Not Available Rystad - Brent $52.00 $57.00 $62.00
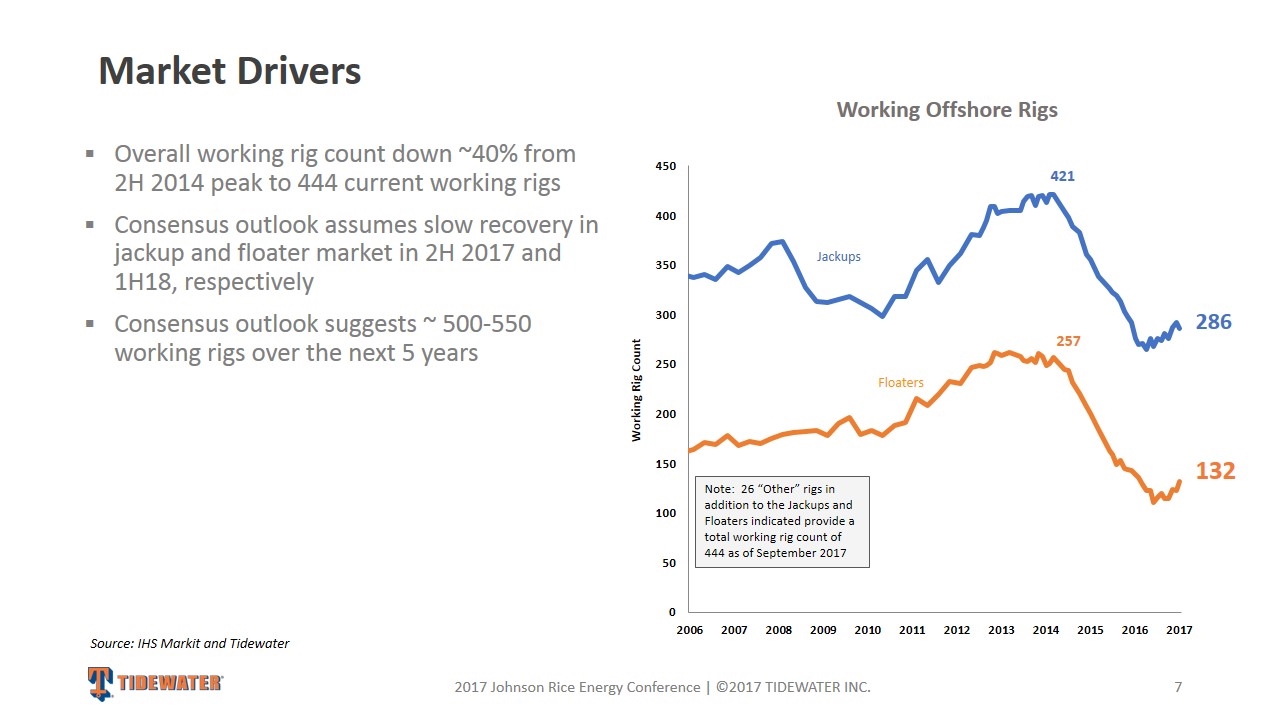
Overall working rig count down ~40% from 2H 2014 peak to 444 current working rigs Consensus outlook assumes slow recovery in jackup and floater market in 2H 2017 and 1H18, respectively Consensus outlook suggests ~ 500-550 working rigs over the next 5 years 2017 Johnson Rice Energy Conference | ©2017 TIDEWATER INC. Market Drivers Source: IHS Markit and Tidewater Working Offshore Rigs 132 257 286 421 Jackups Floaters Note: 26 “Other” rigs in addition to the Jackups and Floaters indicated provide a total working rig count of 444 as of September 2017
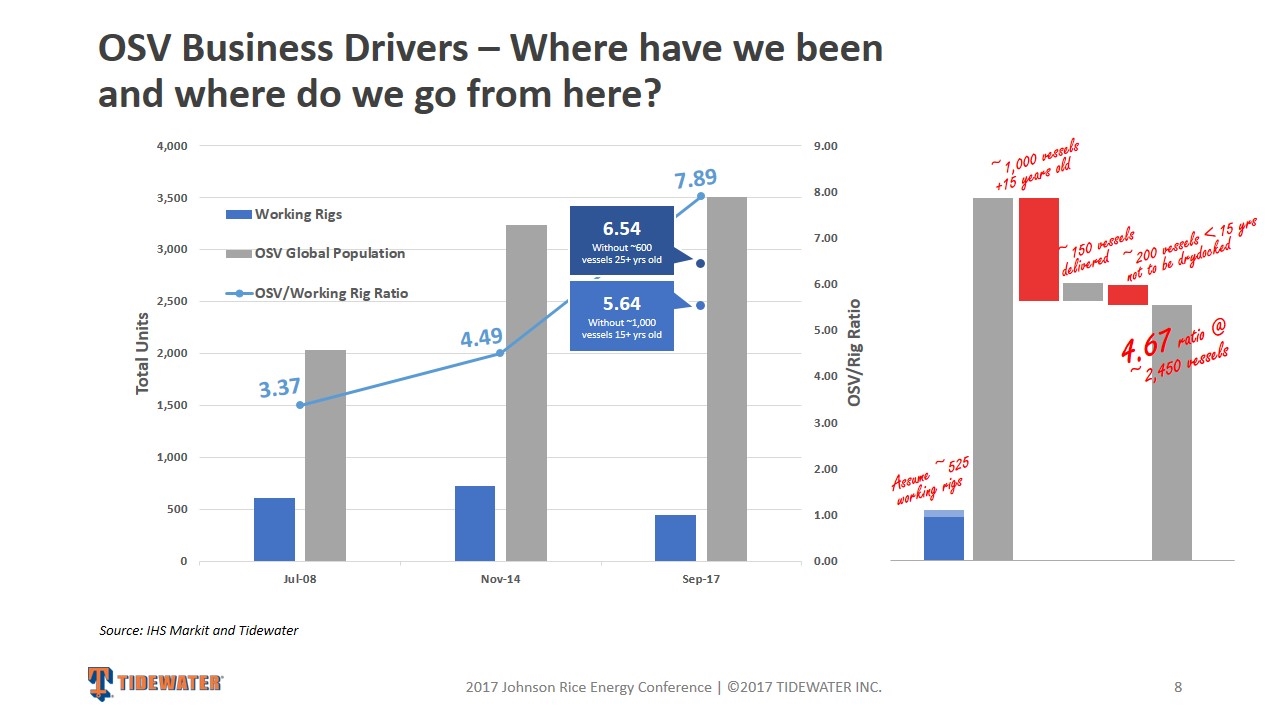
OSV Business Drivers – Where have we been and where do we go from here? 2017 Johnson Rice Energy Conference | ©2017 TIDEWATER INC. 6.54 Without ~600 vessels 25+ yrs old 5.64 Without ~1,000 vessels 15+ yrs old Source: IHS Markit and Tidewater ~1,000 vessels +15 years old ~150 vessels delivered ~200 vessels < 15 yrs not to be drydocked 4.67 ratio @ ~2,450 vessels Assume ~525 working rigs 3.37 4.49 7.89
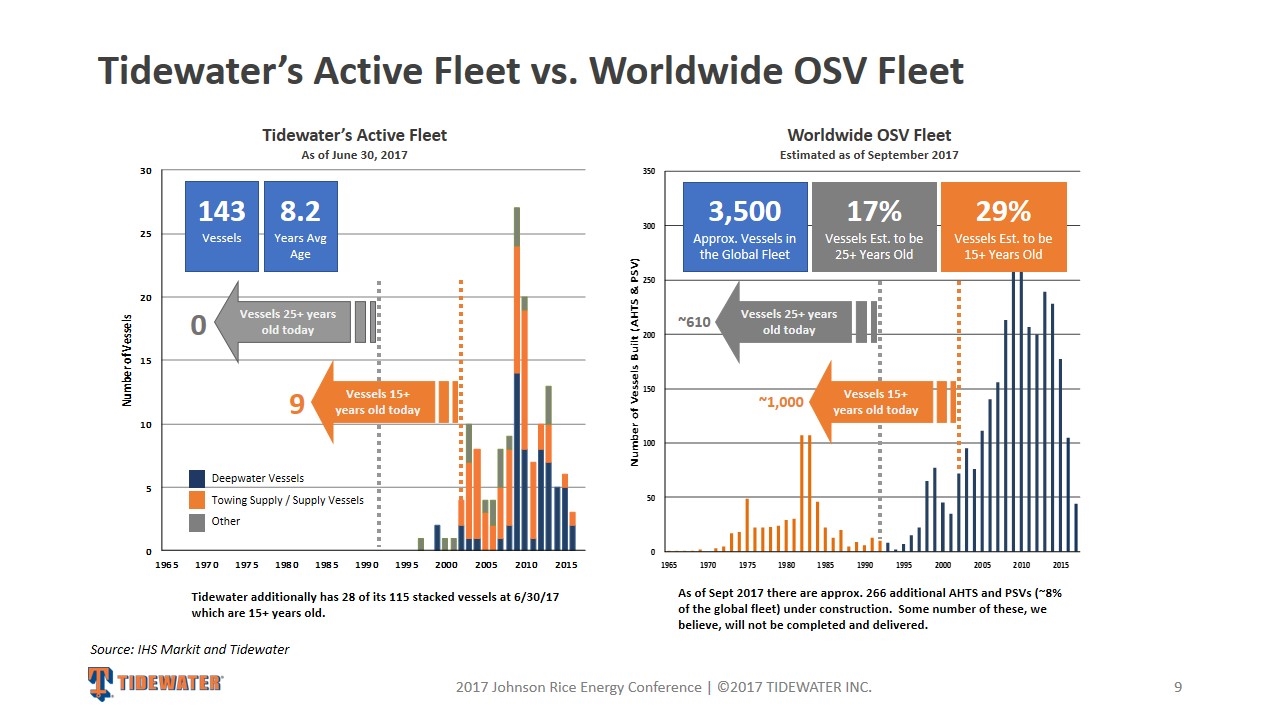
Tidewater’s Active Fleet vs. Worldwide OSV Fleet 2017 Johnson Rice Energy Conference | ©2017 TIDEWATER INC. 143 Vessels 8.2 Years Avg Age 3,500 Approx. Vessels in the Global Fleet 17% Vessels Est. to be 25+ Years Old Vessels 25+ years old today Vessels 25+ years old today Vessels 15+ years old today ~1,000 ~610 Deepwater Vessels Towing Supply / Supply Vessels Other Source: IHS Markit and Tidewater 29% Vessels Est. to be 15+ Years Old As of Sept 2017 there are approx. 266 additional AHTS and PSVs (~8% of the global fleet) under construction. Some number of these, we believe, will not be completed and delivered. Worldwide OSV Fleet Estimated as of September 2017 Tidewater’s Active Fleet As of June 30, 2017 Vessels 15+ years old today 9 Tidewater additionally has 28 of its 115 stacked vessels at 6/30/17 which are 15+ years old. 0
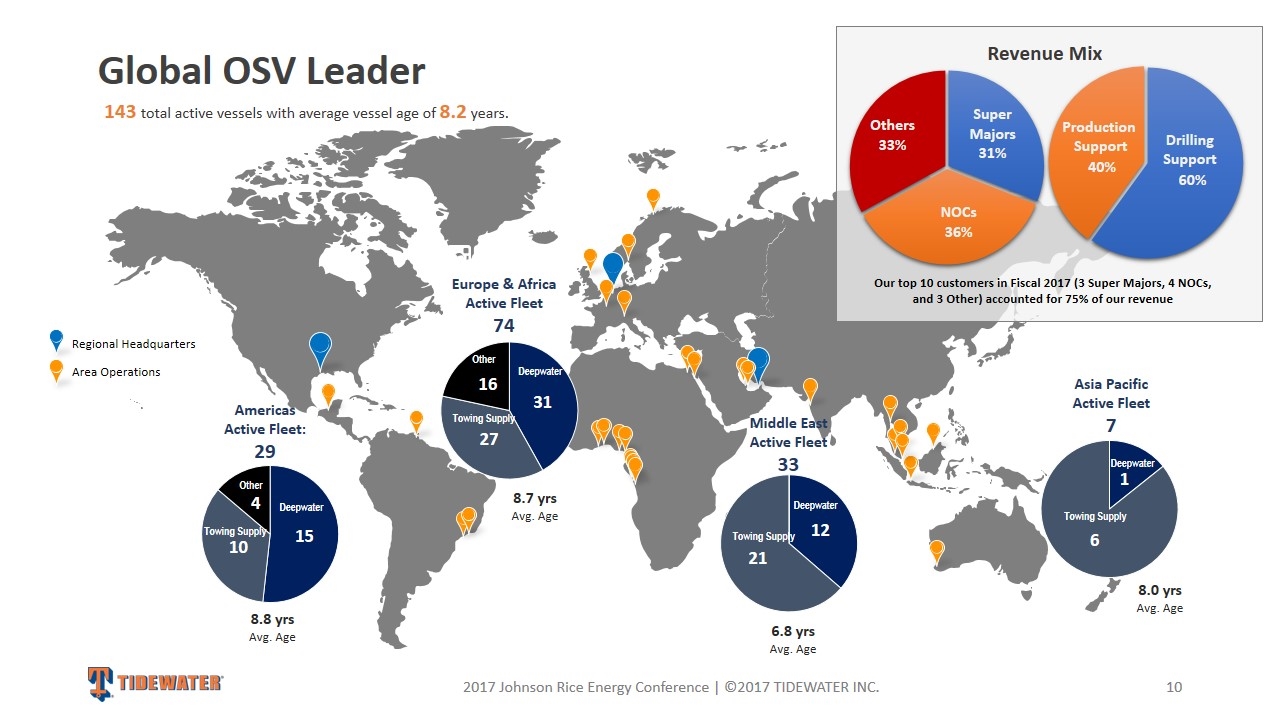
Global OSV Leader 2017 Johnson Rice Energy Conference | ©2017 TIDEWATER INC. Regional Headquarters Area Operations Middle East Active Fleet 33 Europe & Africa Active Fleet 74 Americas Active Fleet: 29 Towing Supply Towing Supply Towing Supply Towing Supply Asia Pacific Active Fleet 7 Our top 10 customers in Fiscal 2017 (3 Super Majors, 4 NOCs, and 3 Other) accounted for 75% of our revenue Revenue Mix Production Support Drilling Support 143 total active vessels with average vessel age of 8.2 years. Deepwater Towing Supply Other Deepwater Towing Supply Other Deepwater Towing Supply Deepwater Towing Supply 8.8 yrs Avg. Age 8.7 yrs Avg. Age 6.8 yrs Avg. Age 8.0 yrs Avg. Age
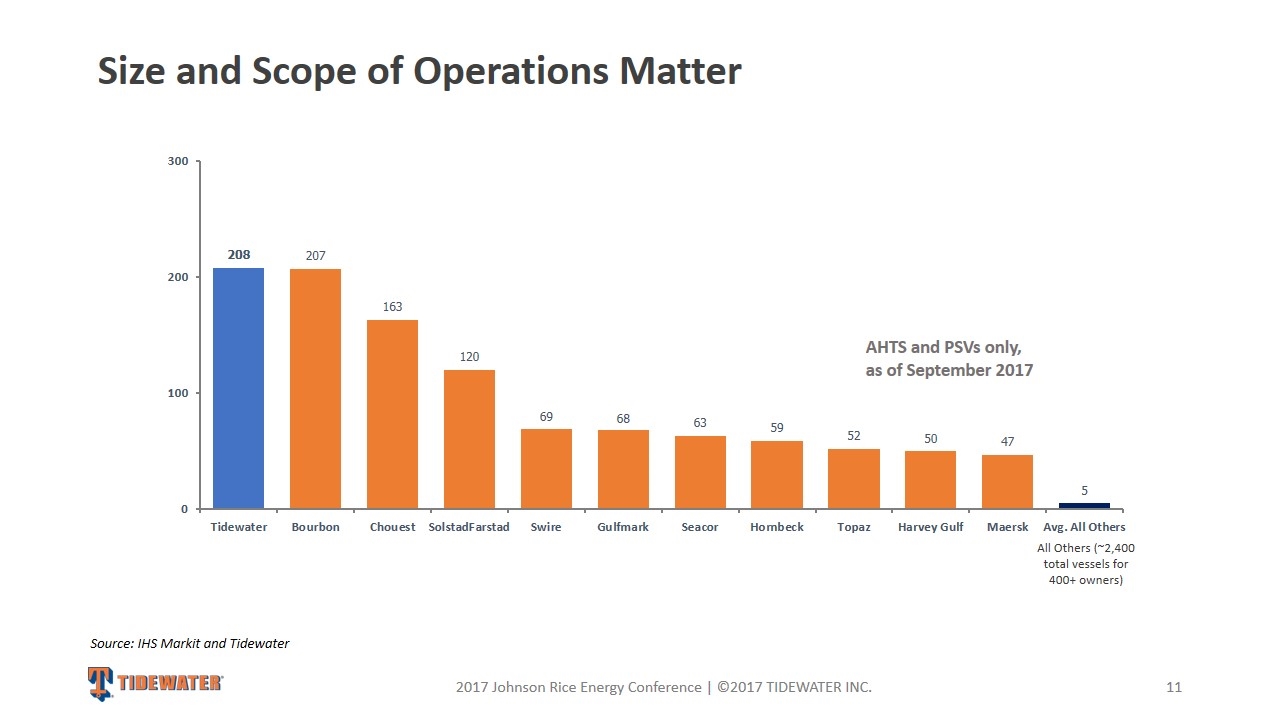
Size and Scope of Operations Matter 2017 Johnson Rice Energy Conference | ©2017 TIDEWATER INC. AHTS and PSVs only, as of September 2017 All Others (~2,400 total vessels for 400+ owners) Source: IHS Markit and Tidewater
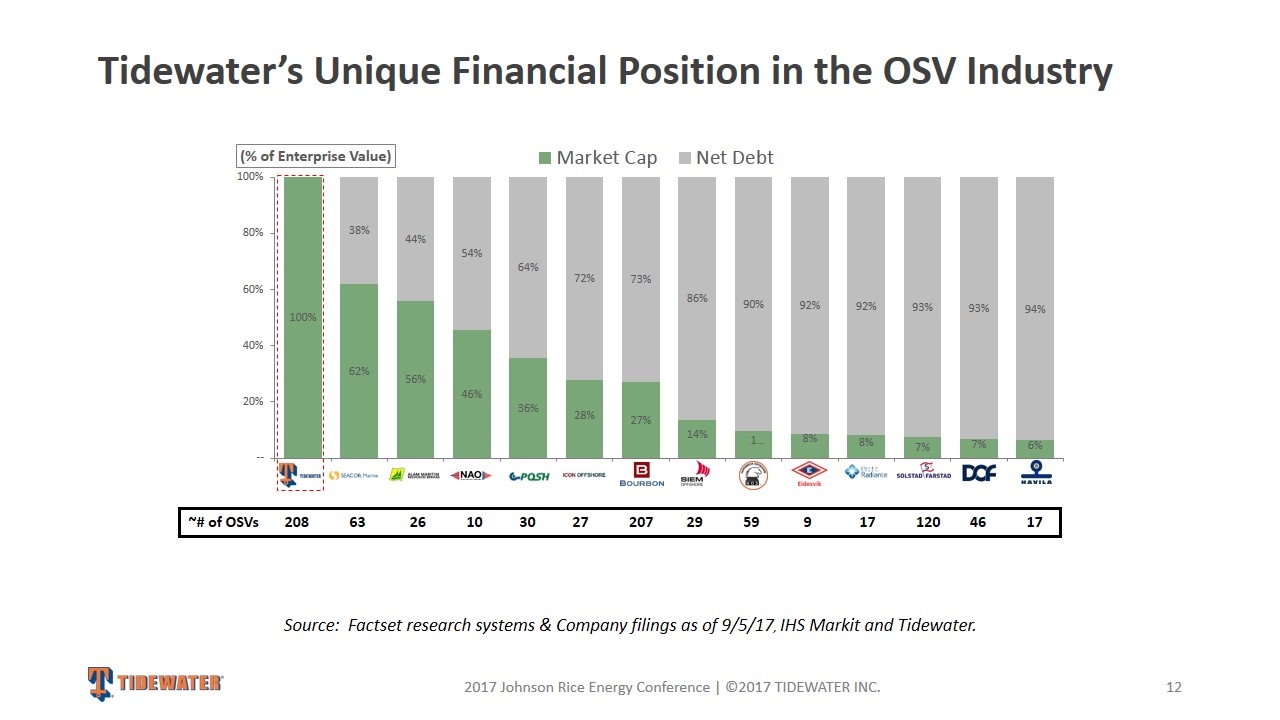
Tidewater’s Unique Financial Position in the OSV Industry 2017 Johnson Rice Energy Conference | ©2017 TIDEWATER INC. Source: Factset research systems & Company filings as of 9/5/17, IHS Markit and Tidewater. ~# of OSVs 208 63 26 10 30 27 207 29 59 9 17 120 46 17
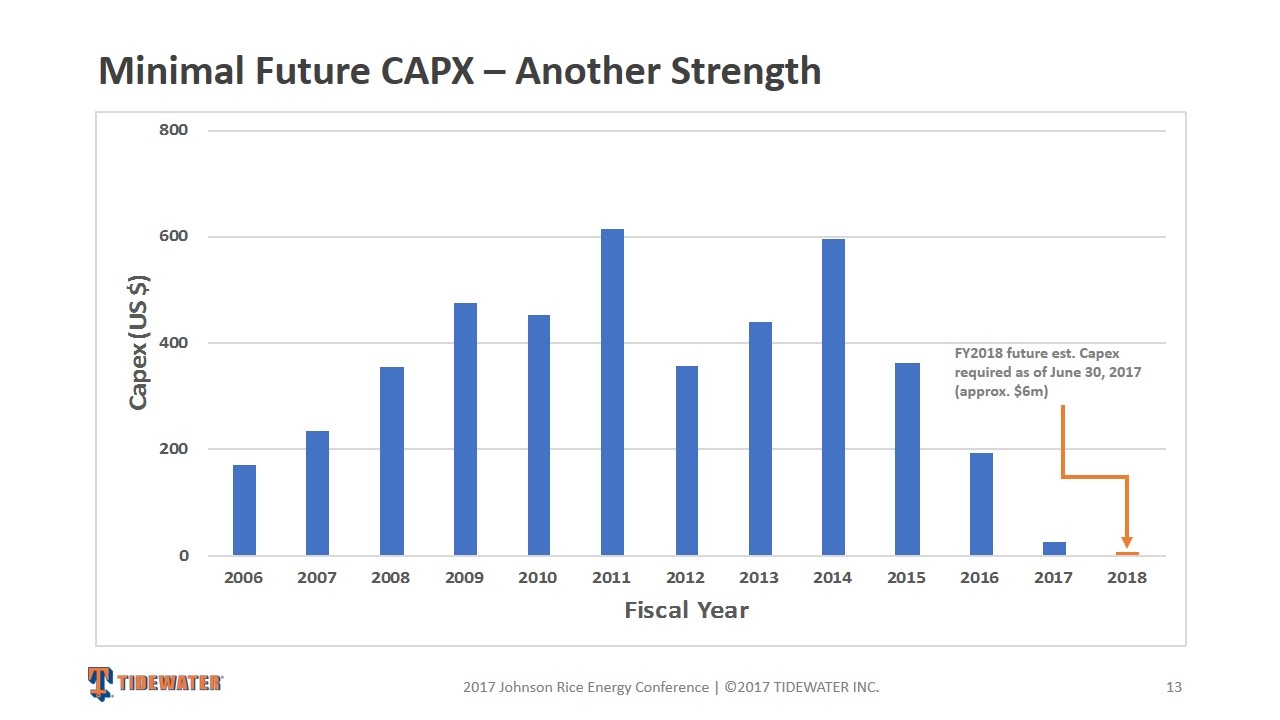
Minimal Future CAPX – Another Strength 2017 Johnson Rice Energy Conference | ©2017 TIDEWATER INC. FY2018 future est. Capex required as of June 30, 2017 (approx. $6m)
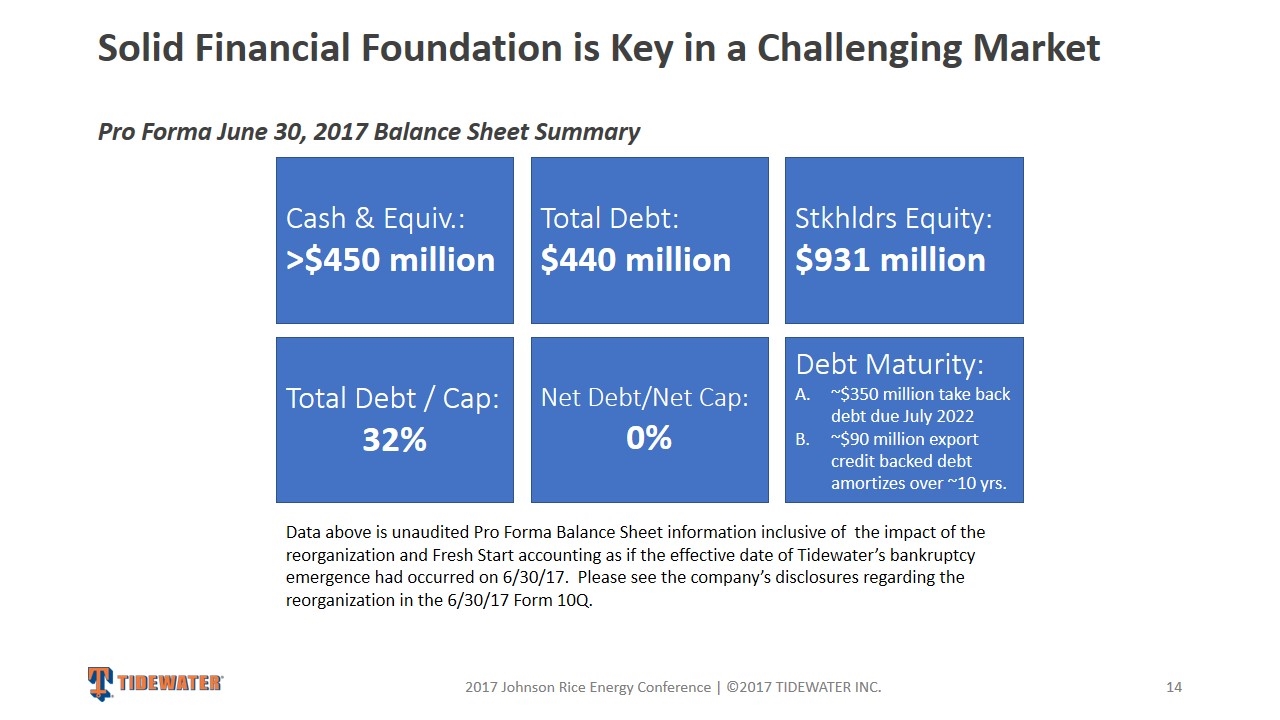
Solid Financial Foundation is Key in a Challenging Market Pro Forma June 30, 2017 Balance Sheet Summary 2017 Johnson Rice Energy Conference | ©2017 TIDEWATER INC. Cash & Equiv.: >$450 million Total Debt: $440 million Stkhldrs Equity: $931 million Net Debt/Net Cap: 0% Total Debt / Cap: 32% Data above is unaudited Pro Forma Balance Sheet information inclusive of the impact of the reorganization and Fresh Start accounting as if the effective date of Tidewater’s bankruptcy emergence had occurred on 6/30/17. Please see the company’s disclosures regarding the reorganization in the 6/30/17 Form 10Q. Debt Maturity: ~$350 million take back debt due July 2022 ~$90 million export credit backed debt amortizes over ~10 yrs.
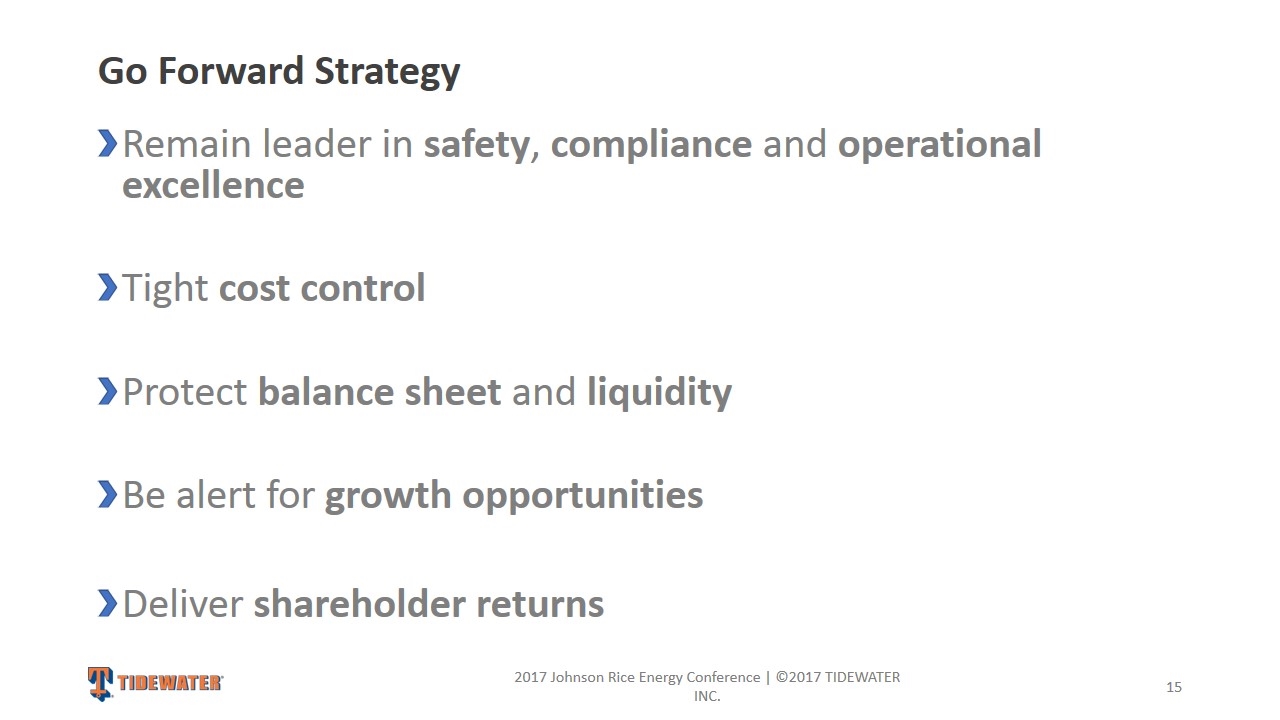
Go Forward Strategy Remain leader in safety, compliance and operational excellence Tight cost control Protect balance sheet and liquidity Be alert for growth opportunities Deliver shareholder returns 2017 Johnson Rice Energy Conference | ©2017 TIDEWATER INC.

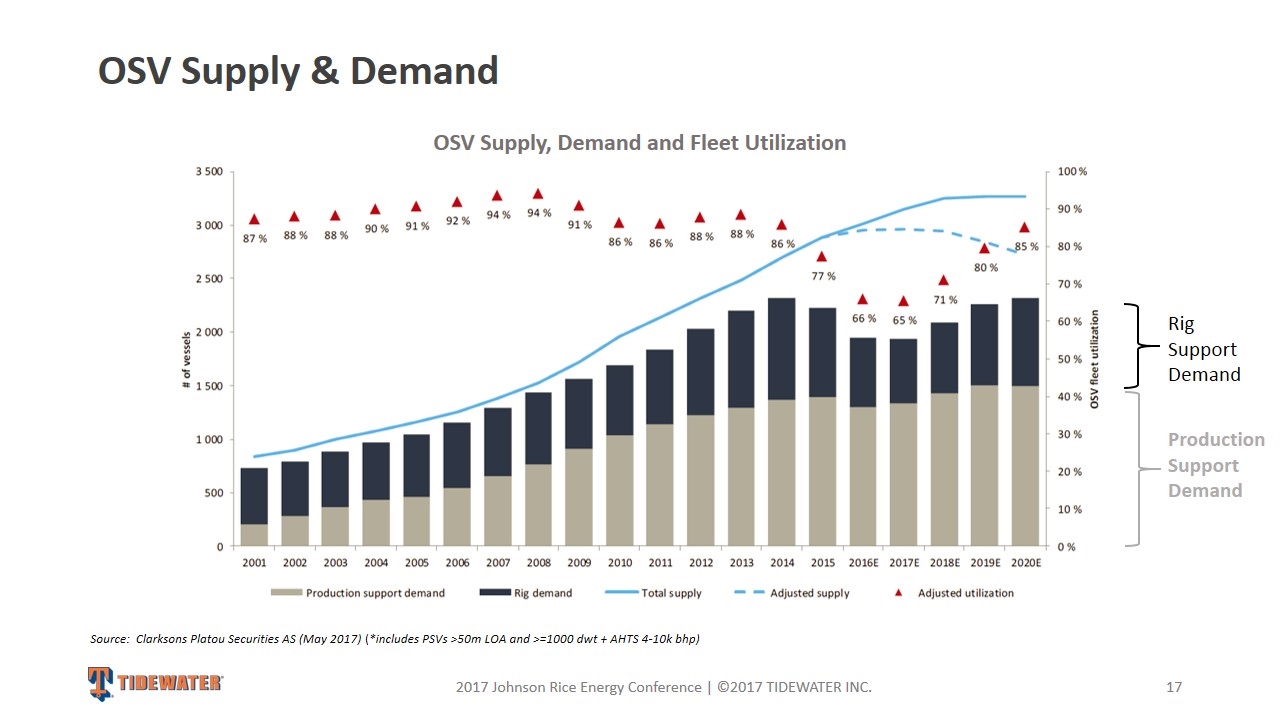
OSV Supply & Demand 2017 Johnson Rice Energy Conference | ©2017 TIDEWATER INC. Source: Clarksons Platou Securities AS (May 2017) (*includes PSVs >50m LOA and >=1000 dwt + AHTS 4-10k bhp) OSV Supply, Demand and Fleet Utilization Production Support Demand Rig Support Demand
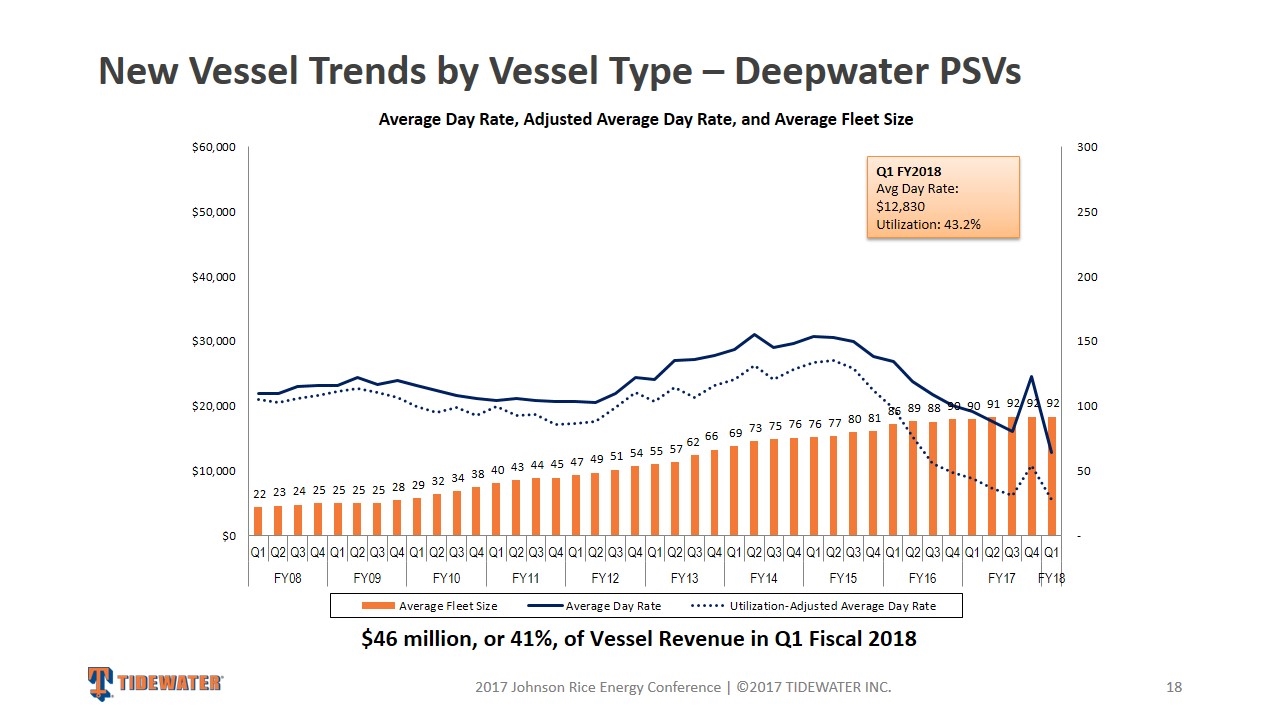
New Vessel Trends by Vessel Type – Deepwater PSVs 2017 Johnson Rice Energy Conference | ©2017 TIDEWATER INC. $46 million, or 41%, of Vessel Revenue in Q1 Fiscal 2018 Q1 FY2018 Avg Day Rate: $12,830 Utilization: 43.2%
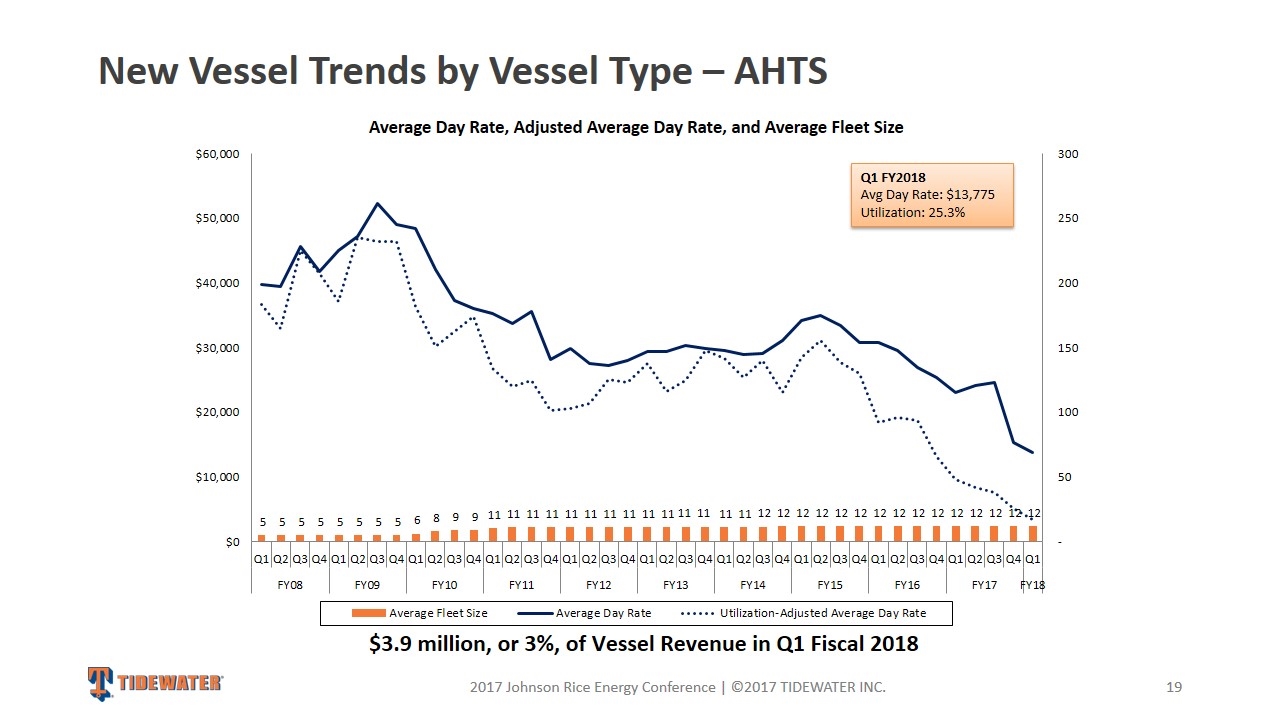
New Vessel Trends by Vessel Type – AHTS 2017 Johnson Rice Energy Conference | ©2017 TIDEWATER INC. $3.9 million, or 3%, of Vessel Revenue in Q1 Fiscal 2018 Q1 FY2018 Avg Day Rate: $13,775 Utilization: 25.3%
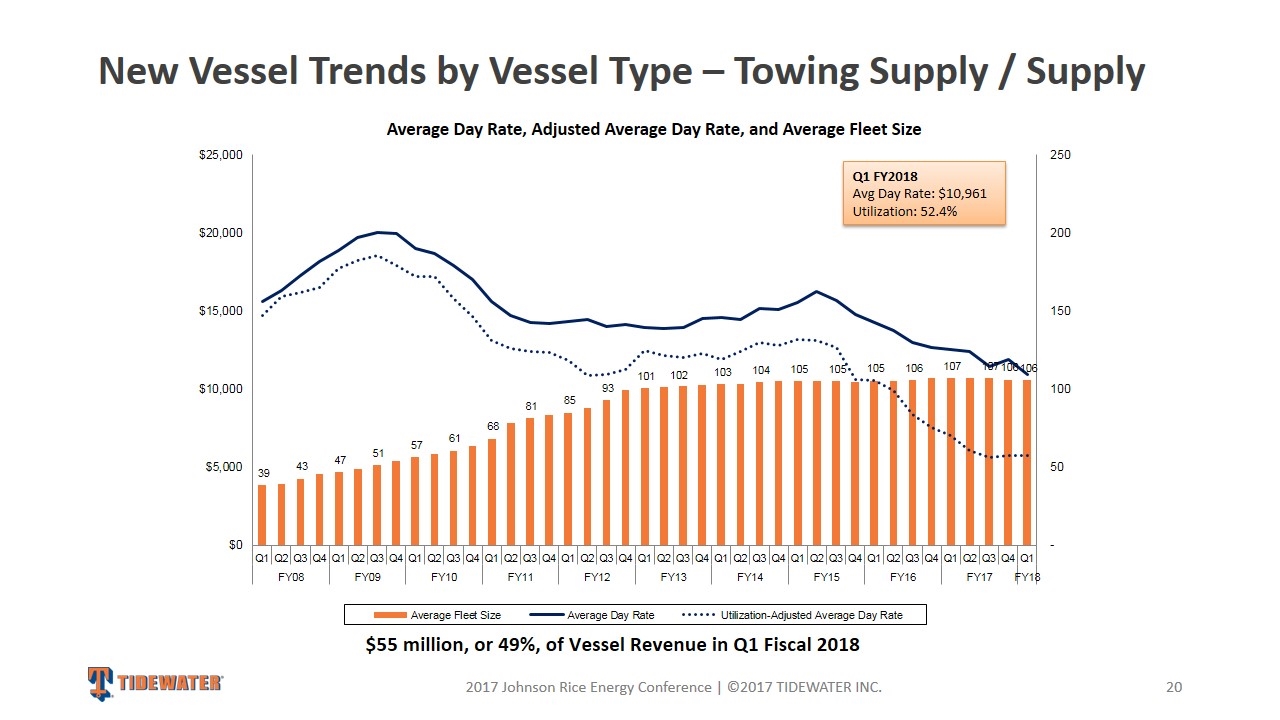
New Vessel Trends by Vessel Type – Towing Supply / Supply 2017 Johnson Rice Energy Conference | ©2017 TIDEWATER INC. Q1 FY2018 Avg Day Rate: $10,961 Utilization: 52.4% $55 million, or 49%, of Vessel Revenue in Q1 Fiscal 2018
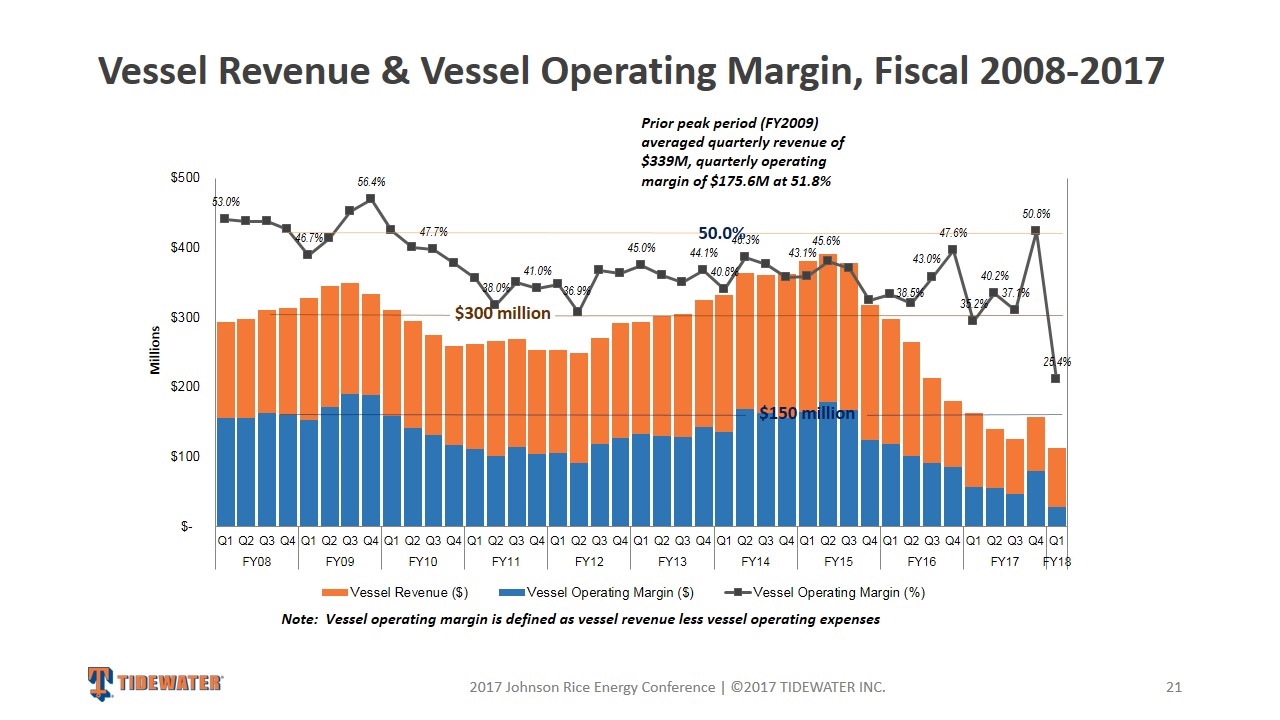
Vessel Revenue & Vessel Operating Margin, Fiscal 2008-2017 2017 Johnson Rice Energy Conference | ©2017 TIDEWATER INC. Prior peak period (FY2009) averaged quarterly revenue of $339M, quarterly operating margin of $175.6M at 51.8% Note: Vessel operating margin is defined as vessel revenue less vessel operating expenses $300 million $150 million 50.0% Millions
