Attached files
| file | filename |
|---|---|
| 8-K - FORM8-K - RITE AID CORP | v475650_8-k.htm |
| EX-99.1 - EXHIBIT 99.1 - RITE AID CORP | v475650_ex99-1.htm |
Exhibit 99.2

September 28, 2017

Statements in this presentation that are not historical are forward - looking statements made pursuant to the safe harbor provisions of the Private Securities Litigation Reform Act of 1995 . Such statements include, but are not limited to, statements regarding the expected timing of the closing of the sale of stores and assets to WBA ; the ability of the parties to complete the sale and related transactions considering the various closing conditions ; the outcome of legal and regulatory matters in connection with the sale of stores and assets of Rite Aid to WBA ; the expected benefits of the transactions such as improved operations, growth potential, market profile and financial strength ; the competitive ability and position of Rite Aid following completion of the proposed transactions ; the ability of Rite Aid to implement new business strategies following the completion of the proposed transactions and any assumptions underlying any of the foregoing . Words such as “anticipate,” “believe,” “continue,” “could,” “estimate,” “expect,” “intend,” “may,” “plan,” “predict,” “project,” “should,” and “will” and variations of such words and similar expressions are intended to identify such forward - looking statements . These forward - looking statements are not guarantees of future performance and involve risks, assumptions and uncertainties, including, but not limited to, our high level of indebtedness and our ability to make interest and principal payments on our debt and satisfy the other covenants contained in our debt agreements ; general economic, industry, market, competitive, regulatory and political conditions ; the continued impact of private and public third party payors reduction in prescription drug reimbursement rates and their ongoing efforts to limit access to payor networks, including through mail order ; our ability to manage expenses and our investments in working capital ; outcomes of legal and regulatory matters ; changes in legislation or regulations, including healthcare reform ; our ability to achieve the benefits of our efforts to reduce the costs of our generic and other drugs, and our ability to achieve drug pricing efficiencies ; the impact of the loss of one or more major third party payors ; risks related to the proposed transactions, including the possibility that the transactions may not close, including because a governmental entity may prohibit, delay or refuse to grant approval for the consummation of the transactions, or may require conditions, limitations or restrictions in connection with such approvals ; the risk that there may be a material adverse change of Rite Aid, or the continued impact on the business of Rite Aid as a result of uncertainty surrounding the proposed transactions ; risks related to the ability to realize the anticipated benefits of the proposed transactions ; disruption from the proposed transactions making it more difficult to maintain business and operational relationships ; the effect of the pending sale on Rite Aid's business relationships (including, without limitation, customers, suppliers and employees), operating results and business generally ; the impact of our efforts to consummate a transaction with WBA over the past two years ; risks related to the amount of costs, fees, expenses and charges related to the terminated transactions with WBA, Fred’s Inc . and AFAE, LLC ; risks related to diverting management's or employees' attention from ongoing business operations ; the risk that Rite Aid's stock price may decline significantly if the proposed transactions are not completed ; significant transaction costs ; unknown liabilities ; the risk of litigation and/or regulatory actions related to the proposed transactions ; potential changes to our strategy in the event the proposed transactions do not close, which may include delaying or reducing capital or other expenditures, selling assets or other operations, attempting to restructure or refinance our debt, or seeking additional capital, and other business effects . These and other risks, assumptions and uncertainties are more fully described in Item 1 A (Risk Factors) of our most recent Annual Report on Form 10 - K, and in other documents that we file or furnish with the Securities and Exchange Commission, which you are encouraged to read . Should one or more of these risks or uncertainties materialize, or should underlying assumptions prove incorrect, actual results may vary materially from those indicated or anticipated by such forward - looking statements . Accordingly, you are cautioned not to place undue reliance on these forward - looking statements, which speak only as of the date they are made . Rite Aid expressly disclaims any current intention to update publicly any forward - looking statement after the distribution of this release, whether as a result of new information, future events, changes in assumptions or otherwise . Safe Harbor Statement
CAUTIONARY NOTE REGARDING PRO FORMA INFORMATION : The following presentation provides certain pro forma information regarding the impact of Rite Aid’s proposed sale of stores and assets to Walgreens Boots Alliance, Inc . on Rite Aid’s results of operations and capital structure . The pro forma information is for illustrative purposes only, was prepared by management in response to investor inquiries and is based upon a number of assumptions . Additional items that may require adjustments to the pro forma information may be identified and could result in material changes to the information contained herein . The information in this presentation is not necessarily indicative of what actual financial results of Rite Aid would have been had the sale occurred on the dates or for the periods indicated, nor does it purport to project the financial results of Rite Aid for any future periods or as of any date . Such pro forma information has not been prepared in conformity with Regulation S - X . Rite Aid’s independent auditors have not audited, reviewed, compiled or performed any procedures with respect to this preliminary financial information . Accordingly, they do not express an opinion or provide any form of assurance with respect thereto . The information in this presentation should not be viewed in replacement of results prepared in compliance with Generally Accepted Accounting Principles or any pro forma financial statements subsequently required by the rules and regulations of the Securities and Exchange Commission . Safe Harbor Statement

Non - GAAP Financial Measures The following presentation includes a non - GAAP financial measure, Adjusted EBITDA . Rite Aid defines Adjusted EBITDA as net income (loss) excluding the impact of income taxes, interest expense, depreciation and amortization, LIFO adjustments, charges or credits for facility closing and impairment, inventory write - downs related to store closings, debt retirements, the WBA merger termination fee, and other items (including stock - based compensation expense, merger and acquisition - related costs, severance and costs related to distribution center closures, gain or loss on sale of assets and revenue deferrals related to our customer loyalty program) . The presentation includes a reconciliation of Adjusted EBITDA to net income, which is the most directly comparable GAAP financial measure .

Revenue 7,678.9$ 8,029.8$ Net Income 170.7$ 14.8$ Net Income Per Diluted Share 0.16$ 0.01$ Adjusted Net (Loss) / Income (15.6)$ 36.4$ Adjusted Net (Loss) / Income per Diluted Share (0.01)$ 0.03$ Adjusted EBITDA 213.3$ 2.78% 312.7$ 3.89% 13 Weeks Ended September 2, 2017 13 Weeks Ended August 27, 2016 Q2 - Fiscal 2018 Summary ($ in millions, except per share amounts)

Q2 - Fiscal 2018 Reconciliation of Net Income to Adjusted EBITDA ($ in thousands) 13 Weeks Ended September 2, 2017 13 Weeks Ended August 27, 2016 Net Income 170,716$ 14,773$ Adjustments: Interest expense 111,261 105,388 Income tax expense 107,087 10,928 Depreciation and amortization 132,012 142,051 LIFO charge 5,632 13,760 Lease termination and impairment charges 3,128 7,233 WBA merger termination fee (325,000) - Other 8,434 18,520 Adjusted EBITDA 213,270$ 312,653$ Percent of revenues 2.78% 3.89%

Q2 - Fiscal 2018 Reconciliation of Net Income to Adjusted Net (Loss) Income ($ in thousands, except per share amounts) 13 Weeks Ended September 2, 2017 13 Weeks Ended August 27, 2016 Net Income $ 170,716 $ 14,773 Add back - Income tax expense 107,087 10,928 Income before income taxes 277,803 25,701 Adjustments: Amortization of EnvisionRx intangible assets 19,560 20,853 LIFO charge 5,632 13,760 Merger and acquisition-related costs 13,883 1,402 WBA merger termination fee (325,000) - Adjusted (loss) income before income taxes (8,122)$ 61,716$ Adjusted income tax expense 7,480 25,335 Adjusted net (loss) income (15,602)$ 36,381$ Net income per diluted share 0.16$ 0.01$ Adjusted net (loss) income per diluted share (0.01)$ 0.03$

00 Q2 - Fiscal 2018 Summary RETAIL PHARMACY SEGMENT ($ in millions) Revenue 6,267.9$ 6,485.5$ Adjusted EBITDA Gross Profit (1) 1,695.3$ 27.05% 1,839.1$ 28.36% Adjusted EBITDA SG&A (1) 1,531.3$ 24.43% 1,576.5$ 24.31% Adjusted EBITDA 164.0$ 2.62% 262.6$ 4.05% 13 Weeks Ended September 2, 2017 13 Weeks Ended August 27, 2016 (1) Refer to slides 10 and 11 for the reconciliations of these non - GAAP measures to their applicable GAAP measures.

Q2 - Fiscal 2018 Summary RETAIL PHARMACY SEGMENT Retail Pharmacy Segment revenue decreased $217.6 million or 3.4%, due to a 1.8% decrease in comparable script growth, a decrease in reimbursement rates and a 0.9% decrease in same store front end sales. Adjusted EBITDA Gross Profit decreased $143.8 million, and Adjusted EBITDA Gross Margin decreased by 131 bps. The decrease was driven by reductions in reimbursement rates that we were not able to offset with generic drug purchasing efficiencies, as well as a reduction in script volume. Adjusted EBITDA SG&A decreased $45.2 million due to strong expense control, but increased 12 bps as a percentage of revenues, due to our decline in same store sales.

Reconciliation of Adjusted EBITDA Gross Profit RETAIL PHARMACY SEGMENT ($ in thousands) 13 Weeks Ended September 2, 2017 13 Weeks Ended August 27, 2016 Revenues 6,267,929$ 6,485,482$ Gross Profit 1,683,741 1,819,349 Addback: LIFO charge 5,632 13,760 Customer loyalty card program revenue deferral 573 (967) Depreciation and amortization (COGS portion only) 4,336 4,797 Other 1,031 2,177 Adjusted EBITDA Gross Profit 1,695,313$ 1,839,116$ Adjusted EBITDA Gross Profit as a percent of revenue 27.05% 28.36%

Reconciliation of Adjusted EBITDA SG&A RETAIL PHARMACY SEGMENT ($ in thousands) 13 Weeks Ended September 2, 2017 13 Weeks Ended August 27, 2016 Total Revenues 6,267,929$ 6,485,482$ Selling, general and administrative expenses 1,658,873 1,708,633 Less: Depreciation and amortization (SG&A portion only) 106,230 115,023 Stock based compensation expense 6,324 12,553 Other 15,002 4,584 Adjusted EBITDA SG&A 1,531,317$ 1,576,473$ Adjusted EBITDA SG&A as a percent of revenue 24.43% 24.31%
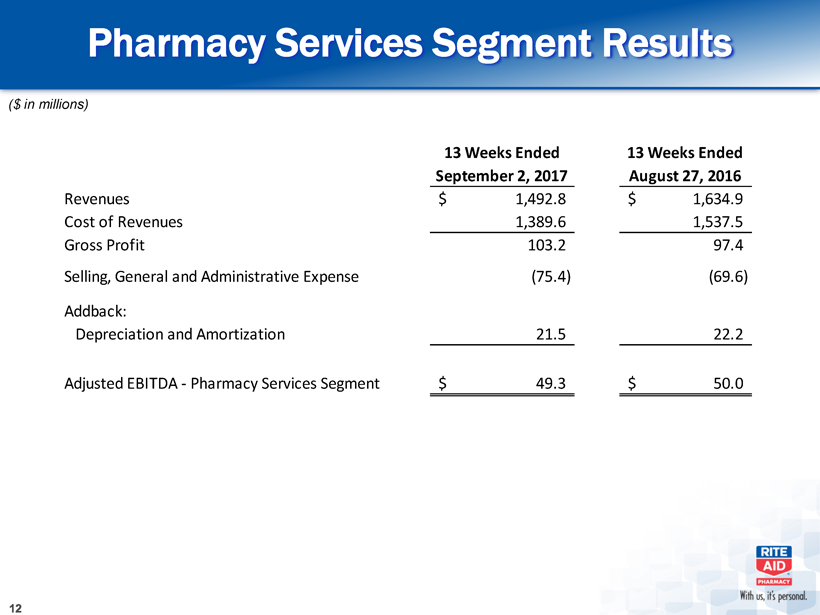
Pharmacy Services Segment Results ($ in millions) 13 Weeks Ended September 2, 2017 13 Weeks Ended August 27, 2016 Revenues 1,492.8$ 1,634.9$ Cost of Revenues 1,389.6 1,537.5 Gross Profit 103.2 97.4 Selling, General and Administrative Expense (75.4) (69.6) Addback: Depreciation and Amortization 21.5 22.2 Adjusted EBITDA - Pharmacy Services Segment 49.3$ 50.0$

Q2 - FY 2018 Summary PHARMACY SERVICES SEGMENT Revenues decreased $142.1 million, due to a decrease in covered lives at Envision Insurance Company EBITDA was flat to prior year. The decrease in revenue was offset by an improvement in gross profit, due to changes in client mix.
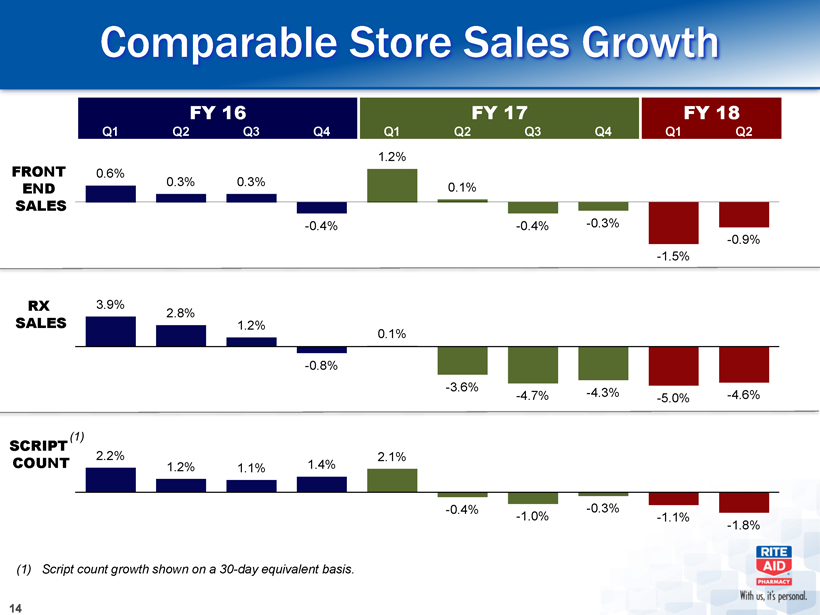
FY 18 FY 16 FY 17 FRONT END SALES RX SALES SCRIPT COUNT 0.6% 0.3% 0.3% - 0.4% 1.2% 0.1% - 0.4% - 0.3% - 1.5% - 0.9% Q1 Q2 Q3 Q4 Q1 Q2 Q3 Q4 Q1 Q2 3.9% 2.8% 1.2% - 0.8% 0.1% - 3.6% - 4.7% - 4.3% - 5.0% - 4.6% Comparable Store Sales Growth 2.2% 1.2% 1.1% 1.4% 2.1% - 0.4% - 1.0% - 0.3% - 1.1% - 1.8% (1) (1) Script count growth shown on a 30 - day equivalent basis.

Capitalization Table & Leverage ($ in thousands) Note: Debt in the capitalization table is shown net of unamortized debt issuance costs. September 2, 2017 March 4, 2017 Secured Debt: Senior secured revolving credit facility due January 2020 2,219,489$ 2,405,082$ Tranche 1 Term Loan (second lien) due August 2020 466,445 465,833 Tranche 2 Term Loan (second lien) due June 2021 497,851 497,569 Other 90 90 3,183,875 3,368,574 Unsecured Guaranteed Debt: 9.25% senior notes due March 2020 897,510 896,544 6.75% senior notes due June 2021 804,382 803,640 6.125% senior secured notes due April 2023 1,776,154 1,774,016 3,478,046 3,474,200 Unsecured Unguaranteed Debt: 7.7% notes due February 2027 293,457 293,375 6.875% fixed-rate senior notes due December 2028 127,261 127,229 420,718 420,604 Lease financing obligations 60,291 65,315 Total Debt: 7,142,930 7,328,693 Current maturities of long-term debt and lease financing obligations (22,491) (21,335) Long-term debt and lease financing obligations, less current maturities 7,120,439$ 7,307,358$ Leverage Ratio: Total Debt 7,142,930$ 7,328,693$ Add back - Unamortized debt issue costs 64,186 73,784 Total Debt, gross 7,207,116$ 7,402,477$ Less: Cash and cash equivalents 238,978 245,410 6,968,138$ 7,157,067$ Retail Pharmacy Segment Adjusted EBITDA 749,396 948,906 Pharmacy Services Segment Adjusted EBITDA 194,924 188,235 944,320$ 1,137,141$ Debt: EBITDA Leverage Ratio 7.38 6.29

Debt Maturity Profile Maturity table as of September 2, 2017. Note : Maturities reflect calendar year. $2,219 $1,481 $295 $128 $470 $500 $902 $810 $1,800 $0 $500 $1,000 $1,500 $2,000 $2,500 $3,000 $3,500 $4,000 $4,500 $5,000 $5,500 2016 2017 2018 2019 2020 2021 2022 2023 . . . . . . 2027 2028 ($ in millions) Second Lien ABL Funded ABL Unfunded Commitment Senior Unsecured Notes Senior Unsecured (Guaranteed) Notes C allable at 102.313 C allable at 103.375

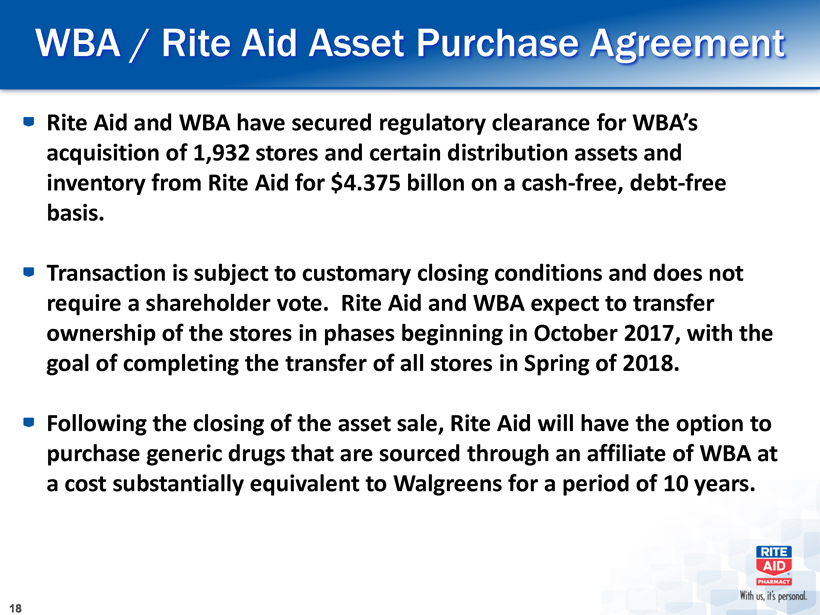
WBA / Rite Aid Asset Purchase Agreement Rite Aid and WBA have secured regulatory clearance for WBA’s acquisition of 1,932 stores and certain distribution assets and inventory from Rite Aid for $4.375 billon on a cash - free, debt - free basis. Transaction is subject to customary closing conditions and does not require a shareholder vote. Rite Aid and WBA expect to transfer ownership of the stores in phases beginning in October 2017, with the goal of completing the transfer of all stores in Spring of 2018. Following the closing of the asset sale, Rite Aid will have the option to purchase generic drugs that are sourced through an affiliate of WBA at a cost substantially equivalent to Walgreens for a period of 10 years.

Current Store Profile As of 9/2/2017 139 14 73 1 576 22 21 274 10 224 115 80 52 25 91 87 222 536 103 79 185 37 68 MA144 RI 43 CT 77 NJ 251 DE 42 D.C. 7 174 596 MD 139 Rite Aid States & Store Count Rite Aid Distribution Centers

Pro - Forma Store Profile Rite Aid States & Store Count Rite Aid Distribution Centers As of 9 /2/2017 139 14 73 1 576 3 273 217 9 534 82 6 62 MA11 CT 34 NJ 133 DE 42 . 323 MD 43 Map represents remaining stores and distribution centers following sale to Walgreens Boots Alliance pursuant to the Amended & Restated Asset Purchase Agreement dated September 18, 2017.

Strong Presence in Key States Note: Represents our position in CBSA’s where we have a presence, based on store count. Source is from Neilsen Trade Dimensions data (February 2017). Stores 1 st 2 nd 3 rd California 576 32% 35% 18% Pennsylvania 534 66% 21% 10% Michigan 273 72% 7% 7% Ohio 217 65% 12% 3% New York 323 30% 10% 25% Washington 139 42% 37% 11% Oregon 73 55% 10% 20% Position in CBSA’s

Asset Sale Pro - Forma Information – Key Assumptions LTM August 2017 data presented on a 52 - week basis instead of on a 53 - week basis Net proceeds of $4.245 billion used to pay down debt (refer to "Sources and Uses" slide) Corporate administration costs are assumed to be reduced by $96 million and adjustments to pro - forma financial information contained herein include an allocation of corporate administration costs to the divested assets to reflect the right - sizing of our administrative function Pro - forma adjustments do not include estimate’s for generic drug purchasing synergies or for any potential purchasing dis - synergies that could occur after the asset sale is completed Pro - forma interest expense assumes borrowings outstanding under a revolving credit facility and that our 6.125% notes due 2023, 7.7% notes due 2027 and 6.875% notes due 2028 remain outstanding following our expected pay down of debt. These assumptions do not necessarily reflect the Company’s final conclusions on post divestiture capitalization. Pro - forma net income does not include the gain on sale of assets that will be recorded The pro - forma information included in this presentation is presented as of and for the last twelve month period ended September 2, 2017, and it is not intended to be a forward looking projection or guidance, which the company has not published

Pro - Forma Financial Information – Reconciliation of Net Income to Adjusted EBITDA ($ in thousands) (1) Includes adjustments to reflect results on a 52 week basis and account for the sale of the divested stores (except for record ing the gain on sale), including, among other things, adjustments to reflect pro - forma interest expense and pro - forma corporate administration costs. (2) Includes income tax valuation allowance adjustments. LTM Ended September 2, 2017 (53 Weeks) Adjustments (1) Pro-Forma LTM September 2, 2017 (52 Weeks) Net income 89,235$ 82,282$ 171,517$ Interest expense 442,688 (234,834) 207,854 Income tax expense (2) 111,651 31,216 142,867 Depreciation and amortization expense 561,496 (159,890) 401,606 LIFO credit (11,625) 4,376 (7,249) Lease termination and impairment charges 49,494 (9,776) 39,718 WBA merger termination fee (325,000) - (325,000) Other 26,381 16,294 42,675 Adjusted EBITDA 944,320$ (270,332)$ 673,988$

Pro - Forma Sources & Uses ($ in millions) Sources Estimated Purchase Price 4,375$ Merger Termination Fee (1) 325 Total Sources 4,700$ Uses Estimated Accrued Liabilities (Net of Retained Assets) (2) 270$ Estimated Restructuring Charges and Transaction Costs 100 Estimated Income Tax Expense on Sale of Assets (3) 85 Estimated Debt Repayments 4,245 Total Uses 4,700$ (1) Fee was received on June 30, 2017. (2) Based on net liability balances as of September 2, 2017. (3) Based on the expected ability as of the date hereof to use the company’s current federal and state tax net operating loss car ryf orwards, and assumes no change in control for purposes of Section 382 under the Internal Revenue Code occurs prior to the closing of the transacti on.

LTM August 2017 Current Rite Aid Pro-Forma Store Count Overview: Store Count 4,507 2,575 Average Square Feet (000s) 13 14 Wellness Remodels 2,532 1,611 (% of Portfolio) 56% 63% Customer World Stores 422 306 (% of Portfolio) 9% 12% Average Per Store ($ in thousands): FE Sales 1,845$ 2,115$ Rx Sales 3,910 4,139 Total Sales 5,755$ 6,254$ Average Weekly Scripts 1,259 1,355 Pro - Forma Store Metrics ($ in millions)
