Attached files
| file | filename |
|---|---|
| 8-K - BANCORP, INC. FORM 8-K - Bancorp, Inc. | bancorp8k.htm |
Exhibit 99.1
Business Review and Plan2nd Quarter 2017 9/27/2017

Forward Looking Statements Statements in this presentation regarding The Bancorp, Inc.’s business that are not historical facts are “forward-looking statements” that involve risks and uncertainties. These statements may be identified by the use of forward-looking terminology, including the words “may,” “believe,” “will,” “expect,” “anticipate,” “estimate,” “intend,” “plan," or similar words. These forward-looking statements are based upon the current beliefs and expectations of The Bancorp, Inc.’s management and are inherently subject to significant business, economic, regulatory, and competitive uncertainties and contingencies, many of which are difficult to predict and beyond our control. For further discussion of these risks and uncertainties, see the “risk factors” sections of The Bancorp, Inc.’s Annual Report on Form 10-K for the year ended December 31, 2016, its other public filings with the SEC and appendix on page 28. In addition, these forward-looking statements are based upon assumptions with respect to future strategies and decisions that are subject to change. Actual results may differ materially from the anticipated results discussed in these forward-looking statements. The forward-looking statements speak only as of the date of this presentation. The Bancorp, Inc. does not undertake to publicly revise or update forward-looking statements in this presentation to reflect events or circumstances that arise after the date of this presentation, except as may be required under applicable law. Safe Harbor Statement under the Private Securities Litigation Reform Act of 1995

The Bancorp Strategy The Bancorp has developed a client-driven business strategy which leverages our strategic assets and has significantly improved our financial performance BUSINESS STRATEGY ELEMENTS:Leverage Payments PlatformValue-added solutionsLow cost fundingSignificant fee incomeBuild out our historically low credit loss lines of businessesFocus on execution Key Financial Metrics Q2 2017 YTD Near term Objective Multi-year Objective Core Revenue Growth1 17% >10% >10% Efficiency Ratio1 80% <80% <65% Return on Equity % 17.2% >5% >10% Return on Assets % 1.3% >0.5% >1% Tier 1/Avg Assets (Inc.) 7.8% >8.5% >9.0% 16/30/2017 vs. 6/30/2016 YTD excluding change in value of unconsolidated entity, gain/loss on sale of: securities, health savings accounts and European payments business

Serving the world’s most successful companies…. 99,000,000 Prepaid Cards in U.S. Distribution 1.1+ BillionMerchant Card Transactions Processed Annually $450 BillionCombined Annual Payments Processing Volume 70kMerchants served within Mastercard/Visa Networks 100+Private-Label Non-Bank Partners TOP 15Automated Clearing House (ACH) Originating Bank >200kACH Originators Sponsored Note: Information as of 6/30/2017 $4.3 Billion Total Assets
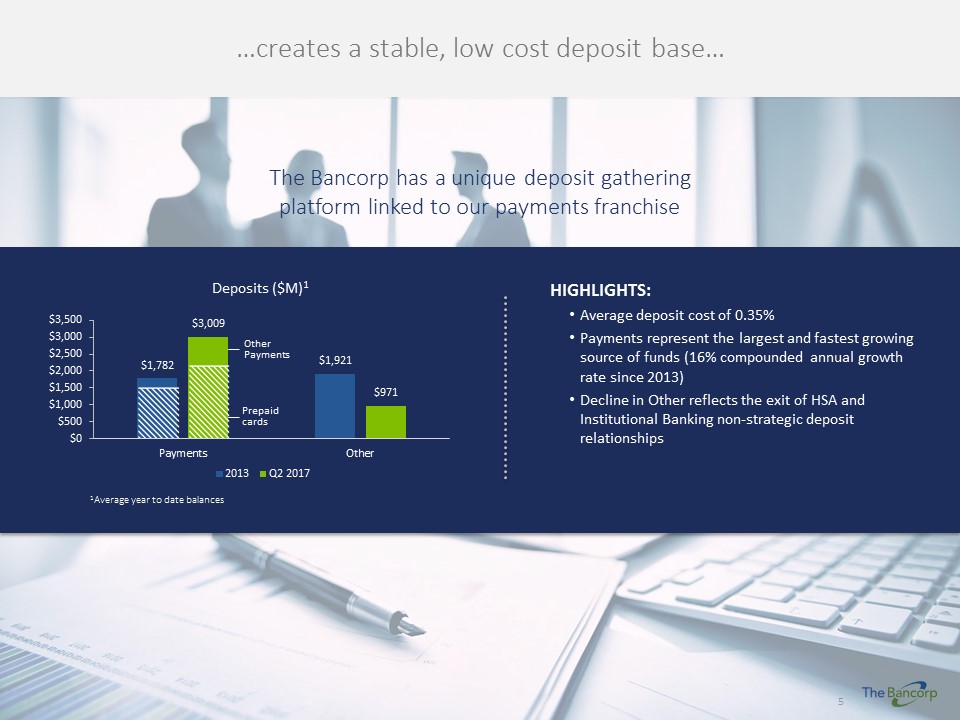
The Bancorp has a unique deposit gathering platform linked to our payments franchise …creates a stable, low cost deposit base… Deposits ($M)1 HIGHLIGHTS:Average deposit cost of 0.35%Payments represent the largest and fastest growing source of funds (16% compounded annual growth rate since 2013)Decline in Other reflects the exit of HSA and Institutional Banking non-strategic deposit relationships 1Average year to date balances Other Payments Prepaid cards

…which we are utilizing to build our lending franchise We will continue to grow our historically low losslending activities within our key business lines Loan balance ($M)1 Institutional Banking Real Estate Capital Markets Small Business Leasing 1End of period balances Niche auto fleet leasing and management SBA and other small business lending Banking and lending solutions for wealth managers Commercial real estate capital markets 2017 Compound Annual Growth Rates for period 2013 – Q2 2017: Institutional Banking 29%, Small Business 35%, Leasing 24% 2Securities-Backed Lines of Credit 2
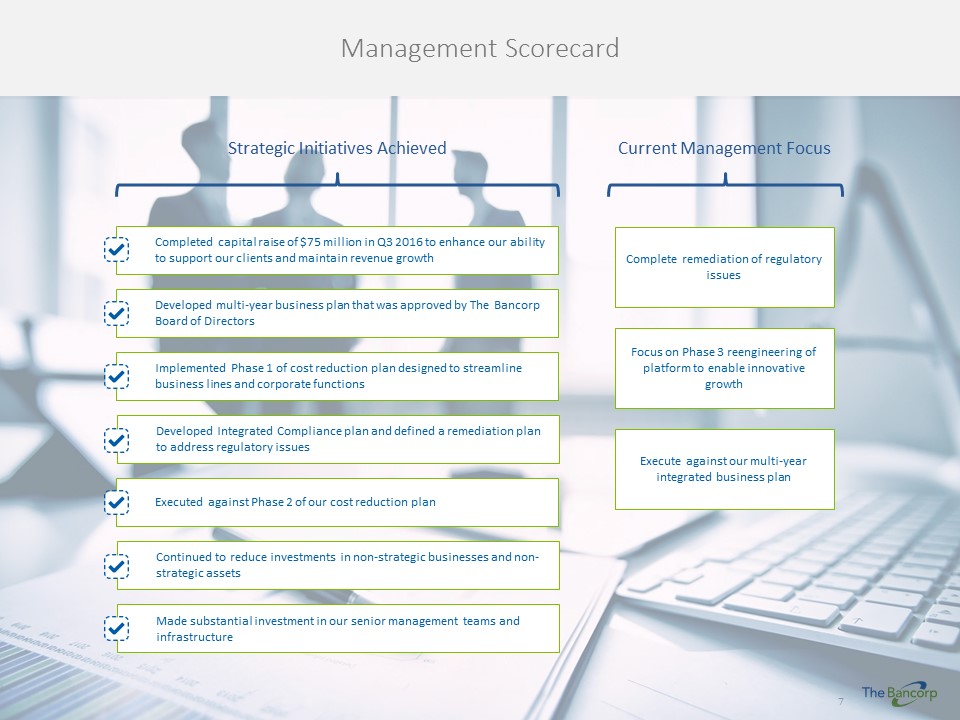
Management Scorecard Completed capital raise of $75 million in Q3 2016 to enhance our ability to support our clients and maintain revenue growth Implemented Phase 1 of cost reduction plan designed to streamline business lines and corporate functions Made substantial investment in our senior management teams and infrastructure Developed multi-year business plan that was approved by The Bancorp Board of Directors Developed Integrated Compliance plan and defined a remediation plan to address regulatory issues Continued to reduce investments in non-strategic businesses and non-strategic assets Executed against Phase 2 of our cost reduction plan Complete remediation of regulatory issues Focus on Phase 3 reengineering of platform to enable innovative growth Current Management Focus Strategic Initiatives Achieved Execute against our multi-year integrated business plan
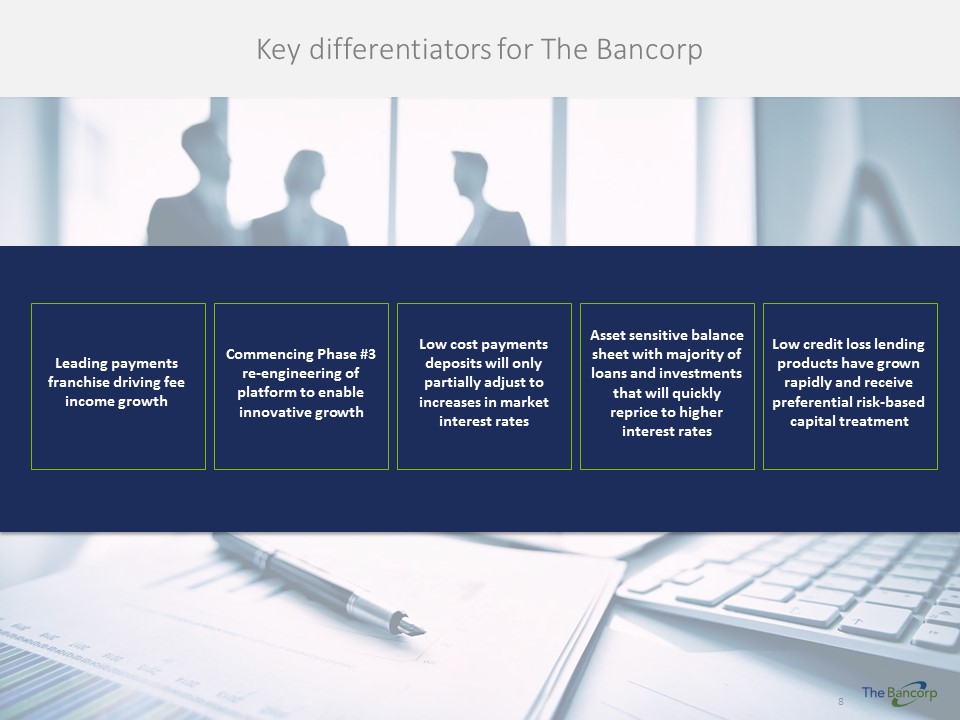
Key differentiators for The Bancorp Leading payments franchise driving fee income growth Commencing Phase #3 re-engineering of platform to enable innovative growth Low cost payments deposits will only partially adjust to increases in market interest rates Asset sensitive balance sheet with majority of loans and investments that will quickly reprice to higher interest rates Low credit loss lending products have grown rapidly and receive preferential risk-based capital treatment

2nd Quarter 2017 Financial and Business Highlights
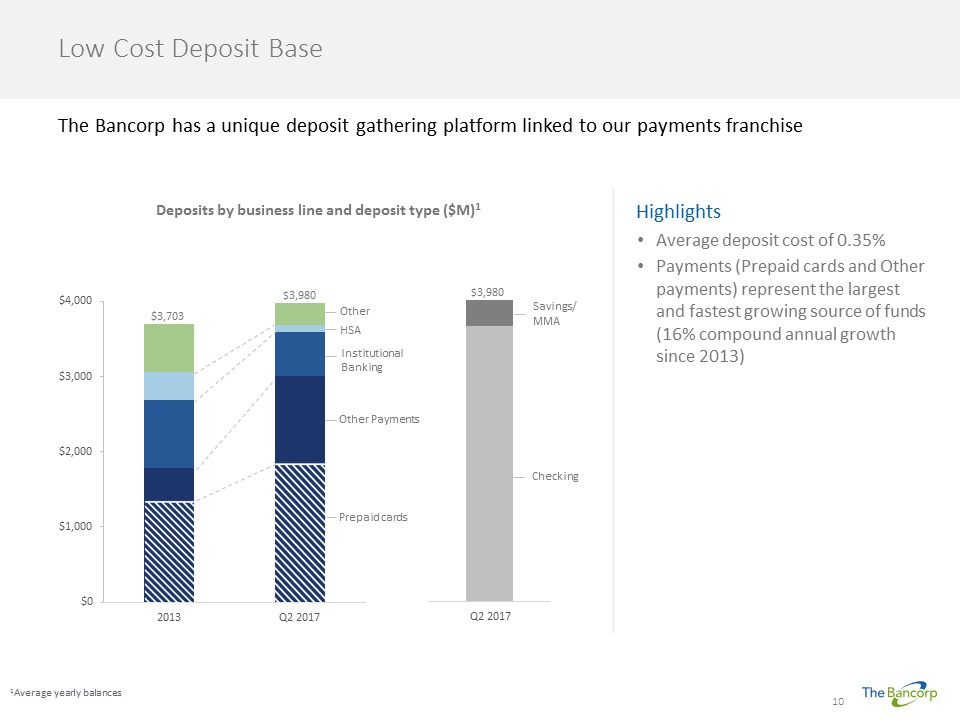
Low Cost Deposit Base 1Average yearly balances The Bancorp has a unique deposit gathering platform linked to our payments franchise HighlightsAverage deposit cost of 0.35% Payments (Prepaid cards and Other payments) represent the largest and fastest growing source of funds (16% compound annual growth since 2013) $3,703 Other Payments HSA Institutional Banking Other Savings/MMA Checking $3,980 Deposits by business line and deposit type ($M)1 Q2 2017 $3,980 Prepaid cards
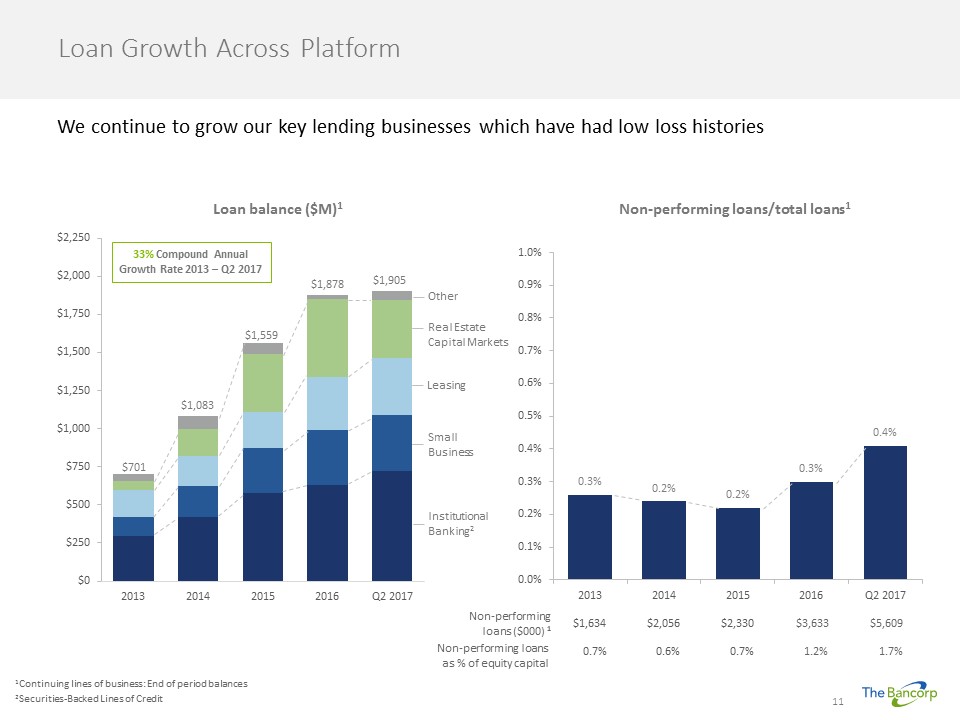
Loan Growth Across Platform We continue to grow our key lending businesses which have had low loss histories Loan balance ($M)1 Non-performing loans/total loans1 Other Leasing Small Business Real EstateCapital Markets Institutional Banking2 $701 $1,083 $1,559 $1,878 $1,634 $2,056 $2,330 $3,633 Non-performing loans ($000) 1 1Continuing lines of business: End of period balances2Securities-Backed Lines of Credit $1,905 $5,609 Non-performing loans as % of equity capital 0.7% 0.6% 0.7% 1.2% 1.7%
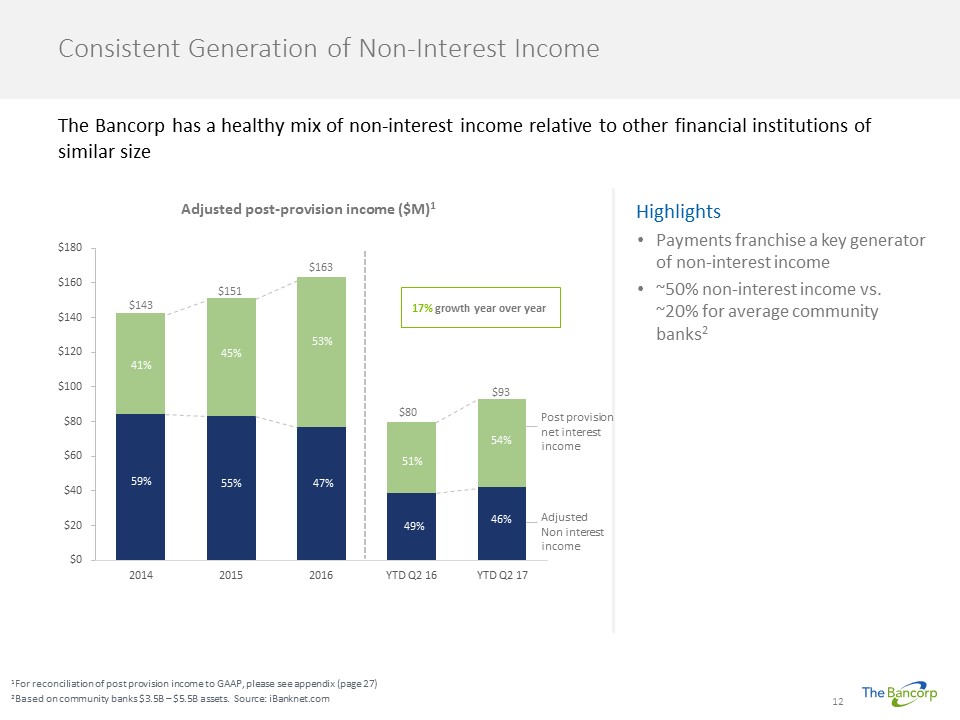
Consistent Generation of Non-Interest Income HighlightsPayments franchise a key generator of non-interest income~50% non-interest income vs. ~20% for average community banks2 1For reconciliation of post provision income to GAAP, please see appendix (page 27)2Based on community banks $3.5B – $5.5B assets. Source: iBanknet.com The Bancorp has a healthy mix of non-interest income relative to other financial institutions of similar size Adjusted post-provision income ($M)1 41% 59% 47% 45% 54% 46% 51% 49% Adjusted Non interest income Post provision net interest income 17% growth year over year 55% 53%
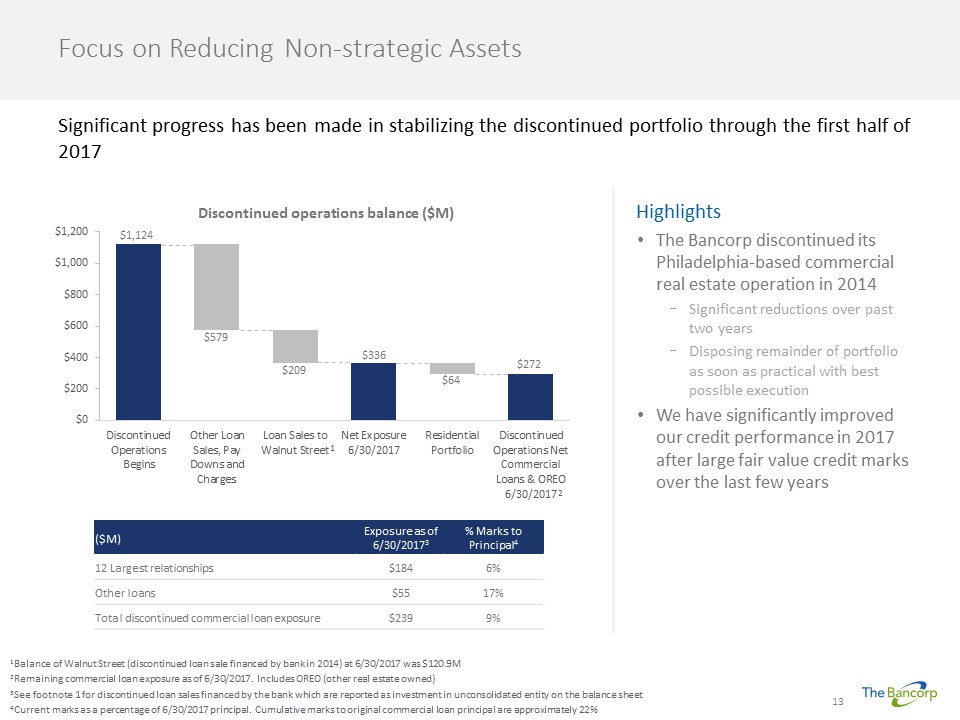
Focus on Reducing Non-strategic Assets HighlightsThe Bancorp discontinued its Philadelphia-based commercial real estate operation in 2014 Significant reductions over past two yearsDisposing remainder of portfolio as soon as practical with best possible executionWe have significantly improved our credit performance in 2017 after large fair value credit marks over the last few years Significant progress has been made in stabilizing the discontinued portfolio through the first half of 2017 $579 $209 $336 $64 $272 Discontinued operations balance ($M) ($M) Exposure as of 6/30/20173 % Marks to Principal4 12 Largest relationships $184 6% Other loans $55 17% Total discontinued commercial loan exposure $239 9% 1Balance of Walnut Street (discontinued loan sale financed by bank in 2014) at 6/30/2017 was $120.9M2Remaining commercial loan exposure as of 6/30/2017. Includes OREO (other real estate owned)3See footnote 1 for discontinued loan sales financed by the bank which are reported as investment in unconsolidated entity on the balance sheet4Current marks as a percentage of 6/30/2017 principal. Cumulative marks to original commercial loan principal are approximately 22% 1 2
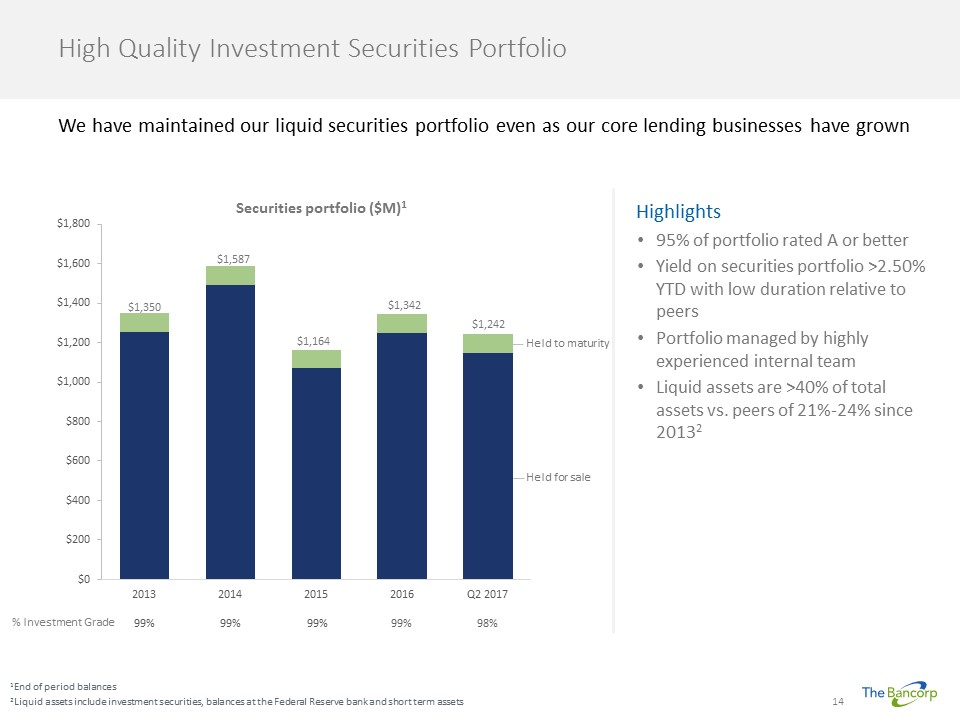
High Quality Investment Securities Portfolio Highlights95% of portfolio rated A or betterYield on securities portfolio >2.50% YTD with low duration relative to peersPortfolio managed by highly experienced internal teamLiquid assets are >40% of total assets vs. peers of 21%-24% since 20132 1End of period balances2Liquid assets include investment securities, balances at the Federal Reserve bank and short term assets We have maintained our liquid securities portfolio even as our core lending businesses have grown Held for sale Held to maturity Securities portfolio ($M)1 99% 99% 99% 99% % Investment Grade 98%
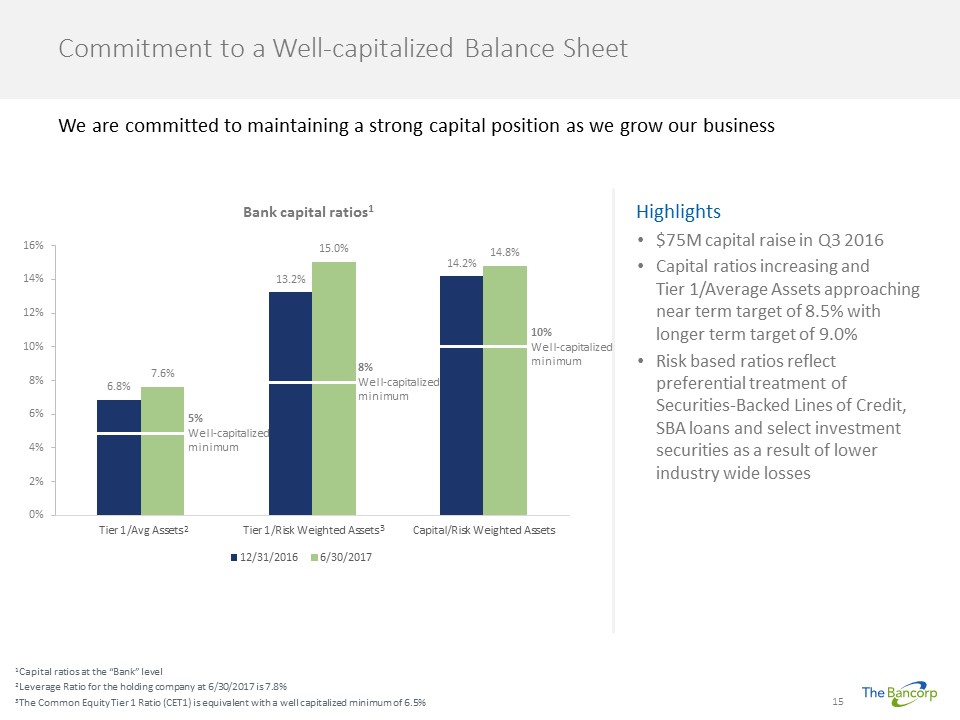
Commitment to a Well-capitalized Balance Sheet Highlights$75M capital raise in Q3 2016Capital ratios increasing and Tier 1/Average Assets approaching near term target of 8.5% with longer term target of 9.0%Risk based ratios reflect preferential treatment of Securities-Backed Lines of Credit, SBA loans and select investment securities as a result of lower industry wide losses 1Capital ratios at the “Bank” level2Leverage Ratio for the holding company at 6/30/2017 is 7.8%3The Common Equity Tier 1 Ratio (CET1) is equivalent with a well capitalized minimum of 6.5% We are committed to maintaining a strong capital position as we grow our business 5%Well-capitalizedminimum 8%Well-capitalizedminimum 10%Well-capitalizedminimum Bank capital ratios1 3 2
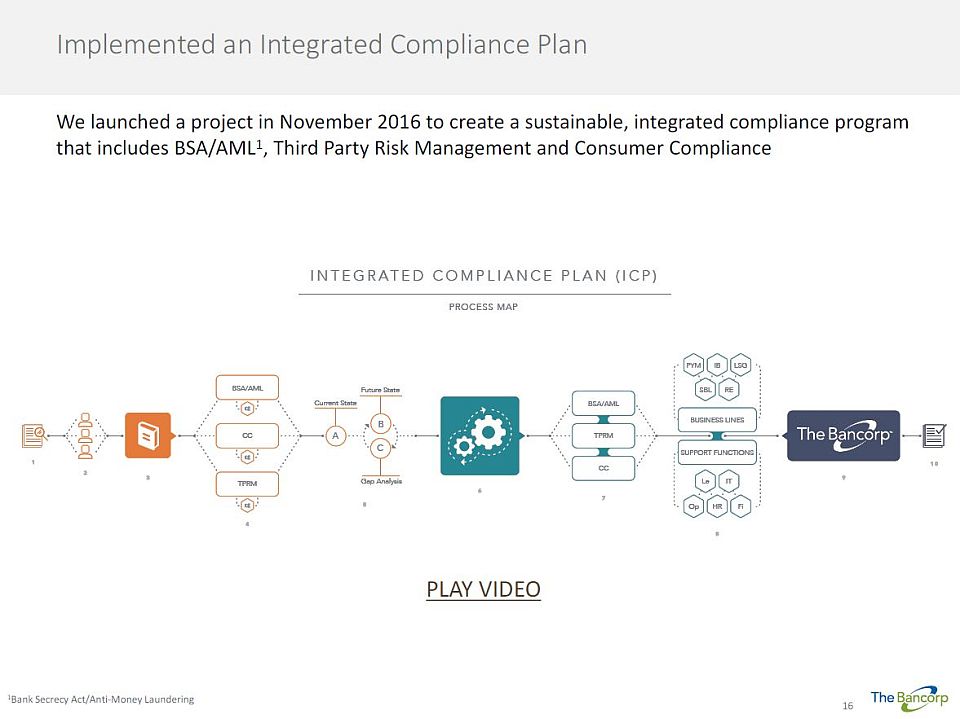
Implemented an Integrated Compliance Plan We launched a project in November 2016 to create a sustainable, integrated compliance program that includes BSA/AML1, Third Party Risk Management and Consumer Compliance PLAY VIDEO 1Bank Secrecy Act/Anti-Money Laundering
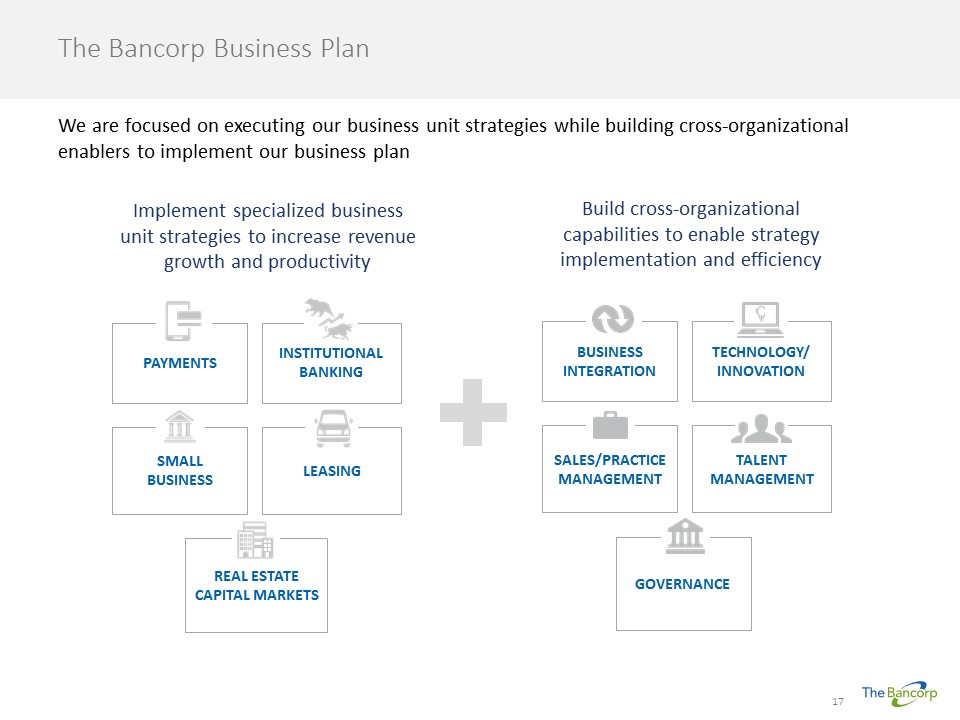
The Bancorp Business Plan We are focused on executing our business unit strategies while building cross-organizational enablers to implement our business plan Implement specialized business unit strategies to increase revenue growth and productivity PAYMENTS INSTITUTIONAL BANKING SMALL BUSINESS LEASING REAL ESTATE CAPITAL MARKETS BUSINESSINTEGRATION TECHNOLOGY/INNOVATION SALES/PRACTICEMANAGEMENT TALENTMANAGEMENT GOVERNANCE Build cross-organizational capabilities to enable strategy implementation and efficiency
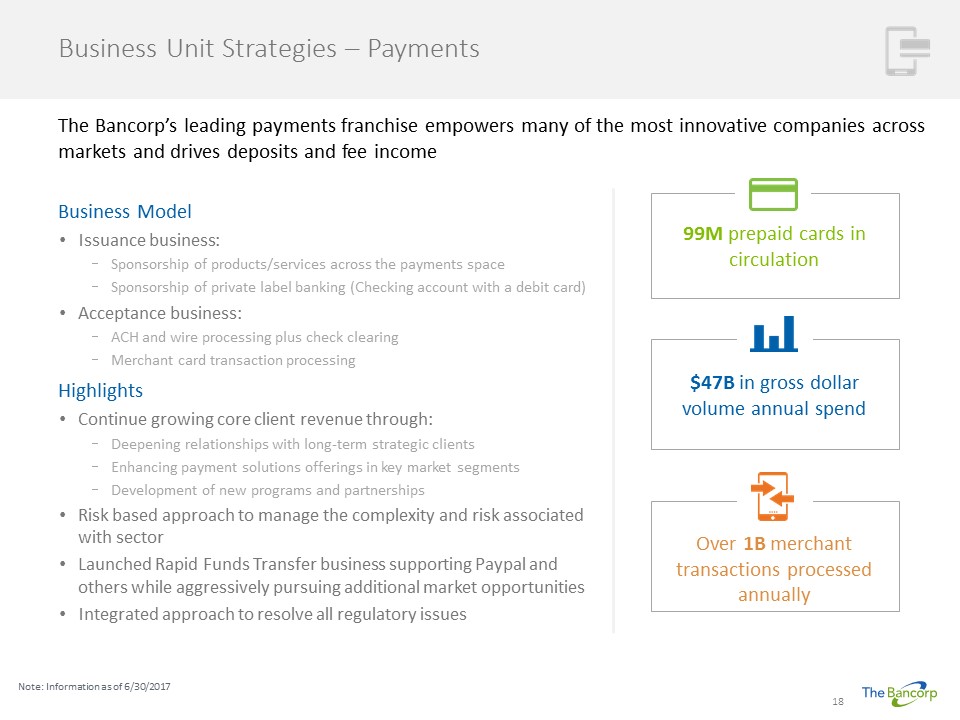
Business Unit Strategies – Payments The Bancorp’s leading payments franchise empowers many of the most innovative companies across markets and drives deposits and fee income Business ModelIssuance business:Sponsorship of products/services across the payments spaceSponsorship of private label banking (Checking account with a debit card)Acceptance business:ACH and wire processing plus check clearingMerchant card transaction processingHighlightsContinue growing core client revenue through:Deepening relationships with long-term strategic clientsEnhancing payment solutions offerings in key market segmentsDevelopment of new programs and partnershipsRisk based approach to manage the complexity and risk associated with sectorLaunched Rapid Funds Transfer business supporting Paypal and others while aggressively pursuing additional market opportunitiesIntegrated approach to resolve all regulatory issues 99M prepaid cards in circulation Over 1B merchant transactions processed annually $47B in gross dollar volume annual spend Note: Information as of 6/30/2017
Business Unit Strategies – Payments The Bancorp’s leading payments franchise empowers many of the most innovative companies across markets and drives deposits and fee income Business ModelIssuance business:Sponsorship of products/services 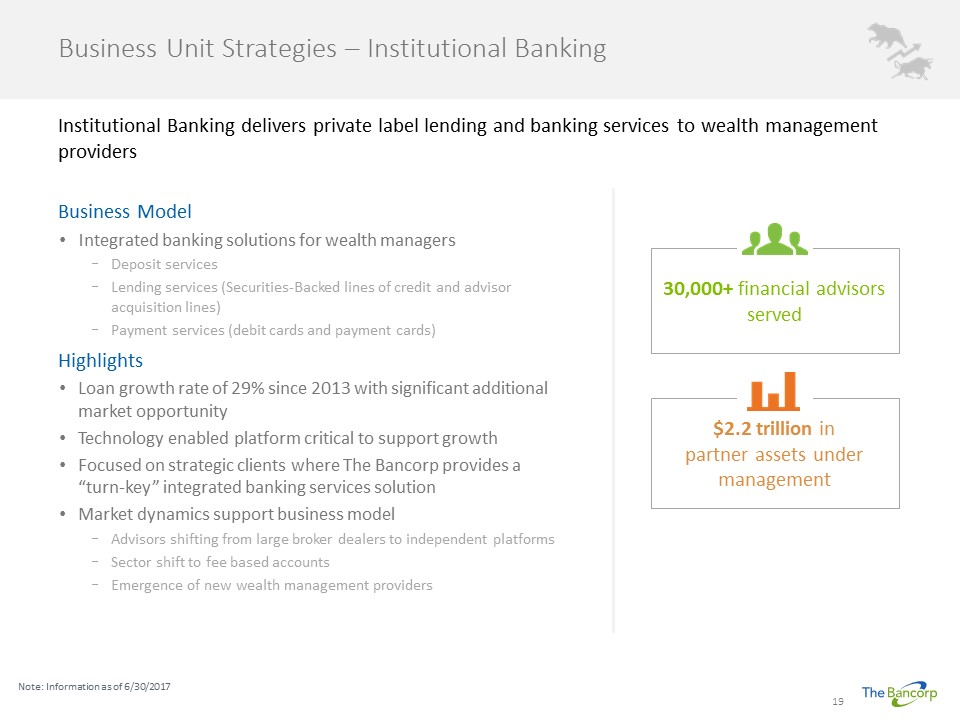
Business Unit Strategies – Institutional Banking Institutional Banking delivers private label lending and banking services to wealth management providers Business ModelIntegrated banking solutions for wealth managersDeposit services Lending services (Securities-Backed lines of credit and advisor acquisition lines)Payment services (debit cards and payment cards)HighlightsLoan growth rate of 29% since 2013 with significant additional market opportunityTechnology enabled platform critical to support growthFocused on strategic clients where The Bancorp provides a “turn-key” integrated banking services solutionMarket dynamics support business modelAdvisors shifting from large broker dealers to independent platformsSector shift to fee based accountsEmergence of new wealth management providers 30,000+ financial advisors served $2.2 trillion in partner assets under management Note: Information as of 6/30/2017

Business Unit Strategies – Small Business The Bancorp is building a focused small business lending platform in attractive regional markets and client segments Business ModelBuilding a distinct platform within the fragmented SBA marketNational portfolio lender approach allows pricing and client flexibilityHighly focused business unit allows for commitment to operational excellenceSolid credit performance over timeHighlightsFocused on building an integrated national platformClient segment strategy tailored by marketExpansion of businesses development capacityLeverage referral network within The BancorpEvaluating new segments and related small business fin-tech opportunities $700K average7a loan size Compound growth rate of 35% since 2013 Note: Information as of 6/30/2017

Business Unit Strategies – Leasing The Bancorp has built a leasing business that is focused on delivering solutions to commercial and government entities with small auto/truck fleets Business ModelNiche provider of vehicle leasing solutionsFocus on smaller fleets (less than 100 vehicles)Direct lessor (Bancorp sources opportunities directly) and provides value-added servicesHealthy mix of commercial and government-related business (70% commercial)Historical acquisition integration capability is a key driver of growthHighlightsMeaningful organic growth opportunities given fragmented market Near-term strategic prioritiesEnhance sales process and staffing modelPursue technology/operations enhancements to scale business Compound growth rate of 24% since 2013 38% auto/ 62% trucks >$300M in current leasing contracts Note: Information as of 6/30/2017
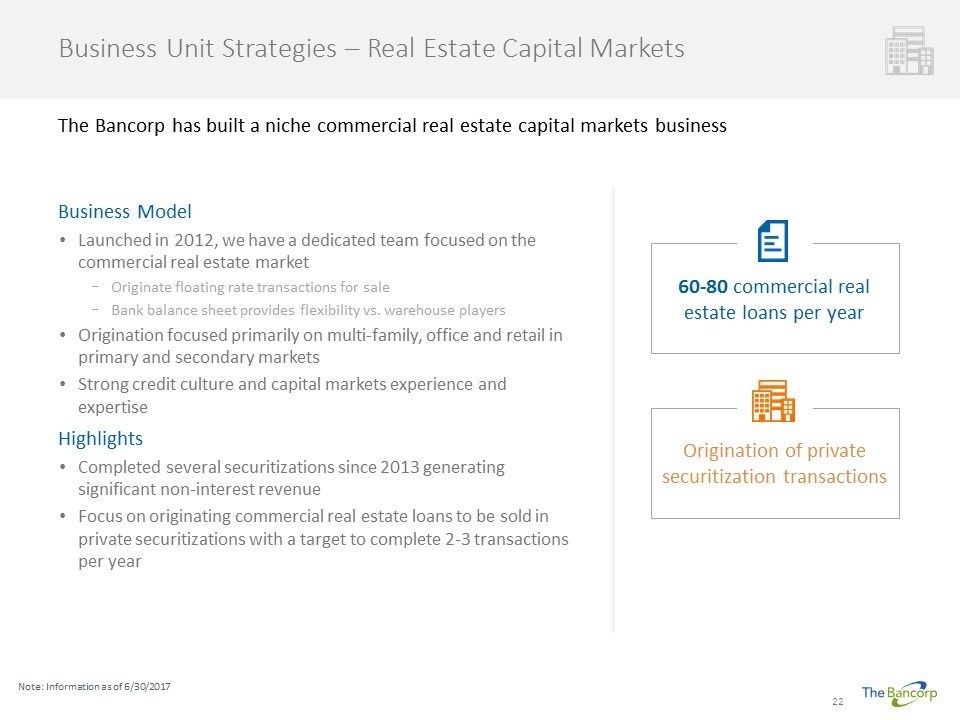
Business Unit Strategies – Real Estate Capital Markets The Bancorp has built a niche commercial real estate capital markets business Business ModelLaunched in 2012, we have a dedicated team focused on the commercial real estate marketOriginate floating rate transactions for saleBank balance sheet provides flexibility vs. warehouse playersOrigination focused primarily on multi-family, office and retail in primary and secondary marketsStrong credit culture and capital markets experience and expertiseHighlightsCompleted several securitizations since 2013 generating significant non-interest revenueFocus on originating commercial real estate loans to be sold in private securitizations with a target to complete 2-3 transactions per year 60-80 commercial real estate loans per year Origination of private securitization transactions Note: Information as of 6/30/2017

The Bancorp Business Plan – Key Enablers We have taken action to build cross-organizational capabilities and processes to enable the execution of our strategy TALENTMANAGEMENT BUSINESSINTEGRATION GOVERNANCE SALES/PRACTICEMANAGEMENT TECHNOLOGY/INNOVATION Key Business EnablersQ2 2017 Highlights: Executing on our Integrated Compliance PlanImplemented enterprise project and vendor management offices Executing on Institutional Banking loan automation projectEnhancing Financial Crimes platform and processes Revised incentive plans for select business unitsInitiated development of sub-branding and marketing plans for business units Made key leadership appointments across platformCompleted succession planning process for all critical roles Upgraded compliance and risk management talentRevised executive and senior management committee structure

Appendix
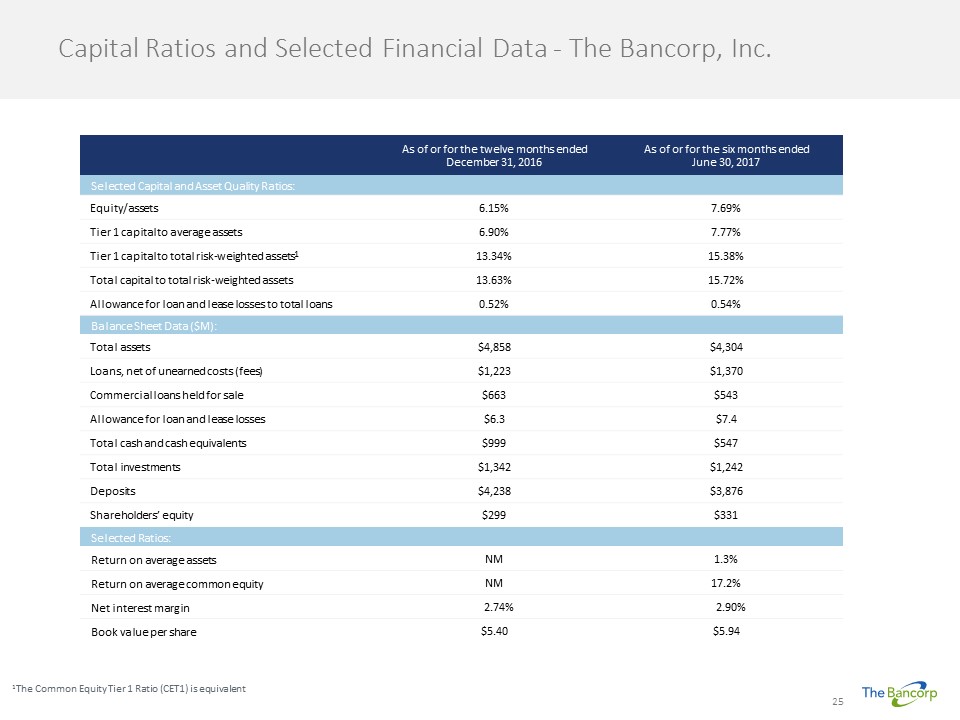
Capital Ratios and Selected Financial Data - The Bancorp, Inc. As of or for the twelve months ended December 31, 2016 As of or for the six months ended June 30, 2017 Selected Capital and Asset Quality Ratios: Equity/assets 6.15% 7.69% Tier 1 capital to average assets 6.90% 7.77% Tier 1 capital to total risk-weighted assets 13.34% 15.38% Total capital to total risk-weighted assets 13.63% 15.72% Allowance for loan and lease losses to total loans 0.52% 0.54% Balance Sheet Data ($M): Total assets $4,858 $4,304 Loans, net of unearned costs (fees) $1,223 $1,370 Commercial loans held for sale $663 $543 Allowance for loan and lease losses $6.3 $7.4 Total cash and cash equivalents $999 $547 Total investments $1,342 $1,242 Deposits $4,238 $3,876 Shareholders’ equity $299 $331 Selected Ratios: Return on average assets NM 1.3% Return on average common equity NM 17.2% Net interest margin 2.74% 2.90% Book value per share $5.40 $5.94 1The Common Equity Tier 1 Ratio (CET1) is equivalent 1

Loan Portfolio and Asset Quality Overview Category(000s) 2013 2014 2015 2016 Q2 2017 Balance % of Total Loans Non-accrual Loans OREO 30-89 Days Delinquent 90+ Days Delinquent Q2 2017 YTD Charge-offs (net) SBA1 $115,656 $165,134 $189,893 $209,629 $211,792 11% $3,612 - $770 - $134 SBA1 held for sale $14,708 $38,704 $109,174 $154,016 $158,389 8% - - - - - Leasing $175,610 $194,464 $231,514 $346,645 $371,002 19% - - $3,713 $494 $202 Security backed lines of credit $293,109 $421,862 $575,948 $630,400 $718,707 39% - - - - - Other consumer lending $45,152 $36,168 $23,180 $17,374 $15,858 1% $1,503 - $481 - ($7) Other specialty lending $1,588 $48,625 $48,315 $11,073 $44,389 2% - - - - - Real Estate Cap Mkts. $55,196 $178,376 $380,764 $509,124 $384,430 20% - - - - - Total $701,020 $1,083,333 $1,558,788 $1,878,261 $1,904,567 100% $5,115 $0 $4,964 $494 $329 1Small Business Administration
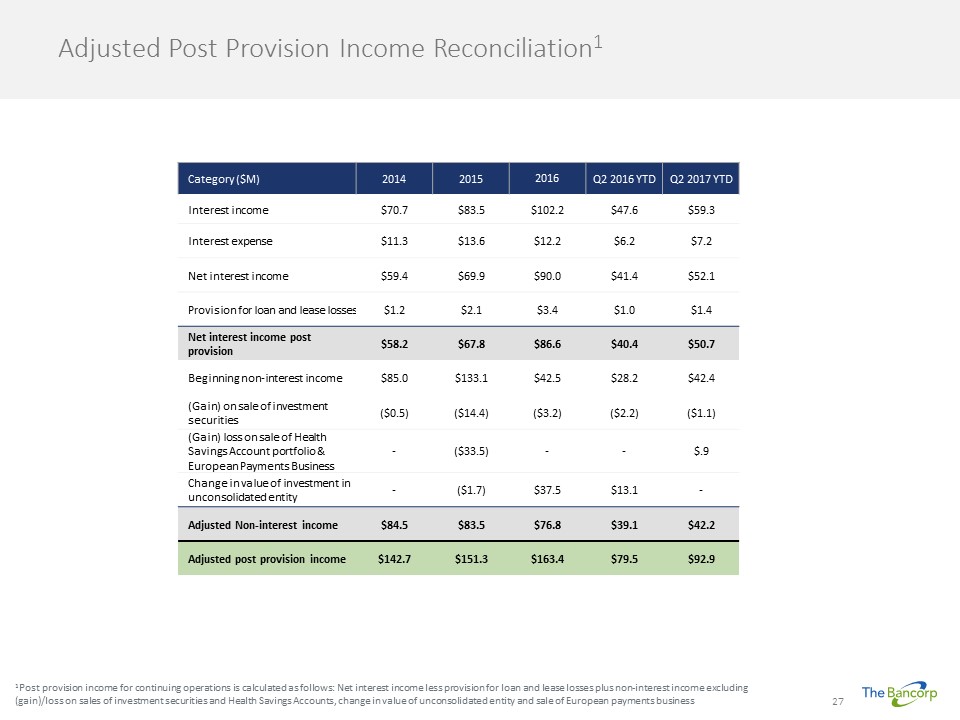
Adjusted Post Provision Income Reconciliation1 1Post provision income for continuing operations is calculated as follows: Net interest income less provision for loan and lease losses plus non-interest income excluding (gain)/loss on sales of investment securities and Health Savings Accounts, change in value of unconsolidated entity and sale of European payments business Category ($M) 2014 2015 2016 Q2 2016 YTD Q2 2017 YTD Interest income $70.7 $83.5 $102.2 $47.6 $59.3 Interest expense $11.3 $13.6 $12.2 $6.2 $7.2 Net interest income $59.4 $69.9 $90.0 $41.4 $52.1 Provision for loan and lease losses $1.2 $2.1 $3.4 $1.0 $1.4 Net interest income post provision $58.2 $67.8 $86.6 $40.4 $50.7 Beginning non-interest income $85.0 $133.1 $42.5 $28.2 $42.4 (Gain) on sale of investment securities ($0.5) ($14.4) ($3.2) ($2.2) ($1.1) (Gain) loss on sale of Health Savings Account portfolio & European Payments Business - ($33.5) - - $.9 Change in value of investment in unconsolidated entity - ($1.7) $37.5 $13.1 - Adjusted Non-interest income $84.5 $83.5 $76.8 $39.1 $42.2 Adjusted post provision income $142.7 $151.3 $163.4 $79.5 $92.9
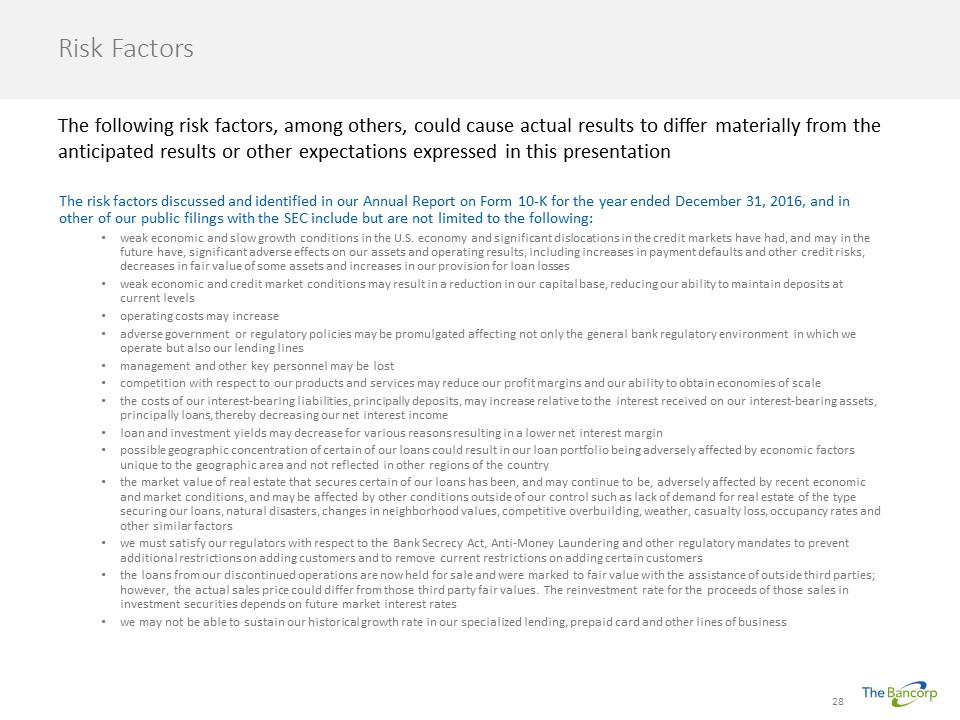
Risk Factors The risk factors discussed and identified in our Annual Report on Form 10-K for the year ended December 31, 2016, and in other of our public filings with the SEC include but are not limited to the following:weak economic and slow growth conditions in the U.S. economy and significant dislocations in the credit markets have had, and may in the future have, significant adverse effects on our assets and operating results, including increases in payment defaults and other credit risks, decreases in fair value of some assets and increases in our provision for loan lossesweak economic and credit market conditions may result in a reduction in our capital base, reducing our ability to maintain deposits at current levelsoperating costs may increaseadverse government or regulatory policies may be promulgated affecting not only the general bank regulatory environment in which we operate but also our lending linesmanagement and other key personnel may be lostcompetition with respect to our products and services may reduce our profit margins and our ability to obtain economies of scalethe costs of our interest-bearing liabilities, principally deposits, may increase relative to the interest received on our interest-bearing assets, principally loans, thereby decreasing our net interest incomeloan and investment yields may decrease for various reasons resulting in a lower net interest marginpossible geographic concentration of certain of our loans could result in our loan portfolio being adversely affected by economic factors unique to the geographic area and not reflected in other regions of the countrythe market value of real estate that secures certain of our loans has been, and may continue to be, adversely affected by recent economic and market conditions, and may be affected by other conditions outside of our control such as lack of demand for real estate of the type securing our loans, natural disasters, changes in neighborhood values, competitive overbuilding, weather, casualty loss, occupancy rates and other similar factorswe must satisfy our regulators with respect to the Bank Secrecy Act, Anti-Money Laundering and other regulatory mandates to prevent additional restrictions on adding customers and to remove current restrictions on adding certain customersthe loans from our discontinued operations are now held for sale and were marked to fair value with the assistance of outside third parties; however, the actual sales price could differ from those third party fair values. The reinvestment rate for the proceeds of those sales in investment securities depends on future market interest rateswe may not be able to sustain our historical growth rate in our specialized lending, prepaid card and other lines of business The following risk factors, among others, could cause actual results to differ materially from the anticipated results or other expectations expressed in this presentation