Attached files
| file | filename |
|---|---|
| 8-K - CAPSTONE COMPANIES, INC. | form8k092217.htm |

MICROCAP LEADERSHIP SUMMITInvestor PresentationFriday, September 22, 2017 OTCQB: CAPC Stewart WallachPresident & CEOAimee GaudetCorporate Secretary
This presentation contains "forward-looking statements" as that term is defined in the Private Securities Litigation Reform Act of 1995, as amended. Such statements consist of words like “anticipate,” “expect,” “project,” “continue” and similar words. These statements are based on the Company’s and its subsidiaries’ current expectations and involve risks and uncertainties, which may cause results to differ materially from those set forth in the forward-looking statements. Factors that may cause actual results to differ materially from those contemplated by such forward-looking statements include consumer acceptance of the Company’s products, its ability to deliver new products, the success of its strategy to broaden market channels and the relationships it has with retailers and distributors. Prior success in operations does not necessarily mean success in future operations. The ability of the Company to adequately and affordably fund operations and any growth will be critical to achieving and sustaining any expansion of markets and revenue. The introduction of new products or the expanded availability of products does not mean that the Company will enjoy better financial or business performance. The risk that the audit could cause results to differ materially from what is presented within and the risks associated with any investment in Capstone Companies, Inc., which is a small business concern and a "penny-stock Company” and, as such, a highly risky investment suitable for only those who can afford to lose such investment, should be evaluated together with the risks and uncertainties more fully described in the Company’s Annual and Quarterly Reports filed with the Securities and Exchange Commission. Capstone Companies, Inc. undertakes no obligation to publicly update or revise any forward-looking statement, whether as a result of new information, future events, or otherwise. Contents of referenced URLs are not incorporated into this presentation. SAFE HARBOR

Creating and Delivering LED Lighting for Consumers Worldwide Recent Price $0.495 Shares outstanding (millions) 47.0 Market Capitalization (millions) $23.3 Float (millions) 24.0 Avg. daily volume (3 mo., thousands) 25.2 Insider ownership 41.2% Book value per share $0.129 2016 Revenue (millions) $30.6 2014 – 2016 revenue CAGR* 50.0% CAPC INVESTMENT OPPORTUNITY SUMMARY Market data is as of 09/13/2017; ownership is as of latest filing; book value per share is as of 06/30/2017* Compound Annual Growth Rate All 2017 financial data in this presentation is preliminary and unaudited.

Decorative & AestheticAccent LightingBath Vanity LightingSconcesUnder Cabinet LightingOutdoor FixturesPower FailureTurns on when the power goes outSafety & SecurityMotion Sensor LightingNight Lights DIVERSE CONSUMER LED LIGHTING PRODUCTS
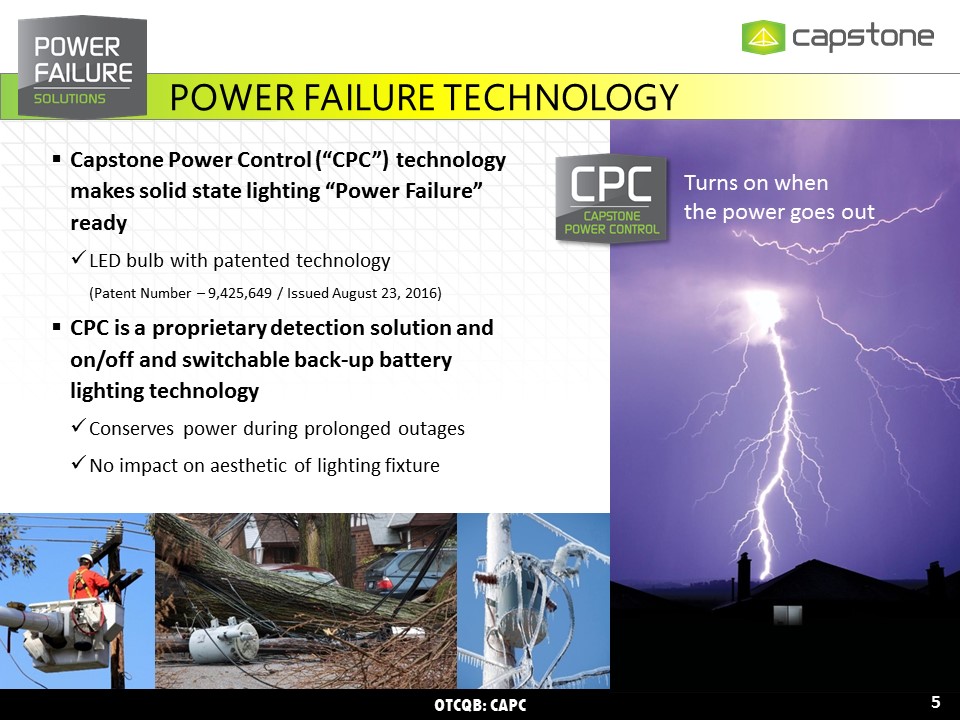
POWER FAILURE TECHNOLOGY Capstone Power Control (“CPC”) technology makes solid state lighting “Power Failure” readyLED bulb with patented technology (Patent Number – 9,425,649 / Issued August 23, 2016)CPC is a proprietary detection solution and on/off and switchable back-up battery lighting technologyConserves power during prolonged outagesNo impact on aesthetic of lighting fixture Turns on whenthe power goes out

BUILDING A LEADER IN LED LIGHTING Growing Global LED lighting market Expected to grow to ~$42 billion by 2020*Annual growth rate of approximately 13.5%*Expanding offerings into all categories of LED home lightingFocused on product opportunities where Capstone provides a perceptible differenceLeveraging product successes & momentumOngoing development of innovative and advanced ideas and conceptsBranding Strategy: Establishing multiple trusted brandsCapstone LightingDuracellHoover Home LED * Source: Allied Market Research, September 2014 Global Light Emitting Diode Market Report 13.5% Annual Growth* GLOBALLED LIGHTINGMARKET By 2020$42 BILLION
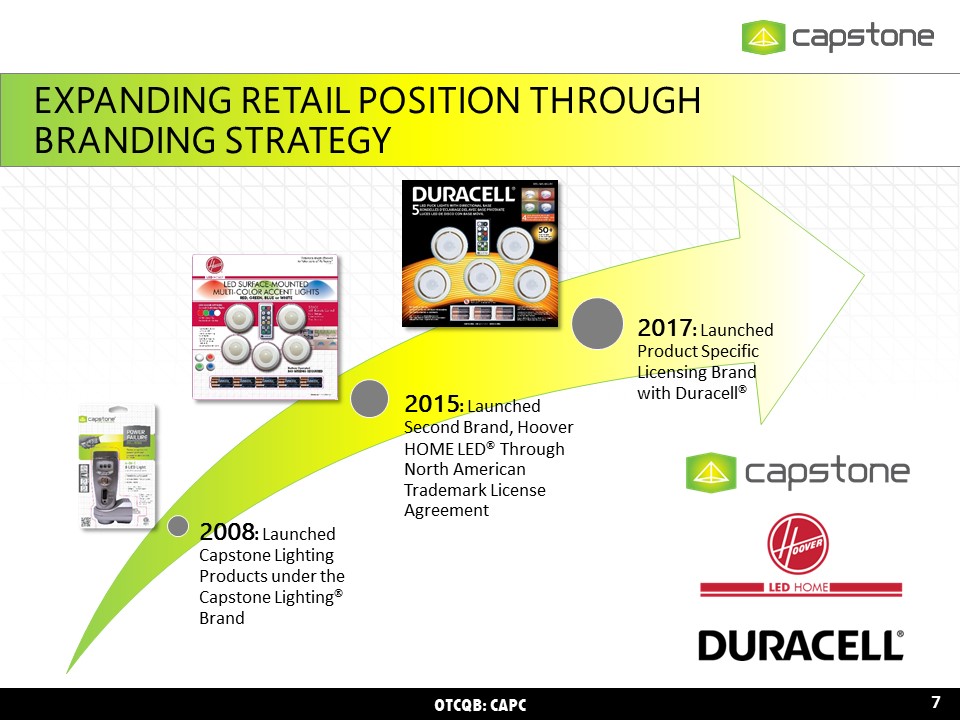
EXPANDING RETAIL POSITION THROUGH BRANDING STRATEGY

Low cost offshore manufacturingManufacturing partners held to compliance, security and equipment evaluation auditsCapstone Hong Kong based team manages and oversees all QA/QC testingOn demand manufacturing and importingBenefits working capitalU.S. warehouse provides capacity for minimal onshore stocking and service as required DIRECT IMPORT BUSINESS MODEL

GLOBAL CUSTOMERS & END MARKETS International MarketsAustraliaFranceIcelandJapanMexicoNew ZealandNorth AmericaSouth KoreaSpainTaiwanThailandUnited Kingdom
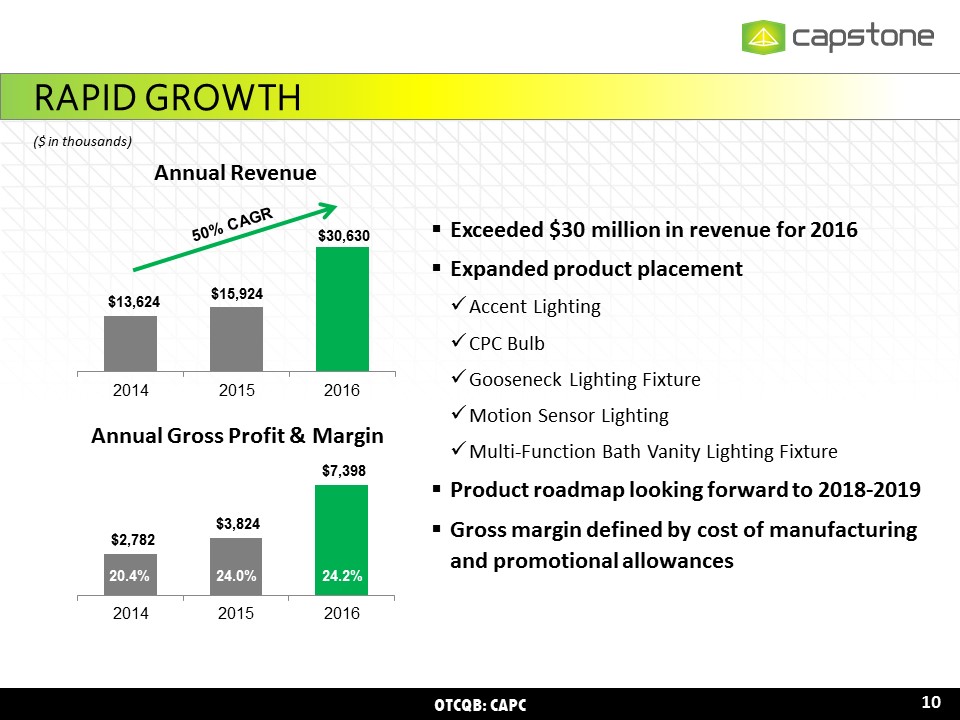
Exceeded $30 million in revenue for 2016Expanded product placementAccent LightingCPC BulbGooseneck Lighting FixtureMotion Sensor LightingMulti-Function Bath Vanity Lighting FixtureProduct roadmap looking forward to 2018-2019 Gross margin defined by cost of manufacturing and promotional allowances RAPID GROWTH Annual Revenue Annual Gross Profit & Margin ($ in thousands)

SIGNIFICANT OPERATING LEVERAGE Annual Operating Profit & Margin ($ in thousands) Annual Net (Loss) Income Strong operating leverage on higher salesInterest expense impact:2014: $328 thousand2015: $317 thousand2016: $281 thousand

SETTING NEW RECORDS 20.0% 29.5% 23.9% 12.7% 7.6% 12.2% Expanded product portfolio drives record setting revenue and gross profitSeasonality: Promotional scheduling typically dampens Q1 results and drives stronger Q2 and Q3 ($ in thousands) All 2017 financial data in this presentation is preliminary and unaudited. Q1 2016 Q2 2016 Q3 2016 Q4 2016 Q1 2017 Q2 2017 Quarterly Revenue $2,078 $8,902 $11,692 $7,958 $6,752 $10,220 Quarterly Gross Profit $ 614 $ 2,129 $ 2,851 $ 1,804 $ 1,579 $ 2,643 % to Revenue 29.5% 23.9% 24.4% 22.7% 23.4% 25.9% Quarterly Income Before Taxes $ (99) $ 1,095 $ 1,514 $ 578 $ 379 $ 1,303 % to Revenue -4.8% 12.3% 12.9% 7.3% 5.6% 12.7% Quarterly Net Income $ (99) $ 1,082 $ 1,490 $ 348 $ 251 $ 901 % to Revenue -4.76% 12.15% 12.74% 4.37% 3.72% 8.82%

Net working capital = (current assets – cash) – (current liabilities – short term debt). Average net working capital is used in calculations.EBITDA is a non-GAAP financial measure. Please see supplemental slides for a reconciliation of GAAP Net Income to EBITDA and other important disclosures regarding the company’s use of EBITDAAs of June 30, 2017 BALANCE SHEET Strong cash generation and financial flexibilityLow working capital requirementsInitiated stock buy back program in 2016Authorized $750kExtended through 2017Repurchased 1.667 mm shares through April 2017 Net Working Capital as a % of Sales(1) Total Debt & Stockholders’ Equity Total Debt to EBITDA(2) ($ in thousands) All 2017 financial data in this presentation is preliminary and unaudited. (3)

Rapidly growing LED lighting companyDesigns and engineers unique productswith broad consumer appealUntapped intellectual property andlicensing opportunitiesHoover® license agreement and partnerships accelerate end-user adoption Industry leaders with over 100 yearsof combined experience in internationalbusiness and offshore manufacturingEstablished relationships with large retailersLow cost manufacturing → Strong margin profile Direct import distribution → Low working capital KEY TAKEAWAYS

MICROCAP LEADERSHIP SUMMITInvestor PresentationFriday, September 22, 2017 OTCQB: CAPC

SUPPLEMENTAL SLIDES

COMPETITIVE LANDSCAPE Highly competitive LED lighting market with several large global manufacturers specifically bulb manufacturersRecognized CompetitionAmertacFeitInternational Development GroupJascoPrivate-label lighting offered by large retailers impacts market in some geographic regions
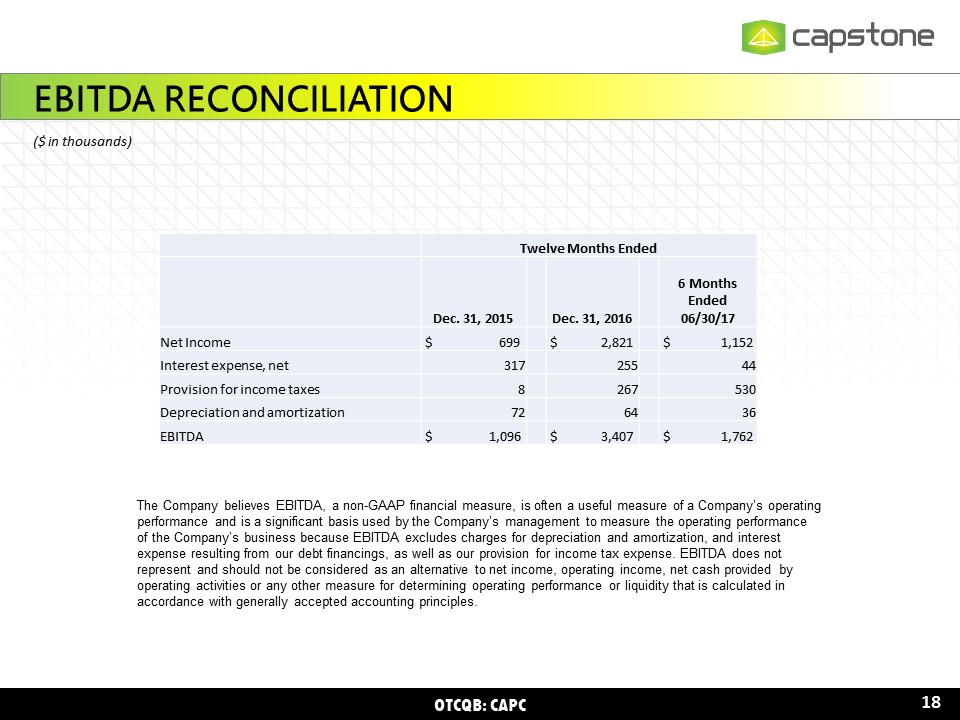
The Company believes EBITDA, a non-GAAP financial measure, is often a useful measure of a Company’s operating performance and is a significant basis used by the Company’s management to measure the operating performance of the Company’s business because EBITDA excludes charges for depreciation and amortization, and interest expense resulting from our debt financings, as well as our provision for income tax expense. EBITDA does not represent and should not be considered as an alternative to net income, operating income, net cash provided by operating activities or any other measure for determining operating performance or liquidity that is calculated in accordance with generally accepted accounting principles. EBITDA RECONCILIATION ($ in thousands) Twelve Months Ended Dec. 31, 2015 Dec. 31, 2016 6 Months Ended 06/30/17 Net Income $ 699 $ 2,821 $ 1,152 Interest expense, net 317 255 44 Provision for income taxes 8 267 530 Depreciation and amortization 72 64 36 EBITDA $ 1,096 $ 3,407 $ 1,762
350 Jim Moran Blvd. Suite 120Deerfield Beach, FL 33442T: 954.570.8889 x 313 F: 954.570.6678www.capstonecompaniesinc.com CONTACT Stewart WallachPresident & CEO The attached designs and marketing information are the property of Capstone Industries, Inc. Disclosure of the following confidential information, not for the intended recipients, is strictly prohibited without prior approval.