Attached files
| file | filename |
|---|---|
| 8-K - 8-K - MERCER INTERNATIONAL INC. | d453393d8k.htm |
Exhibit 99.1

Exhibit 99.1
Driving
Profitable Growth
2017 TD Forest Products Forum
September 20, 2017
David K. Ure
Senior Vice
President,
Chief Financial Officer & Secretary
The Private
Securities Litigation Reform Act of 1995 provides a “safe harbor” for forward-looking statements. Certain information included in this presentation contains statements that are forward-looking, such as statements relating to results of
operations and financial conditions and business development activities, as well as capital spending and financing sources. Such forward-looking information involves important risks and uncertainties that could significantly affect anticipated
results in the future and, accordingly, such results may differ materially from those expressed in any forward-looking statements made by or on behalf of Mercer. For more information regarding these risks and uncertainties, review Mercer’s
filings with the United States
Securities and Exchange Commission. Unless required by law, we do not assume any obligation to update forward-looking statements
based on unanticipated events or changed expectations.
2
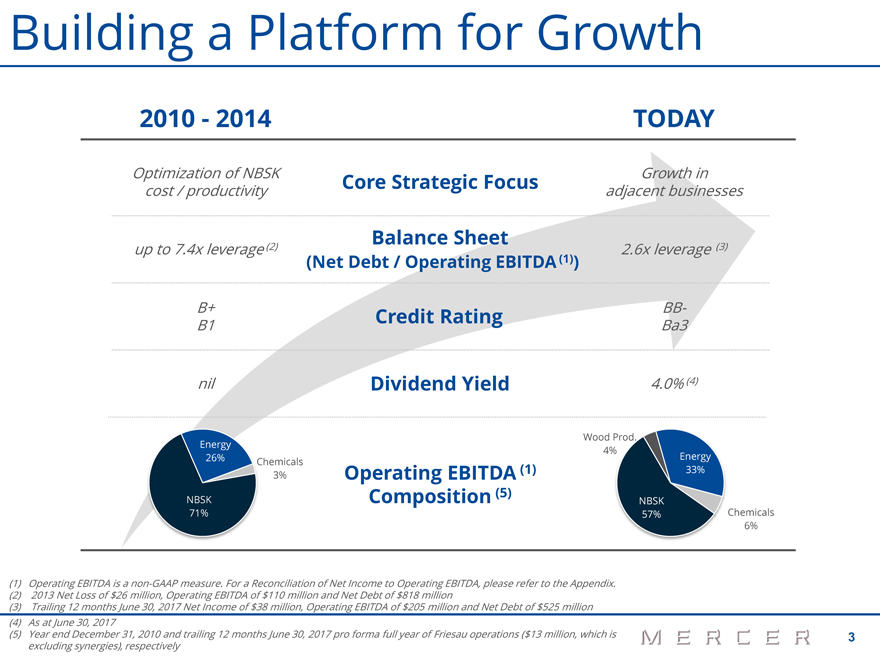
Building a Platform for Growth
2010—2014 TODAY
Optimization of NBSK Core Strategic Focus Growth in cost / productivity
adjacent businesses
Balance Sheet
up to 7.4x leverage (2) / Operating (1)
2.6x leverage (3)
(Net Debt EBITDA )
B+ Credit Rating BB-
B1 Ba3
nil Dividend Yield 4.0% (4)
Wood Prod.
Energy
4%
26% Energy Chemicals
(1) 33%
3% Operating EBITDA
(5)
NBSK Composition NBSK
71% 57% Chemicals
6%
(1) Operating EBITDA is a non-GAAP measure. For a Reconciliation of Net Income to Operating EBITDA, please refer to
the Appendix. (2) 2013 Net Loss of $26 million, Operating EBITDA of $110 million and Net Debt of $818 million (3) Trailing 12 months June 30, 2017 Net Income of $38 million,
Operating EBITDA of $205 million and Net Debt of $525 million (4) As at June 30, 2017
(5) Year end
December 31, 2010 and trailing 12 months June 30, 2017 pro forma full year of Friesau operations ($13 million, which is 3 excluding synergies), respectively
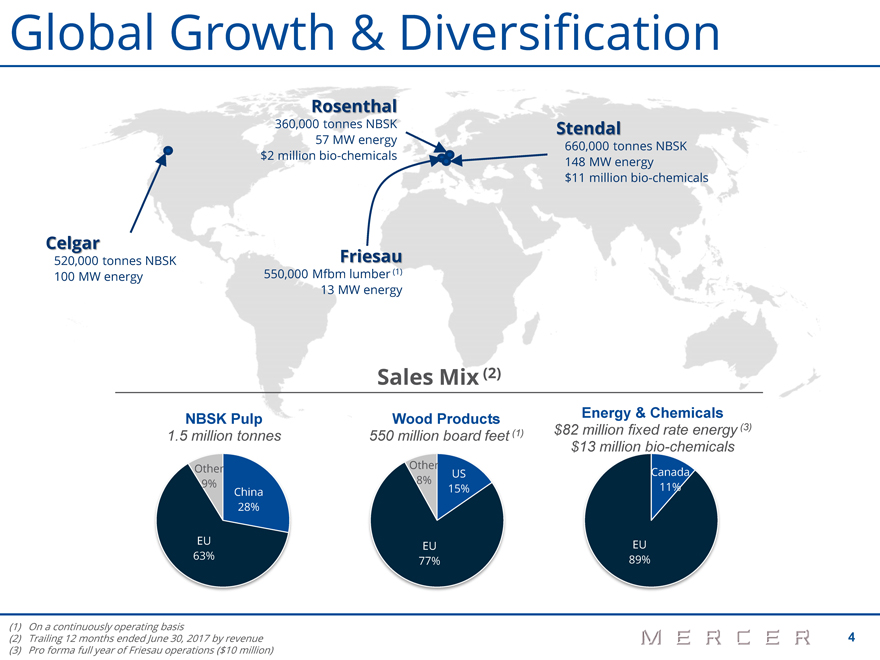
Global Growth & Diversification
Rosenthal
360,000 tonnes NBSK Stendal
57 MW energy 660,000 tonnes NBSK $2 million bio-chemicals 148 MW energy $11 million bio-chemicals
Celgar
520,000 tonnes NBSK
Friesau 100 MW energy 550,000 Mfbm lumber (1)
13 MW energy
Sales Mix (2)
NBSK Pulp Wood Products Energy & Chemicals $82 million fixed rate energy (3) 1.5 million tonnes 550 million board feet (1) $13 million
bio-chemicals
Other Other
US Canada
9% 8%
China 15% 11% 28%
EU EU EU 63% 77% 89%
(1) On a continuously operating basis 4
(2) Trailing 12 months ended June 30, 2017 by revenue (3) Pro forma full year of Friesau operations ($10 million)
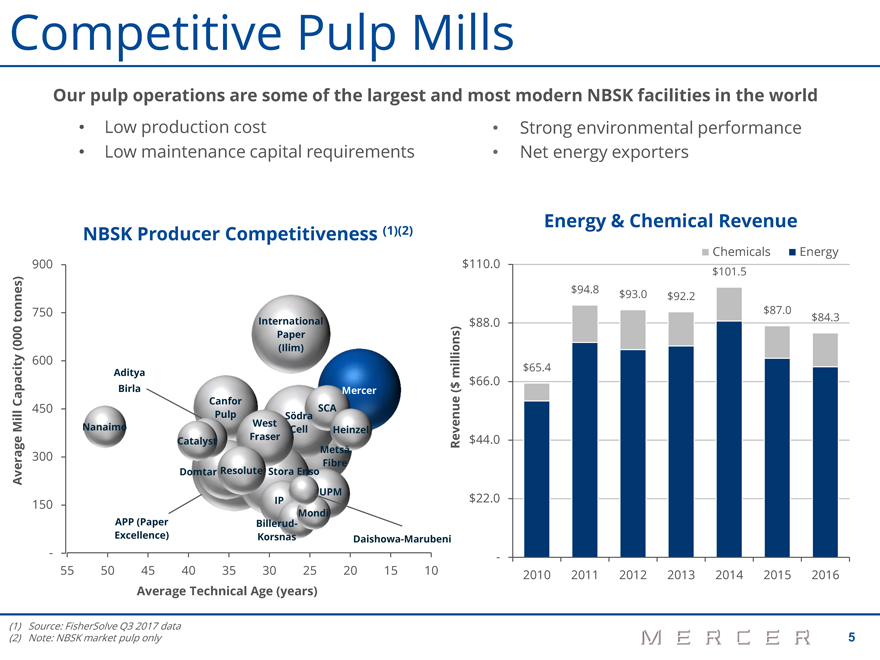
Competitive Pulp Mills
Our pulp operations are some of the largest and most modern NBSK facilities in the world
Low production cost
Low maintenance capital requirements
Strong environmental performance Net energy exporters
Average Mill Capacity (000 tonnes)
NBSK Producer Competitiveness (1)(2)
900
750
International
Paper
(Ilim)
600
Aditya
Birla Mercer
Canfor
450
SCA
Pulp Södra
Nanaimo West Cell
Heinzel
Catalyst
Fraser
300 Metsä
Domtar Resolute Stora Enso Fibre
UPM
150 IP Mondi
APP (Paper Billerud-
Excellence) Korsnas Daishowa-Marubeni
-
55 50 45 40 35 30 25 20 15 10
Average Technical Age (years)
Energy & Chemical Revenue
Chemicals Energy
$110.0 $101.5
$94.8 $93.0 $92.2
$87.0
$88.0 $84.3
$65.4
$66.0
$44.0
$22.0
-
2010 2011 2012 2013 2014 2015 2016
Revenue ($ millions)
(1) Source: FisherSolve Q3 2017 data
(2) Note:
NBSK market pulp only 5
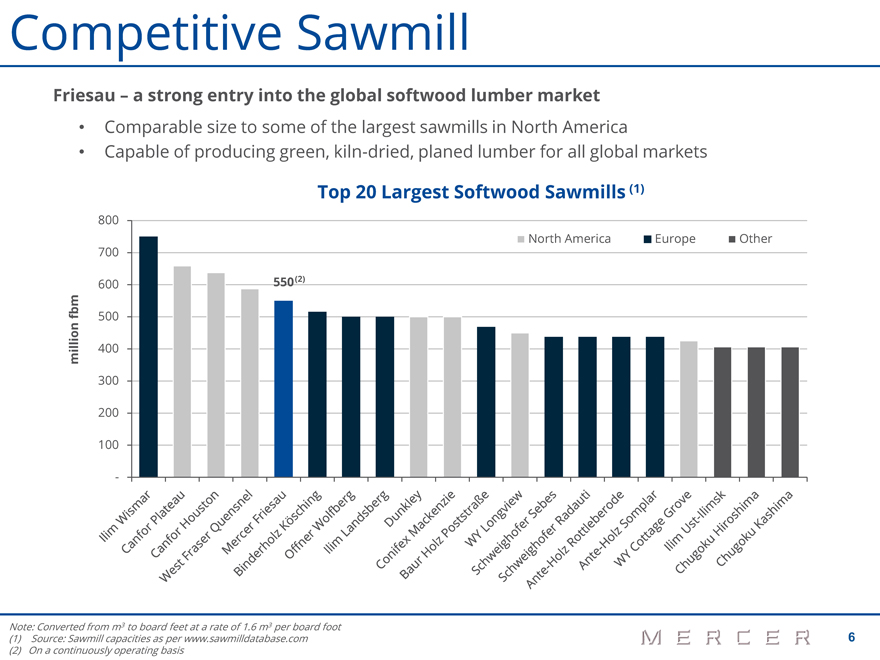
Competitive Sawmill
Friesau – a strong entry into the global softwood lumber market
Comparable size to some of the largest sawmills in North America
Capable of
producing green, kiln-dried, planed lumber for all global markets
Top 20 Largest Softwood Sawmills (1)
million fbm
800
700 North America Europe Other 600 550 (2) 500
400 300 200 100 -
Note: Converted from m3 to board feet at a rate of 1.6 m3 per board foot
(1) Source: Sawmill
capacities as per www.sawmilldatabase.com 6 (2) On a continuously operating basis
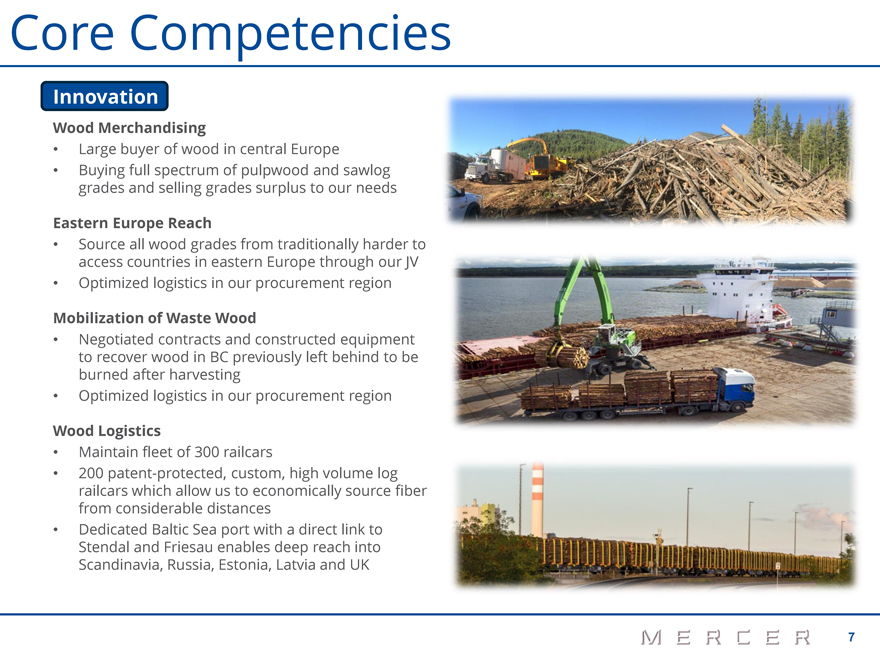
Core Competencies
Innovation
Wood Merchandising
Large buyer of wood in central Europe
Buying full spectrum of pulpwood and sawlog
grades and selling grades surplus to our needs
Eastern Europe Reach
Source all wood grades from traditionally harder to
access countries in eastern Europe through
our JV
Optimized logistics in our procurement region
Mobilization of Waste
Wood
Negotiated contracts and constructed equipment
to recover wood in BC
previously left behind to be
burned after harvesting
Optimized logistics in
our procurement region
Wood Logistics
Maintain fleet of 300 railcars
200 patent-protected, custom, high volume log
railcars which allow us to
economically source fiber
from considerable distances
Dedicated Baltic Sea
port with a direct link to
Stendal and Friesau enables deep reach into
Scandinavia, Russia, Estonia, Latvia and UK
7
Core Competencies
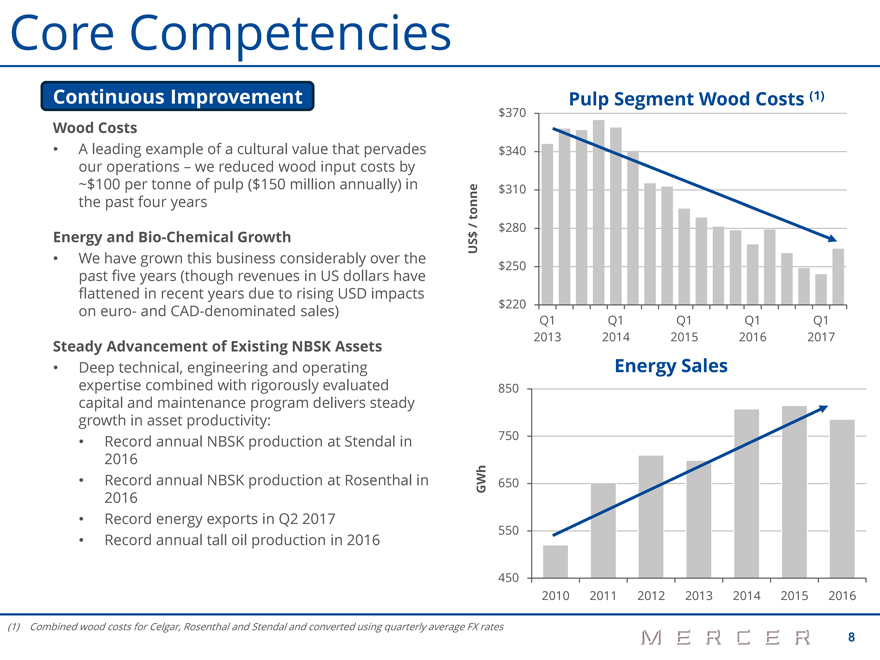
Continuous Improvement
Wood Costs
A leading example of a cultural value that pervades
our operations – we reduced wood
input costs by
~$100 per tonne of pulp ($150 million annually) in
the
past four years
Energy and Bio-Chemical Growth
We have grown this business considerably over the
past five years (though revenues in US
dollars have
flattened in recent years due to rising USD impacts
on euro- and
CAD-denominated sales)
Steady Advancement of Existing NBSK Assets
Deep technical, engineering and operating
expertise combined with rigorously evaluated
capital and maintenance program delivers steady
growth in asset productivity:
Record annual NBSK production at Stendal in
2016
Record annual NBSK production at Rosenthal in
2016
Record energy exports in Q2 2017
Record annual tall oil production in 2016
US$ / tonne GWh
Pulp Segment Wood Costs (1)
$ 370
$ 340
$ 310
$ 280
$ 250
$ 220 Germany
Q1 Q1 Q1 Q1 Q1
2013 2014 2015 2016 2017
Energy Sales
850
750
650
550
450
2010 2011 2012 2013 2014 2015 2016
(1) Combined wood costs for Celgar, Rosenthal and Stendal
and converted using quarterly average FX rates 8
Core Competencies
Execution Excellence
2013
Workforce reduction at Celgar – cost reduction
2014
Workforce reduction at Stendal – cost reduction
Project “Blue Mill” expansion
of pulp and energy
production at Stendal – higher pulp and energy
production
Tall oil plant at Rosenthal
2015
Upgraded evaporation plants at Stendal and
Rosenthal
Tall oil production optimization at Stendal and
Rosenthal
2016
New high capacity log rail car fleet – wood cost
reduction
Focus on high return upgrades at Celgar
Expansion of railway reload at Celgar – pulp
delivery cost reduction
New long log rail acceptance capabilities at
Rosenthal – more flexible wood fiber sourcing
New chip receiving
facility at Rosenthal
9
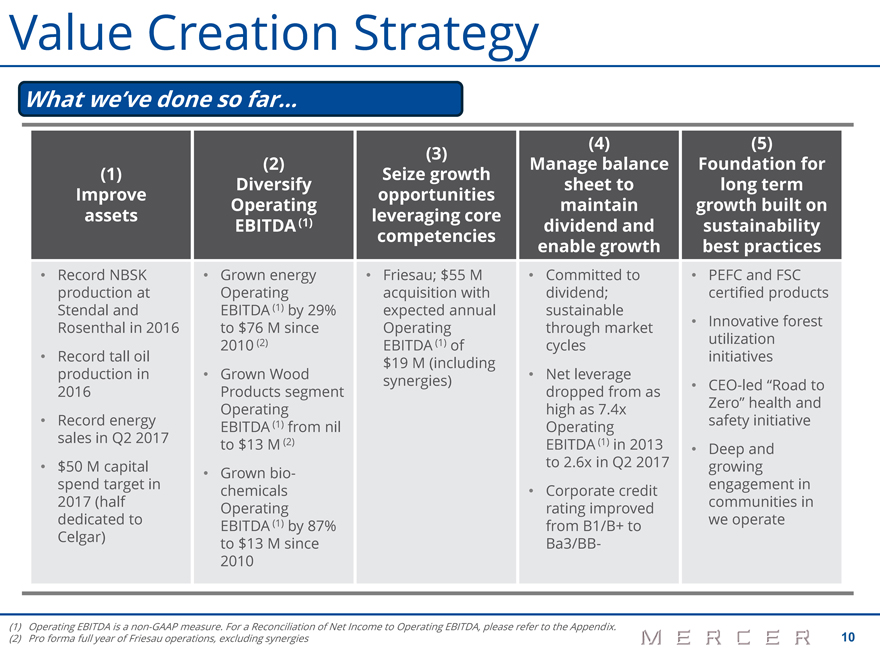
Value Creation Strategy
What we’ve done so far…
(1) Improve assets
Record NBSK production at Stendal and Rosenthal in 2016 Record tall oil production in 2016 Record energy sales in Q2 2017
$50 M capital spend target in 2017 (half dedicated to Celgar)
(2) Diversify Operating EBITDA
(1)
Grown energy Operating EBITDA (1) by 29% to $76 M since 2010 (2) Grown Wood Products segment Operating EBITDA (1) from nil to $13 M (2) Grown
biochemicals Operating EBITDA (1) by 87% to $13 M since 2010
(3) Seize growth opportunities leveraging core competencies
Friesau; $55 M acquisition with expected annual Operating EBITDA (1) of
$19 M (including
synergies)
(4) Manage balance sheet to maintain dividend and enable growth
Committed to dividend; sustainable through market cycles Net leverage dropped from as high as 7.4x Operating EBITDA (1) in 2013 to 2.6x in Q2 2017 Corporate
credit rating improved from B1/B+ to Ba3/BB-
(5) Foundation for long term growth built on sustainability best practices
PEFC and FSC certified products Innovative forest utilization initiatives
CEO-led “Road to Zero” health and safety initiative Deep and growing engagement in communities in we operate
(1) Operating EBITDA is a non-GAAP measure. For a Reconciliation of Net Income to Operating EBITDA,
please refer to the Appendix. 10 (2) Pro forma full year of Friesau operations, excluding synergies
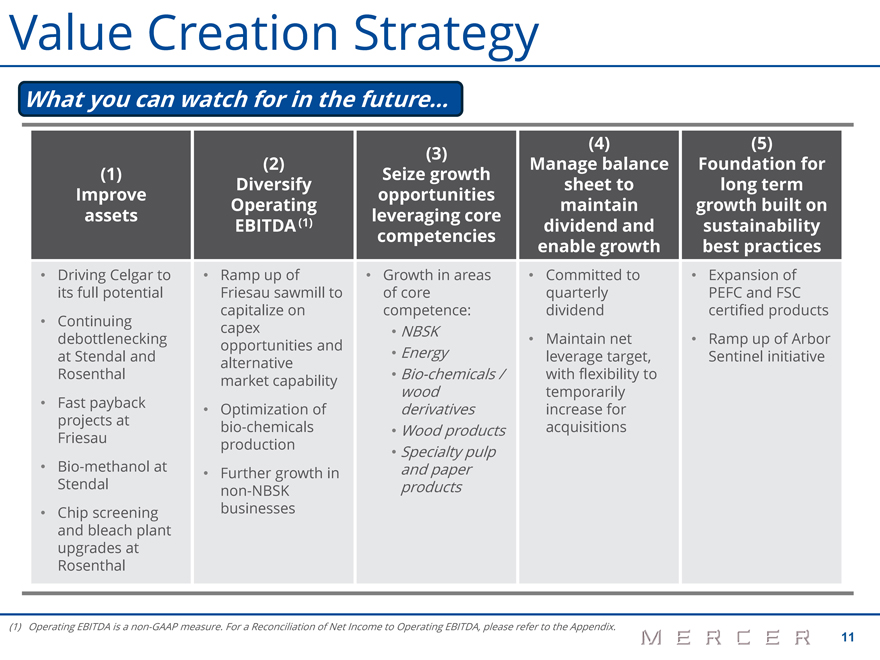
Value Creation Strategy
What you can watch for in the future…
(1) Improve assets
Driving Celgar to its full potential Continuing debottlenecking at Stendal and Rosenthal Fast payback projects at Friesau Bio-methanol at
Stendal Chip screening and bleach plant upgrades at Rosenthal
(2) Diversify Operating EBITDA (1)
Ramp up of Friesau sawmill to capitalize on capex opportunities and alternative market capability Optimization of bio-chemicals production
Further growth in non-NBSK businesses
(3) Seize growth opportunities leveraging core competencies
Growth in areas of core competence:
NBSK Energy Bio-chemicals / wood derivatives Wood products
Specialty pulp and paper products
(4) Manage balance sheet to maintain dividend and enable growth
Committed to quarterly dividend Maintain net leverage target, with flexibility to temporarily increase for acquisitions
(5) Foundation for long term growth built on sustainability best practices
Expansion of PEFC
and FSC certified products Ramp up of Arbor Sentinel initiative
(1) Operating EBITDA is a non-GAAP
measure. For a Reconciliation of Net Income to Operating EBITDA, please refer to the Appendix. 11
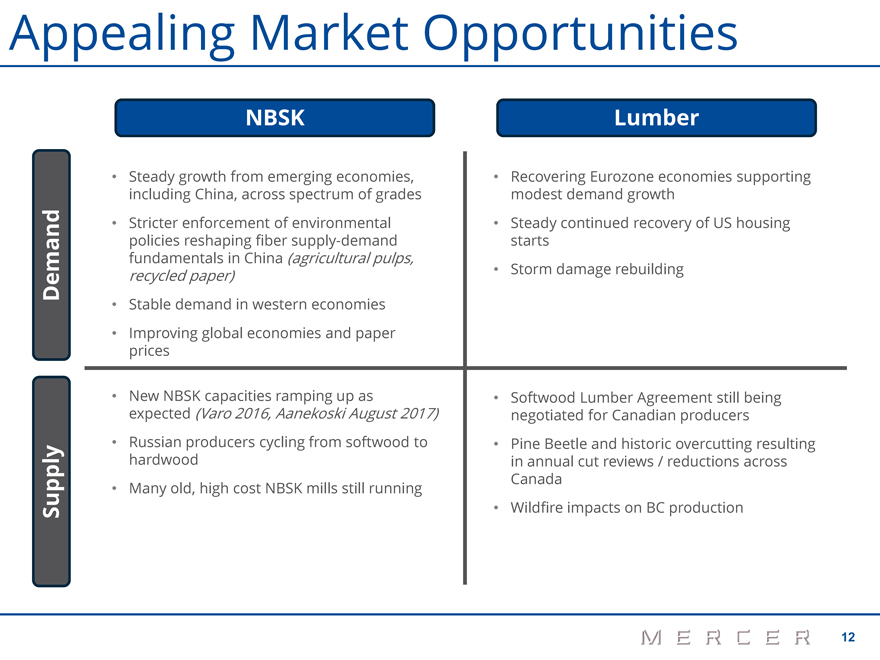
Appealing Market Opportunities
NBSK Lumber
Supply Demand
Steady growth from emerging economies, including China, across spectrum of grades Stricter enforcement of environmental policies reshaping fiber supply-demand fundamentals in China
(agricultural pulps, recycled paper)
Stable demand in western economies Improving global economies and paper prices
New NBSK capacities ramping up as expected (Varo 2016, Aanekoski August 2017)
Russian
producers cycling from softwood to hardwood Many old, high cost NBSK mills still running
Recovering Eurozone economies supporting modest demand growth Steady
continued recovery of US housing starts Storm damage rebuilding
Softwood Lumber Agreement still being negotiated for Canadian producers Pine Beetle and historic
overcutting resulting in annual cut reviews / reductions across Canada Wildfire impacts on BC production
12
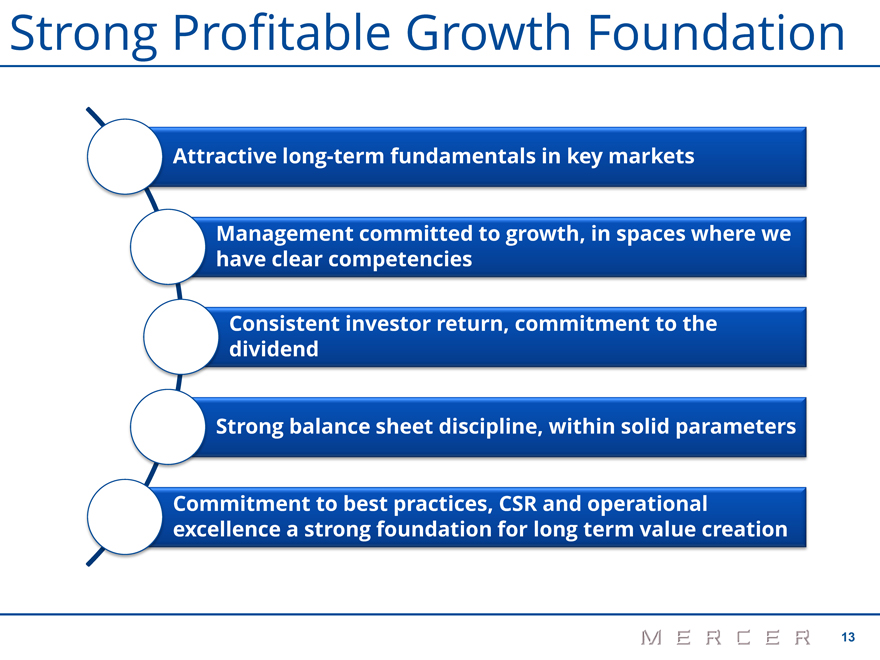
Strong Profitable Growth Foundation
Attractive long-term fundamentals in key markets
Management committed to growth, in spaces
where we have clear competencies
Consistent investor return, commitment to the dividend
Strong balance sheet discipline, within solid parameters
Commitment to best practices, CSR and
operational excellence a strong foundation for long term value creation
13
MERCER
MERCER
Appendix
Reconciliation of Net Income to
Operating EBITDA
15
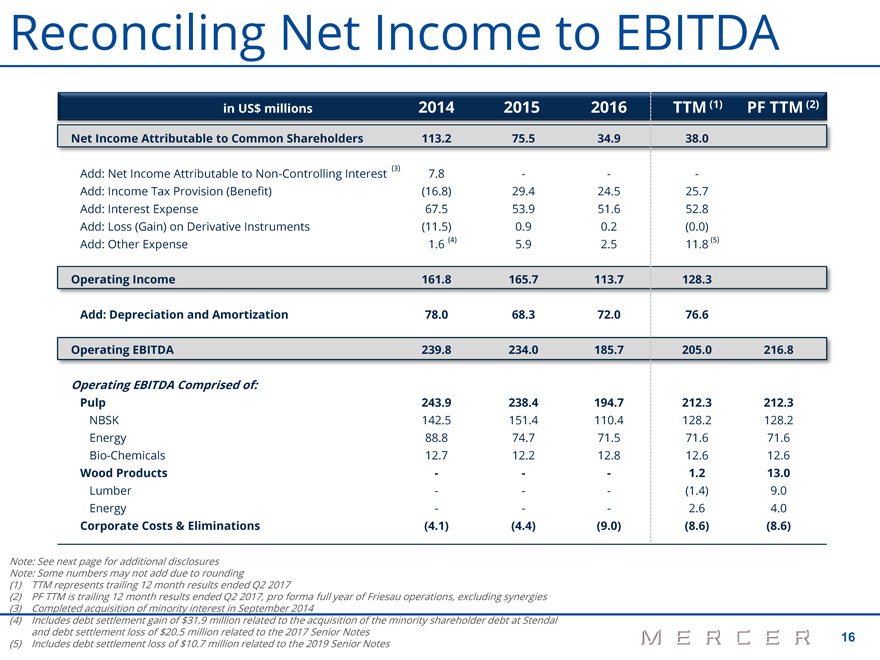
Reconciling Net Income to EBITDA
in US$ millions 2014 2015 2016 TTM (1) PF TTM (2)
Net Income Attributable to Common
Shareholders 113.2 75.5 34.9 38.0
Add: Net Income Attributable to Non-Controlling Interest (3) 7.8 - - -
Add: Income Tax Provision (Benefit) (16.8) 29.4 24.5 25.7
Add: Interest Expense 67.5 53.9 51.6
52.8
Add: Loss (Gain) on Derivative Instruments (11.5) 0.9 0.2 (0.0)
Add:
Other Expense 1.6 (4) 5.9 2.5 11.8 (5)
Operating Income 161.8 165.7 113.7 128.3
Add: Depreciation and Amortization 78.0 68.3 72.0 76.6
Operating EBITDA 239.8
234.0 185.7 205.0 216.8
Operating EBITDA Comprised of:
Pulp 243.9 238.4 194.7
212.3 212.3
NBSK 142.5 151.4 110.4 128.2 128.2
Energy 88.8 74.7 71.5 71.6
71.6
Bio-Chemicals 12.7 12.2 12.8 12.6 12.6
Wood Products - - - 1.2 13.0
Lumber - - - (1.4) 9.0
Energy - - - 2.6 4.0
Corporate Costs & Eliminations (4.1) (4.4) (9.0) (8.6) (8.6)
Note: See next page for additional disclosures
Note: Some numbers may not add
due to rounding
(1) TTM represents trailing 12 month results ended Q2 2017
(2) PF TTM is trailing 12 month results ended Q2 2017, pro forma full year of Friesau operations, excluding synergies (3) Completed acquisition of minority
interest in September 2014 (4) Includes debt settlement gain of $31.9 million related to the acquisition of the minority shareholder debt at Stendal and debt settlement loss of $20.5 million related to the 2017 Senior Notes 16 (5) Includes
debt settlement loss of $10.7 million related to the 2019 Senior Notes
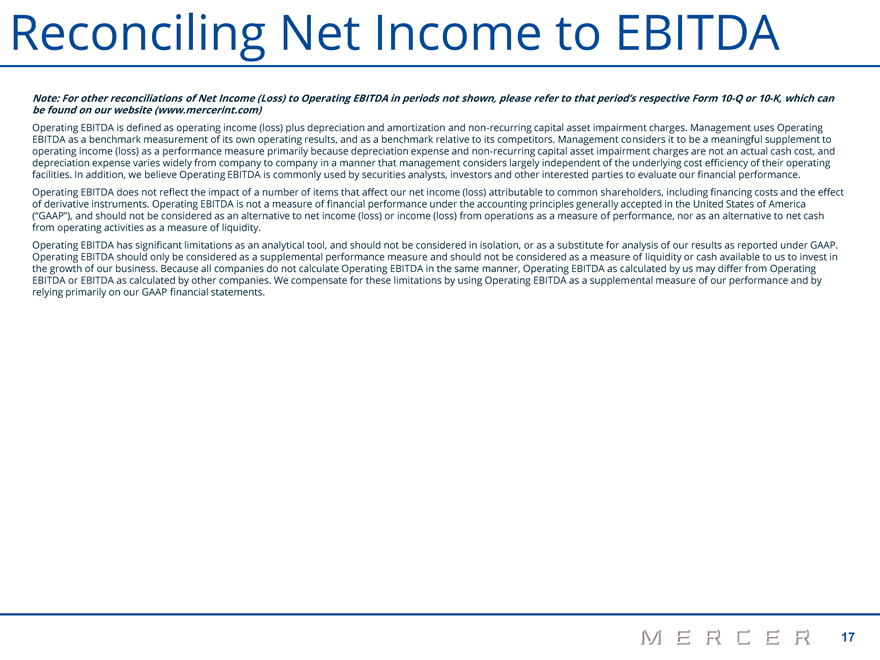
Reconciling Net Income to EBITDA
Note: For other reconciliations of Net Income (Loss) to Operating EBITDA in periods not shown, please refer to that period’s respective Form
10-Q or 10-K, which can be found on our website (www.mercerint.com)
Operating
EBITDA is defined as operating income (loss) plus depreciation and amortization and non-recurring capital asset impairment charges. Management uses Operating EBITDA as a benchmark measurement of its own
operating results, and as a benchmark relative to its competitors. Management considers it to be a meaningful supplement to operating income (loss) as a performance measure primarily because depreciation expense and
non-recurring capital asset impairment charges are not an actual cash cost, and depreciation expense varies widely from company to company in a manner that management considers largely independent of the
underlying cost efficiency of their operating facilities. In addition, we believe Operating EBITDA is commonly used by securities analysts, investors and other interested parties to evaluate our financial performance. Operating EBITDA does not
reflect the impact of a number of items that affect our net income (loss) attributable to common shareholders, including financing costs and the effect of derivative instruments. Operating EBITDA is not a measure of financial performance under the
accounting principles generally accepted in the United States of America
(“GAAP”), and should not be considered as an alternative to net income (loss) or
income (loss) from operations as a measure of performance, nor as an alternative to net cash from operating activities as a measure of liquidity.
Operating EBITDA
has significant limitations as an analytical tool, and should not be considered in isolation, or as a substitute for analysis of our results as reported under GAAP. Operating EBITDA should only be considered as a supplemental performance measure and
should not be considered as a measure of liquidity or cash available to us to invest in the growth of our business. Because all companies do not calculate Operating EBITDA in the same manner, Operating EBITDA as calculated by us may differ from
Operating EBITDA or EBITDA as calculated by other companies. We compensate for these limitations by using Operating EBITDA as a supplemental measure of our performance and by relying primarily on our GAAP financial statements.
17