Attached files
| file | filename |
|---|---|
| 8-K - FORM 8-K - Global Indemnity Group, LLC | d269063d8k.htm |
Exhibit 99.1

Investor Review September 2017 Global Indemnity Ltd Insurance & Reinsurance
INVESTOR Forward Looking REVIEW Statements 2017 This presentation contains forward-looking statements. All statements other than statements of historical facts contained in this presentation, including statements regarding Global Indemnity Limited’s results of operations and financial position, including our business strategies and areas of focus, future growth opportunities. These statements are based on current expectations as of the date of this presentation and involve a number of risks, uncertainties and assumptions , including those described in the Company’s filings with the Securities and Exchange Commission (the “SEC”), in particular the risks described under the heading “Risk Factors” in the Company’s Annual Report on Form 10-K for the fiscal year ended December 31, 2016. It is not possible for Company management to predict all risks, nor can the Company assess the impact of all factors on its business or the extent to which any factor, or combination of factors, may cause actual results to differ materially from those contained in any forward-looking statements the Company may make. In light of these risks, uncertainties and assumptions, the forward-looking events and circumstances discussed in this presentation may not occur and actual results could differ materially and adversely from those anticipated or implied in the forward-looking statements. Neither the Company nor any other person assumes responsibility for the accuracy and completeness of the forward-looking statements. Except as required by law, the Company undertakes no obligation to update publicly any forward-looking statements for any reason after the date of this presentation, to conform these statements to actual results or to changes in the Company’s expectations. 2
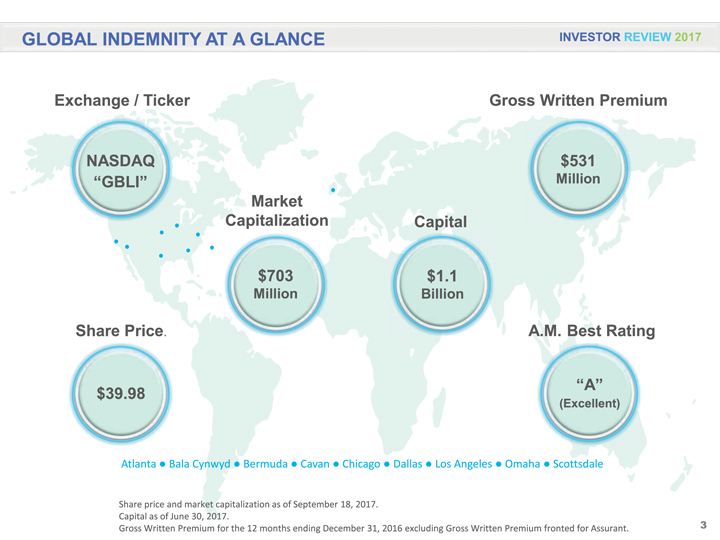
GLOBAL INDEMNITY AT A GLANCE INVESTOR REVIEW 2017 Exchange / Ticker Gross Written Premium NASDAQ $531 “GBLI” Million Market Capitalization Capital $703 $1.1 Million Billion Share Price. A.M. Best Rating “A” $39.98 (Excellent) Atlanta •Bala Cynwyd •Bermuda •Cavan •Chicago •Dallas •Los Angeles •Omaha •Scottsdale Share price and market capitalization as of September 18, 2017. Capital as of June 30, 2017. Gross Written Premium for the 12 months ending December 31, 2016 excluding Gross Written Premium fronted for Assurant. 3
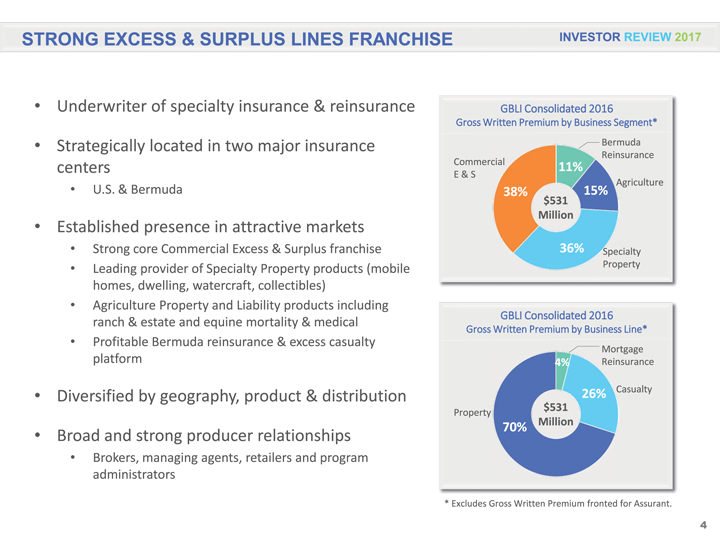
STRONG EXCESS & SURPLUS LINES FRANCHISE INVESTOR REVIEW 2017 Underwriter of specialty insurance & reinsurance GBLI Consolidated 2016 Gross Written Premium by Business Segment* Strategically located in two major insurance Bermuda Reinsurance centers Commercial 11% E & S U.S. & Bermuda Agriculture 38% 15% $531 Million Established presence in attractive markets Strong core Commercial Excess & Surplus franchise 36% Specialty Leading provider of Specialty Property products (mobile Property homes, dwelling, watercraft, collectibles) Agriculture Property and Liability products including ranch & estate and equine mortality & medical GBLI Consolidated 2016 Gross Written Premium by Business Line* Profitable Bermuda reinsurance & excess casualty Mortgage platform 4% Reinsurance Diversified by geography, product & distribution 26% Casualty Property $531 70% Million Broad and strong producer relationships Brokers, managing agents, retailers and program administrators * Excludes Gross Written Premium fronted for Assurant. 4
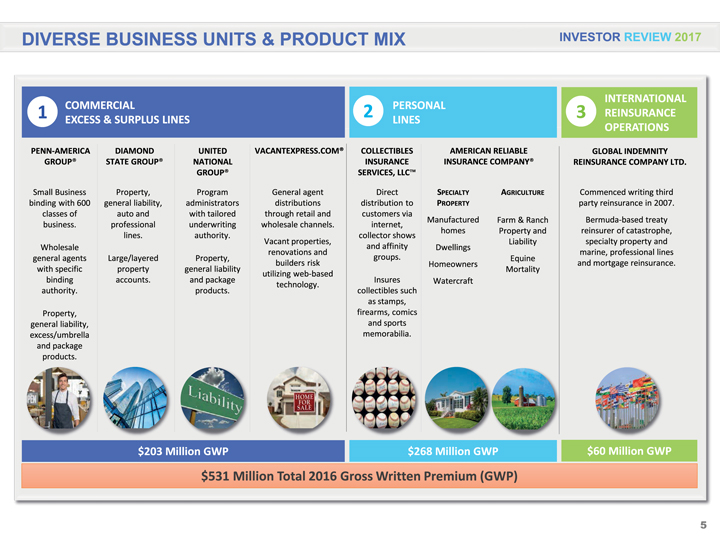
DIVERSE BUSINESS UNITS & PRODUCT MIX INVESTOR REVIEW 2017 INTERNATIONAL COMMERCIAL PERSONAL 1 2 3 REINSURANCE EXCESS & SURPLUS LINES LINES OPERATIONS PENN-AMERICA DIAMOND UNITED VACANTEXPRESS.COM® COLLECTIBLES AMERICAN RELIABLE GLOBAL INDEMNITY GROUP® STATE GROUP® NATIONAL INSURANCE INSURANCE COMPANY® REINSURANCE COMPANY LTD. GROUP® SERVICES, LLC™ Small Business Property, Program General agent Direct SPECIALTY AGRICULTURE Commenced writing third binding with 600 general liability, administrators distributions distribution to PROPERTY party reinsurance in 2007. classes of auto and with tailored through retail and customers via Manufactured Farm & Ranch Bermuda-based treaty business. professional underwriting wholesale channels. internet, homes Property and reinsurer of catastrophe, lines. authority. collector shows Vacant properties, Liability specialty property and Wholesale and affinity Dwellings renovations and marine, professional lines general agents Large/layered Property, groups. Equine builders risk Homeowners and mortgage reinsurance. with specific property general liability Mortality utilizing web-based binding accounts. and package Insures Watercraft technology. authority. products. collectibles such as stamps, Property, firearms, comics general liability, and sports excess/umbrella memorabilia. and package products. $203 Million GWP $268 Million GWP $60 Million GWP $531 Million Total 2016 Gross Written Premium (GWP) 5
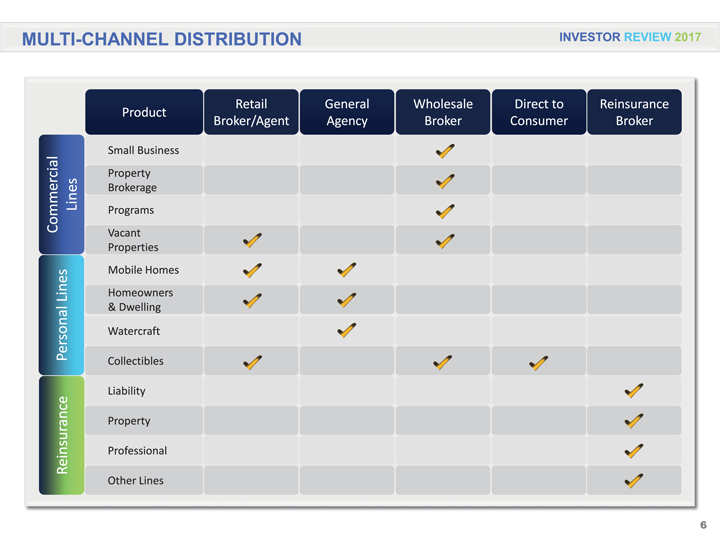
MULTI-CHANNEL DISTRIBUTION INVESTOR REVIEW 2017 Retail General Wholesale Direct to Reinsurance Product Broker/Agent Agency Broker Consumer Broker Small Business Property Lines Brokerage Commercial Programs Vacant Properties Mobile Homes Lines Homeowners & Dwelling Personal Watercraft Collectibles Liability Property Reinsurance Professional Other Lines 6
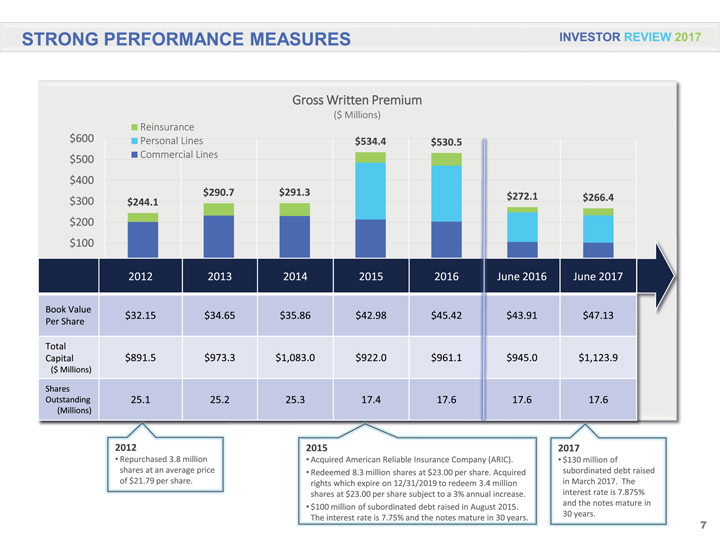
STRONG PERFORMANCE MEASURES INVESTOR REVIEW 2017 Gross Written Premium ($ Millions) $600 Reinsurance Personal Lines $534.4 $530.5 $500 Commercial Lines $400 $290.7 $291.3 $272.1 $266.4 $300 $244.1 $200 $100 2012 2013 2014 2015 2016 June 2016 June 2017 Book Value $32.15 $34.65 $35.86 $42.98 $45.42 $43.91 $47.13 Per Share Total Capital $891.5 $973.3 $1,083.0 $922.0 $961.1 $945.0 $1,123.9 ($ Millions) Shares Outstanding 25.1 25.2 25.3 17.4 17.6 17.6 17.6 (Millions) 2012 Repurchased 3.8 million shares at an average price of $21.79 per share. 2015 Acquired American Reliable Insurance Company (ARIC). Redeemed 8.3 million shares at $23.00 per share. Acquired rights which expire on 12/31/2019 to redeem 3.4 million shares at $23.00 per share subject to a 3% annual increase. $100 million of subordinated debt raised in August 2015. The interest rate is 7.75% and the notes mature in 30 years. 2017 $130 million of subordinated debt raised in March 2017. The interest rate is 7.875% and the notes mature in 30 years. 7
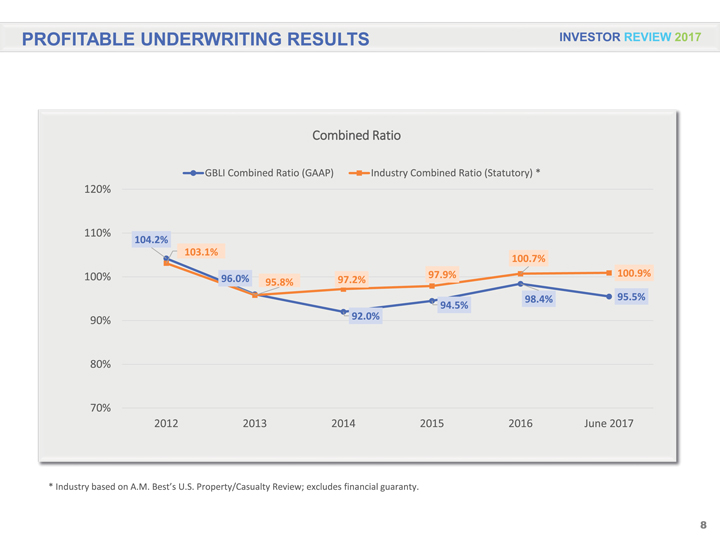
PROFITABLE UNDERWRITING RESULTS INVESTOR REVIEW 2017 Combined Ratio GBLI Combined Ratio (GAAP) Industry Combined Ratio (Statutory) * 120% 110% 104.2% 103.1% 100.7% 100% 96.0% 97.9% 100.9% 95.8% 97.2% 98.4% 95.5% 92.0% 94.5% 90% 80% 70% 2012 2013 2014 2015 2016 June 2017 * Industry based on A.M. Best’s U.S. Property/Casualty Review; excludes financial guaranty. 8
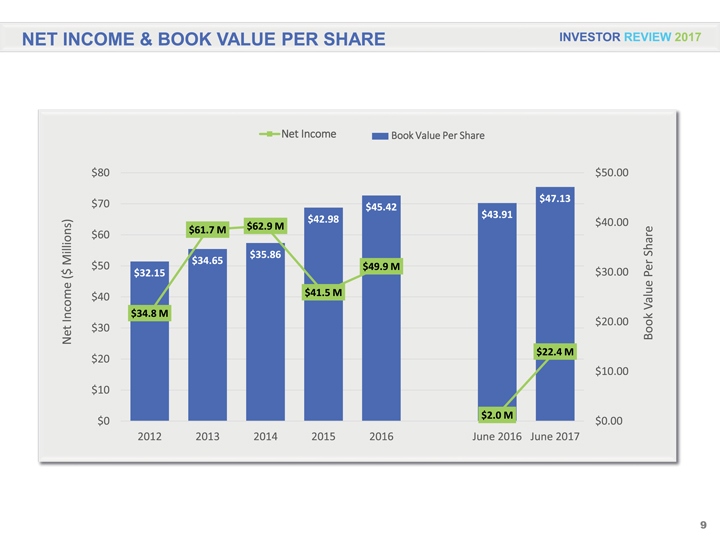
NET INCOME & BOOK VALUE PER SHARE INVESTOR REVIEW 2017 Net Income Book Value Per Share $80 $50.00 $70 $47.13 $45.42 $42.98 $43.91 $62.9 M $40.00 $60 $61.7 M Share $35.86 Millions) $34.65 $ $50 $32.15 $49.9 M $30.00 Per ( $40 $41.5 M Value Income $34.8 M $20.00 Net $30 Book $22.4 M $20 $10.00 $10 $0 $2.0 M $0.00 2012 2013 2014 2015 2016 June 2016 June 2017 9
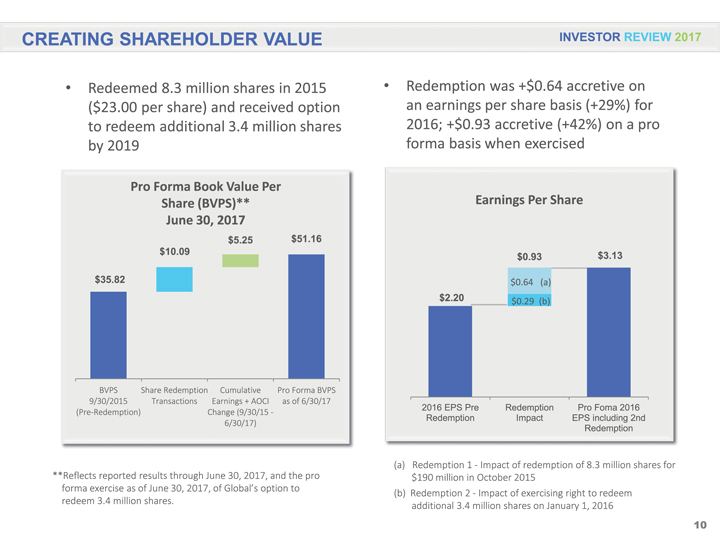
CREATING SHAREHOLDER VALUE INVESTOR REVIEW 2017 Redeemed 8.3 million shares in 2015 ($23.00 per share) and received option to redeem additional 3.4 million shares by 2019 Pro Forma Book Value Per Share (BVPS)** June 30, 2017 $5.25 $51.16 $10.09 $35.82 BVPS Share Redemption Cumulative Pro Forma BVPS 9/30/2015 Transactions Earnings + AOCI as of 6/30/17 (Pre-Redemption) Change (9/30/15 -6/30/17) **Reflects reported results through June 30, 2017, and the pro forma exercise as of June 30, 2017, of Global’s option to redeem 3.4 million shares. Redemption was +$0.64 accretive on an earnings per share basis (+29%) for 2016; +$0.93 accretive (+42%) on a pro forma basis when exercised Earnings Per Share $0.93 $3.13 $0.64 (a) $2.20 $0.29 (b) 2016 EPS Pre Redemption Pro Foma 2016 Redemption Impact EPS including 2nd Redemption (a) Redemption 1—Impact of redemption of 8.3 million shares for $190 million in October 2015 (b) Redemption 2—Impact of exercising right to redeem additional 3.4 million shares on January 1, 2016 10
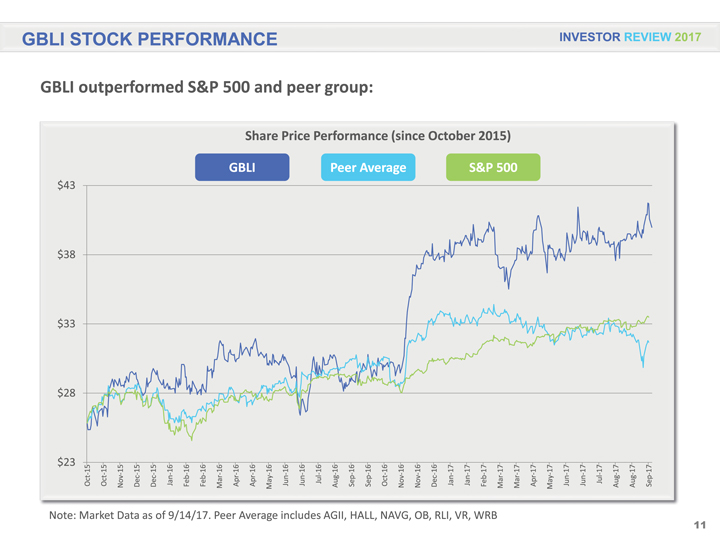
GBLI STOCK PERFORMANCE INVESTOR REVIEW 2017 GBLI outperformed S&P 500 and peer group: Share Price Performance (since October 2015) GBLI Peer Average S&P 500 Note: 23 $ $ 28 33 $ $ 38 43 $ Oct-15 Market Oct-15 Nov-15 Data Dec-15 as Dec-15 of Jan-16 Feb-16 9/14/17. Feb-16 Peer Mar-16 Apr-16 Apr-16 Average May-16 Jun-16 includes Jun-16 Jul-16 AGII, Aug-16 Sep-16 HALL, Sep-16 Oct-16 NAVG, Nov-16 OB, Nov-16 RLI, Dec-16 Jan-17 VR, Jan-17 WRB Feb-17 Mar-17 Mar-17 Apr-17 May-17 Jun-17 Jun-17 Jul-17 Aug-17 Aug-17 Sep-17 11
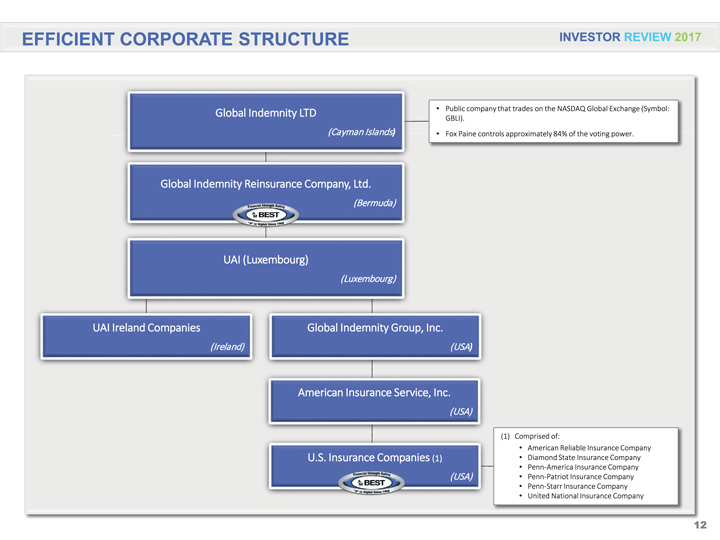
EFFICIENT CORPORATE STRUCTURE INVESTOR REVIEW 2017 Global Indemnity LTD Public company that trades on the NASDAQ Global Exchange (Symbol: GBLI). (Cayman Islands) Fox Paine controls approximately 84% of the voting power. Global Indemnity Reinsurance Company, Ltd. (Bermuda) UAI (Luxembourg) (Luxembourg) UAI Ireland Companies Global Indemnity Group, Inc. (Ireland) (USA) American Insurance Service, Inc. (USA) (1) Comprised of: American Reliable Insurance Company U.S. Insurance Companies (1) Diamond State Insurance Company Penn-America Insurance Company (USA) Penn-Patriot Insurance Company Penn-Starr Insurance Company United National Insurance Company 12
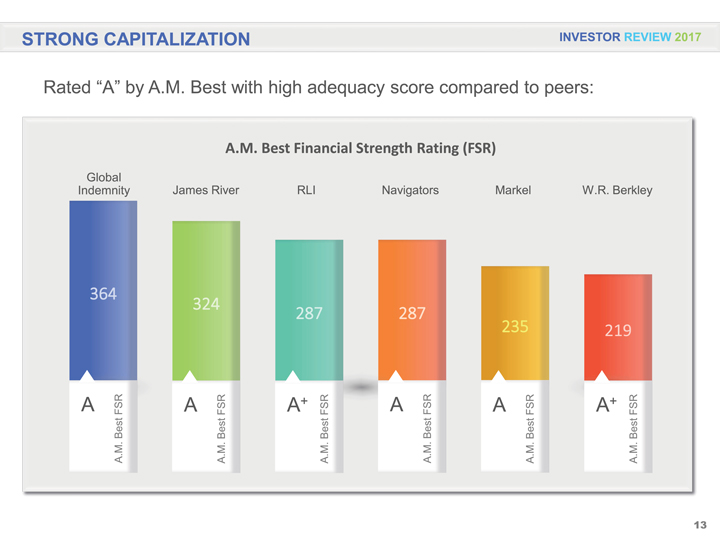
STRONG CAPITALIZATION INVESTOR REVIEW 2017 Rated “A” by A.M. Best with high adequacy score compared to peers: A.M. Best Financial Strength Rating (FSR) Global Indemnity James River RLI Navigators Markel W.R. Berkley A A.M. Best FSR 364 A A.M. Best FSR 324 A + A.M. Best FSR 287 A A.M. Best FSR 287 A A.M. Best FSR 235 A + A.M. Best FSR 219 13
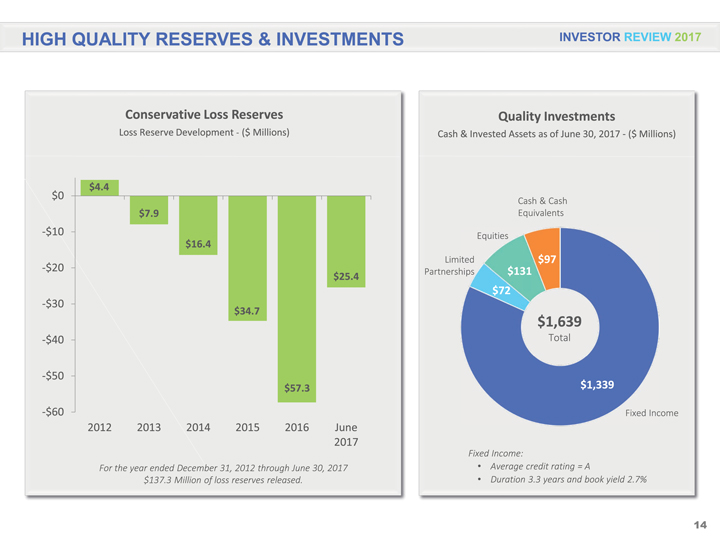
HIGH QUALITY RESERVES & INVESTMENTS INVESTOR REVIEW 2017 Conservative Loss Reserves Loss Reserve Development Ë— ($ Millions) $4.4 $0 $7.9 -$10 $16.4 -$20 $25.4 -$30 $34.7 -$40 -$50 $57.3 -$60 2012 2013 2014 2015 2016 June 2017 For the year ended December 31, 2012 through June 30, 2017 $137.3 Million of loss reserves released. Quality Investments Cash & Invested Assets as of June 30, 2017—($ Millions) Cash & Cash Equivalents Equities Limited $97 Partnerships $131 $72 $1,639 Total $1,339 Fixed Income Fixed Income: Average credit rating = A Duration 3.3 years and book yield 2.7% 14
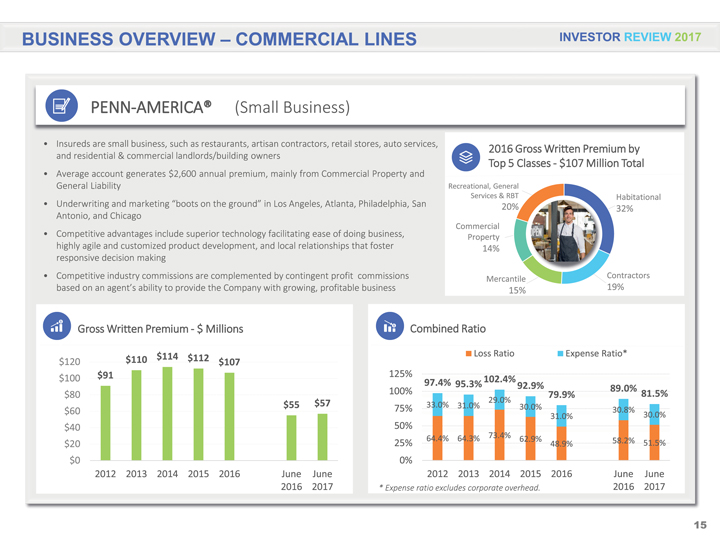
BUSINESS OVERVIEW – COMMERCIAL LINES PENN-AMERICA® (Small Business) Insureds are small business, such as restaurants, artisan contractors, retail stores, auto services, and residential & commercial landlords/building owners Average account generates $2,600 annual premium, mainly from Commercial Property and General Liability Underwriting and marketing “boots on the ground” in Los Angeles, Atlanta, Philadelphia, San Antonio, and Chicago Competitive advantages include superior technology facilitating ease of doing business, highly agile and customized product development, and local relationships that foster responsive decision making Competitive industry commissions are complemented by contingent profit commissions based on an agent’s ability to provide the Company with growing, profitable business INVESTOR REVIEW 2017 2016 Gross Written Premium by Top 5 Classes—$107 Million Total Recreational, General Services & RBT Habitational 20% 32% Commercial Property 14% Mercantile Contractors 15% 19% Gross Written Premium—$ Millions Combined Ratio $114 $112 Loss Ratio Expense Ratio* $120 $110 $107 $100 $91 125% 97.4% 95.3% 102.4% 92.9% 89.0% $80 100% 29.0% 79.9% 81.5% $55 $57 33.0% 31.0% 30.0% $60 75% 30.8% 31.0% 30.0% $40 50% 64.4% 64.3% 73.4% 62.9% $20 25% 48.9% 58.2% 51.5% $0 0% 2012 2013 2014 2015 2016 June June 2012 2013 2014 2015 2016 June June 2016 2017 * Expense ratio excludes corporate overhead. 2016 2017 15
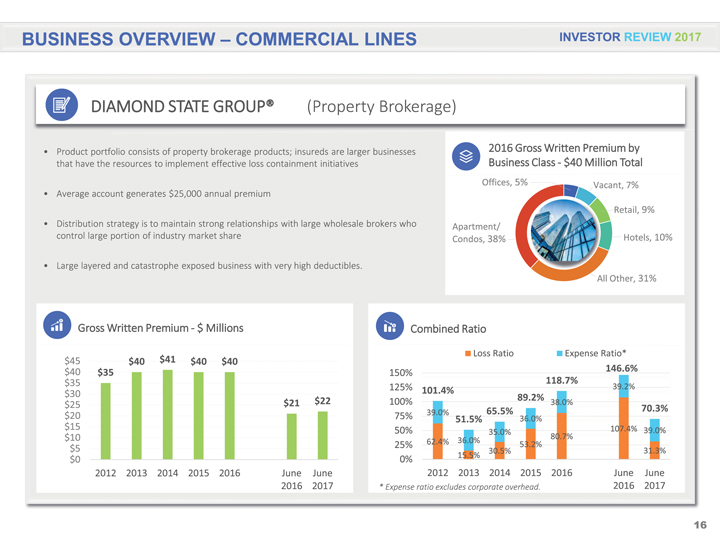
BUSINESS OVERVIEW – COMMERCIAL LINES INVESTOR REVIEW 2017 DIAMOND STATE GROUP® (Property Brokerage) Product portfolio consists of property brokerage products; insureds are larger businesses that have the resources to implement effective loss containment initiatives Average account generates $25,000 annual premium Distribution strategy is to maintain strong relationships with large wholesale brokers who control large portion of industry market share Large layered and catastrophe exposed business with very high deductibles. 2016 Gross Written Premium by Business Class—$40 Million Total Offices, 5% Vacant, 7% Retail, 9% Apartment/ Condos, 38% Hotels, 10% All Other, 31% Gross Written Premium—$ Millions $45 $40 $41 $40 $40 $40 $35 $35 $30 $25 $21 $22 $20 $15 $10 $5 $0 2012 2013 2014 2015 2016 June June 2016 2017 Combined Ratio Loss Ratio Expense Ratio* 150% 146.6% 118.7% 125% 101.4% 39.2% 100% 89.2% 38.0% 39.0% 65.5% 70.3% 75% 51.5% 36.0% 50% 35.0% 107.4% 39.0% 36.0% 80.7% 25% 62.4% 53.2% 31.3% 15.5% 30.5% 0% 2012 2013 2014 2015 2016 June June * Expense ratio excludes corporate overhead. 2016 2017 16
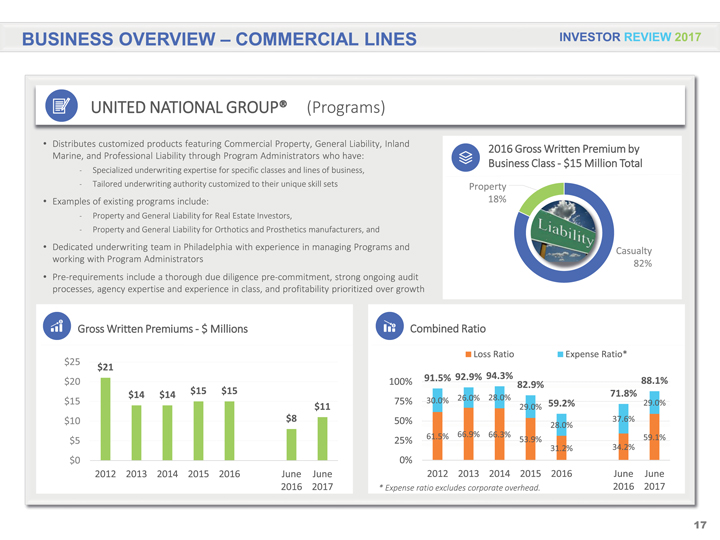
BUSINESS OVERVIEW – COMMERCIAL LINES INVESTOR REVIEW 2017 UNITED NATIONAL GROUP® (Programs) Distributes customized products featuring Commercial Property, General Liability, Inland Marine, and Professional Liability through Program Administrators who have: Ë— Specialized underwriting expertise for specific classes and lines of business, Ë— Tailored underwriting authority customized to their unique skill sets Examples of existing programs include: Ë— Property and General Liability for Real Estate Investors, Ë— Property and General Liability for Orthotics and Prosthetics manufacturers, and Dedicated underwriting team in Philadelphia with experience in managing Programs and working with Program Administrators Pre-requirements include a thorough due diligence pre-commitment, strong ongoing audit processes, agency expertise and experience in class, and profitability prioritized over growth 2016 Gross Written Premium by Business Class—$15 Million Total Property 18% Casualty 82% Gross Written Premiums—$ Millions $25 $21 $20 $15 $14 $14 $15 $15 $11 $10 $8 $5 $0 2012 2013 2014 2015 2016 June June 2016 2017 Combined Ratio Loss Ratio Expense Ratio* 91.5% 92.9% 94.3% 88.1% 100% 82.9% 26.0% 28.0% 71.8% 75% 30.0% 59.2% 29.0% 29.0% 50% 37.6% 28.0% 61.5% 66.9% 66.3% 59.1% 25% 53.9% 31.2% 34.2% 0% 2012 2013 2014 2015 2016 June June * Expense ratio excludes corporate overhead. 2016 2017 17
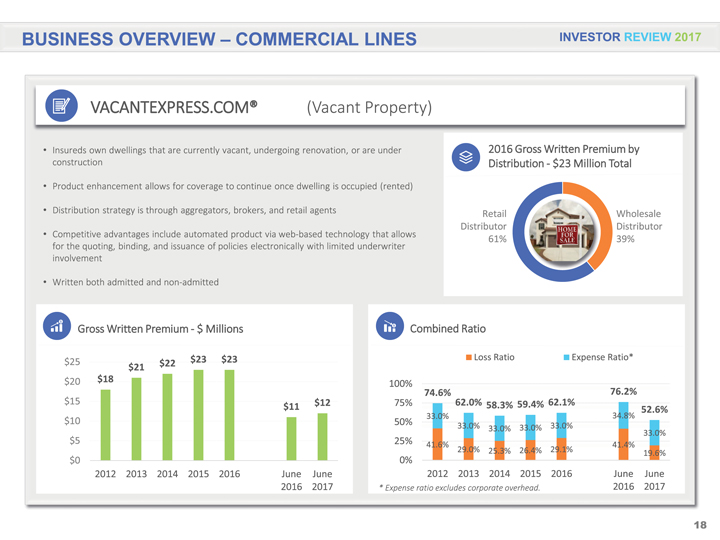
BUSINESS OVERVIEW – COMMERCIAL LINES INVESTOR REVIEW 2017 VACANTEXPRESS.COM® (Vacant Property) Insureds own dwellings that are currently vacant, undergoing renovation, or are under construction Product enhancement allows for coverage to continue once dwelling is occupied (rented) Distribution strategy is through aggregators, brokers, and retail agents Competitive advantages include automated product via web-based technology that allows for the quoting, binding, and issuance of policies electronically with limited underwriter involvement Written both admitted and non-admitted 2016 Gross Written Premium by Distribution—$23 Million Total Retail Wholesale Distributor Distributor 61% 39% Gross Written Premium—$ Millions $25 $22 $23 $23 $21 $20 $18 $15 $12 $11 $10 $5 $0 2012 2013 2014 2015 2016 June June 2016 2017 Combined Ratio Loss Ratio Expense Ratio* 100% 74.6% 76.2% 75% 62.0% 58.3% 59.4% 62.1% 52.6% 33.0% 34.8% 50% 33.0% 33.0% 33.0% 33.0% 33.0% 25% 41.6% 41.4% 29.0% 25.3% 26.4% 29.1% 19.6% 0% 2012 2013 2014 2015 2016 June June * Expense ratio excludes corporate overhead. 2016 2017 18
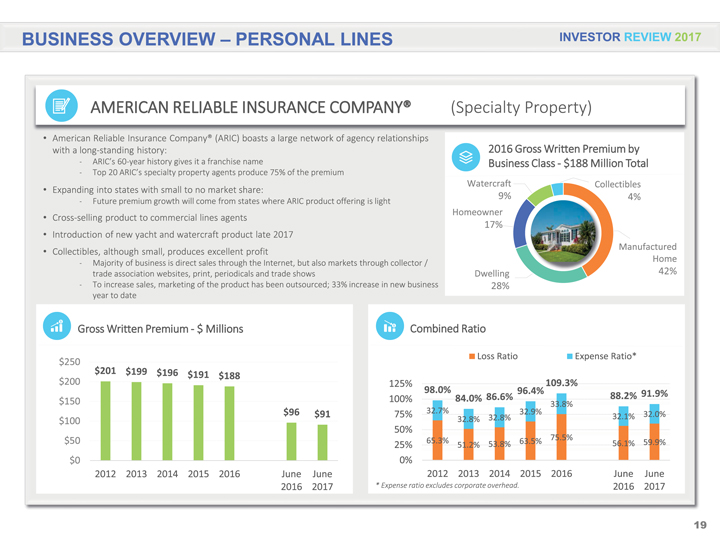
BUSINESS OVERVIEW – PERSONAL LINES INVESTOR REVIEW 2017 AMERICAN RELIABLE INSURANCE COMPANY® American Reliable Insurance Company® (ARIC) boasts a large network of agency relationships with a long-standing history: Ë— ARIC’s 60-year history gives it a franchise name Ë— Top 20 ARIC’s specialty property agents produce 75% of the premium Expanding into states with small to no market share: Ë— Future premium growth will come from states where ARIC product offering is light Cross-selling product to commercial lines agents Introduction of new yacht and watercraft product late 2017 Collectibles, although small, produces excellent profit Ë— Majority of business is direct sales through the Internet, but also markets through collector / trade association websites, print, periodicals and trade shows Ë— To increase sales, marketing of the product has been outsourced; 33% increase in new business year to date (Specialty Property) 2016 Gross Written Premium by Business Class—$188 Million Total Watercraft Collectibles 9% 4% Homeowner 17% Manufactured Home Dwelling 42% 28% Gross Written Premium—$ Millions Combined Ratio Loss Ratio Expense Ratio* $250 $201 $199 $196 $191 $188 $200 125% 109.3% 98.0% 96.4% 91.9% 100% 84.0% 86.6% 88.2% $150 32.7% 33.8% $96 $91 75% 32.9% 32.0% $100 32.8% 32.8% 32.1% 50% $50 65.3% 63.5% 75.5% 25% 51.2% 53.8% 56.1% 59.9% $0 0% 2012 2013 2014 2015 2016 June June 2012 2013 2014 2015 2016 June June 2016 2017 * Expense ratio excludes corporate overhead. 2016 2017 19
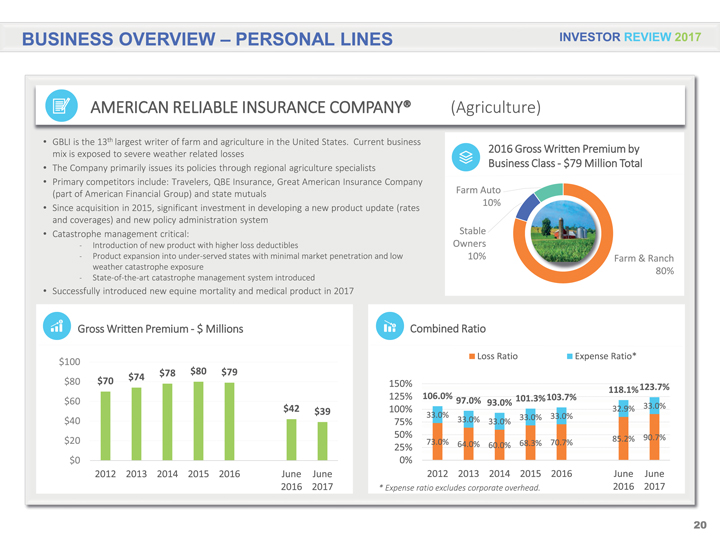
BUSINESS OVERVIEW – PERSONAL LINES INVESTOR REVIEW 2017 AMERICAN RELIABLE INSURANCE COMPANY® (Agriculture) GBLI is the 13th largest writer of farm and agriculture in the United States. Current business mix is exposed to severe weather related losses 2016 Gross Written Premium by The Company primarily issues its policies through regional agriculture specialists Business Class—$79 Million Total Primary competitors include: Travelers, QBE Insurance, Great American Insurance Company (part of American Financial Group) and state mutuals Farm Auto 10% Since acquisition in 2015, significant investment in developing a new product update (rates and coverages) and new policy administration system Catastrophe management critical: Stable Ë— Introduction of new product with higher loss deductibles Owners Ë— Product expansion into under-served states with minimal market penetration and low 10% Farm & Ranch weather catastrophe exposure 80% Ë— State-of-the-art catastrophe management system introduced Successfully introduced new equine mortality and medical product in 2017 Gross Written Premium—$ Millions Combined Ratio Loss Ratio Expense Ratio* $100 $78 $80 $79 $80 $70 $74 150% 123.7% 118.1% 125% 106.0% 97.0% 101.3%103.7% $60 93.0% 33.0% $42 $39 100% 32.9% 33.0% 33.0% 33.0% $40 75% 33.0% 33.0% 50% 85.2% 90.7% $20 73.0% 64.0% 60.0% 68.3% 70.7% 25% $0 0% 2012 2013 2014 2015 2016 June June 2012 2013 2014 2015 2016 June June 2016 2017 * Expense ratio excludes corporate overhead. 2016 2017 20
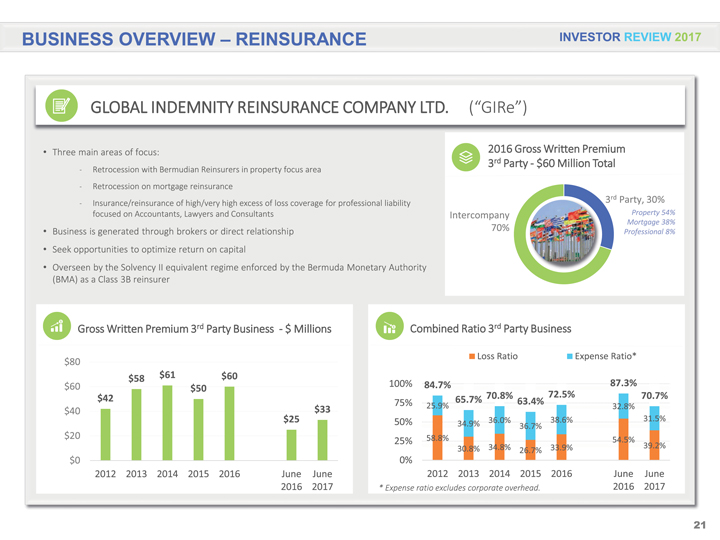
BUSINESS OVERVIEW – REINSURANCE INVESTOR REVIEW 2017 GLOBAL INDEMNITY REINSURANCE COMPANY LTD. (“GIRe”) Three main areas of focus: Retrocession with Bermudian Reinsurers in property focus area Retrocession on mortgage reinsurance Insurance/reinsurance of high/very high excess of loss coverage for professional liability focused on Accountants, Lawyers and Consultants Business is generated through brokers or direct relationship Seek opportunities to optimize return on capital Overseen by the Solvency II equivalent regime enforced by the Bermuda Monetary Authority (BMA) as a Class 3B reinsurer 2016 Gross Written Premium 3rd Party—$60 Million Total 3rd Party, 30% Intercompany Property 54% Mortgage 38% 70% Professional 8% Gross Written Premium 3rd Party Business —$ Millions $80 $58 $61 $60 $60 $50 $42 $40 $25 $33 $20 $0 2012 2013 2014 2015 2016 June June 2016 2017 Combined Ratio 3rd Party Business Loss Ratio Expense Ratio* 100% 84.7% 87.3% 70.8% 72.5% 70.7% 75% 65.7% 63.4% 25.9% 32.8% 50% 36.0% 38.6% 31.5% 34.9% 36.7% 25% 58.8% 54.5% 30.8% 34.8% 33.9% 39.2% 0% 26.7% 2012 2013 2014 2015 2016 June June * Expense ratio excludes corporate overhead. 2016 2017 21
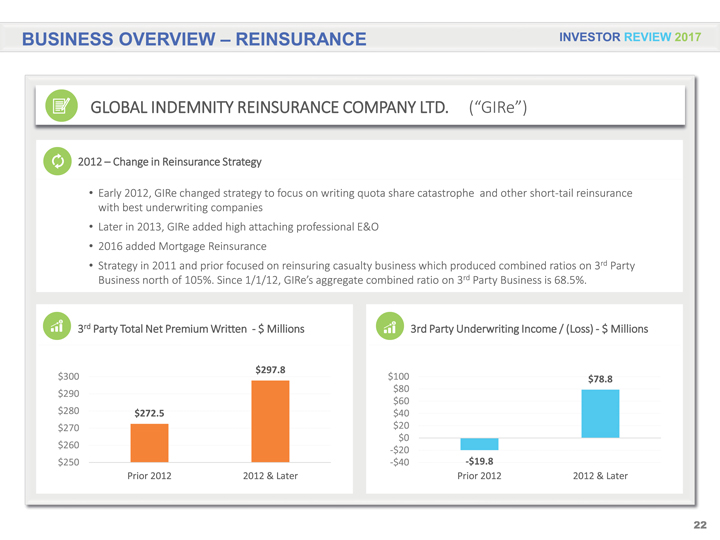
BUSINESS OVERVIEW – REINSURANCE INVESTOR REVIEW 2017 GLOBAL INDEMNITY REINSURANCE COMPANY LTD. (“GIRe”) 2012 – Change in Reinsurance Strategy Early 2012, GIRe changed strategy to focus on writing quota share catastrophe and other short-tail reinsurance with best underwriting companies Later in 2013, GIRe added high attaching professional E&O 2016 added Mortgage Reinsurance Strategy in 2011 and prior focused on reinsuring casualty business which produced combined ratios on 3rd Party Business north of 105%. Since 1/1/12, GIRe’s aggregate combined ratio on 3rd Party Business is 68.5%. 3rd Party Total Net Premium Written —$ Millions $297.8 $300 $290 $280 $272.5 $270 $260 $250 Prior 2012 2012 & Later 3rd Party Underwriting Income / (Loss)—$ Millions $100 $78.8 $80 $60 $40 $20 $0 -$20 -$40 -$19.8 Prior 2012 2012 & Later 22
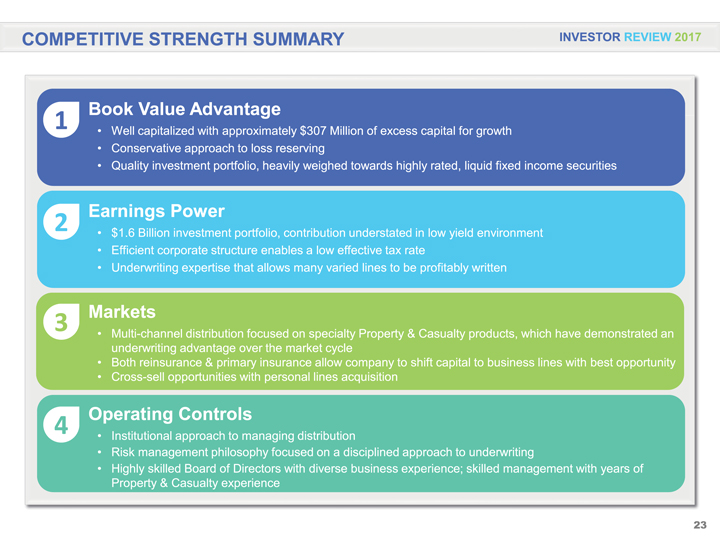
COMPETITIVE STRENGTH SUMMARY INVESTOR REVIEW 2017 1 Book Well capitalized Value Advantage with approximately $307 Million of excess capital for growth Conservative approach to loss reserving Quality investment portfolio, heavily weighed towards highly rated, liquid fixed income securities 2Earnings $1.6 Billion Power investment portfolio, contribution understated in low yield environment Efficient corporate structure enables a low effective tax rate Underwriting expertise that allows many varied lines to be profitably written 3Markets Multi-channel distribution focused on specialty Property & Casualty products, which have demonstrated an underwriting advantage over the market cycle Both reinsurance & primary insurance allow company to shift capital to business lines with best opportunity Cross-sell opportunities with personal lines acquisition 4Operating Institutional approach Controls to managing distribution Risk management philosophy focused on a disciplined approach to underwriting Highly skilled Board of Directors with diverse business experience; skilled management with years of Property & Casualty experience 23
Thank You Global Indemnity Limited 27 Hospital Road George Town, Grand Cayman, KYI-9008 Cayman Islands www.globalindemnity.ky info@globalindemnity.ky INVESTOR REVIEW 2017 2
