Attached files
| file | filename |
|---|---|
| 8-K - FORM 8-K - Regional Management Corp. | d449325d8k.htm |
Exhibit 99.1
Exhibit 99.1 Regional Management Corp. ABS East Conference September 18–19, 2017
Safe Harbor Statement This presentation, the related remarks, and the responses to various questions may contain various “forward looking statements” within the meaning of the Private Securities Litigation Reform Act of 1995, which represent Regional Management Corp.’s expectations or beliefs concerning future events. Words such as “may,” “will,” “should,” “likely,” “anticipates,” “expects,” “intends,” “plans,” “projects,” “believes,” “estimates,” “outlook,” and similar expressions may be used to identify these forward looking statements. Such forward looking statements are about matters that are inherently subject to risks and uncertainties, many of which are outside of the control of Regional Management. Factors that could cause actual results or performance to differ from the expectations expressed or implied in such forward looking statements include, but are not limited to, the following: changes in general economic conditions, including levels of unemployment and bankruptcies; risks associated with Regional Management’s transition to a new loan origination and servicing software system; risks related to opening new branches, including the ability or inability to open new branches as planned; risks inherent in making loans, including repayment risks and value of collateral, which risks may increase in light of adverse or concessionary economic conditions; changes in interest rates; the risk that Regional Management’s existing sources of liquidity become insufficient to satisfy its needs or that its access to these sources becomes unexpectedly restricted; changes in federal, state, or local laws, regulations, or regulatory policies and practices, and risks associated with the manner in which laws and regulations are interpreted, implemented, and enforced; the timing and amount of revenues that may be recognized by Regional Management; changes in current revenue and expense trends (including trends affecting delinquencies and credit losses); changes in Regional Management’s markets and general changes in the economy (particularly in the markets served by Regional Management); changes in the competitive environment in which Regional Management operates or in the demand for its products; risks related to acquisitions; changes in operating and administrative expenses; and the departure, transition, or replacement of key personnel. Such factors and others are discussed in greater detail in Regional Management’s filings with the Securities and Exchange Commission. We cannot guarantee future events, results, actions, levels of activity, performance, or achievements. Except to the extent required by law, neither Regional Management nor any of its respective agents, employees, or advisors intend or have any duty or obligation to supplement, amend, update, or revise any forward looking statement, whether as a result of new information, future developments, or otherwise. The information and opinions contained in this document are provided as at the date of this presentation and are subject to change without notice. This document has not been approved by any regulatory or supervisory authority. 2
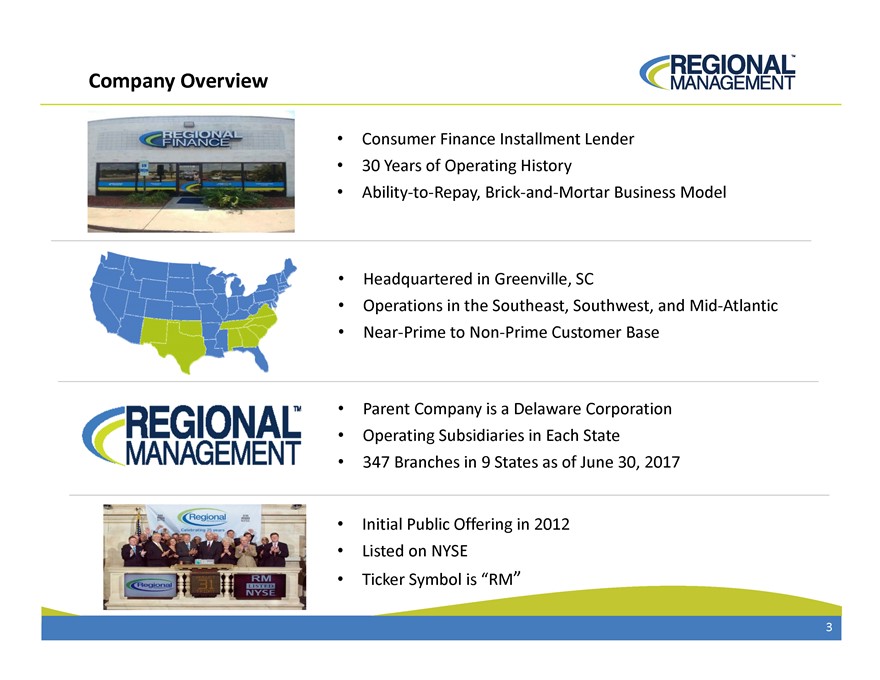
Company Overview Consumer Finance Installment Lender 30 Years of Operating History Ability to Repay, Brick and Mortar Business Model Headquartered in Greenville, SC Operations in the Southeast, Southwest, and Mid Atlantic Near Prime to Non Prime Customer Base Parent Company is a Delaware Corporation Operating Subsidiaries in Each State 347 Branches in 9 States as of June 30, 2017 Initial Public Offering in 2012 Listed on NYSE Ticker Symbol is “RM” 3
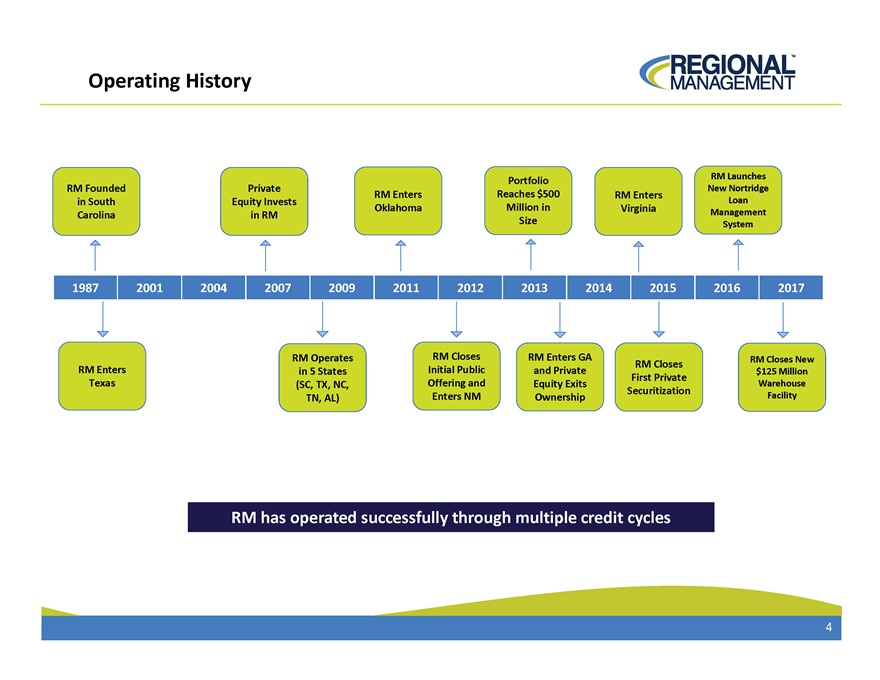
Operating History RM Launches Portfolio New Nortridge RM Founded Private RM Enters Reaches $500 RM Enters in South Equity Invests Loan Oklahoma Million in Virginia Carolina in RM Size Management System 1987 2001 2004 2007 2009 2011 2012 2013 2014 2015 2016 2017 RM Operates RM Closes RM Enters GA RM Closes New RM Closes RM Enters in 5 States Initial Public and Private $125 Million First Private Texas (SC, TX, NC, Offering and Equity Exits Warehouse Securitization TN, AL) Enters NM Ownership Facility RM has operated successfully through multiple credit cycles successfully through multiple credit cycles 4
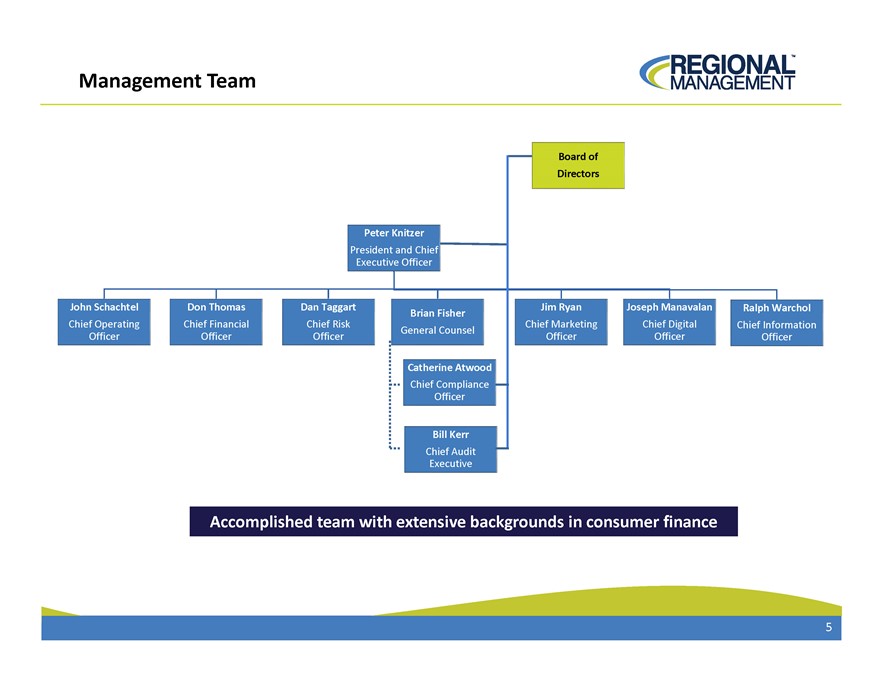
Management Team Board of Directors Peter Knitzer President and Chief Executive Officer John Schachtel Don Thomas Dan Taggart Jim Ryan Joseph Manavalan Ralph Warchol Brian Fisher Chief Operating Chief Financial Chief Risk Chief Marketing Chief Digital Chief Information General Counsel Officer Officer Officer Officer Officer Officer Catherine Atwood Chief Compliance Officer Bill Kerr Chief Audit Executive Accomplished team with extensive backgrounds in consumer finance 5
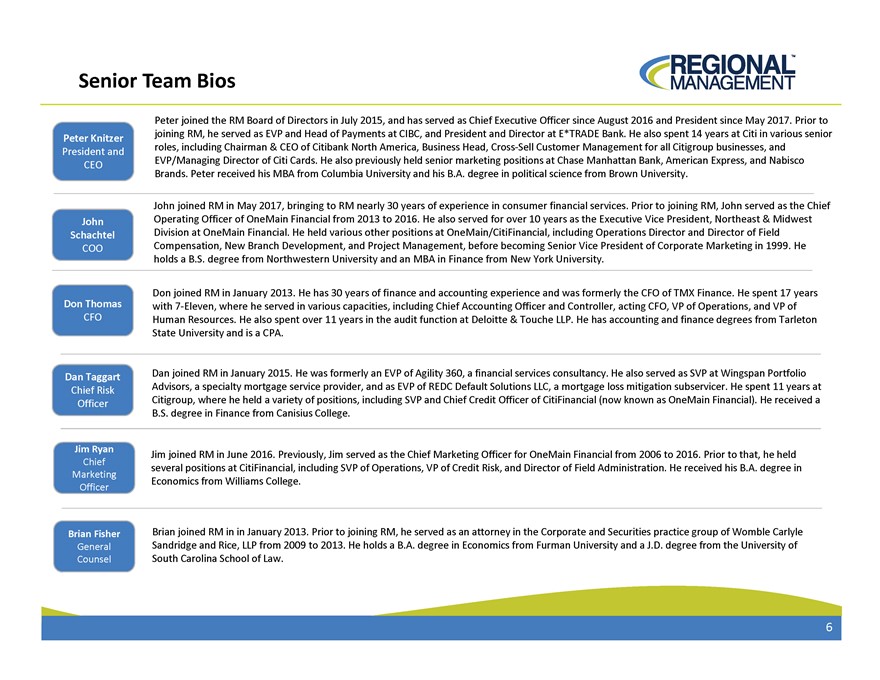
Senior Team Bios Peter joined the RM Board of Directors in July 2015, and has served as Chief Executive Officer since August 2016 and President since May 2017. Prior to joining RM, he served as EVP and Head of Payments at CIBC, and President and Director at E*TRADE Bank. He also spent 14 years at Citi in various senior Peter Knitzer roles, including Chairman & CEO of Citibank North America, Business Head, Cross Sell Customer Management for all Citigroup businesses, and President and EVP/Managing Director of Citi Cards. He also previously held senior marketing positions at Chase Manhattan Bank, American Express, and Nabisco CEO Brands. Peter received his MBA from Columbia University and his B.A. degree in political science from Brown University. John joined RM in May 2017, bringing to RM nearly 30 years of experience in consumer financial services. Prior to joining RM, John served as the Chief John Operating Officer of One Main Financial from 2013 to 2016. He also served for over 10 years as the Executive Vice President, Northeast & Midwest Schachtel Division at OneMain Financial. He held various other positions at OneMain/CitiFinancial, including Operations Director and Director of Field COO Compensation, New Branch Development, and Project Management, before becoming Senior Vice President of Corporate Marketing in 1999. He holds a B.S. degree from Northwestern University and an MBA in Finance from New York University. Don joined RM in January 2013. He has 30 years of finance and accounting experience and was formerly the CFO of TMX Finance. He spent 17 years Don Thomas with 7 Eleven, where he served in various capacities, including Chief Accounting Officer and Controller, acting CFO, VP of Operations, and VP of CFO Human Resources. He also spent over 11 years in the audit function at Deloitte & Touche LLP. He has accounting and finance degrees from Tarleton State University and is a CPA. Dan Taggart Dan joined RM in January 2015. He was formerly an EVP of Agility 360, a financial services consultancy. He also served as SVP at Wingspan Portfolio Chief Risk Advisors, a specialty mortgage service provider, and as EVP of REDC Default Solutions LLC, a mortgage loss mitigation subservicer. He spent 11 years at Officer Citigroup, where he held a variety of positions, including SVP and Chief Credit Officer of CitiFinancial (now known as OneMain Financial). He received a B.S. degree in Finance from Canisius College. Jim Ryan Jim joined RM in June 2016. Previously, Jim served as the Chief Marketing Officer for OneMain Financial from 2006 to 2016. Prior to that, he held Chief several positions at CitiFinancial, including SVP of Operations, VP of Credit Risk, and Director of Field Administration. He received his B.A. degree in Marketing Economics from Williams College. Officer Brian Fisher Brian joined RM in January 2013. Prior to joining RM, he served as an attorney in the Corporate and Securities practice group of Womble Carlyle General Sandridge and Rice, LLP from 2009 to 2013. He holds a B.A. degree in Economics from Furman University and a J.D. degree from the University of Counsel South Carolina School of Law. 6
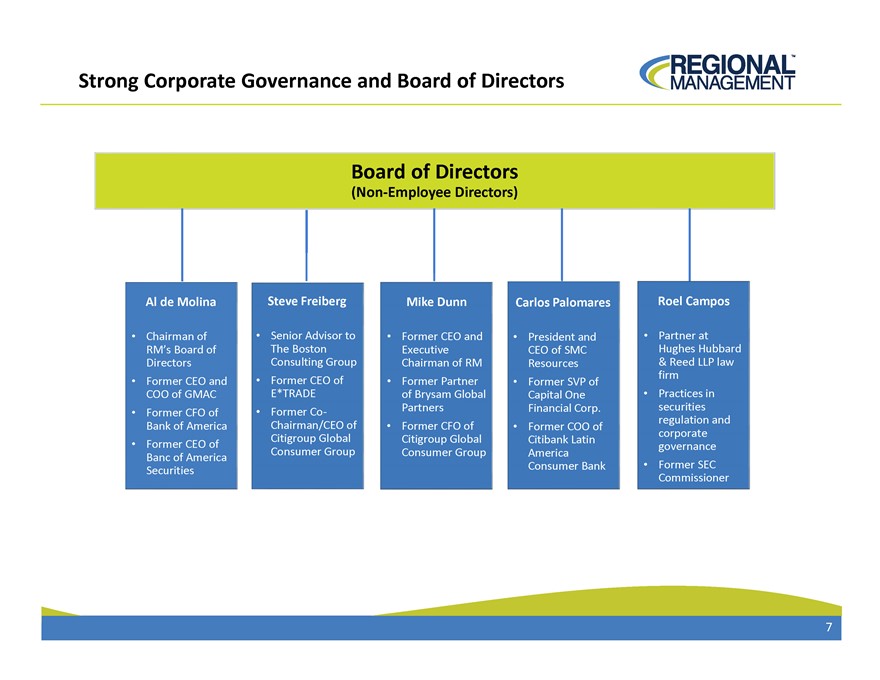
Strong Corporate Governance and Board of Directors Board of Directors (Non?Employee Directors) Al de Molina Steve Freiberg Mike Dunn Carlos Palomares Roel Campos Chairman of Senior Advisor to Former CEO and President and Partner at RM’s Board of The Boston Executive CEO of SMC Hughes Hubbard Directors Consulting Group Chairman of RM Resources & Reed LLP law firm Former CEO and Former CEO of Former Partner Former SVP of COO of GMAC E*TRADE of Brysam Global Capital One Practices in Partners Financial Corp. securities Former CFO of Former Co?regulation and Bank of America Chairman/CEO of Former CFO of Former COO of corporate Citigroup Global Citigroup Global Citibank Latin Former CEO of governance Consumer Group Consumer Group America Banc of America Consumer Bank Former SEC Securities Commissioner 7
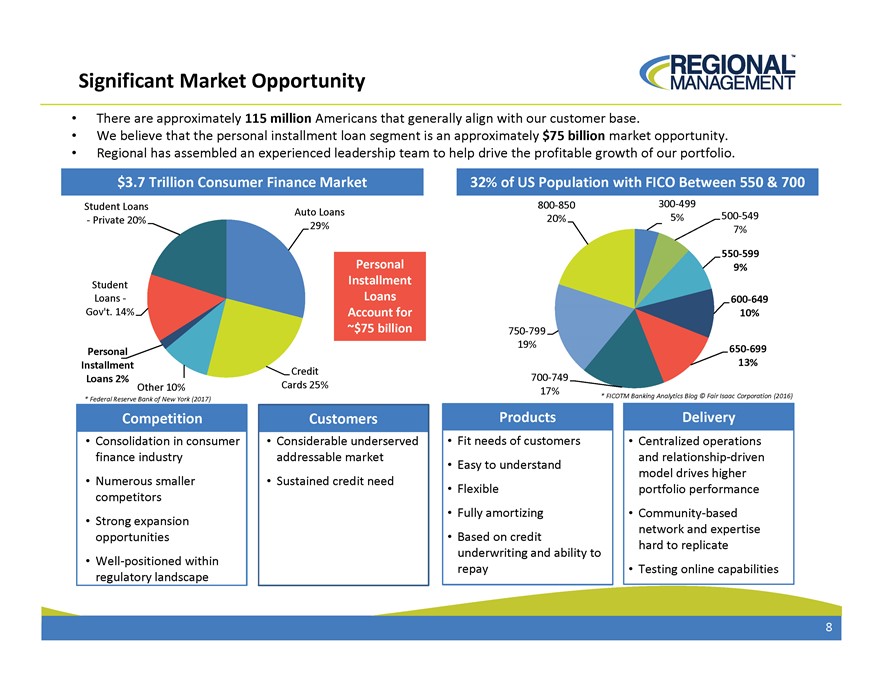
Significant Market Opportunity There are approximately 115 million Americans that generally align with our customer base. We believe that the personal installment loan segment is an approximately $75 billion market opportunity. Regional has assembled an experienced leadership team to help drive the profitable growth of our portfolio. $3.7 Trillion Consumer Finance Market 32% of US Population with FICO Between 550 & 700 Student Loans Auto Loans 800850 300499 20% 5% 500549 Private 20% 29% 7% 550 599 Personal 9% Student Installment Loans Loans 600 649 Gov’t. 14% Account for 10% ~$75 billion 750799 19% Personal 650699 Installment 13% Credit Loans 2% 700749 Other 10% Cards 25% 17% * FICOTM Banking Analytics Blog © Fair Isaac Corporation (2016) * Federal Reserve Bank of New York (2017) Competition Customers Products Delivery Consolidation in consumer Considerable underserved Fit needs of customers Centralized operations finance industry addressable market and relationship driven Easy to understand model drives higher Numerous smaller Sustained credit need Flexible portfolio performance competitors Fully amortizing Communitybased Strong expansion network and expertise opportunities Based on credit hard to replicate underwriting and ability to Wellpositioned within repay Testing online capabilities regulatory landscape 8
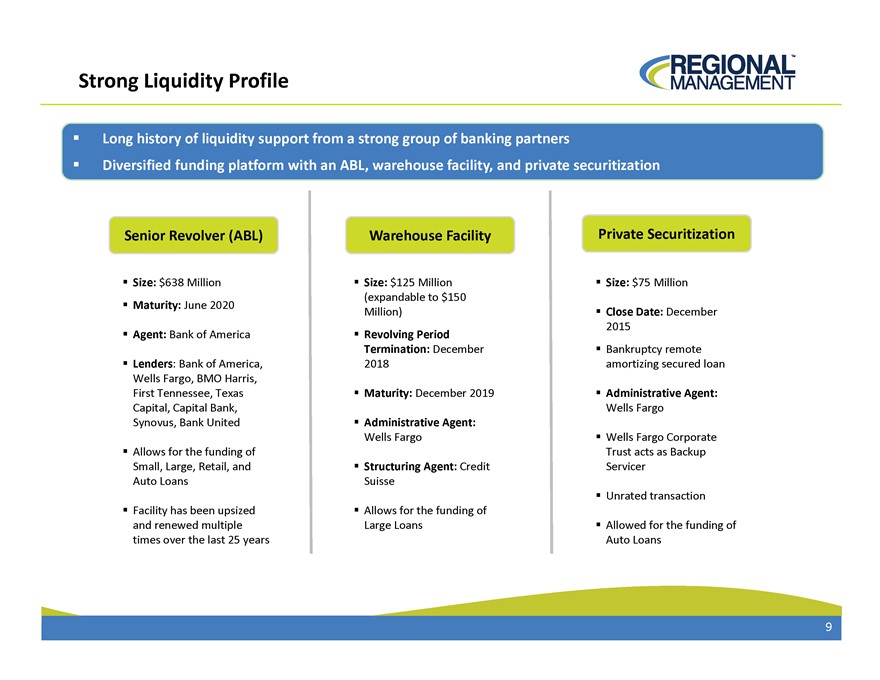
Strong Liquidity Profile Long history of liquidity support from a strong group of banking partners Diversified funding platform with an ABL, warehouse facility, and private securitization Senior Revolver (ABL) Warehouse Facility Private Securitization Size: $638 Million Size: $125 Million Size: $75 Million (expandable to $150 Maturity: June 2020 Million) Close Date: December 2015 Agent: Bank of America Revolving Period Termination: December Bankruptcy remote Lenders: Bank of America, 2018 amortizing secured loan Wells Fargo, BMO Harris, First Tennessee, Texas Maturity: December 2019 Administrative Agent: Capital, Capital Bank, Wells Fargo Synovus, Bank United Administrative Agent: Wells Fargo Wells Fargo Corporate Allows for the funding of Trust acts as Backup Small, Large, Retail, and Structuring Agent: Credit Servicer Auto Loans Suisse Unrated transaction Facility has been upsized Allows for the funding of and renewed multiple Large Loans Allowed for the funding of times over the last 25 years Auto Loans 9
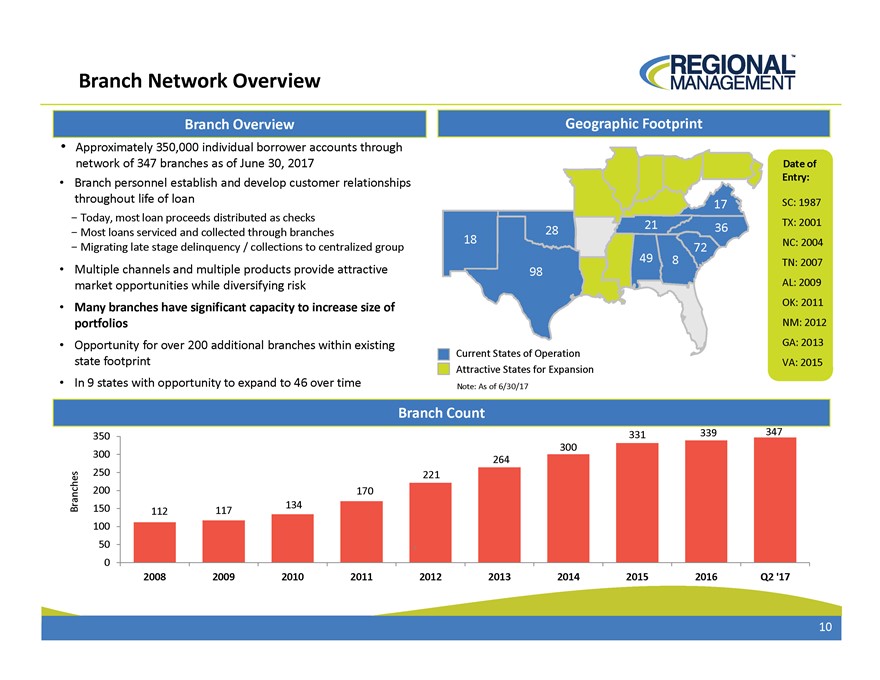
Branch Network Overview Branch Overview Geographic Footprint Approximately 350,000 individual borrower accounts through network of 347 branches as of June 30, 2017 Date of Entry: Branch personnel establish and develop customer relationships throughout life of loan SC: 1987 17 - Today, most loan proceeds distributed as checks 21 TX: 2001 - Most loans serviced and collected through branches 28 36 18 NC: 2004 - Migrating late stage delinquency / collections to centralized group 72 49 8 TN: 2007 Multiple channels and multiple products provide attractive 98 market opportunities while diversifying risk AL: 2009 Many branches have significant capacity to increase size of OK: 2011 portfolios NM: 2012 Opportunity for over 200 additional branches within existing GA: 2013 Current States of Operation state footprint Attractive States for Expansion VA: 2015 In 9 states with opportunity to expand to 46 over time Note: As of 6/30/17 Branch Count 331 339 347 350 300 300 264 250 221 200 170 Branches 150 134 112 117 100 50 0 2008 2009 2010 2011 2012 2013 2014 2015 2016 Q2 ‘17 10
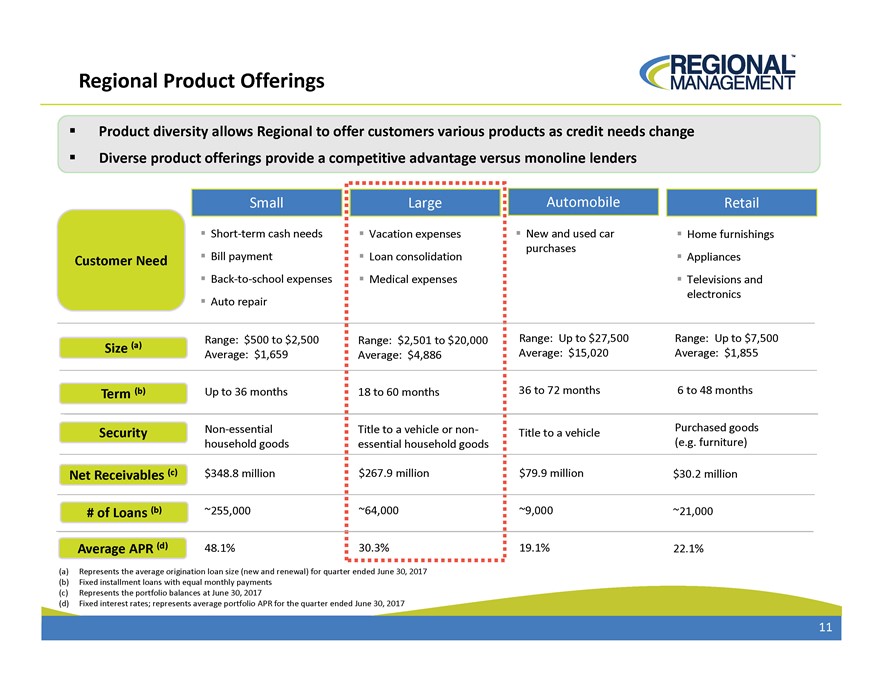
Regional Product Offerings Product diversity allows Regional to offer customers various products as credit needs change Diverse product offerings provide a competitive advantage versus monoline lenders Small Large Automobile Retail Short term cash needs Vacation expenses New and used car Home furnishings purchases Customer Need Bill payment Loan consolidation Appliances Back to school expenses Medical expenses Televisions and electronics Auto repair Range: $500 to $2,500 Range: $2,501 to $20,000 Range: Up to $27,500 Range: Up to $7,500 Size (a) Average: $1,659 Average: $4,886 Average: $15,020 Average: $1,855 Term (b) Up to 36 months 18 to 60 months 36 to 72 months 6 to 48 months Non essential Title to a vehicle or non Purchased goods Security Title to a vehicle (e.g. furniture) household goods essential household goods Net Receivables (c) $348.8 million $267.9 million $79.9 million $30.2 million # of Loans (b) ~255,000 ~64,000 ~9,000 ~21,000 Average APR (d) 48.1% 30.3% 19.1% 22.1% (a) Represents the average origination loan size (new and renewal) for quarter ended June 30, 2017 (b) Fixed installment loans with equal monthly payments (c) Represents the portfolio balances at June 30, 2017 (d) Fixed interest rates; represents average portfolio APR for the quarter ended June 30, 2017 11
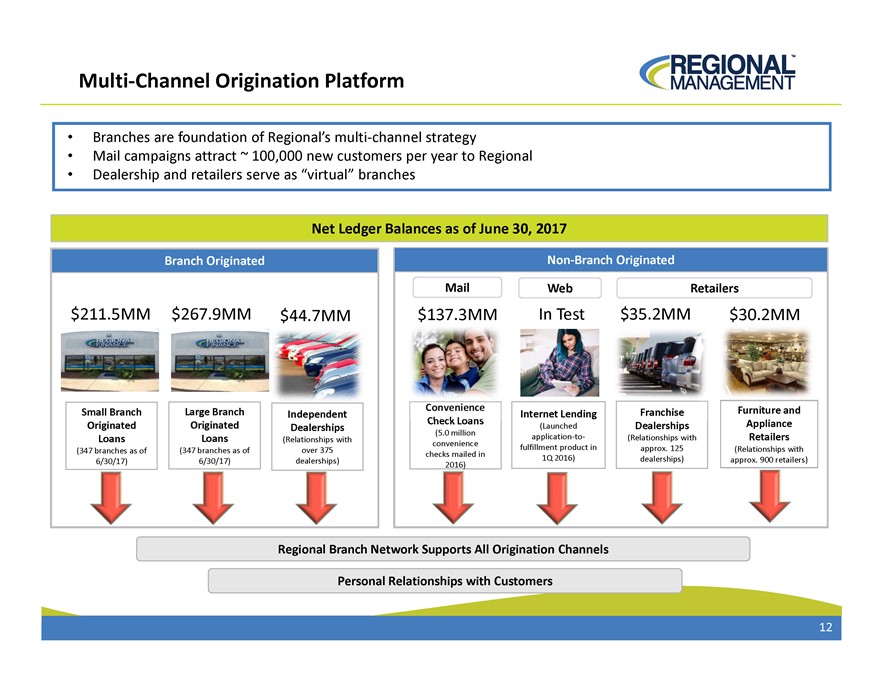
MultiChannel Origination Platform Branches are foundation of Regional’s multichannel strategy Mail campaigns attract ~ 100,000 new customers per year to Regional Dealership and retailers serve as “virtual” branches Net Ledger Balances as of June 30, 2017 Branch Originated NonBranch Originated Mail Web Retailers $211.5MM $267.9MM $44.7MM $137.3MM In Test $35.2MM $30.2MM Small Branch Large Branch Independent Internet Lending Franchise Furniture and Originated Originated Dealerships (Launched Dealerships Appliance (5.0 million Loans Loans (Relationships with convenience applicationto (Relationships with Retailers (347 branches as of over 375 fulfillment product in approx. 125 (Relationships with (347 branches as of checks mailed in 6/30/17) dealerships) 1Q 2016) dealerships) approx. 900 retailers) 6/30/17) 2016) Regional Branch Network Supports All Origination Channels Personal Relationships with Customers 12
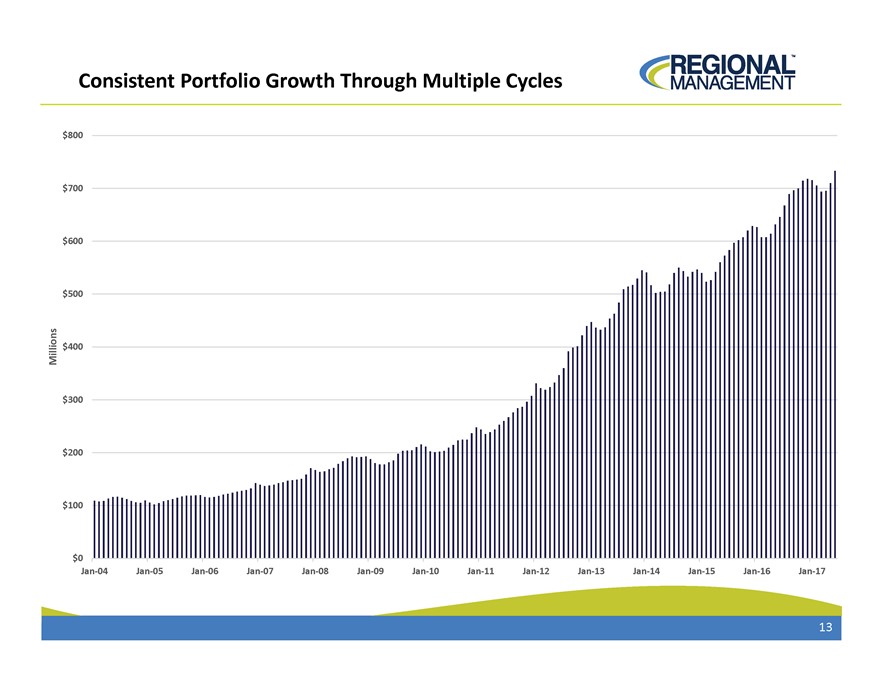
Consistent Portfolio Growth Through Multiple Cycles $800 $700 $600 $500 Millions $400 $300 $200 $100 $0 Jan 04 Jan 05 Jan 06 Jan 07 Jan 08 Jan 09 Jan 10 Jan 11 Jan 12 Jan 13 Jan 14 Jan 15 Jan 16 Jan 17 13
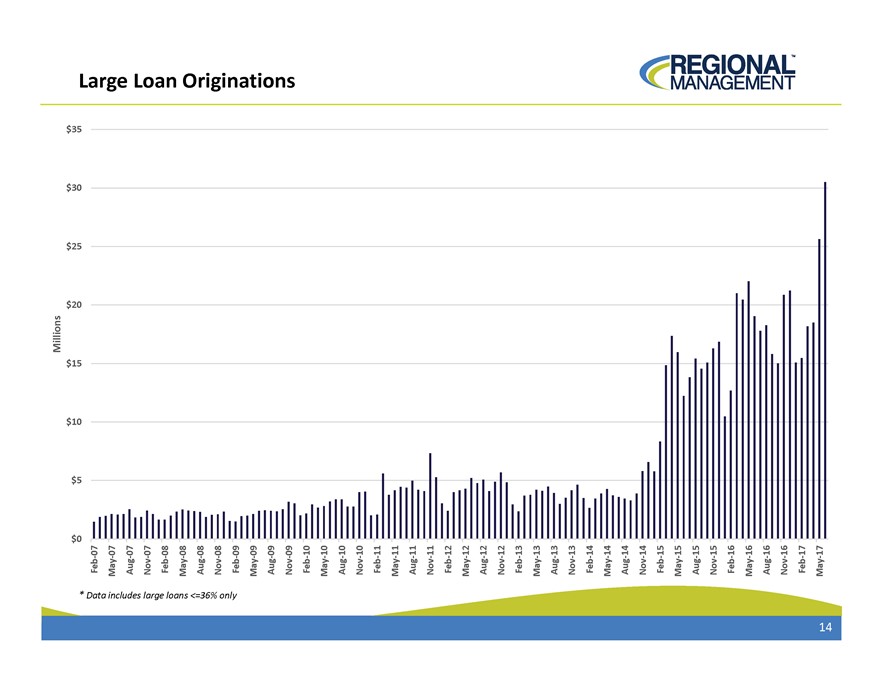
Millions $ $ $ $ $ $ $ $ * 0 5 10 15 20 25 30 35 Data Feb07 May07 Large includes Aug07 large Nov07 Feb08 Loan loans May08 <=36% Aug08 only Nov08 Feb09 May09 Aug09 Nov09 Originations Feb10 May10 Aug10 Nov10 Feb11 May11 Aug11 Nov11 Feb12 May12 Aug12 Nov12 Feb13 May13 Aug13 Nov13 Feb14 May14 Aug14 Nov14 Feb15 May15 Aug15 Nov15 Feb16 May16 Aug16 Nov16 Feb17 May17 14
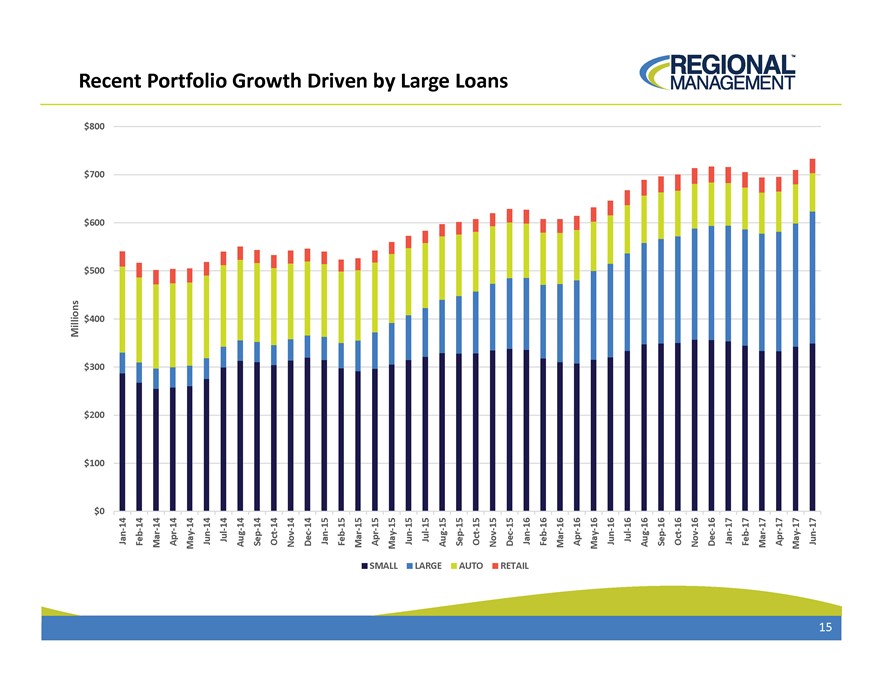
Millions $ $ $ $ $ $ $ $ 0 $ 100 200 300 400 500 600 700 800 Jan14 Recent Feb14 Mar14 Apr14 May14 Jun14 Jul14 Portfolio Aug14 Sep14 Oct14 Nov14 Growth Dec14 Jan15 Feb15 Mar15 Driven Apr15 SMALL May15 by Jun15 LARGE Jul15 Aug15 Large Sep15 AUTO Oct15 Nov15 Loans RETAIL Dec15 Jan16 Feb16 Mar16 Apr16 May16 Jun16 Jul16 Aug16 Sep16 Oct16 Nov16 Dec16 Jan17 Feb17 Mar17 Apr17 May17 Jun17 15
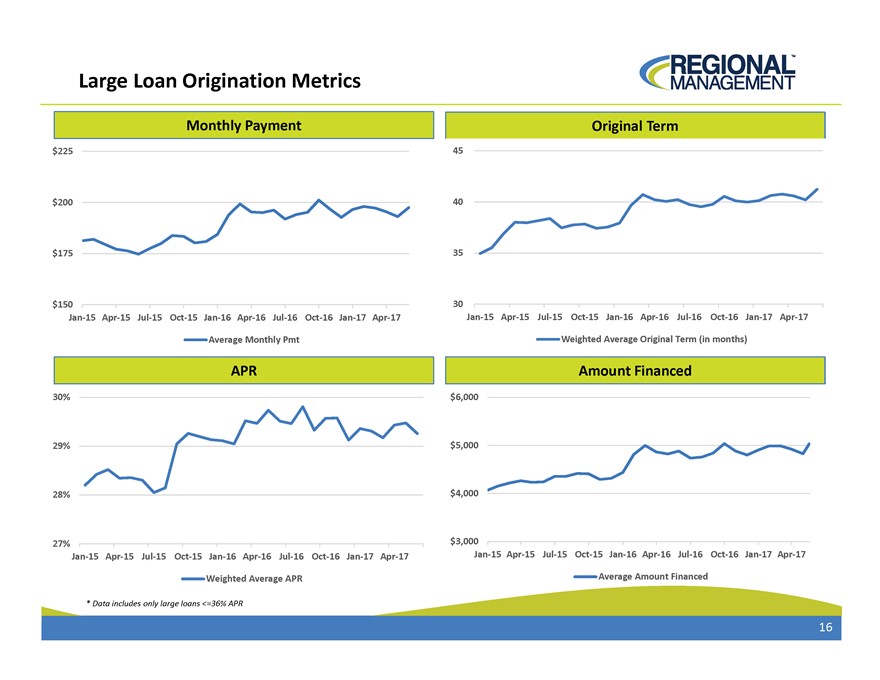
Large Loan Origination Metrics Monthly Payment Original Term $225 45 $200 40 $175 35 $150 30 Jan15 Apr15 Jul15 Oct15 Jan16 Apr16 Jul16 Oct16 Jan17 Apr17 Jan15 Apr15 Jul15 Oct15 Jan16 Apr16 Jul16 Oct16 Jan17 Apr17 Average Monthly Pmt Weighted Average Original Term (in months) APR Amount Financed 30% $6,000 29% $5,000 28% $4,000 27% $3,000 Jan15 Apr15 Jul15 Oct15 Jan16 Apr16 Jul16 Oct16 Jan17 Apr17 Jan15 Apr15 Jul15 Oct15 Jan16 Apr16 Jul16 Oct16 Jan17 Apr17 Weighted Average APR Average Amount Financed * Data includes only large loans =36% APR 16
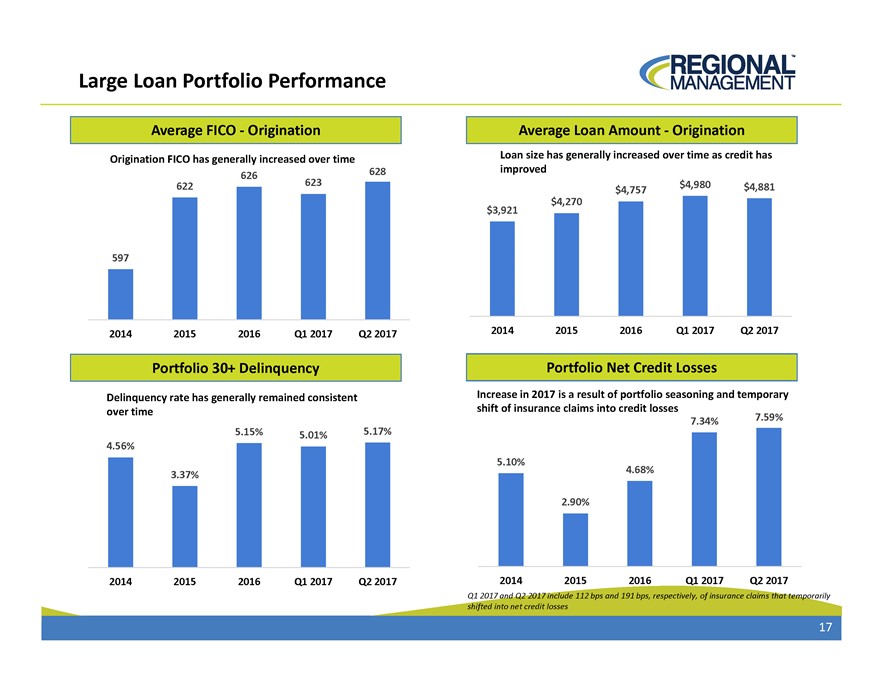
Large Loan Portfolio Performance Average FICO Origination Average Loan Amount Origination Origination FICO has generally increased over time Loan size has generally increased over time as credit has 628 improved 626 622 623 $4,980 $4,757 $4,881 $3,921 $4,270 597 2014 2015 2016 Q1 2017 Q2 2017 2014 2015 2016 Q1 2017 Q2 2017 Portfolio 30+ Delinquency Portfolio Net Credit Losses Delinquency rate has generally remained consistent Increase in 2017 is a result of portfolio seasoning and temporary over time shift of insurance claims into credit losses 7.59% 7.34% 5.15% 5.01% 5.17% 4.56% 5.10% 4.68% 3.37% 2.90% 2014 2015 2016 Q1 2017 Q2 2017 2014 2015 2016 Q1 2017 Q2 2017 Q1 2017 and Q2 2017 include 112 bps and 191 bps, respectively, of insurance claims that temporarily shifted into net credit losses 17
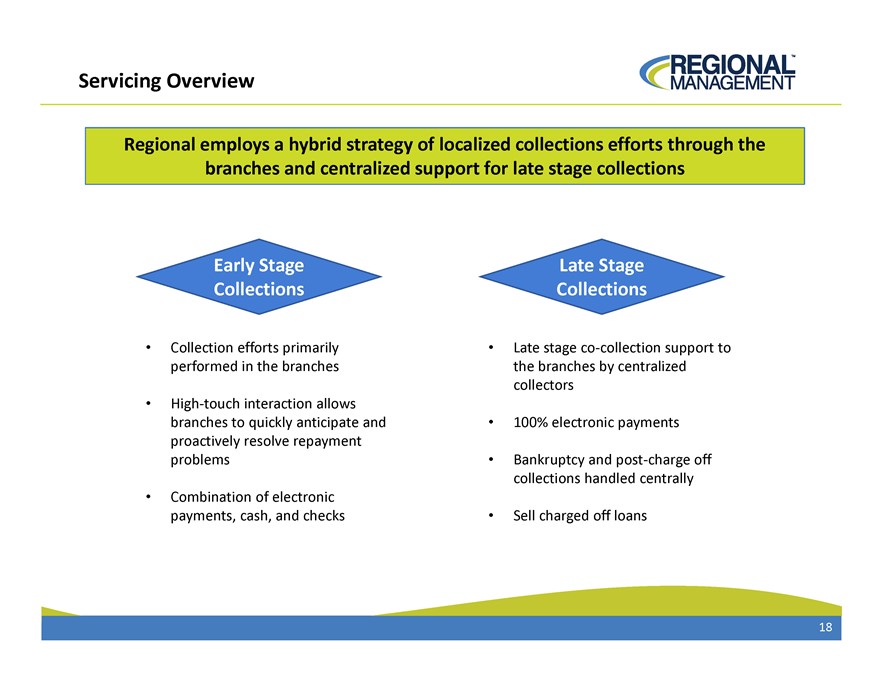
Servicing Overview Regional employs a hybrid strategy of localized collections efforts through the branches and centralized support for late stage collections Early Stage Late Stage Collections Collections Collection efforts primarily Late stage cocollection support to performed in the branches the branches by centralized collectors Hightouch interaction allows branches to quickly anticipate and 100% electronic payments proactively resolve repayment problems Bankruptcy and postcharge off collections handled centrally Combination of electronic payments, cash, and checks Sell charged off loans 18
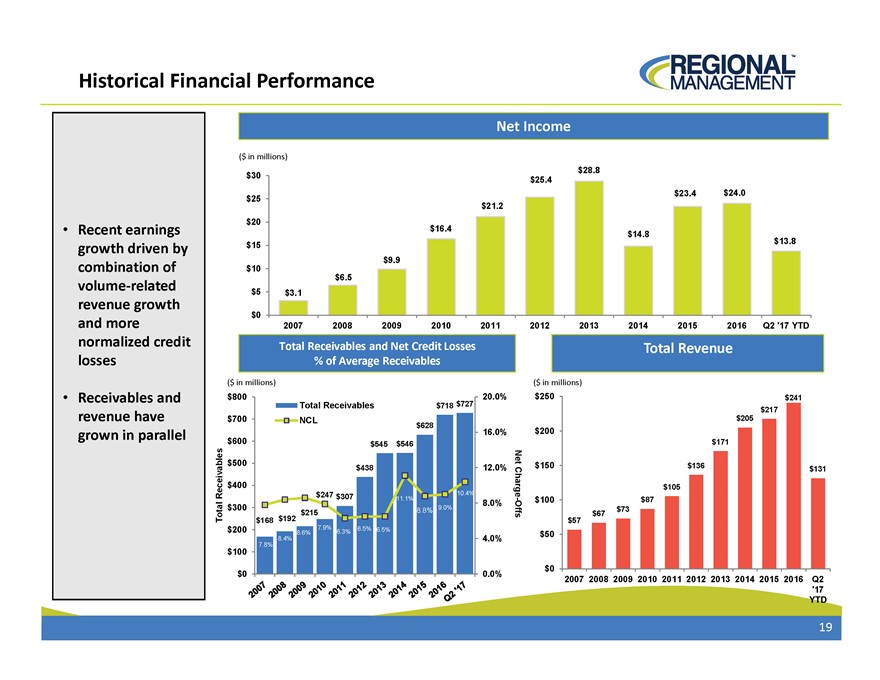
Historical Financial Performance Net Income ($ in millions) $28.8 $30 $25.4 $23.4 $24.0 $25 $21.2 $20 Recent earnings $16.4 $14.8 $13.8 growth driven by $15 $10 $9.9 combination of $6.5 volumerelated $5 $3.1 revenue growth $0 and more 2007 2008 2009 2010 2011 2012 2013 2014 2015 2016 Q2 ‘17 YTD normalized credit Total Receivables and Net Credit Losses Total Revenue losses % of Average Receivables ($ in millions) ($ in millions) Receivables and $800 $727 20.0% $250 $241 Total Receivables $718 $217 revenue have $700 NCL $628 $205 grown in parallel 16.0% $200 $600 $545 $546 $171 $500Net $438 12.0% $150 $136 $131 $400 $105 Receivables $247 $307 10.4% Charge 11.1% - 8.0% $100 $87 $300 8.8% 9.0% $73 $215 Offs $67 Total $168 $192 $57 $200 7.9% 6.5% 6.5% 8.6% 6.3% $50 8.4% 4.0% $100 7.8% $0 $0 0.0% 2007 2008 2009 2010 2011 2012 2013 2014 2015 2016 Q2 ‘17 YTD 19
REGIONAL MANAGEMENT TM RM LISTED NYSE