Attached files
| file | filename |
|---|---|
| 8-K - 8-K - US BANCORP \DE\ | d408045d8k.htm |
Barclays Global Financial Services Conference 2017 September 13, 2017 Andy Cecere President and CEO Exhibit 99.1
Forward-looking Statements and Additional Information The following information appears in accordance with the Private Securities Litigation Reform Act of 1995: Today’s presentation contains forward-looking statements about U.S. Bancorp. Statements that are not historical or current facts, including statements about beliefs and expectations, are forward-looking statements and are based on the information available to, and assumptions and estimates made by, management as of the date hereof. These forward-looking statements cover, among other things, anticipated future revenue and expenses and the future plans and prospects of U.S. Bancorp. Forward-looking statements involve inherent risks and uncertainties, and important factors could cause actual results to differ materially from those anticipated. A reversal or slowing of the current economic recovery or another severe contraction could adversely affect U.S. Bancorp’s revenues and the values of its assets and liabilities. Global financial markets could experience a recurrence of significant turbulence, which could reduce the availability of funding to certain financial institutions and lead to a tightening of credit, a reduction of business activity, and increased market volatility. Stress in the commercial real estate markets, as well as a downturn in the residential real estate markets could cause credit losses and deterioration in asset values. In addition, changes to statutes, regulations, or regulatory policies or practices could affect U.S. Bancorp in substantial and unpredictable ways. U.S. Bancorp’s results could also be adversely affected by deterioration in general business and economic conditions; changes in interest rates; deterioration in the credit quality of its loan portfolios or in the value of the collateral securing those loans; deterioration in the value of securities held in its investment securities portfolio; legal and regulatory developments; litigation; increased competition from both banks and non-banks; changes in customer behavior and preferences; breaches in data security; effects of mergers and acquisitions and related integration; effects of critical accounting policies and judgments; and management’s ability to effectively manage credit risk, market risk, operational risk, compliance risk, strategic risk, interest rate risk, liquidity risk and reputational risk. For discussion of these and other risks that may cause actual results to differ from expectations, refer to U.S. Bancorp’s Annual Report on Form 10-K for the year ended December 31, 2016, on file with the Securities and Exchange Commission, including the sections entitled “Risk Factors” and “Corporate Risk Profile” contained in Exhibit 13, and all subsequent filings with the Securities and Exchange Commission under Sections 13(a), 13(c), 14 or 15(d) of the Securities Exchange Act of 1934. However, factors other than these also could adversely affect U.S. Bancorp’s results, and the reader should not consider these factors to be a complete set of all potential risks or uncertainties. Forward-looking statements speak only as of the date hereof, and U.S. Bancorp undertakes no obligation to update them in light of new information or future events. This presentation includes non-GAAP financial measures to describe U.S. Bancorp’s performance. The calculations of these measures are provided in the Appendix. These disclosures should not be viewed as a substitute for operating results determined in accordance with GAAP, nor are they necessarily comparable to non-GAAP performance measures that may be presented by other companies.
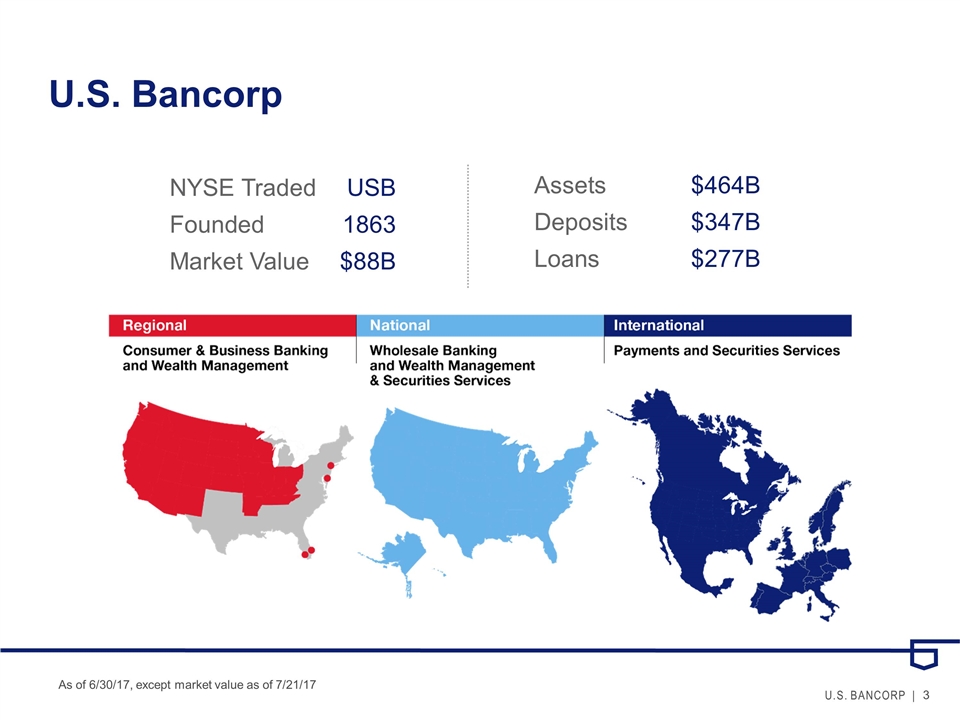
U.S. Bancorp As of 6/30/17, except market value as of 7/21/17 NYSE TradedUSB Founded 1863 Market Value $88B Assets $464B Deposits $347B Loans $277B
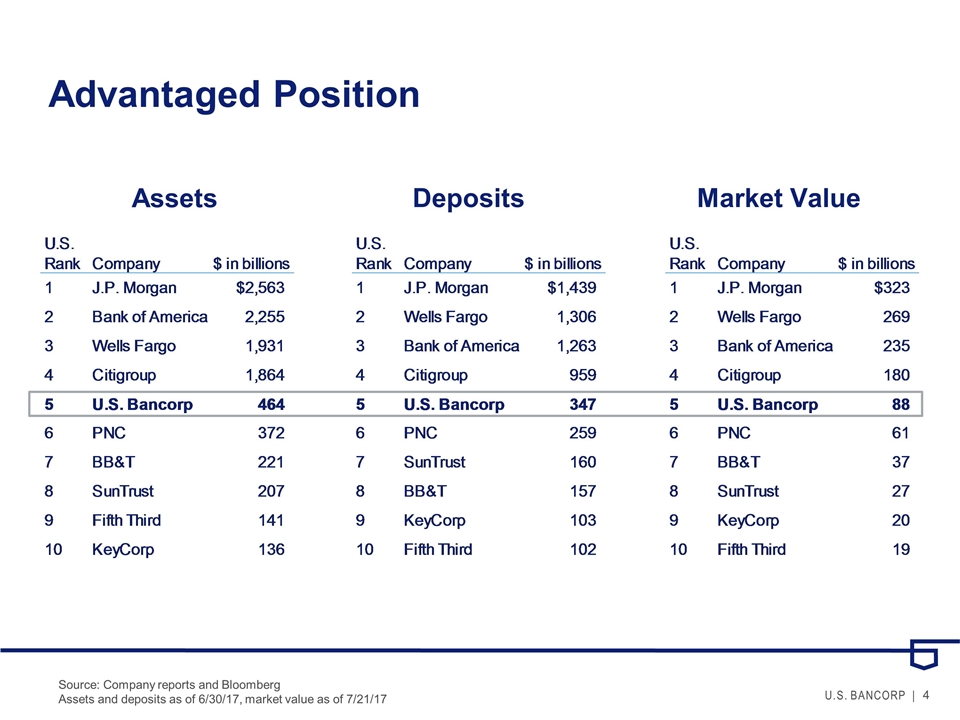
Advantaged Position Source: Company reports and Bloomberg Assets and deposits as of 6/30/17, market value as of 7/21/17 Assets Market Value Deposits
Setting Expectations Some things won’t change… Our business mix Our risk management philosophy Our culture
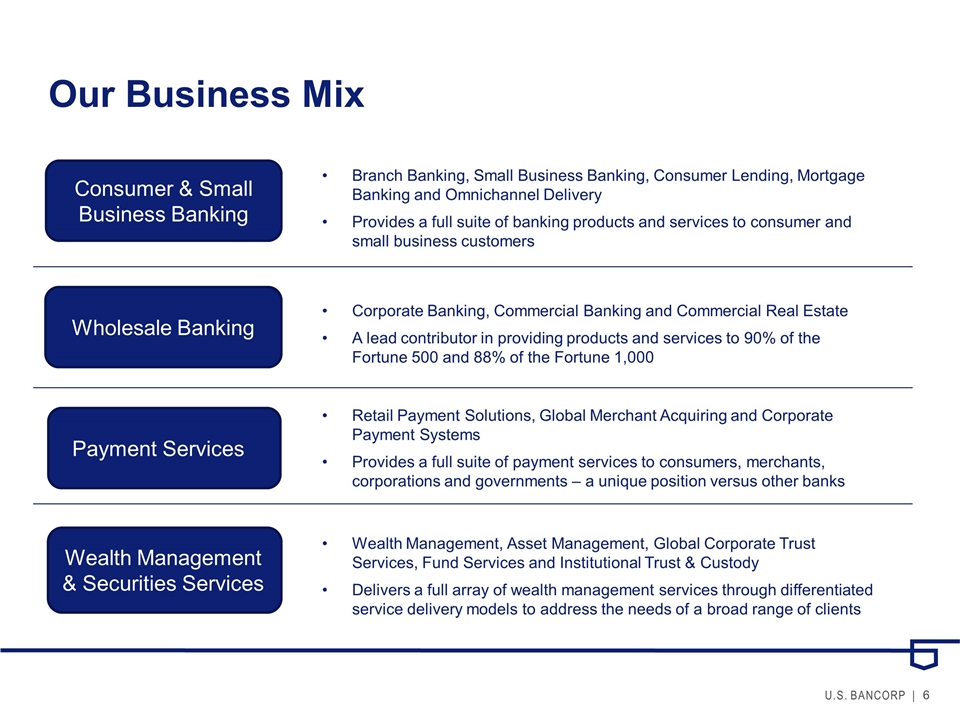
Our Business Mix Payment Services Wealth Management & Securities Services Retail Payment Solutions, Global Merchant Acquiring and Corporate Payment Systems Provides a full suite of payment services to consumers, merchants, corporations and governments – a unique position versus other banks Wealth Management, Asset Management, Global Corporate Trust Services, Fund Services and Institutional Trust & Custody Delivers a full array of wealth management services through differentiated service delivery models to address the needs of a broad range of clients Branch Banking, Small Business Banking, Consumer Lending, Mortgage Banking and Omnichannel Delivery Provides a full suite of banking products and services to consumer and small business customers Corporate Banking, Commercial Banking and Commercial Real Estate A lead contributor in providing products and services to 90% of the Fortune 500 and 88% of the Fortune 1,000 Wholesale Banking Consumer & Small Business Banking
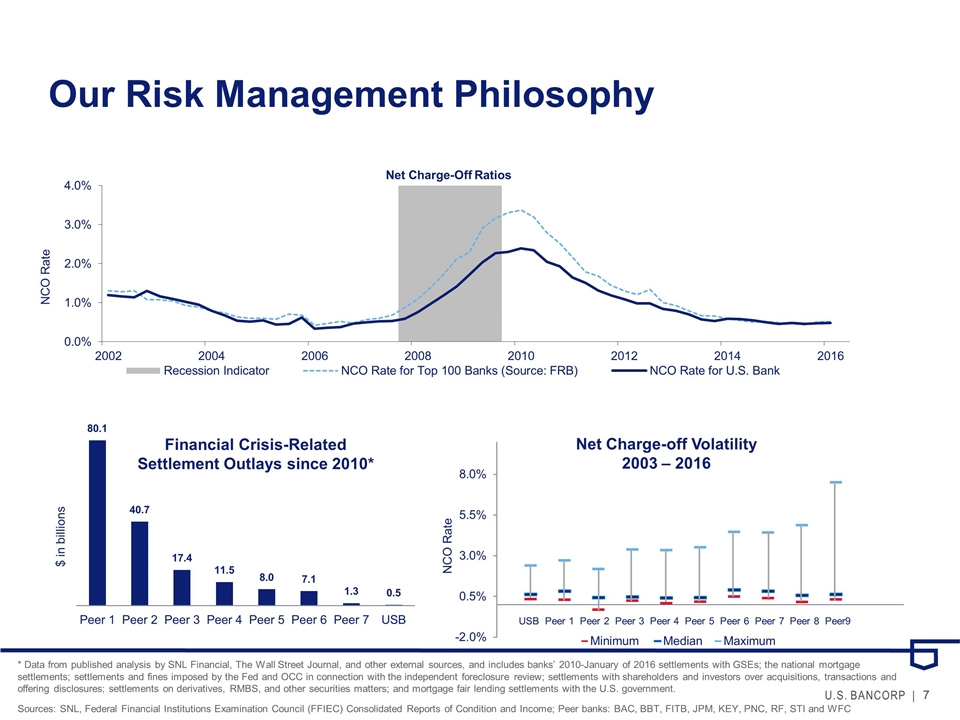
Our Risk Management Philosophy Financial Crisis-Related Settlement Outlays since 2010* * Data from published analysis by SNL Financial, The Wall Street Journal, and other external sources, and includes banks’ 2010-January of 2016 settlements with GSEs; the national mortgage settlements; settlements and fines imposed by the Fed and OCC in connection with the independent foreclosure review; settlements with shareholders and investors over acquisitions, transactions and offering disclosures; settlements on derivatives, RMBS, and other securities matters; and mortgage fair lending settlements with the U.S. government. Sources: SNL, Federal Financial Institutions Examination Council (FFIEC) Consolidated Reports of Condition and Income; Peer banks: BAC, BBT, FITB, JPM, KEY, PNC, RF, STI and WFC Net Charge-off Volatility 2003 – 2016 $ in billions USB Peer 1 Peer 2 Peer 3 Peer 4 Peer 5 Peer 6 Peer 7 Peer 8 Peer9
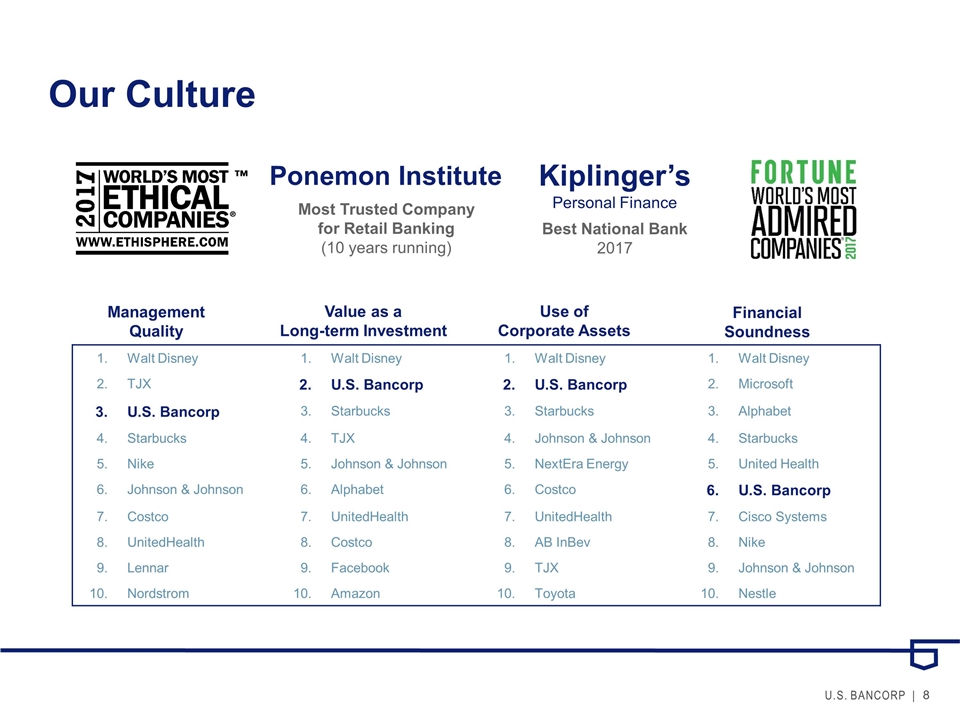
Our Culture 1. Walt Disney 1. Walt Disney 1. Walt Disney 1. Walt Disney 2. TJX 2. U.S. Bancorp 2. U.S. Bancorp 2. Microsoft 3. U.S. Bancorp 3. Starbucks 3. Starbucks 3. Alphabet 4. Starbucks 4. TJX 4. Johnson & Johnson 4. Starbucks 5. Nike 5. Johnson & Johnson 5. NextEra Energy 5. United Health 6. Johnson & Johnson 6. Alphabet 6. Costco 6. U.S. Bancorp 7. Costco 7. UnitedHealth 7. UnitedHealth 7. Cisco Systems 8. UnitedHealth 8. Costco 8. AB InBev 8. Nike 9. Lennar 9. Facebook 9. TJX 9. Johnson & Johnson 10. Nordstrom 10. Amazon 10. Toyota 10. Nestle Management Quality Value as a Long-term Investment Use of Corporate Assets Financial Soundness Most Trusted Company for Retail Banking (10 years running) Best National Bank 2017 Ponemon Institute Kiplinger’s Personal Finance
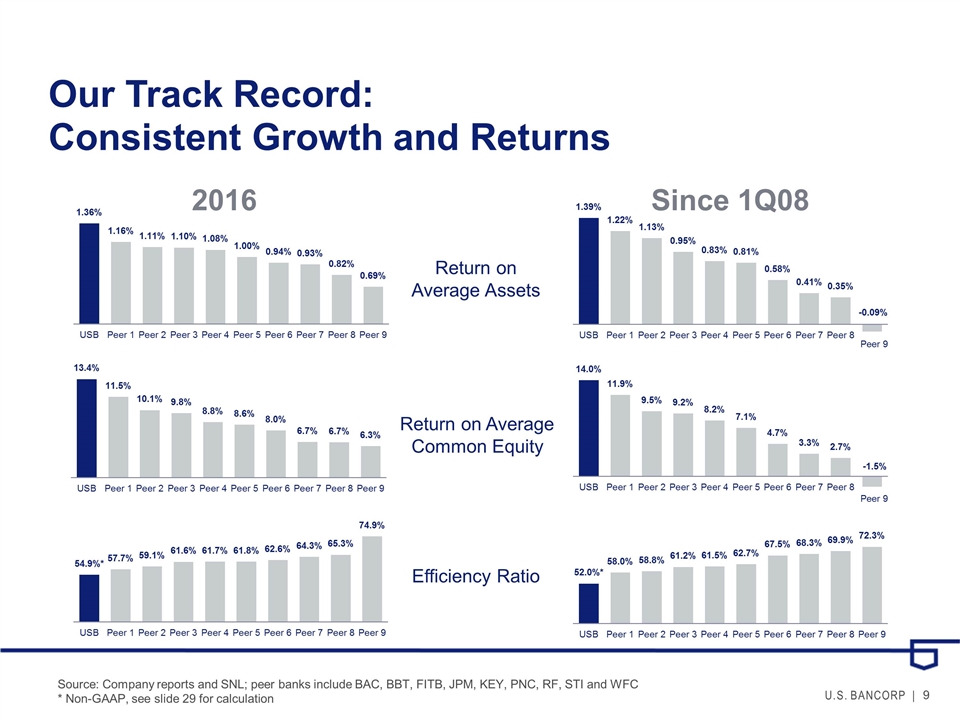
Return on Average Assets Return on Average Common Equity Efficiency Ratio Since 1Q08 2016 Source: Company reports and SNL; peer banks include BAC, BBT, FITB, JPM, KEY, PNC, RF, STI and WFC * Non-GAAP, see slide 29 for calculation Peer 9 Peer 9 Consistent Growth and Returns Our Track Record:
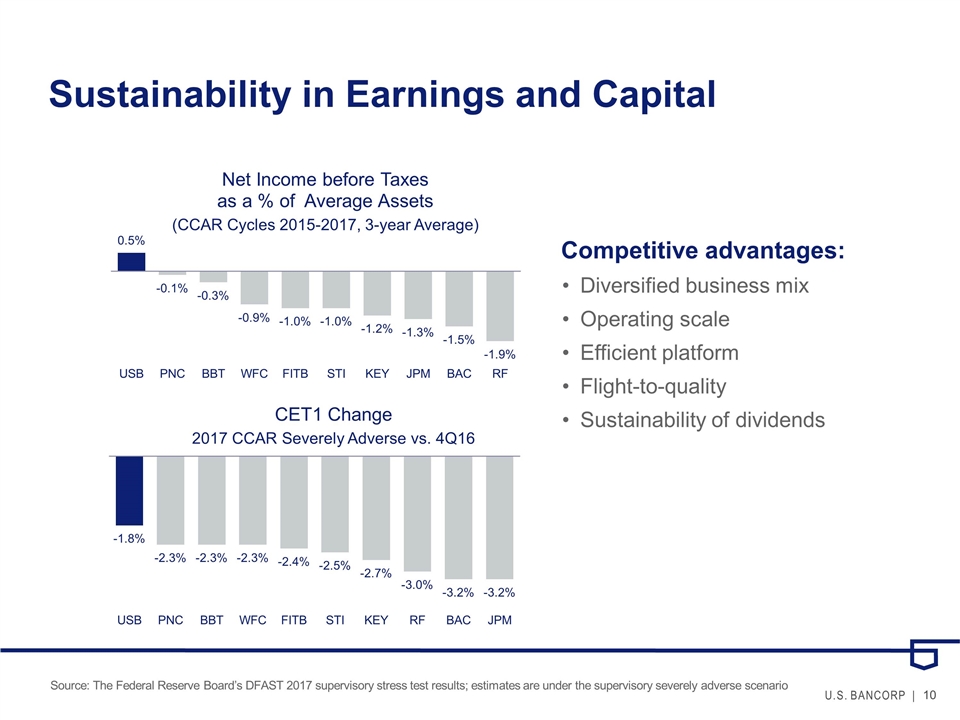
Sustainability in Earnings and Capital Competitive advantages: Diversified business mix Operating scale Efficient platform Flight-to-quality Sustainability of dividends Source: The Federal Reserve Board’s DFAST 2017 supervisory stress test results; estimates are under the supervisory severely adverse scenario
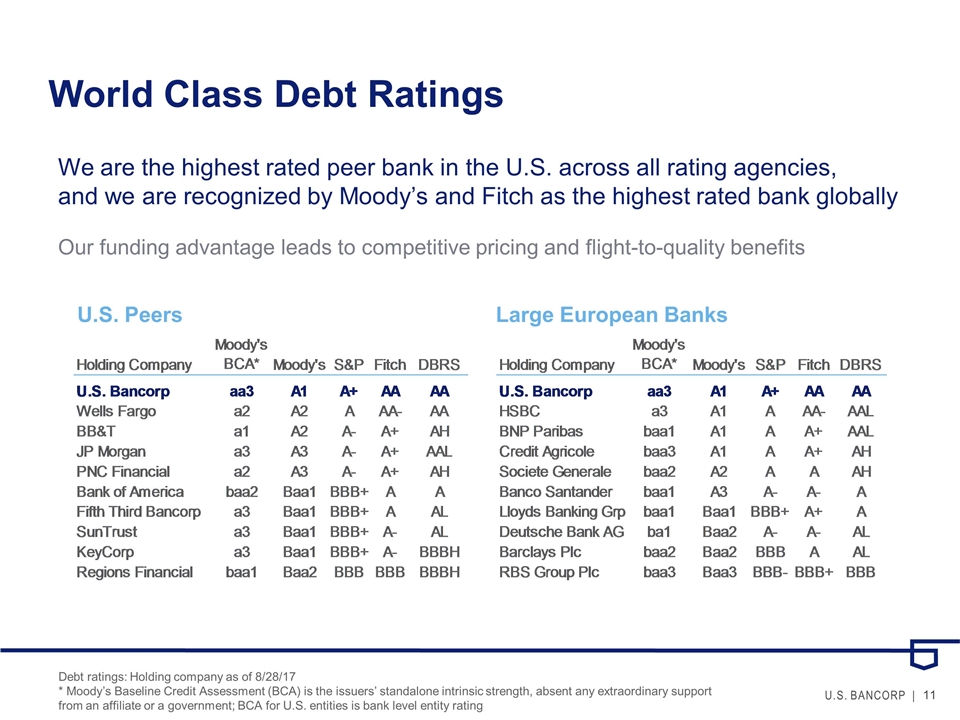
World Class Debt Ratings Debt ratings: Holding company as of 8/28/17 * Moody’s Baseline Credit Assessment (BCA) is the issuers’ standalone intrinsic strength, absent any extraordinary support from an affiliate or a government; BCA for U.S. entities is bank level entity rating We are the highest rated peer bank in the U.S. across all rating agencies, and we are recognized by Moody’s and Fitch as the highest rated bank globally Our funding advantage leads to competitive pricing and flight-to-quality benefits U.S. Peers Large European Banks
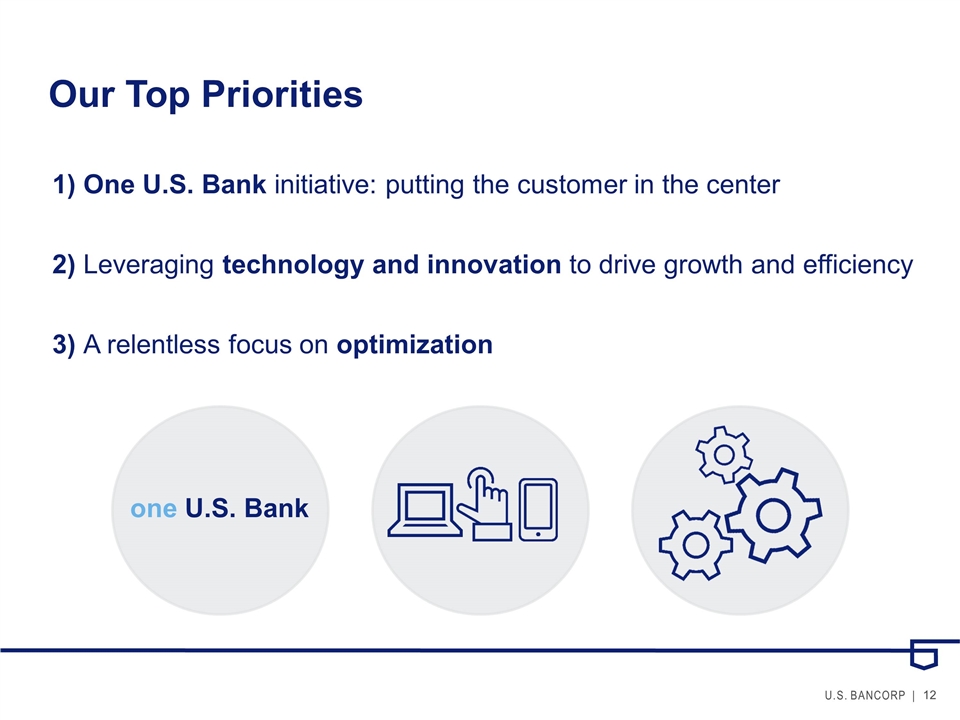
Our Top Priorities 1) One U.S. Bank initiative: putting the customer in the center 2) Leveraging technology and innovation to drive growth and efficiency 3) A relentless focus on optimization one U.S. Bank
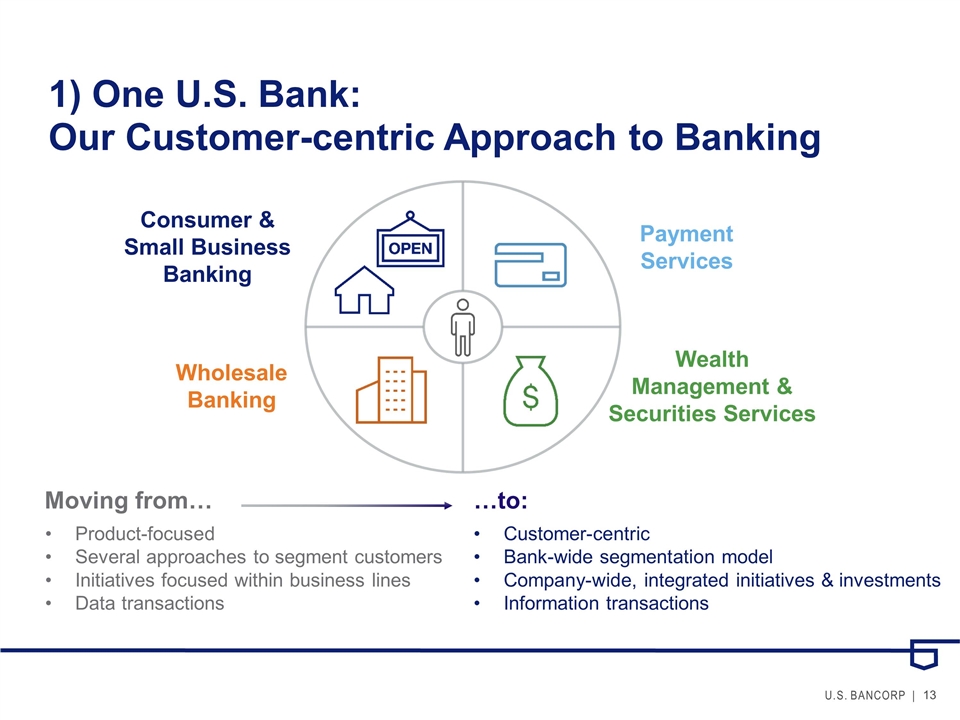
1) One U.S. Bank: Product-focused Several approaches to segment customers Initiatives focused within business lines Data transactions Customer-centric Bank-wide segmentation model Company-wide, integrated initiatives & investments Information transactions Moving from… …to: Wealth Management & Securities Services Wholesale Banking Payment Services Consumer & Small Business Banking Our Customer-centric Approach to Banking
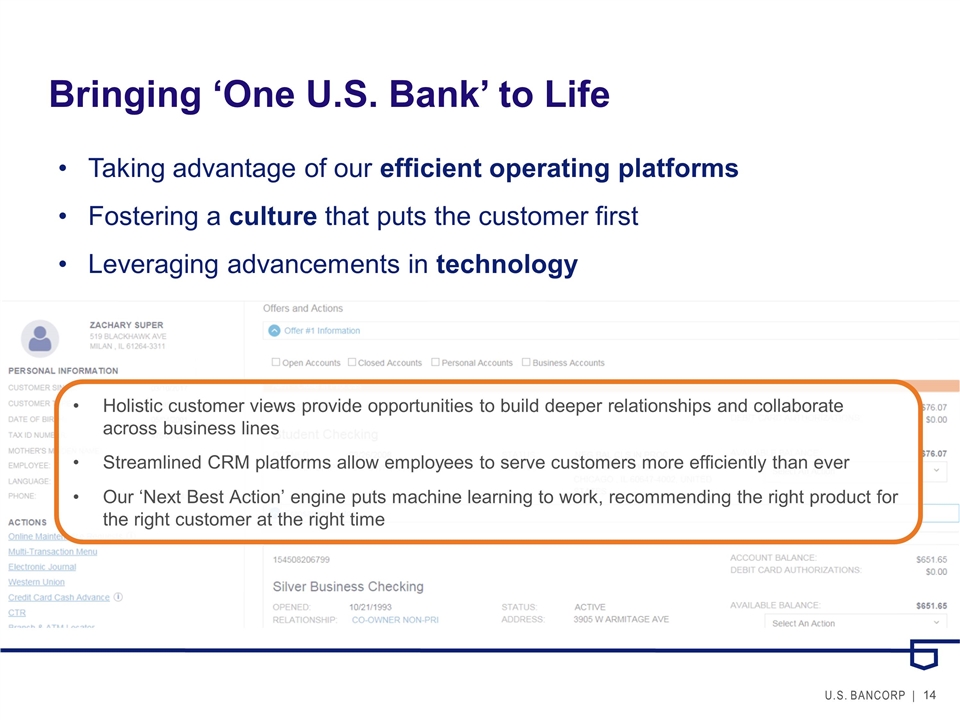
Bringing ‘One U.S. Bank’ to Life Taking advantage of our efficient operating platforms Fostering a culture that puts the customer first Leveraging advancements in technology Holistic customer views provide opportunities to build deeper relationships and collaborate across business lines Streamlined CRM platforms allow employees to serve customers more efficiently than ever Our ‘Next Best Action’ engine puts machine learning to work, recommending the right product for the right customer at the right time
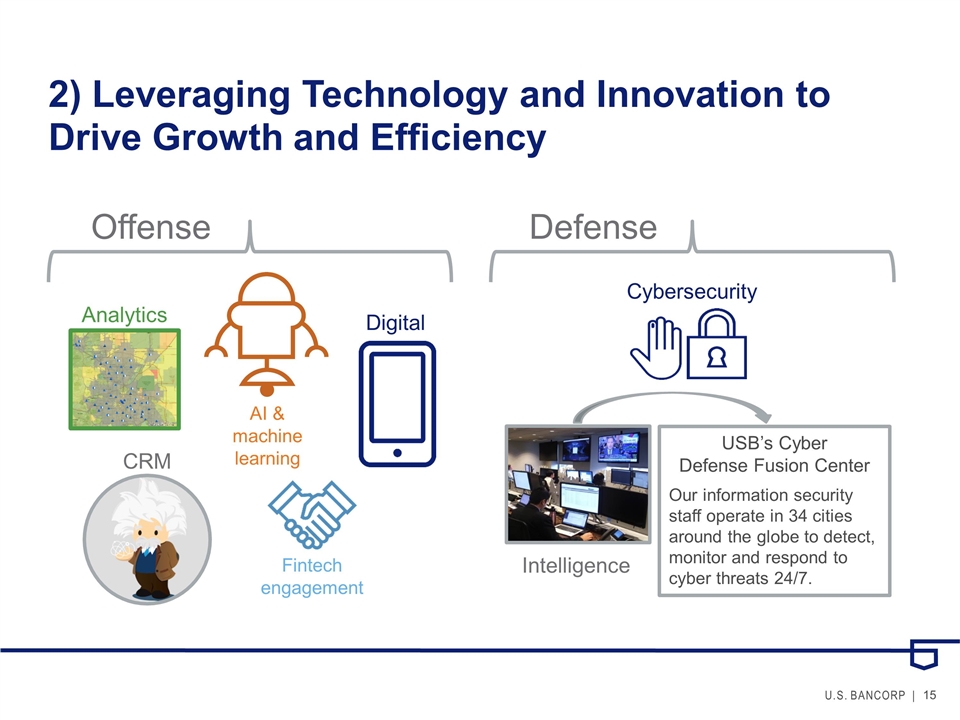
2) Leveraging Technology and Innovation to Drive Growth and Efficiency Fintech engagement CRM AI & machine learning Digital Analytics Offense Defense Cybersecurity USB’s Cyber Defense Fusion Center Our information security staff operate in 34 cities around the globe to detect, monitor and respond to cyber threats 24/7. Intelligence
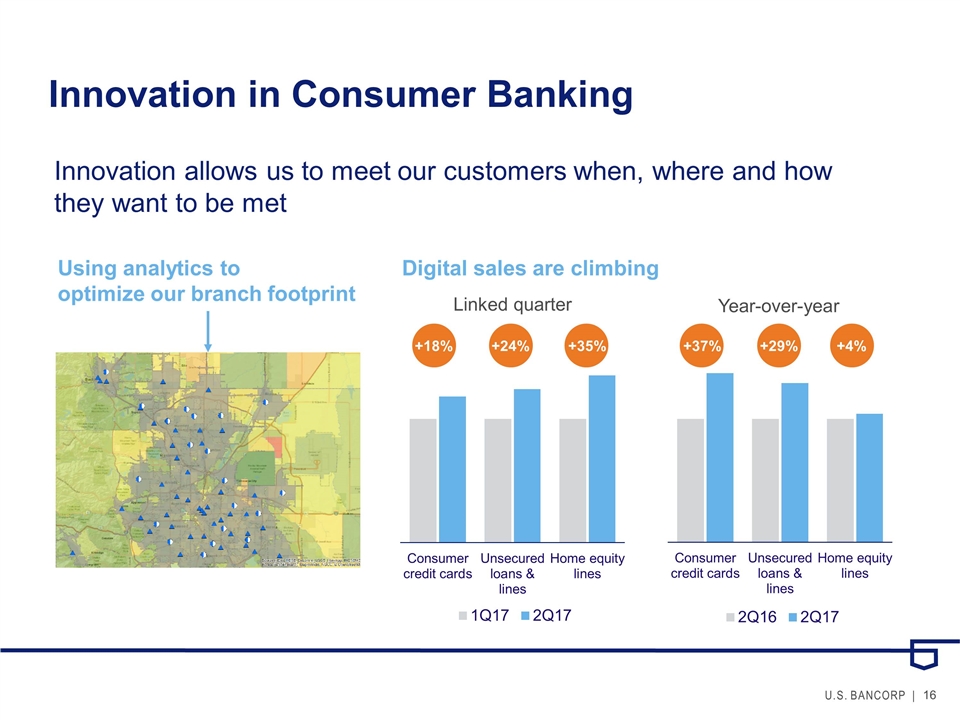
Innovation in Consumer Banking Innovation allows us to meet our customers when, where and how they want to be met Using analytics to optimize our branch footprint Digital sales are climbing +18% +24% +35% +37% +29% +4%
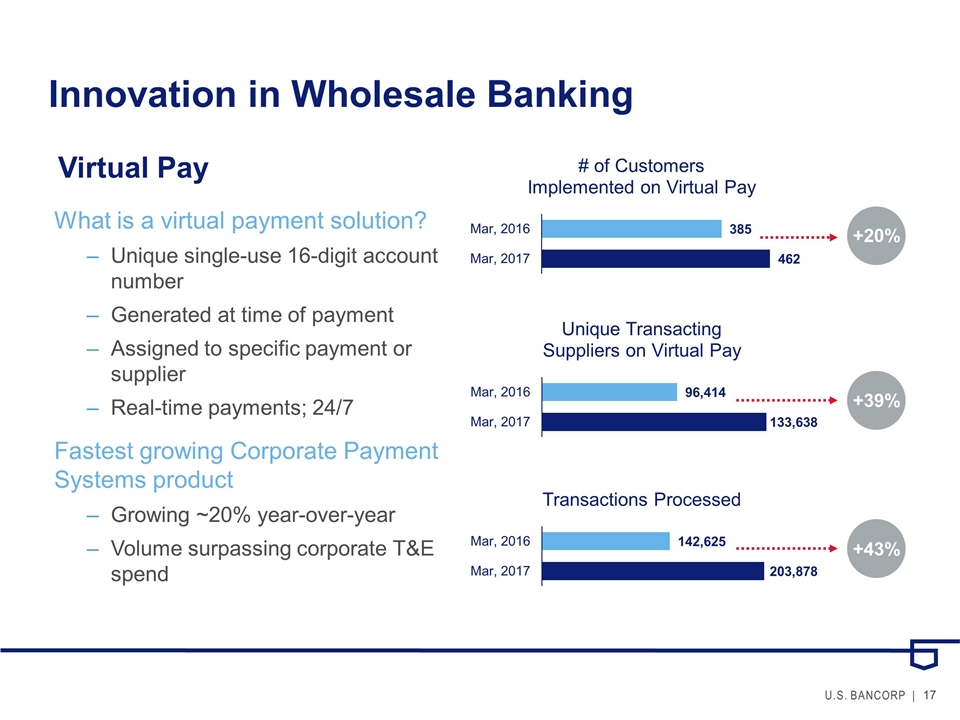
Innovation in Wholesale Banking Virtual Pay What is a virtual payment solution? Unique single-use 16-digit account number Generated at time of payment Assigned to specific payment or supplier Real-time payments; 24/7 Fastest growing Corporate Payment Systems product Growing ~20% year-over-year Volume surpassing corporate T&E spend +20% +39% +43%
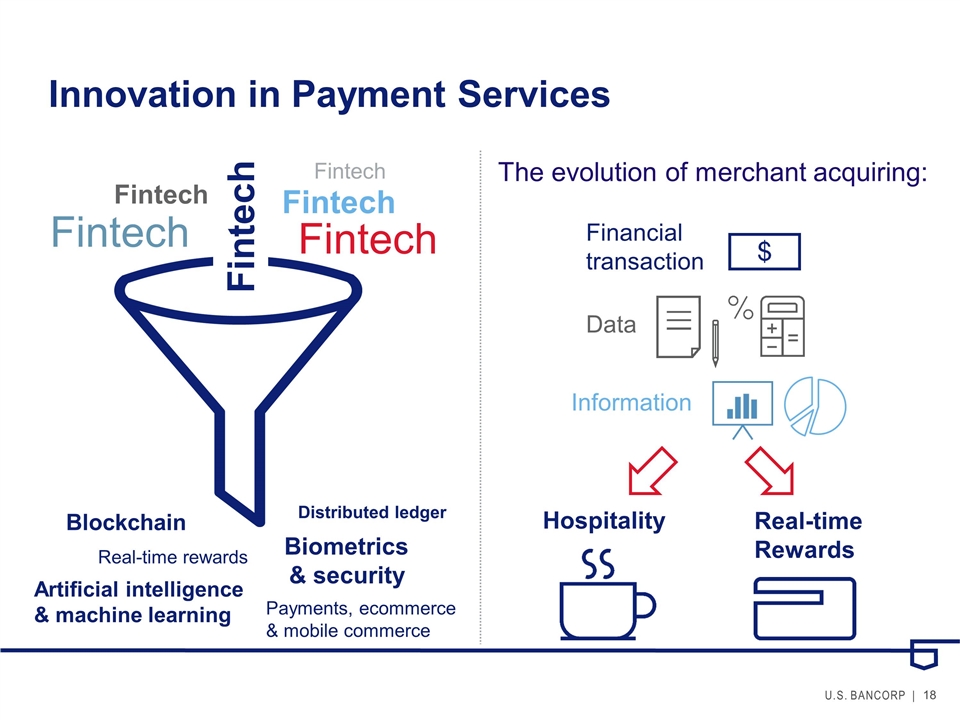
Innovation in Payment Services Fintech Fintech Fintech Fintech Fintech Fintech Biometrics & security Blockchain Real-time rewards Artificial intelligence & machine learning Distributed ledger Payments, ecommerce & mobile commerce Financial transaction Data Information The evolution of merchant acquiring: Hospitality Real-time Rewards
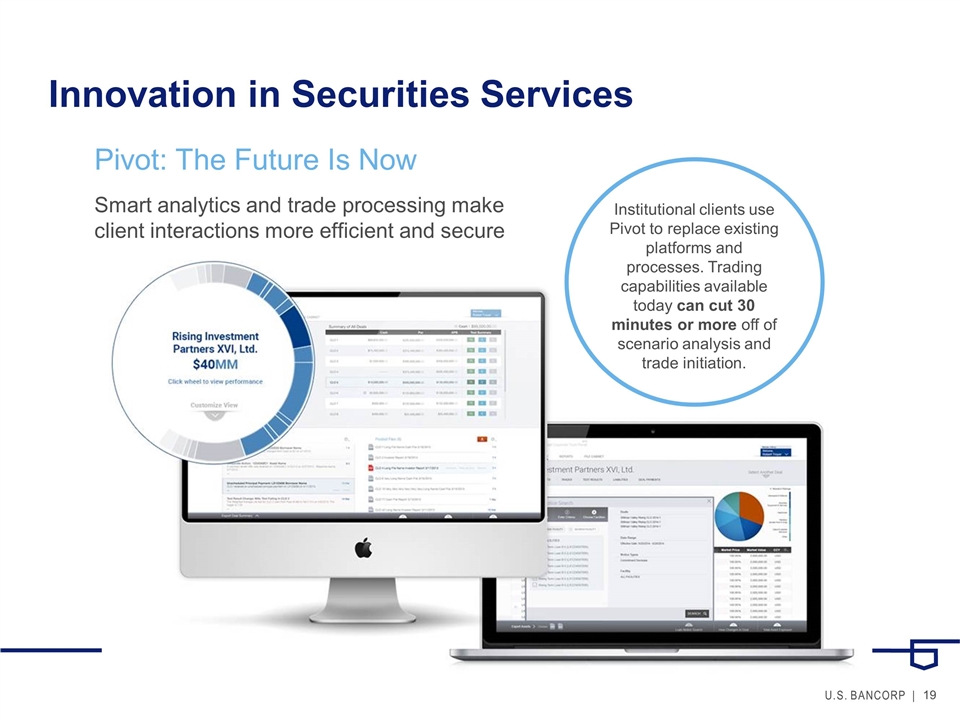
Innovation in Securities Services Smart analytics and trade processing make client interactions more efficient and secure Pivot: The Future Is Now CLIENTS Institutional clients use Pivot to replace existing platforms and processes. Trading capabilities available today can cut 30 minutes or more off of scenario analysis and trade initiation.
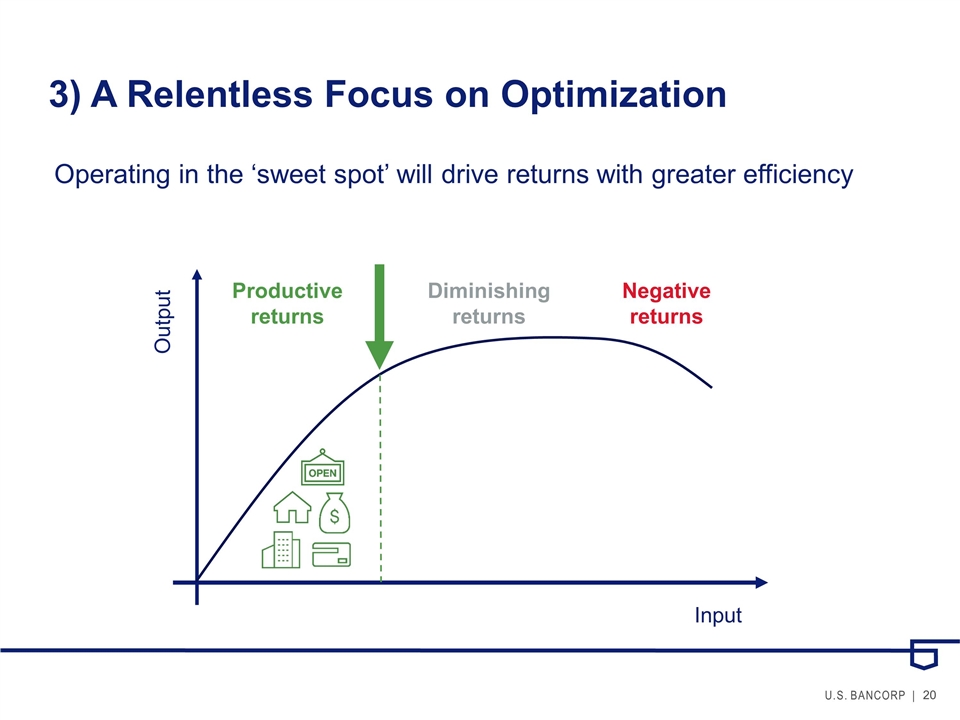
3) A Relentless Focus on Optimization Operating in the ‘sweet spot’ will drive returns with greater efficiency Input Output Productive returns Diminishing returns Negative returns
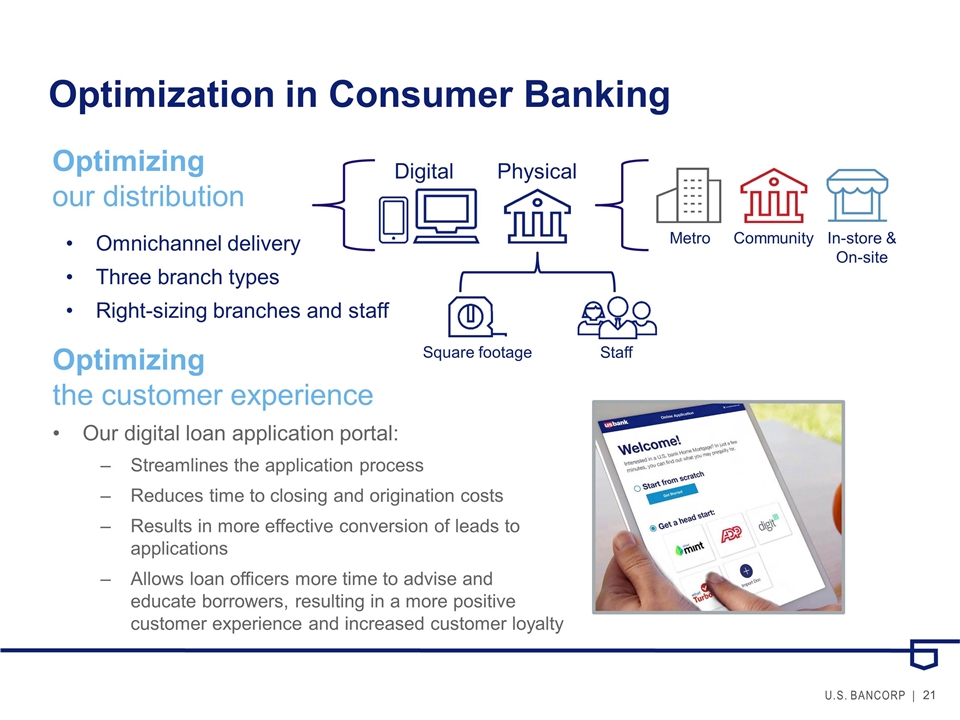
Optimization in Consumer Banking Metro Community In-store & On-site Omnichannel delivery Three branch types Right-sizing branches and staff Optimizing the customer experience Our digital loan application portal: Streamlines the application process Reduces time to closing and origination costs Results in more effective conversion of leads to applications Allows loan officers more time to advise and educate borrowers, resulting in a more positive customer experience and increased customer loyalty Digital Physical Staff Square footage Optimizing our distribution
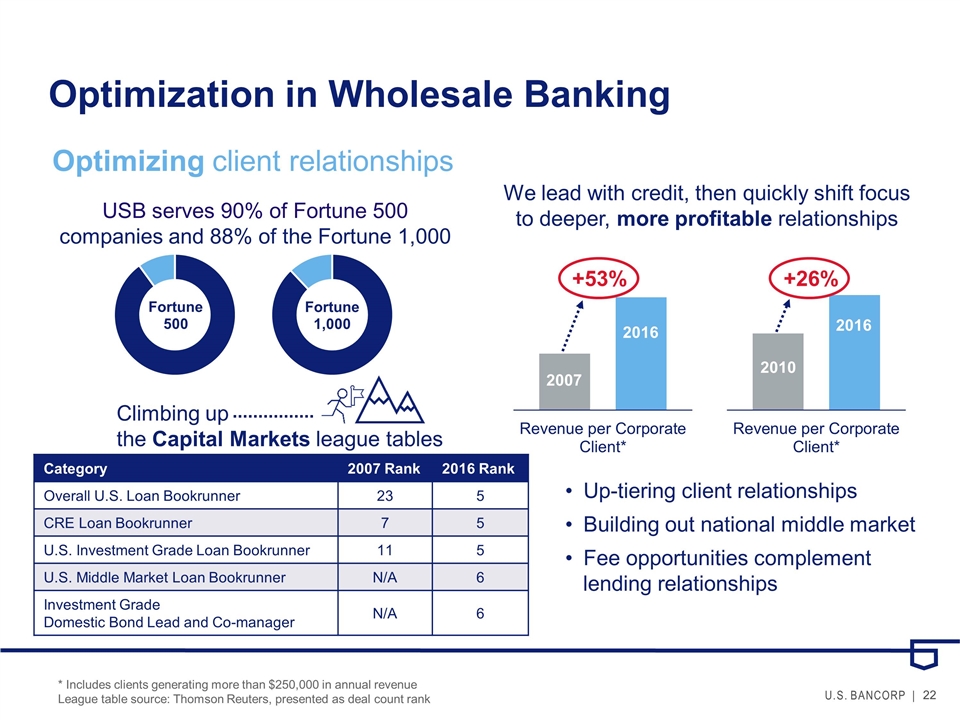
Optimization in Wholesale Banking Up-tiering client relationships Building out national middle market Fee opportunities complement lending relationships USB serves 90% of Fortune 500 companies and 88% of the Fortune 1,000 We lead with credit, then quickly shift focus to deeper, more profitable relationships * Includes clients generating more than $250,000 in annual revenue League table source: Thomson Reuters, presented as deal count rank Category 2007 Rank 2016 Rank Overall U.S. Loan Bookrunner 23 5 CRE Loan Bookrunner 7 5 U.S. Investment Grade Loan Bookrunner 11 5 U.S. Middle Market Loan Bookrunner N/A 6 Investment Grade Domestic Bond Lead and Co-manager N/A 6 Climbing up the Capital Markets league tables 2007 2016 2016 2010 +53% +26% Optimizing client relationships
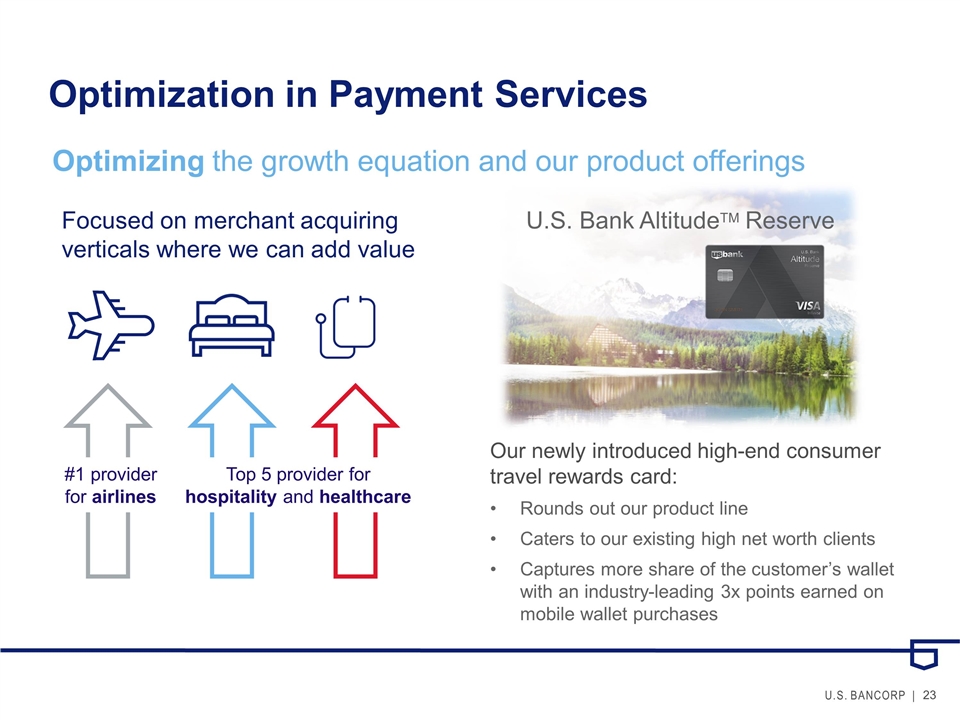
Optimization in Payment Services Focused on merchant acquiring verticals where we can add value Top 5 provider for hospitality and healthcare #1 provider for airlines Optimizing the growth equation and our product offerings Our newly introduced high-end consumer travel rewards card: Rounds out our product line Caters to our existing high net worth clients Captures more share of the customer’s wallet with an industry-leading 3x points earned on mobile wallet purchases U.S. Bank AltitudeTM Reserve
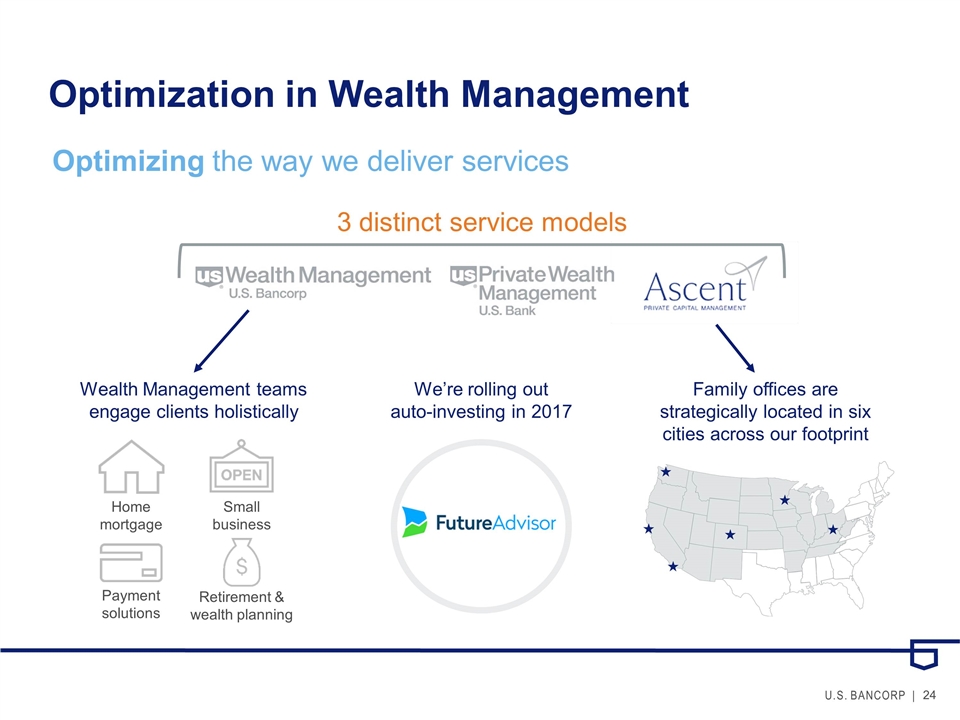
Optimization in Wealth Management Home mortgage Small business Payment solutions Retirement & wealth planning Wealth Management teams engage clients holistically Optimizing the way we deliver services We’re rolling out auto-investing in 2017 3 distinct service models Family offices are strategically located in six cities across our footprint
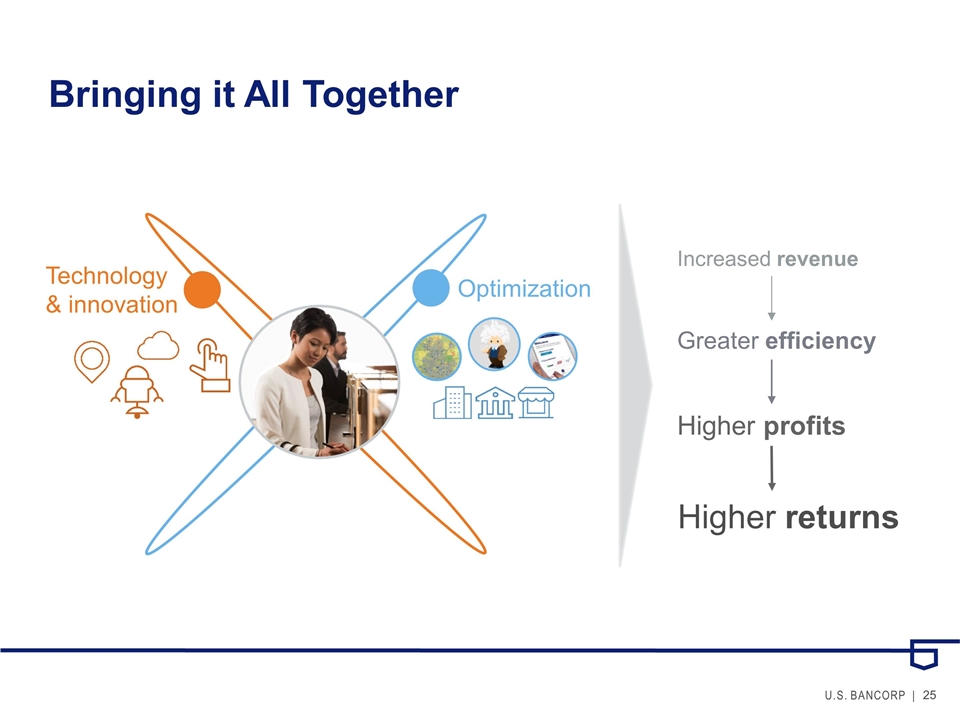
Bringing it All Together Technology & innovation Optimization Increased revenue Greater efficiency Higher profits Higher returns
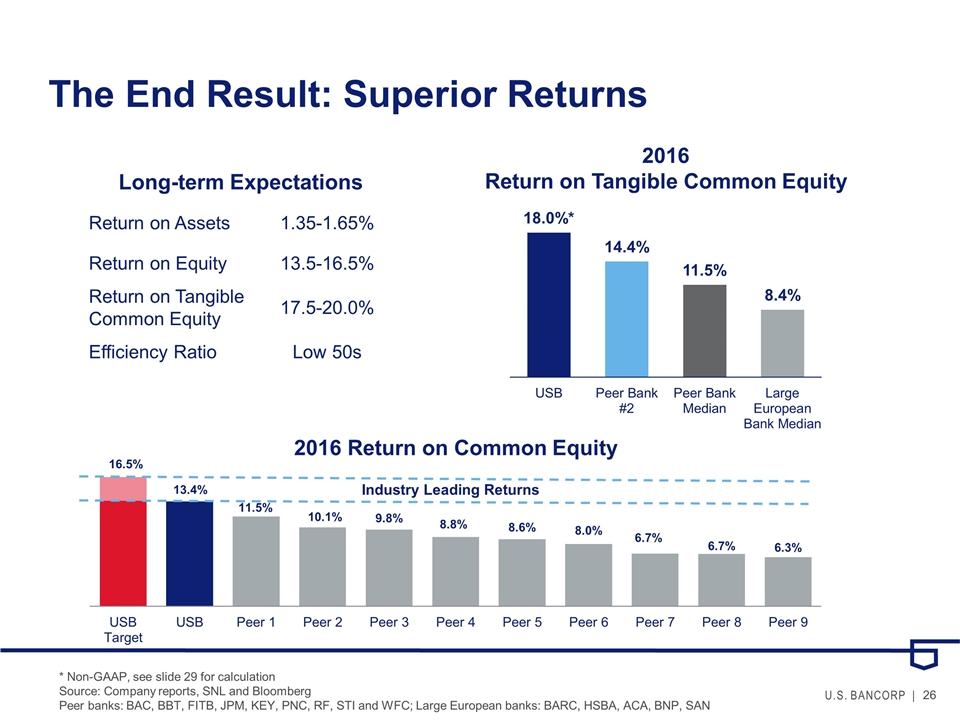
The End Result: Superior Returns * Non-GAAP, see slide 29 for calculation Source: Company reports, SNL and Bloomberg Peer banks: BAC, BBT, FITB, JPM, KEY, PNC, RF, STI and WFC; Large European banks: BARC, HSBA, ACA, BNP, SAN Long-term Expectations Return on Assets 1.35-1.65% Return on Equity 13.5-16.5% Return on Tangible Common Equity 17.5-20.0% Efficiency Ratio Low 50s 2016 Return on Tangible Common Equity 2016 Return on Common Equity
Third Quarter Update Loan growth Net interest margin Fee revenue Operating leverage Tax rate
Appendix
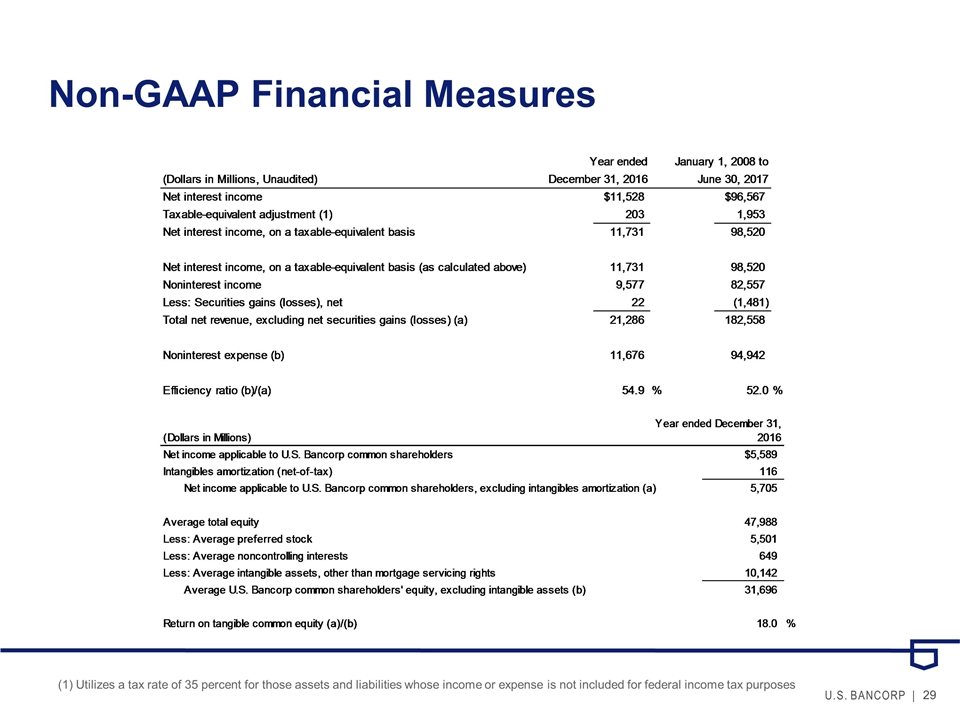
Non-GAAP Financial Measures (1) Utilizes a tax rate of 35 percent for those assets and liabilities whose income or expense is not included for federal income tax purposes
