Attached files
| file | filename |
|---|---|
| 8-K - 8-K - TPG RE Finance Trust, Inc. | d457421d8k.htm |
Exhibit 99.1
|
Bank of America Merrill Lynch 2017 Global Real Estate Conference September 13, 2017
|
Forward Looking Statements This presentation contains certain forward-looking statements, including, without limitation, statements concerning our operations, economic performance and financial condition. These forward-looking statements are made pursuant to the safe harbor provisions of the Private Securities Litigation Reform Act of 1995. Forward-looking statements are developed by combining currently available information with our beliefs and assumptions and are generally identified by the words “believe,” “expect,” “anticipate” and other similar expressions. Forward-looking statements do not guarantee future performance, which may be materially different from that expressed in, or implied by, any such statements. Readers are cautioned not to place undue reliance on these forward-looking statements, which speak only as of their respective dates. These forward-looking statements are based largely on our current beliefs, assumptions and expectations of our future performance taking into account all information currently available to us. These beliefs, assumptions and expectations can change as a result of many possible events or factors, not all of which are known to us or within our control, and which could materially affect actual results, performance or achievements. Factors that may cause actual results to vary from our forward-looking statements include, but are not limited to: factors described in our prospectus, dated July 19, 2017 and filed with the SEC on July 21, 2017, including those set forth under the captions “Risk Factors”; defaults by borrowers in paying debt service on outstanding indebtedness; impairment in the value of real estate property securing our loans or in which we invest; availability of mortgage origination and acquisition opportunities acceptable to us; potential mismatches in the timing of asset repayments and the maturity of the associated financing agreements; national and local economic and business conditions; general and local commercial and residential real estate property conditions; changes in federal government policies and in federal, state and local governmental laws and regulations; increased competition from entities engaged in mortgage lending and securities investing activities; changes in interest rates; and the availability of, and costs associated with, sources of liquidity. Additional risk factors are identified in our filings with the SEC, which are available on our website https://www.tpgrefinance.com/ and the SEC’s website at http://www.sec.gov. If a change occurs, our business, financial condition, liquidity and results of operations may vary materially from those expressed in our forward-looking statements. As a result, our business, financial condition, liquidity and results of operations may vary materially from those expressed in our forward-looking statements. We undertake no obligation to update or revise any forward-looking statements, whether as a result of new information, future events or otherwise. In light of these risks, uncertainties and assumptions, the events described by our forward-looking statements might not occur. We qualify any and all of our forward-looking statements by these cautionary factors. Please keep this cautionary note in mind as you assess the information given in this presentation. 2
|
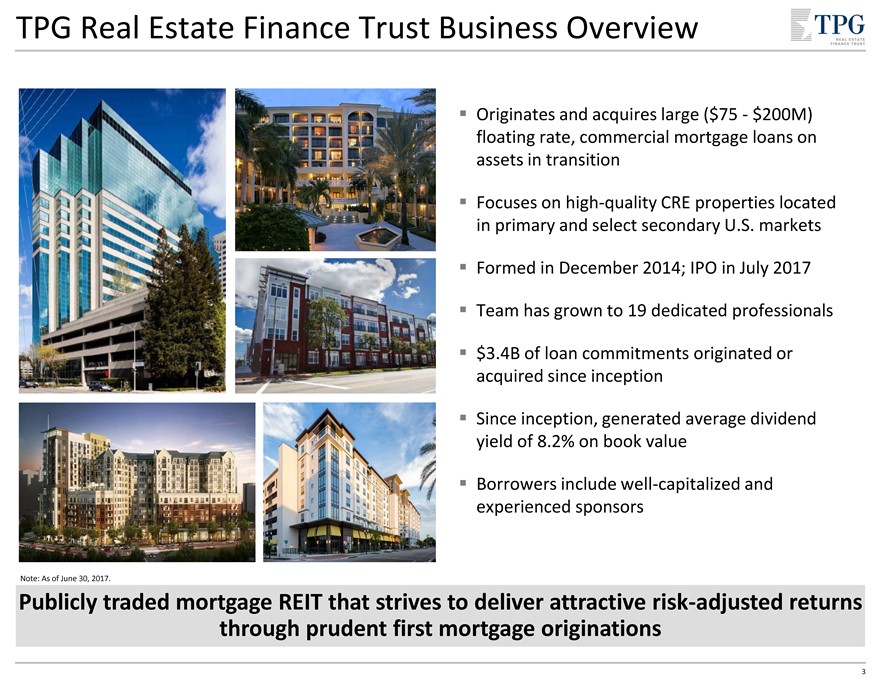
TPG Real Estate Finance Trust Business Overview Originates and acquires large ($75—$200M) floating rate, commercial mortgage loans on assets in transition Focuses on high-quality CRE properties located in primary and select secondary U.S. markets Formed in December 2014; IPO in July 2017 Team has grown to 19 dedicated professionals $3.4B of loan commitments originated or acquired since inception Since inception, generated average dividend yield of 8.2% on book value Borrowers include well-capitalized and experienced sponsors Note: As of June 30, 2017. Publicly traded mortgage REIT that strives to deliver attractive risk-adjusted returns through prudent first mortgage originations 3
|
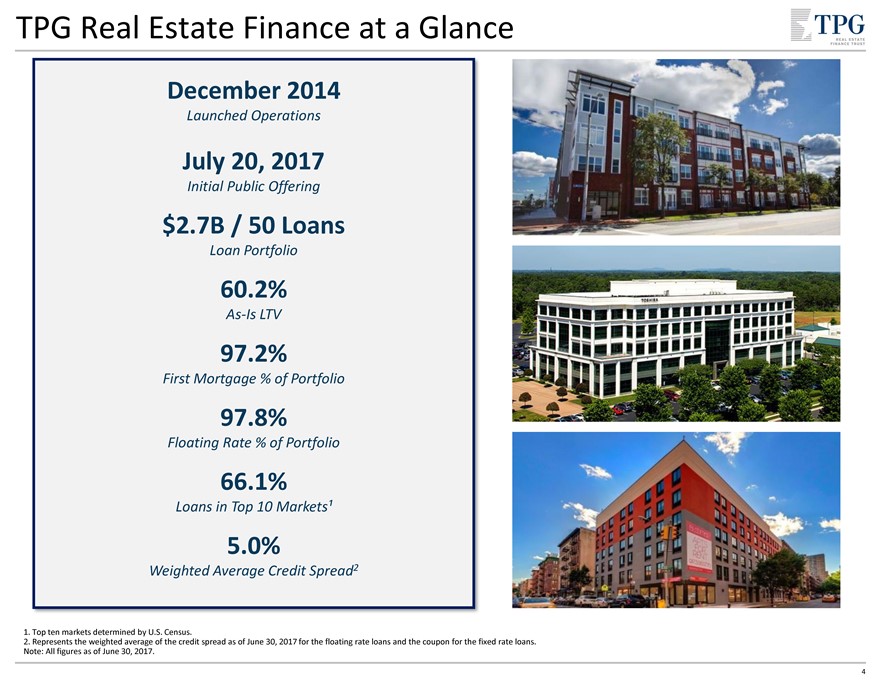
TPG Real Estate Finance at a Glance December 2014 Launched Operations July 20, 2017 Initial Public Offering $2.7B / 50 Loans Loan Portfolio 60.2% As-Is LTV 97.2% First Mortgage % of Portfolio 97.8% Floating Rate % of Portfolio 66.1% Loans in Top 10 Markets¹ 5.0% Weighted Average Credit Spread2 1. Top ten markets determined by U.S. Census. 2. Represents the weighted average of the credit spread as of June 30, 2017 for the floating rate loans and the coupon for the fixed rate loans. Note: All figures as of June 30, 2017. 4
|
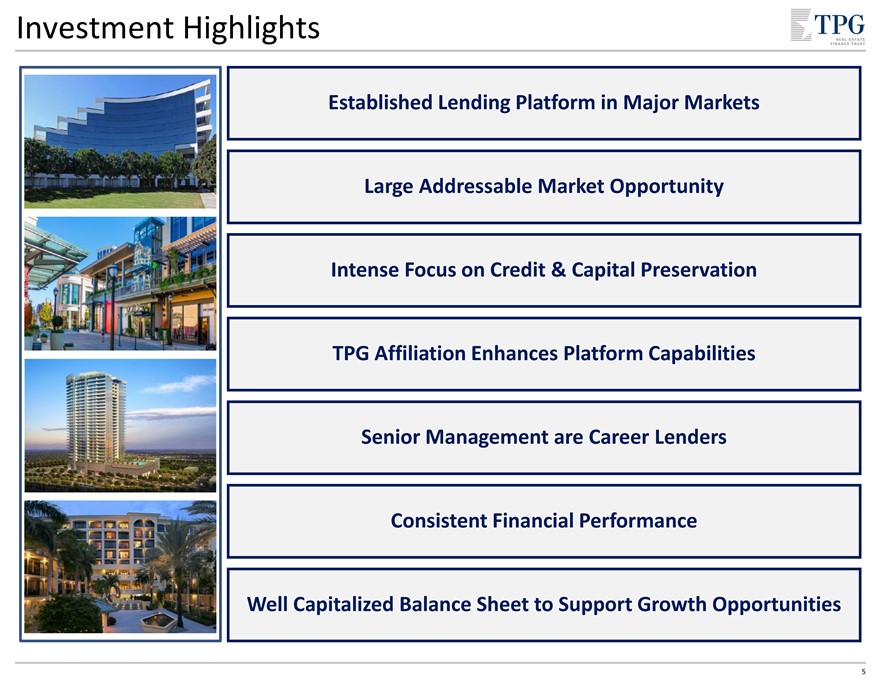
Investment Highlights Established Lending Platform in Major Markets Large Addressable Market Opportunity Intense Focus on Credit & Capital Preservation TPG Affiliation Enhances Platform Capabilities Senior Management are Career Lenders Consistent Financial Performance Well Capitalized Balance Sheet to Support Growth Opportunities 5
|
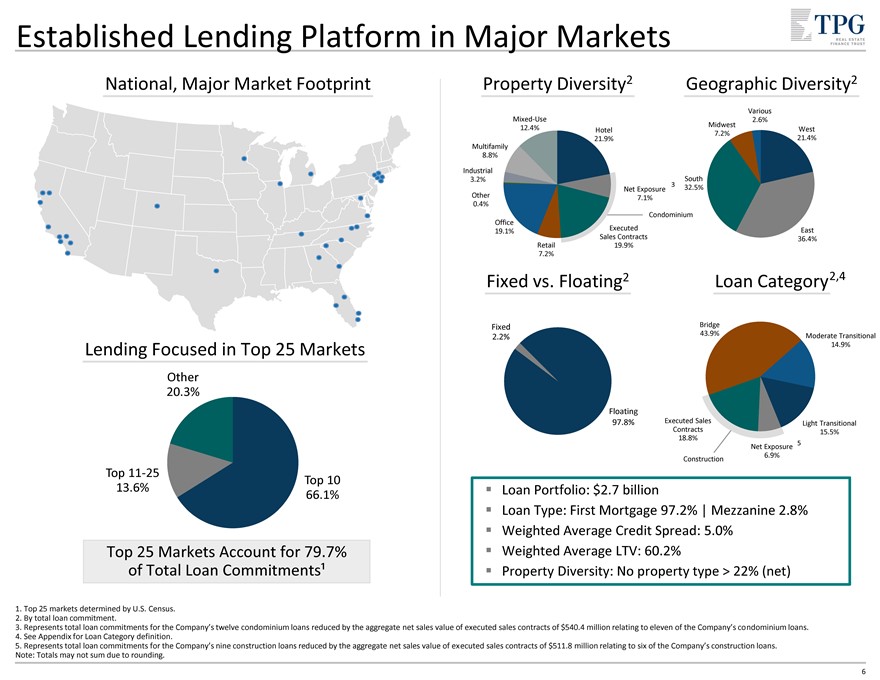
Established Lending Platform in Major Markets National, Major Market Footprint Lending Focused in Top 25 Markets Other 20.3% Top 11-25 Top 10 13.6% 66.1% Top 25 Markets Account for 79.7% of Total Loan Commitments¹ Property Diversity2 Geographic Diversity2 Mixed-Use Various Mixed-Use 12.4% Hotel Midwest 2.6% 12.4% Hotel 21.9% 7.2% West 21.9% 21.4% Multifamily 8.8% Multifamily Industrial 8.8% 3.2% Industrial South Land 3.2% 3 32.5% Other Net Exposure 0.4% 7.1% 0.4% Condominium Office Office Executed 19.1% 19.1% Executed Sales Contracts East Sales Contracts 36.4% 19.9% Retail Retail 19.9% 7.2% 7.2% Fixed vs. Floating2 Loan Category2,4 $0 43.9% Fixed Bridge 2.2% 43.9% Moderate Transitional 14.9% $0 14.9% Floating 97.8% Executed Sales Light Transitional Contracts $0 18.8% 15.5% 15.5% 5 Net Exposure 6.9% Construction Loan Portfolio: $2.7 billion Loan Type: First Mortgage 97.2% | Mezzanine 2.8% Weighted Average Credit Spread: 5.0% Weighted Average LTV: 60.2% Property Diversity: No property type > 22% (net) 1. Top 25 markets determined by U.S. Census. 2. By total loan commitment. 3. Represents total loan commitments for the Company’s twelve condominium loans reduced by the aggregate net sales value of executed sales contracts of $540.4 million relating to eleven of the Company’s condominium loans. 4. See Appendix for Loan Category definition. 5. Represents total loan commitments for the Company’s nine construction loans reduced by the aggregate net sales value of executed sales contracts of $511.8 million relating to six of the Company’s construction loans. Note: Totals may not sum due to rounding. 6
|
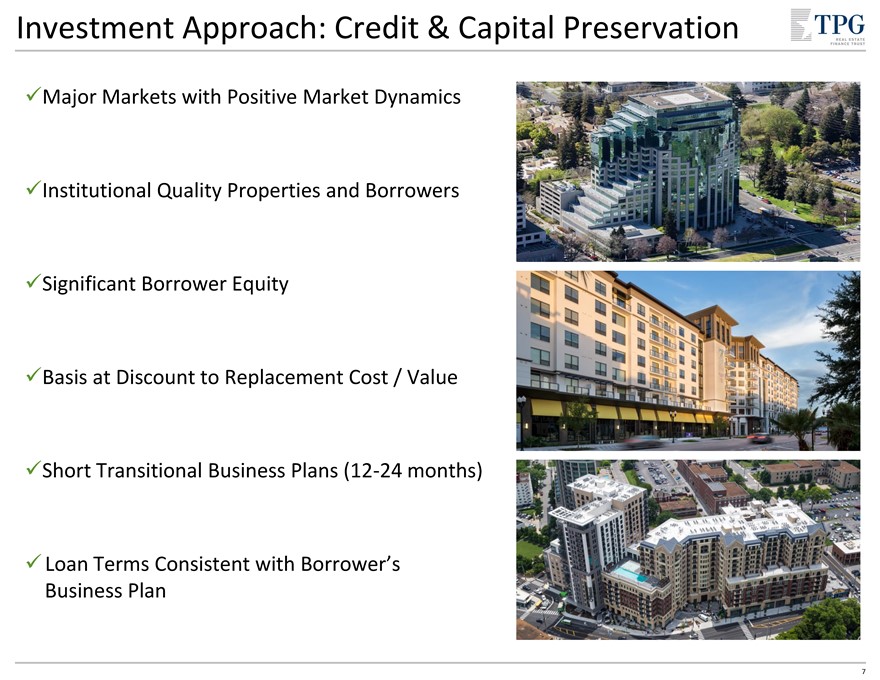
Investment Approach: Credit & Capital Preservation Major Markets with Positive Market Dynamics Institutional Quality Properties and Borrowers Significant Borrower Equity Basis at Discount to Replacement Cost / Value Short Transitional Business Plans (12-24 months) Loan Terms Consistent with Borrower’s Business Plan 7
|
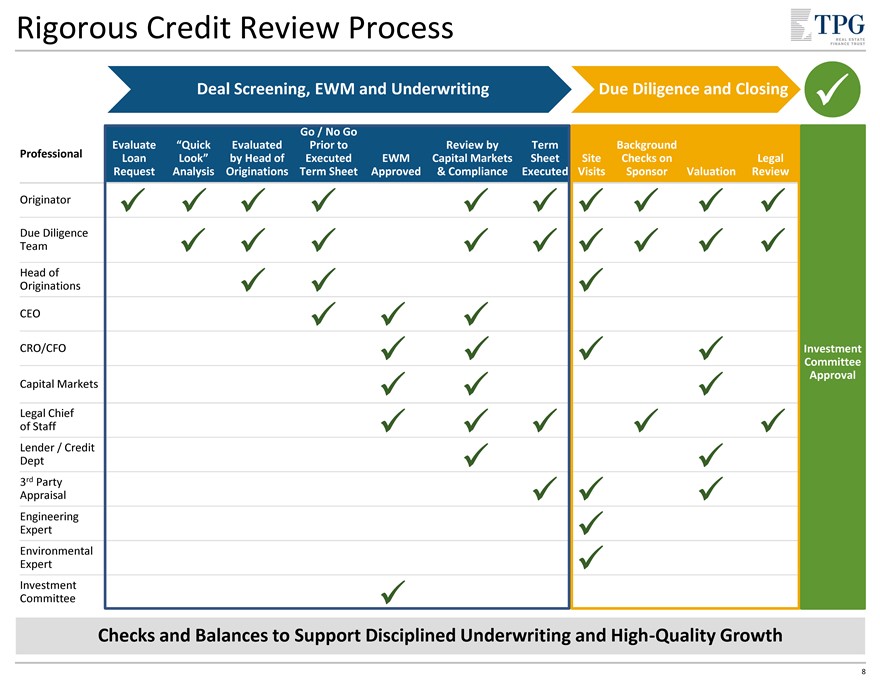
Rigorous Credit Review Process Deal Screening, EWM and Underwriting Due Diligence and Closing Go / No Go Evaluate “Quick EvaluatedPrior toReview byTermBackground Professional Loan Look”by Head ofExecutedEWMCapital MarketsSheetSiteChecks onLegal Request Analysis OriginationsTerm SheetApproved& ComplianceExecutedVisitsSponsorValuationReview Originator Due Diligence Team Head of Originations CEO CRO/CFO Investment Committee Approval Capital Markets Legal Chief of Staff Lender / Credit Dept 3rd Party Appraisal Engineering Expert Environmental Expert Investment Committee Checks and Balances to Support Disciplined Underwriting and High-Quality Growth 8
|
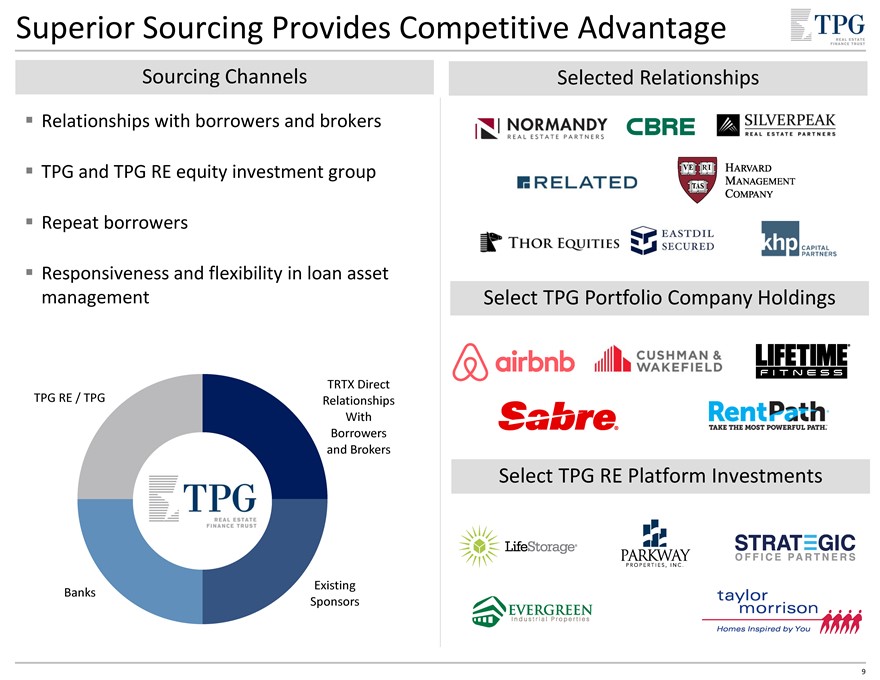
Superior Sourcing Provides Competitive Advantage Sourcing Channels Relationships with borrowers and brokers TPG and TPG RE equity investment group Repeat borrowers Responsiveness and flexibility in loan asset management TRTX Direct TPG RE / TPG Relationships With Borrowers and Brokers Existing Banks Sponsors Selected Relationships Select TPG Portfolio Company Holdings Select TPG RE Platform Investments 9
|
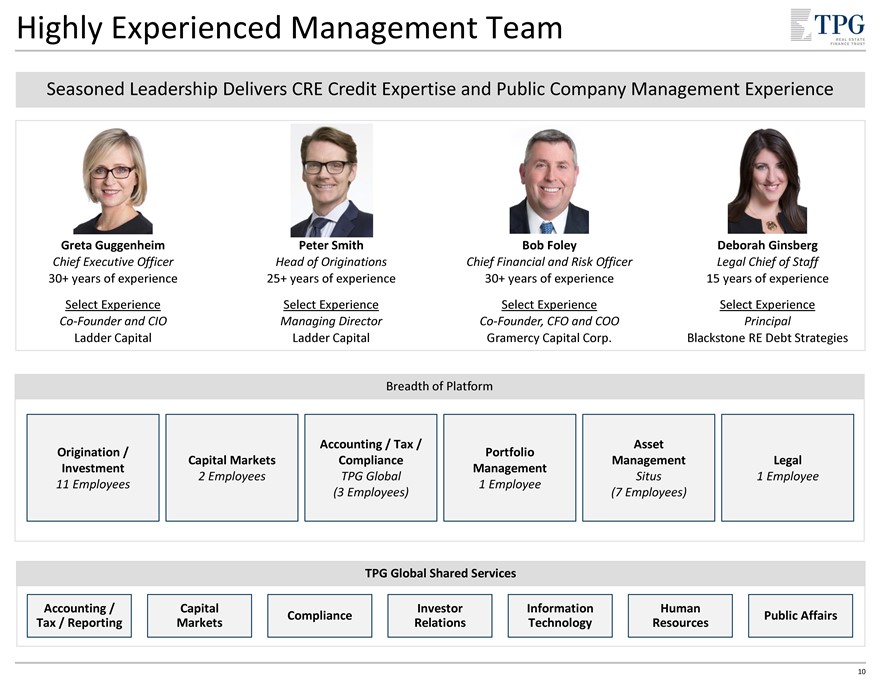
Highly Experienced Management Team Seasoned Leadership Delivers CRE Credit Expertise and Public Company Management Experience Greta Guggenheim Chief Executive Officer 30+ years of experience Select Experience Co-Founder and CIO Ladder Capital Peter Smith Head of Originations 25+ years of experience Select Experience Managing Director Ladder Capital Bob Foley Chief Financial and Risk Officer 30+ years of experience Select Experience Co-Founder, CFO and COO Gramercy Capital Corp. Deborah Ginsberg Legal Chief of Staff 15 years of experience Select Experience Principal Blackstone RE Debt Strategies Breadth of Platform Origination / Investment 11 Employees Capital Markets 2 Employees Accounting / Tax / Compliance TPG Global (3 Employees) Portfolio Management 1 Employee Asset Management Situs (7 Employees) Legal 1 Employee TPG Global Shared Services Accounting / Tax / Reporting Capital Markets Compliance Investor Relations Information Technology Human Resources Public Affairs 10
|
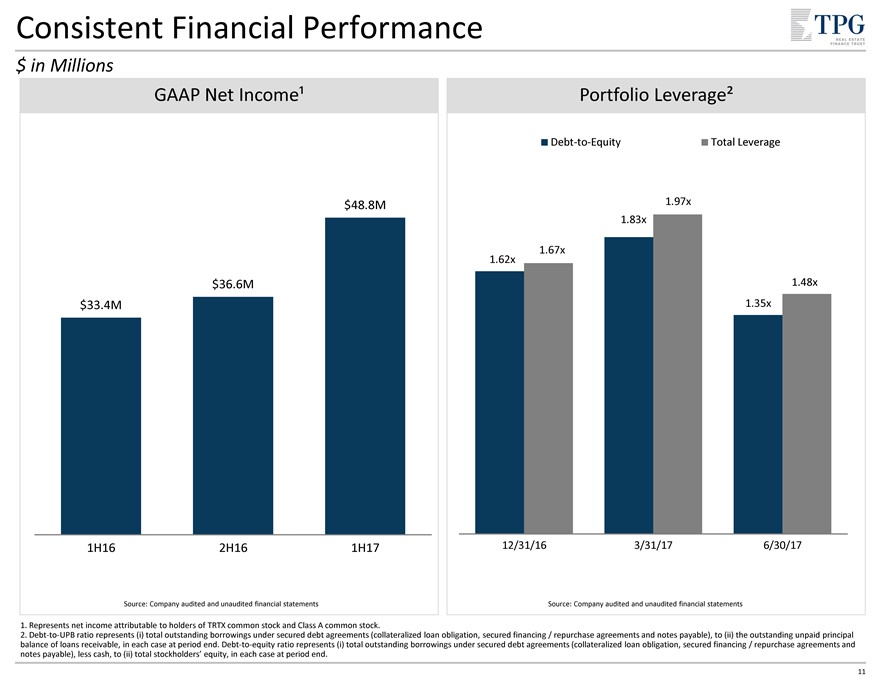
Consistent Financial Performance $ in Millions GAAP Net Income¹ $48.8M $36.6M $33.4M 1H16 2H16 1H17 Source: Company audited and unaudited financial statements Portfolio Leverage² Debt-to-Equity Total Leverage 1.97x 1.83x 1.67x 1.62x 1.48x 1.35x 12/31/16 3/31/17 6/30/17 Source: Company audited and unaudited financial statements 1. Represents net income attributable to holders of TRTX common stock and Class A common stock. 2. Debt-to-UPB ratio represents (i) total outstanding borrowings under secured debt agreements (collateralized loan obligation, secured financing / repurchase agreements and notes payable), to (ii) the outstanding unpaid principal balance of loans receivable, in each case at period end. Debt-to-equity ratio represents (i) total outstanding borrowings under secured debt agreements (collateralized loan obligation, secured financing / repurchase agreements and notes payable), less cash, to (ii) total stockholders’ equity, in each case at period end. 11
|
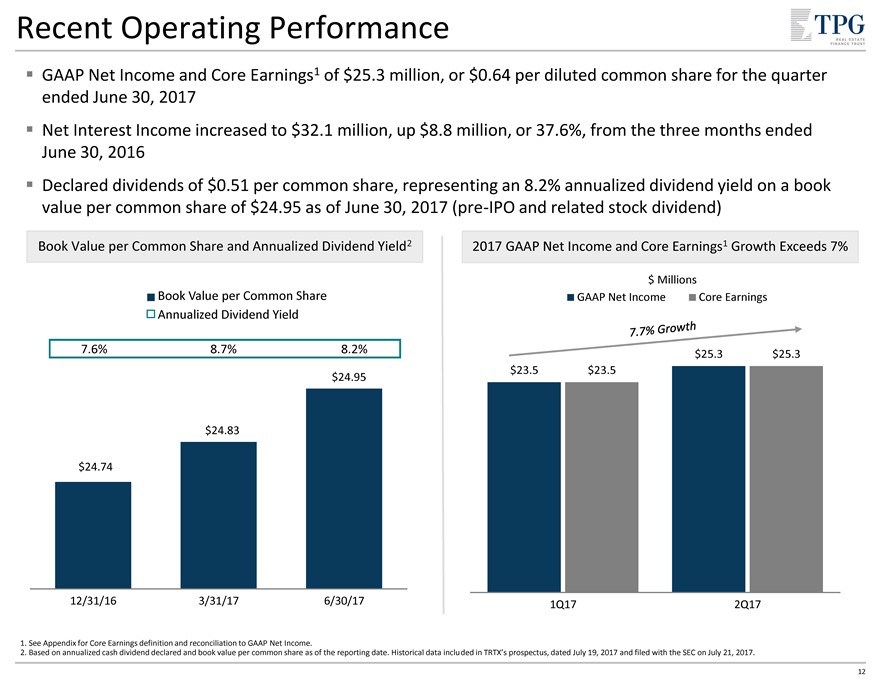
Recent Operating Performance GAAP Net Income and Core Earnings1 of $25.3 million, or $0.64 per diluted common share for the quarter ended June 30, 2017 Net Interest Income increased to $32.1 million, up $8.8 million, or 37.6%, from the three months ended June 30, 2016 Declared dividends of $0.51 per common share, representing an 8.2% annualized dividend yield on a book value per common share of $24.95 as of June 30, 2017 (pre-IPO and related stock dividend) Book Value per Common Share and Annualized Dividend Yield2 Book Value per Common Share Annualized Dividend Yield 7.6% 8.7% 8.2% $24.95 $24.83 $24.74 12/31/16 3/31/17 6/30/17 2017 GAAP Net Income and Core Earnings1 Growth Exceeds 7% $ Millions GAAP Net Income Core Earnings $25.3 $25.3 $23.5 $23.5 1Q17 2Q17 1. See Appendix for Core Earnings definition and reconciliation to GAAP Net Income. 2. Based on annualized cash dividend declared and book value per common share as of the reporting date. Historical data included in TRTX’s prospectus, dated July 19, 2017 and filed with the SEC on July 21, 2017. 12
|
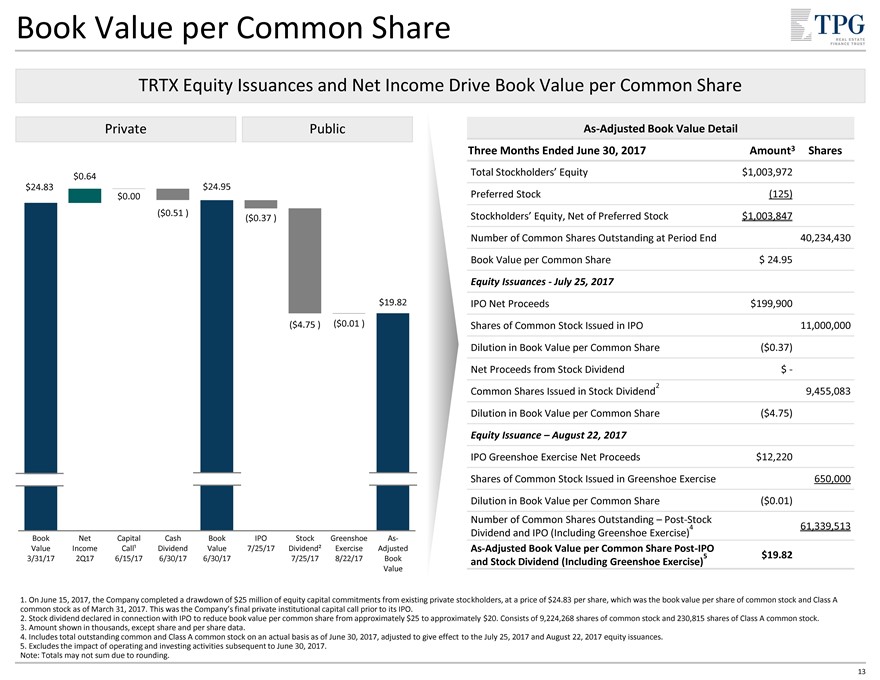
Book Value per Common Share TRTX Equity Issuances and Net Income Drive Book Value per Common Share Private Public $0.64 $24.83 $24.95 $0.00 ($0.51 ) ($0.37 ) $19.82 ($4.75 ) ($0.01 ) Book Net Capital Cash Book IPO Stock Greenshoe As-Value Income Call¹ Dividend Value 7/25/17 Dividend² Exercise Adjusted 3/31/17 2Q17 6/15/17 6/30/17 6/30/17 7/25/17 8/22/17 Book Value As-Adjusted Book Value Detail Three Months Ended June 30, 2017 Amount3 Shares Total Stockholders’ Equity $1,003,972 Preferred Stock (125) Stockholders’ Equity, Net of Preferred Stock $1,003,847 Number of Common Shares Outstanding at Period End 40,234,430 Book Value per Common Share $ 24.95 Equity Issuances—July 25, 2017 IPO Net Proceeds $199,900 Shares of Common Stock Issued in IPO 11,000,000 Dilution in Book Value per Common Share ($0.37) Net Proceeds from Stock Dividend $ - 2 Common Shares Issued in Stock Dividend 9,455,083 Dilution in Book Value per Common Share ($4.75) Equity Issuance – August 22, 2017 IPO Greenshoe Exercise Net Proceeds $12,220 Shares of Common Stock Issued in Greenshoe Exercise 650,000 Dilution in Book Value per Common Share ($0.01) Number of Common Shares Outstanding – Post-Stock 4 61,339,513 Dividend and IPO (Including Greenshoe Exercise) As-Adjusted Book Value per Common Share Post-IPO 5 $19.82 and Stock Dividend (Including Greenshoe Exercise) 1. On June 15, 2017, the Company completed a drawdown of $25 million of equity capital commitments from existing private stockholders, at a price of $24.83 per share, which was the book value per share of common stock and Class A common stock as of March 31, 2017. This was the Company’s final private institutional capital call prior to its IPO. 2. Stock dividend declared in connection with IPO to reduce book value per common share from approximately $25 to approximately $20. Consists of 9,224,268 shares of common stock and 230,815 shares of Class A common stock. 3. Amount shown in thousands, except share and per share data. 4. Includes total outstanding common and Class A common stock on an actual basis as of June 30, 2017, adjusted to give effect to the July 25, 2017 and August 22, 2017 equity issuances. 5. Excludes the impact of operating and investing activities subsequent to June 30, 2017. Note: Totals may not sum due to rounding. 13
|
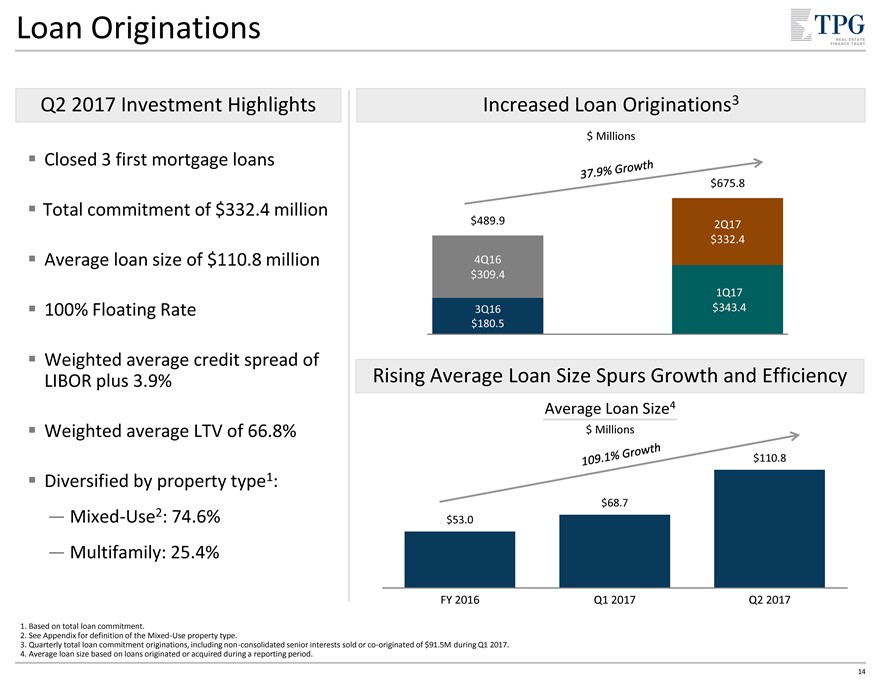
Loan Originations Q2 2017 Investment Highlights Closed 3 first mortgage loans Total commitment of $332.4 million Average loan size of $110.8 million 100% Floating Rate Weighted average credit spread of LIBOR plus 3.9% Weighted average LTV of 66.8% Diversified by property type1: Mixed-Use2: 74.6% Multifamily: 25.4% Increased Loan Originations3 $ Millions $675.8 $489.9 2Q17 $332.4 4Q16 $309.4 1Q17 3Q16 $343.4 $180.5 Rising Average Loan Size Spurs Growth and Efficiency Average Loan Size4 $ Millions $110.8 $68.7 $53.0 FY 2016 Q1 2017 Q2 2017 1. Based on total loan commitment. 2. See Appendix for definition of the Mixed-Use property type. 3. Quarterly total loan commitment originations, including non-consolidated senior interests sold or co-originated of $91.5M during Q1 2017. 4. Average loan size based on loans originated or acquired during a reporting period. 14
|
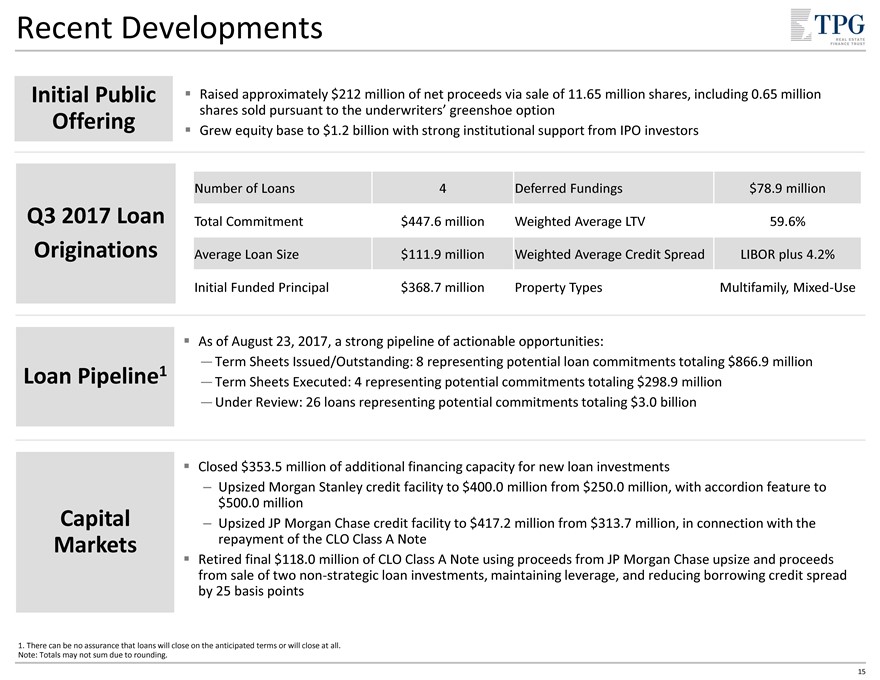
Recent Developments Initial Public Offering Raised approximately $212 million of net proceeds via sale of 11.65 million shares, including 0.65 million shares sold pursuant to the underwriters’ greenshoe option Grew equity base to $1.2 billion with strong institutional support from IPO investors Q3 2017 Loan Originations Number of Loans 4 Deferred Fundings $78.9 million Total Commitment $447.6 million Weighted Average LTV 59.6% Average Loan Size $111.9 million Weighted Average Credit Spread LIBOR plus 4.2% Initial Funded Principal $368.7 million Property Types Multifamily, Mixed-Use Loan Pipeline1 As of August 23, 2017, a strong pipeline of actionable opportunities: Term Sheets Issued/Outstanding: 8 representing potential loan commitments totaling $866.9 million Term Sheets Executed: 4 representing potential commitments totaling $298.9 million Under Review: 26 loans representing potential commitments totaling $3.0 billion Closed $353.5 million of additional financing capacity for new loan investments Upsized Morgan Stanley credit facility to $400.0 million from $250.0 million, with accordion feature to $500.0 million Upsized JP Morgan Chase credit facility to $417.2 million from $313.7 million, in connection with the repayment of the CLO Class A Note Retired final $118.0 million of CLO Class A Note using proceeds from JP Morgan Chase upsize and proceeds from sale of two non-strategic loan investments, maintaining leverage, and reducing borrowing credit spread by 25 basis points Capital Markets 1. There can be no assurance that loans will close on the anticipated terms or will close at all. Note: Totals may not sum due to rounding. 15
|
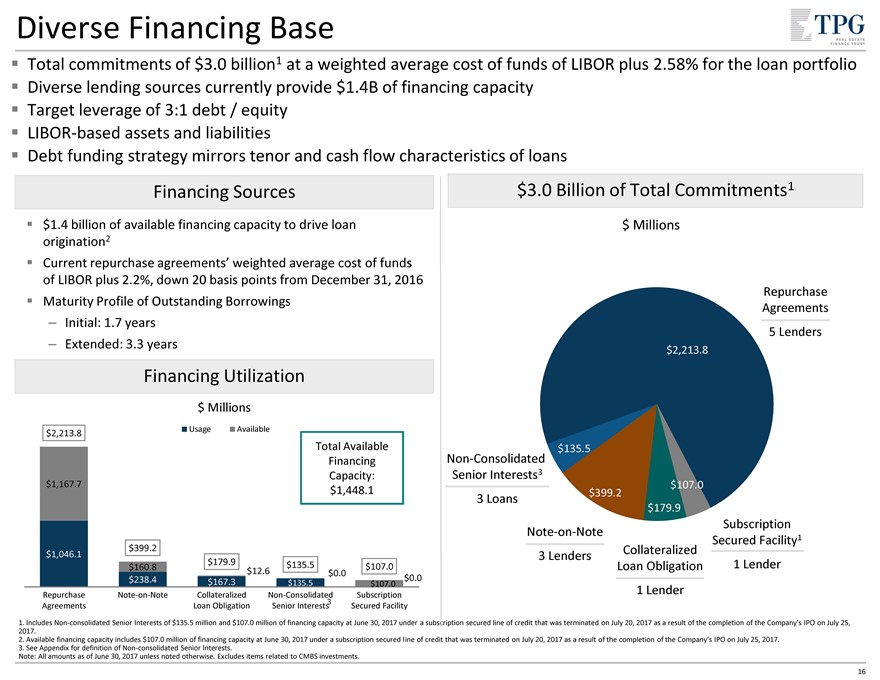
Diverse Financing Base Total commitments of $3.0 billion1 at a weighted average cost of funds of LIBOR plus 2.58% for the loan portfolio Diverse lending sources currently provide $1.4B of financing capacity Target leverage of 3:1 debt / equity LIBOR-based assets and liabilities Debt funding strategy mirrors tenor and cash flow characteristics of loans Financing Sources $1.4 billion of available financing capacity to drive loan origination2 Current repurchase agreements’ weighted average cost of funds of LIBOR plus 2.2%, down 20 basis points from December 31, 2016 Maturity Profile of Outstanding Borrowings Initial: 1.7 years Extended: 3.3 years Financing Utilization $ Millions Usage Available $2,213.8 Total Available Financing $1,167.7 Capacity: $1,448.1 $399.2 $1,046.1 $179.9 $160.8 $135.5 $107.0 $12.6 $0.0 $0.0 $238.4 $167.3 $135.5 $107.0 Repurchase Note-on-Note Collateralized Non-Consolidated 3 Subscription Agreements Loan Obligation Senior Interests Secured Facility $3.0 Billion of Total Commitments1 $ Millions Repurchase Agreements 5 Lenders $2,213.8 Non-Consolidated $135.5 Senior Interests3 $107.0 $399.2 3 Loans $179.9 Subscription Note-on-Note Secured Facility1 Collateralized 3 Lenders Loan Obligation 1 Lender 1 Lender 1. Includes Non-consolidated Senior Interests of $135.5 million and $107.0 million of financing capacity at June 30, 2017 under a subscription secured line of credit that was terminated on July 20, 2017 as a result of the completion of the Company’s IPO on July 25, 2017. 2. Available financing capacity includes $107.0 million of financing capacity at June 30, 2017 under a subscription secured line of credit that was terminated on July 20, 2017 as a result of the completion of the Company’s IPO on July 25, 2017. 3. See Appendix for definition of Non-consolidated Senior Interests. Note: All amounts as of June 30, 2017 unless noted otherwise. Excludes items related to CMBS investments. 16
|
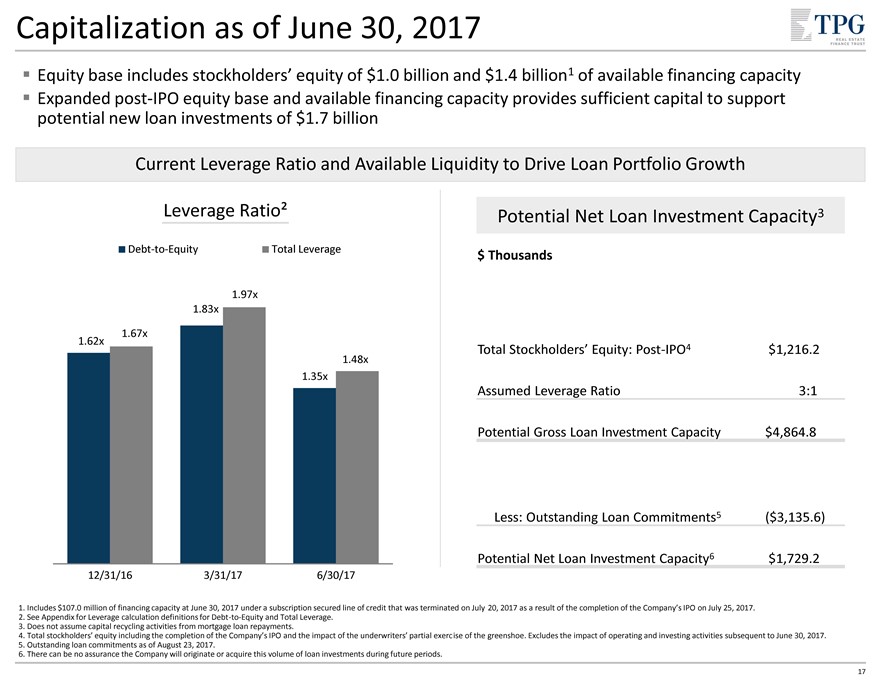
Capitalization as of June 30, 2017 Equity base includes stockholders’ equity of $1.0 billion and $1.4 billion1 of available financing capacity Expanded post-IPO equity base and available financing capacity provides sufficient capital to support potential new loan investments of $1.7 billion Current Leverage Ratio and Available Liquidity to Drive Loan Portfolio Growth Leverage Ratio² Debt-to-Equity Total Leverage Potential Net Loan Investment Capacity3 $ Thousands Total Stockholders’ Equity: Post-IPO4 $1,216.2 Assumed Leverage Ratio 3:1 Potential Gross Loan Investment Capacity $4,864.8 Less: Outstanding Loan Commitments5 ($3,135.6) Potential Net Loan Investment Capacity6 $1,729.2 1.97x 1.83x 1.67x 1.62x 1.48x 1.35x 12/31/16 3/31/17 6/30/17 1. Includes $107.0 million of financing capacity at June 30, 2017 under a subscription secured line of credit that was terminated on July 20, 2017 as a result of the completion of the Company’s IPO on July 25, 2017. 2. See Appendix for Leverage calculation definitions for Debt-to-Equity and Total Leverage. 3. Does not assume capital recycling activities from mortgage loan repayments. 4. Total stockholders’ equity including the completion of the Company’s IPO and the impact of the underwriters’ partial exercise of the greenshoe. Excludes the impact of operating and investing activities subsequent to June 30, 2017. 5. Outstanding loan commitments as of August 23, 2017. 6. There can be no assurance the Company will originate or acquire this volume of loan investments during future periods. 17
|
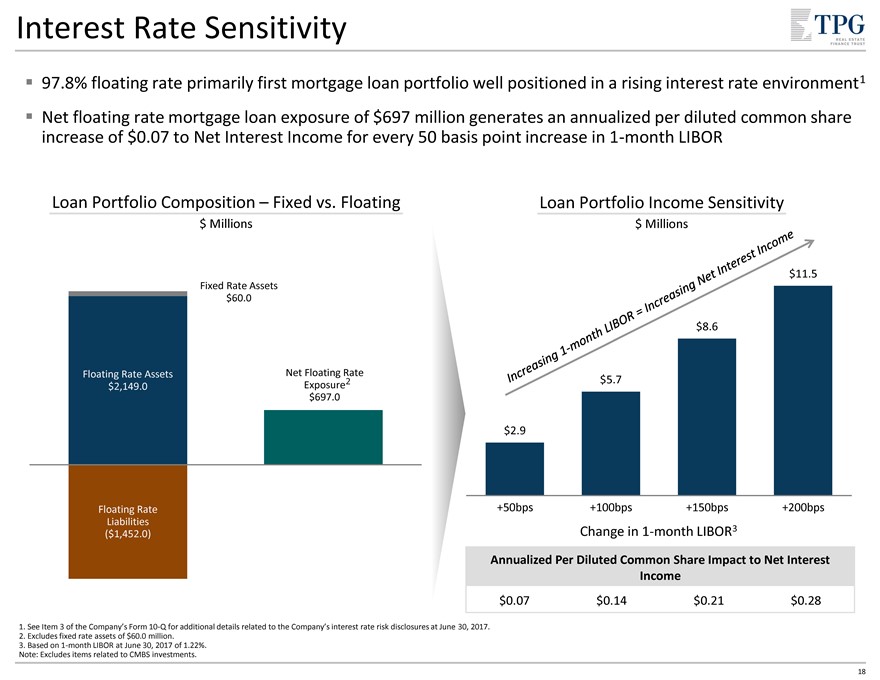
Interest Rate Sensitivity 97.8% floating rate primarily first mortgage loan portfolio well positioned in a rising interest rate environment1 Net floating rate mortgage loan exposure of $697 million generates an annualized per diluted common share increase of $0.07 to Net Interest Income for every 50 basis point increase in 1-month LIBOR Loan Portfolio Composition – Fixed vs. Floating $ Millions Fixed Rate Assets $60.0 Net Floating Rate Exposure2 $697.0 Floating Rate Assets $2,149.0 Floating Rate Liabilities ($1,452.0) Loan Portfolio Income Sensitivity $ Millions $11.5 $8.6 $5.7 $2.9 +50bps +100bps +150bps +200bps Change in 1-month LIBOR3 Annualized Per Diluted Common Share Impact to Net Interest Income $0.07 $0.14 $0.21 $0.28 1. See Item 3 of the Company’s Form 10-Q for additional details related to the Company’s interest rate risk disclosures at June 30, 2017. 2. Excludes fixed rate assets of $60.0 million. 3. Based on 1-month LIBOR at June 30, 2017 of 1.22%. Note: Excludes items related to CMBS investments. 18

|
Appendix
|
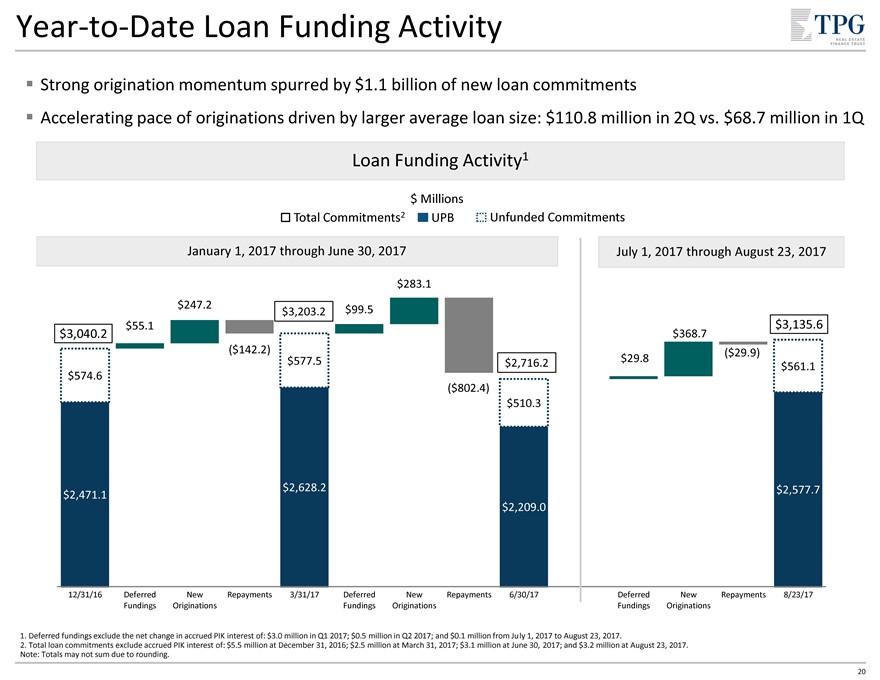
Year-to-Date Loan Funding Activity Strong origination momentum spurred by $1.1 billion of new loan commitments Accelerating pace of originations driven by larger average loan size: $110.8 million in 2Q vs. $68.7 million in 1Q Loan Funding Activity1 $ Millions Total Commitments2 UPB Unfunded Commitments January 1, 2017 through June 30, 2017 July 1, 2017 through August 23, 2017 $283.1 $247.2 $99.5 $3,203.2 $55.1 $368.7 $3,135.6 $3,040.2 ($142.2) ($29.9) $577.5 $29.8 $2,716.2 $561.1 $574.6 ($802.4) $510.3 $2,628.2 $2,577.7 $2,471.1 $2,209.0 12/31/16 Deferred New Repayments 3/31/17 Deferred New Repayments 6/30/17 Deferred New Repayments 8/23/17 Fundings Originations Fundings Originations Fundings Originations 1. Deferred fundings exclude the net change in accrued PIK interest of: $3.0 million in Q1 2017; $0.5 million in Q2 2017; and $0.1 million from July 1, 2017 to August 23, 2017. 2. Total loan commitments exclude accrued PIK interest of: $5.5 million at December 31, 2016; $2.5 million at March 31, 2017; $3.1 million at June 30, 2017; and $3.2 million at August 23, 2017. Note: Totals may not sum due to rounding. 20
|
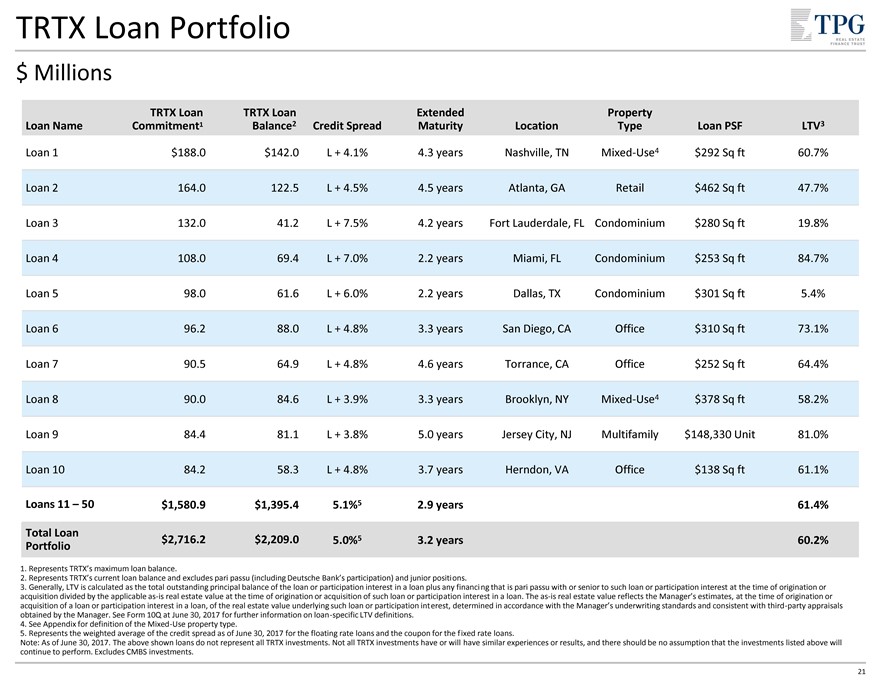
TRTX Loan Portfolio $ Millions TRTX Loan TRTX Loan Extended Property Loan Name Commitment1 Balance2 Credit Spread Maturity Location Type Loan PSF LTV3 Loan 1 $188.0 $142.0 L + 4.1% 4.3 years Nashville, TN Mixed-Use4 $292 Sq ft 60.7% Loan 2 164.0 122.5 L + 4.5% 4.5 years Atlanta, GA Retail $462 Sq ft 47.7% Loan 3 132.0 41.2 L + 7.5% 4.2 years Fort Lauderdale, FL Condominium $280 Sq ft 19.8% Loan 4 108.0 69.4 L + 7.0% 2.2 years Miami, FL Condominium $253 Sq ft 84.7% Loan 5 98.0 61.6 L + 6.0% 2.2 years Dallas, TX Condominium $301 Sq ft 5.4% Loan 6 96.2 88.0 L + 4.8% 3.3 years San Diego, CA Office $310 Sq ft 73.1% Loan 7 90.5 64.9 L + 4.8% 4.6 years Torrance, CA Office $252 Sq ft 64.4% Loan 8 90.0 84.6 L + 3.9% 3.3 years Brooklyn, NY Mixed-Use4 $378 Sq ft 58.2% Loan 9 84.4 81.1 L + 3.8% 5.0 years Jersey City, NJ Multifamily $148,330 Unit 81.0% Loan 10 84.2 58.3 L + 4.8% 3.7 years Herndon, VA Office $138 Sq ft 61.1% Loans 11 – 50 $1,580.9 $1,395.4 5.1%5 2.9 years 61.4% Total Loan Portfolio $2,716.2 $2,209.0 5.0%5 3.2 years 60.2% 1. Represents TRTX’s maximum loan balance. 2. Represents TRTX’s current loan balance and excludes pari passu (including Deutsche Bank’s participation) and junior positions. 3. Generally, LTV is calculated as the total outstanding principal balance of the loan or participation interest in a loan plus any financing that is pari passu with or senior to such loan or participation interest at the time of origination or acquisition divided by the applicable as-is real estate value at the time of origination or acquisition of such loan or participation interest in a loan. The as-is real estate value reflects the Manager’s estimates, at the time of origination or acquisition of a loan or participation interest in a loan, of the real estate value underlying such loan or participation interest, determined in accordance with the Manager’s underwriting standards and consistent with third-party appraisals obtained by the Manager. See Form 10Q at June 30, 2017 for further information on loan-specific LTV definitions. 4. See Appendix for definition of the Mixed-Use property type. 5. Represents the weighted average of the credit spread as of June 30, 2017 for the floating rate loans and the coupon for the fixed rate loans. Note: As of June 30, 2017. The above shown loans do not represent all TRTX investments. Not all TRTX investments have or will have similar experiences or results, and there should be no assumption that the investments listed above will continue to perform. Excludes CMBS investments. 21
|
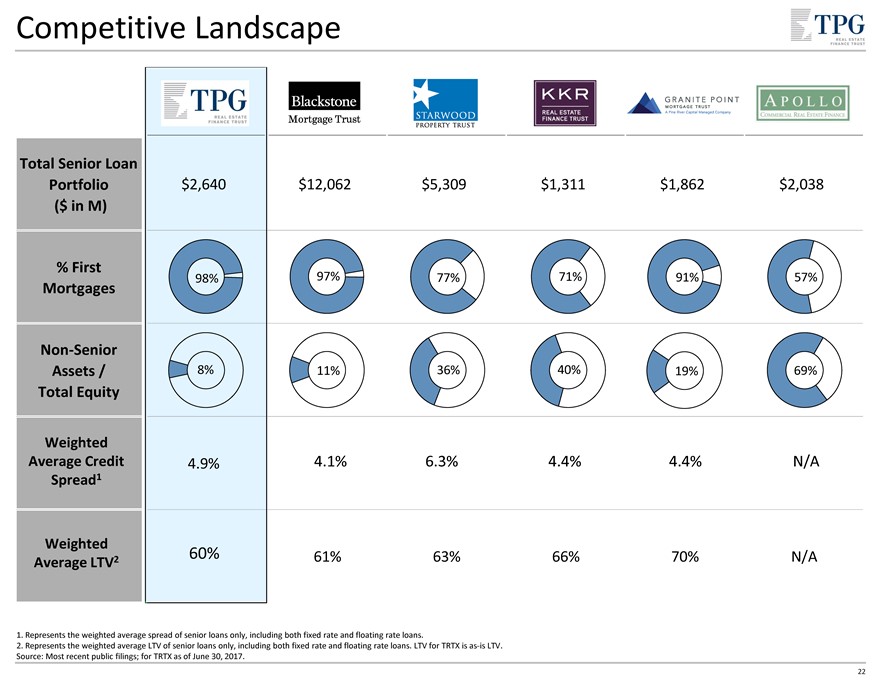
Competitive Landscape Total Senior Loan Portfolio $2,640 $12,062 $5,309 $1,311 $1,862 $2,038 ($ in M) % First 98% 97% 77% 71% 91% 57% Mortgages Non-Senior Assets / 8% 11% 36% 40% 19% 69% Total Equity Weighted Average Credit 4.9% 4.1% 6.3% 4.4% 4.4% N/A Spread1 Weighted 2 60% 61% 63% 66% 70% N/A Average LTV 1. Represents the weighted average spread of senior loans only, including both fixed rate and floating rate loans. 2. Represents the weighted average LTV of senior loans only, including both fixed rate and floating rate loans. LTV for TRTX is as-is LTV. Source: Most recent public filings; for TRTX as of June 30, 2017. 22
|
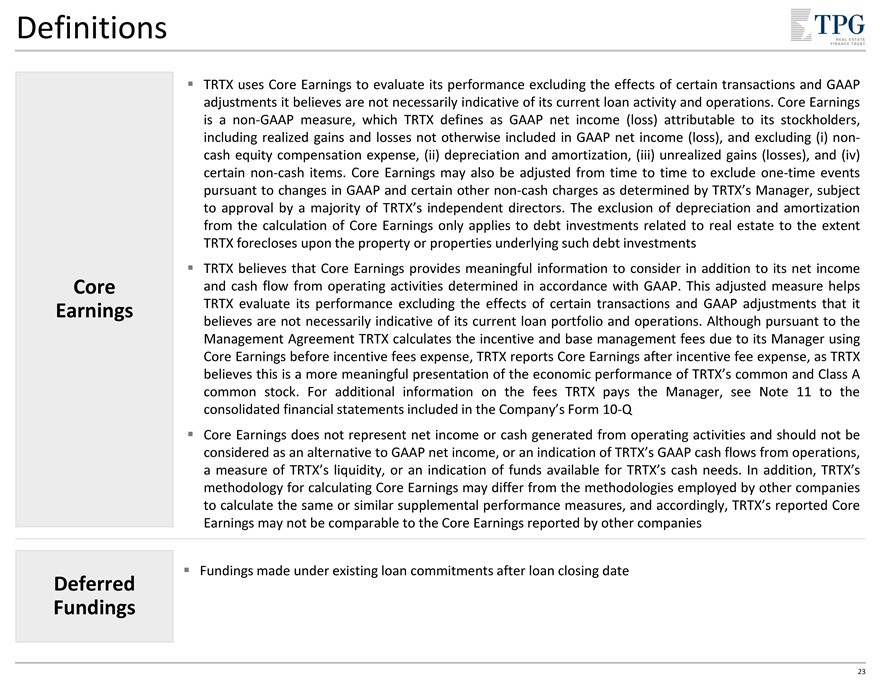
Definitions TRTX uses Core Earnings to evaluate its performance excluding the effects of certain transactions and GAAP adjustments it believes are not necessarily indicative of its current loan activity and operations. Core Earnings is a non-GAAP measure, which TRTX defines as GAAP net income (loss) attributable to its stockholders, including realized gains and losses not otherwise included in GAAP net income (loss), and excluding (i) non-cash equity compensation expense, (ii) depreciation and amortization, (iii) unrealized gains (losses), and (iv) certain non-cash items. Core Earnings may also be adjusted from time to time to exclude one-time events pursuant to changes in GAAP and certain other non-cash charges as determined by TRTX’s Manager, subject to approval by a majority of TRTX’s independent directors. The exclusion of depreciation and amortization from the calculation of Core Earnings only applies to debt investments related to real estate to the extent TRTX forecloses upon the property or properties underlying such debt investments TRTX believes that Core Earnings provides meaningful information to consider in addition to its net income and cash flow from operating activities determined in accordance with GAAP. This adjusted measure helps TRTX evaluate its performance excluding the effects of certain transactions and GAAP adjustments that it believes are not necessarily indicative of its current loan portfolio and operations. Although pursuant to the Management Agreement TRTX calculates the incentive and base management fees due to its Manager using Core Earnings before incentive fees expense, TRTX reports Core Earnings after incentive fee expense, as TRTX believes this is a more meaningful presentation of the economic performance of TRTX’s common and Class A common stock. For additional information on the fees TRTX pays the Manager, see Note 11 to the consolidated financial statements included in the Company’s Form 10-Q Core Earnings does not represent net income or cash generated from operating activities and should not be considered as an alternative to GAAP net income, or an indication of TRTX’s GAAP cash flows from operations, a measure of TRTX’s liquidity, or an indication of funds available for TRTX’s cash needs. In addition, TRTX’s methodology for calculating Core Earnings may differ from the methodologies employed by other companies to calculate the same or similar supplemental performance measures, and accordingly, TRTX’s reported Core Earnings may not be comparable to the Core Earnings reported by other companies Fundings made under existing loan commitments after loan closing date Core Earnings Deferred Fundings 23
|
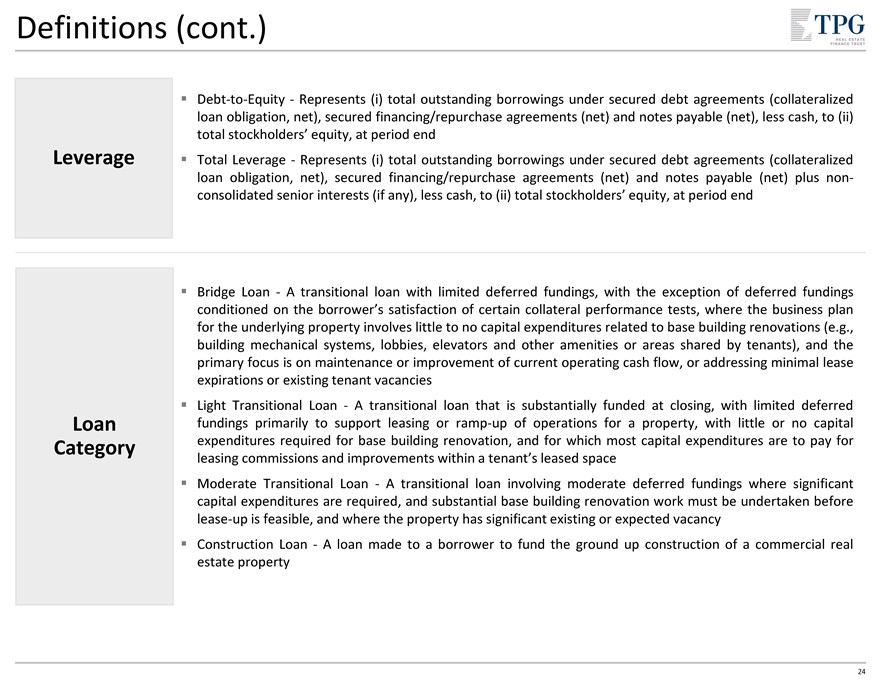
Definitions (cont.) Leverage Debt-to-Equity—Represents (i) total outstanding borrowings under secured debt agreements (collateralized loan obligation, net), secured financing/repurchase agreements (net) and notes payable (net), less cash, to (ii) total stockholders’ equity, at period end Total Leverage—Represents (i) total outstanding borrowings under secured debt agreements (collateralized loan obligation, net), secured financing/repurchase agreements (net) and notes payable (net) plus non-consolidated senior interests (if any), less cash, to (ii) total stockholders’ equity, at period end Loan Category Bridge Loan—A transitional loan with limited deferred fundings, with the exception of deferred fundings conditioned on the borrower’s satisfaction of certain collateral performance tests, where the business plan for the underlying property involves little to no capital expenditures related to base building renovations (e.g., building mechanical systems, lobbies, elevators and other amenities or areas shared by tenants), and the primary focus is on maintenance or improvement of current operating cash flow, or addressing minimal lease expirations or existing tenant vacancies Light Transitional Loan—A transitional loan that is substantially funded at closing, with limited deferred fundings primarily to support leasing or ramp-up of operations for a property, with little or no capital expenditures required for base building renovation, and for which most capital expenditures are to pay for leasing commissions and improvements within a tenant’s leased space Moderate Transitional Loan—A transitional loan involving moderate deferred fundings where significant capital expenditures are required, and substantial base building renovation work must be undertaken before lease-up is feasible, and where the property has significant existing or expected vacancy Construction Loan—A loan made to a borrower to fund the ground up construction of a commercial real estate property 24
|
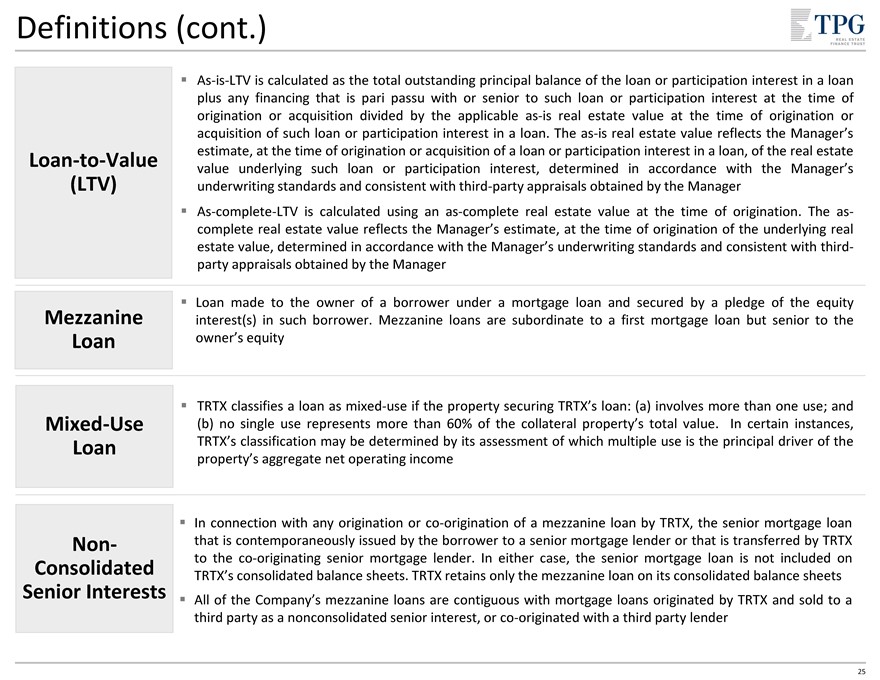
Definitions (cont.) Loan-to-Value (LTV) As-is-LTV is calculated as the total outstanding principal balance of the loan or participation interest in a loan plus any financing that is pari passu with or senior to such loan or participation interest at the time of origination or acquisition divided by the applicable as-is real estate value at the time of origination or acquisition of such loan or participation interest in a loan. The as-is real estate value reflects the Manager’s estimate, at the time of origination or acquisition of a loan or participation interest in a loan, of the real estate value underlying such loan or participation interest, determined in accordance with the Manager’s underwriting standards and consistent with third-party appraisals obtained by the Manager As-complete-LTV is calculated using an as-complete real estate value at the time of origination. The as-complete real estate value reflects the Manager’s estimate, at the time of origination of the underlying real estate value, determined in accordance with the Manager’s underwriting standards and consistent with third-party appraisals obtained by the Manager Loan made to the owner of a borrower under a mortgage loan and secured by a pledge of the equity interest(s) in such borrower. Mezzanine loans are subordinate to a first mortgage loan but senior to the owner’s equity TRTX classifies a loan as mixed-use if the property securing TRTX’s loan: (a) involves more than one use; and (b) no single use represents more than 60% of the collateral property’s total value. In certain instances, TRTX’s classification may be determined by its assessment of which multiple use is the principal driver of the property’s aggregate net operating income In connection with any origination or co-origination of a mezzanine loan by TRTX, the senior mortgage loan that is contemporaneously issued by the borrower to a senior mortgage lender or that is transferred by TRTX to the co-originating senior mortgage lender. In either case, the senior mortgage loan is not included on TRTX’s consolidated balance sheets. TRTX retains only the mezzanine loan on its consolidated balance sheets All of the Company’s mezzanine loans are contiguous with mortgage loans originated by TRTX and sold to a third party as a nonconsolidated senior interest, or co-originated with a third party lender Mezzanine Loan Mixed-Use Loan Non-Consolidated Senior Interests 25
