Attached files
| file | filename |
|---|---|
| 8-K - 8-K - SUNTRUST BANKS INC | a8-kbodybarclays2.htm |

© 2017 SunTrust Banks, Inc. SunTrust is a federally registered trademark of SunTrust Banks, Inc.
2017 BARCLAYS GLOBAL
FINANCIAL SERVICES
CONFERENCE
Aleem Gillani, Chief Financial Officer
September 12, 2017
2
The following should be read in conjunction with the financial statements, notes and other information contained in the Company‟s 2016 Annual Report on Form 10-K, Quarterly Reports on
Form 10-Q, and Current Reports on Form 8-K.
This presentation includes non-GAAP financial measures to describe SunTrust‟s performance. We reconcile those measures to GAAP measures within the presentation or in the appendix. In this
presentation, we present net interest income and net interest margin on a fully taxable-equivalent (“FTE”) basis, and ratios on an annualized basis. The FTE basis adjusts for the tax-favored
status of income from certain loans and investments. We believe this measure to be the preferred industry measurement of net interest income and provides relevant comparison between
taxable and non-taxable amounts.
This presentation contains forward-looking statements. Statements regarding future levels of the efficiency ratio, common equity tier 1 ratio, and technology enhancements are forward-
looking statements. Also, any statement that does not describe historical or current facts is a forward-looking statement. These statements often include the words “believes,” “expects,”
“anticipates,” “estimates,” “intends,” “plans,” “targets,” “strategies,” “goals,” “initiatives,” “opportunity,” “potentially,” “probably,” “projects,” “outlook,” or similar expressions or future
conditional verbs such as “may,” “will,” “should,” “would,” and “could.” Such statements are based upon the current beliefs and expectations of management and on information currently
available to management. They speak as of the date hereof, and we do not assume any obligation to update the statements made herein or to update the reasons why actual results could
differ from those contained in such statements in light of new information or future events.
Forward-looking statements are subject to significant risks and uncertainties. Investors are cautioned against placing undue reliance on such statements. Actual results may differ materially
from those set forth in the forward-looking statements. Factors that could cause actual results to differ materially from those described in the forward-looking statements can be found in Part
I, Item 1A., “Risk Factors,” in our Annual Report on Form 10-K for the year ended December 31, 2016 and in other periodic reports that we file with the SEC. Those factors include: current and
future legislation and regulation could require us to change our business practices, reduce revenue, impose additional costs, or otherwise adversely affect business operations or
competitiveness; we are subject to stringent capital adequacy and liquidity requirements and our failure to meet these would adversely affect our financial condition; the monetary and fiscal
policies of the federal government and its agencies could have a material adverse effect on our earnings; our financial results have been, and may continue to be, materially affected by
general economic conditions, and a deterioration of economic conditions or of the financial markets may materially adversely affect our lending and other businesses and our financial results
and condition; changes in market interest rates or capital markets could adversely affect our revenue and expenses, the value of assets and obligations, and the availability and cost of capital
and liquidity; our earnings may be affected by volatility in mortgage production and servicing revenues, and by changes in carrying values of our servicing assets and mortgages held for sale
due to changes in interest rates; disruptions in our ability to access global capital markets may adversely affect our capital resources and liquidity; we are subject to credit risk; we may have
more credit risk and higher credit losses to the extent that our loans are concentrated by loan type, industry segment, borrower type, or location of the borrower or collateral; we rely on the
mortgage secondary market and GSEs for some of our liquidity; loss of customer deposits could increase our funding costs; any reduction in our credit rating could increase the cost of our
funding from the capital markets; we are subject to litigation, and our expenses related to this litigation may adversely affect our results; we may incur fines, penalties and other negative
consequences from regulatory violations, possibly even inadvertent or unintentional violations; we are subject to certain risks related to originating and selling mortgages, and may be required
to repurchase mortgage loans or indemnify mortgage loan purchasers as a result of breaches of representations and warranties, or borrower fraud, and this could harm our liquidity, results of
operations, and financial condition; we face risks as a servicer of loans; we are subject to risks related to delays in the foreclosure process; consumers and small businesses may decide not to
use banks to complete their financial transactions, which could affect net income; we have businesses other than banking which subject us to a variety of risks; negative public opinion could
damage our reputation and adversely impact business and revenues; we may face more intense scrutiny of our sales, training, and incentive compensation practices; we rely on other
companies to provide key components of our business infrastructure; competition in the financial services industry is intense and we could lose business or suffer margin declines as a result;
we continually encounter technological change and must effectively develop and implement new technology; maintaining or increasing market share depends on market acceptance and
regulatory approval of new products and services; we have in the past and may in the future pursue acquisitions, which could affect costs and from which we may not be able to realize
anticipated benefits; we depend on the expertise of key personnel, and if these individuals leave or change their roles without effective replacements, operations may suffer; we may not be
able to hire or retain additional qualified personnel and recruiting and compensation costs may increase as a result of turnover, both of which may increase costs and reduce profitability and
may adversely impact our ability to implement our business strategies; our framework for managing risks may not be effective in mitigating risk and loss to us; our controls and procedures may
not prevent or detect all errors or acts of fraud; we are at risk of increased losses from fraud; a failure in, or breach of, our operational or security systems or infrastructure, or those of our
third party vendors and other service providers, including as a result of cyber-attacks, could disrupt our businesses, result in the disclosure or misuse of confidential or proprietary information,
damage our reputation, increase our costs and cause losses; the soundness of other financial institutions could adversely affect us; we depend on the accuracy and completeness of information
about clients and counterparties; our accounting policies and processes are critical to how we report our financial condition and results of operation, and they require management to make
estimates about matters that are uncertain; depressed market values for our stock and adverse economic conditions sustained over a period of time may require us to write down some portion
of our goodwill; our financial instruments measured at fair value expose us to certain market risks; our stock price can be volatile; we might not pay dividends on our stock; our ability to
receive dividends from our subsidiaries or other investments could affect our liquidity and ability to pay dividends; and certain banking laws and certain provisions of our articles of
incorporation may have an anti-takeover effect.
IMPORTANT CAUTIONARY STATEMENT
3
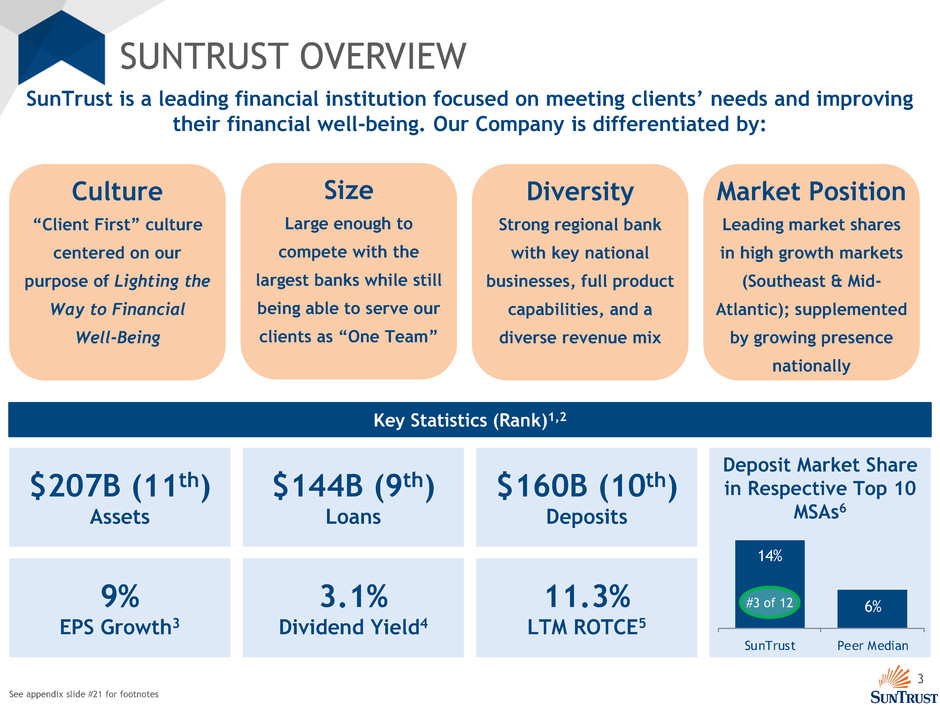
Deposit Market Share
in Respective Top 10
MSAs6 14%
6%
SunTrust Peer Median
SUNTRUST OVERVIEW
SunTrust is a leading financial institution focused on meeting clients’ needs and improving
their financial well-being. Our Company is differentiated by:
Size
Large enough to
compete with the
largest banks while still
being able to serve our
clients as “One Team”
Diversity
Strong regional bank
with key national
businesses, full product
capabilities, and a
diverse revenue mix
Market Position
Leading market shares
in high growth markets
(Southeast & Mid-
Atlantic); supplemented
by growing presence
nationally
Culture
“Client First” culture
centered on our
purpose of Lighting the
Way to Financial
Well-Being
Key Statistics (Rank)1,2
9%
EPS Growth3
3.1%
Dividend Yield4
$207B (11th)
Assets
$160B (10th)
Deposits
$144B (9th)
Loans
11.3%
LTM ROTCE5
#3 of 12
See appendix slide #21 for footnotes
4
GEOGRAPHIC PRESENCE
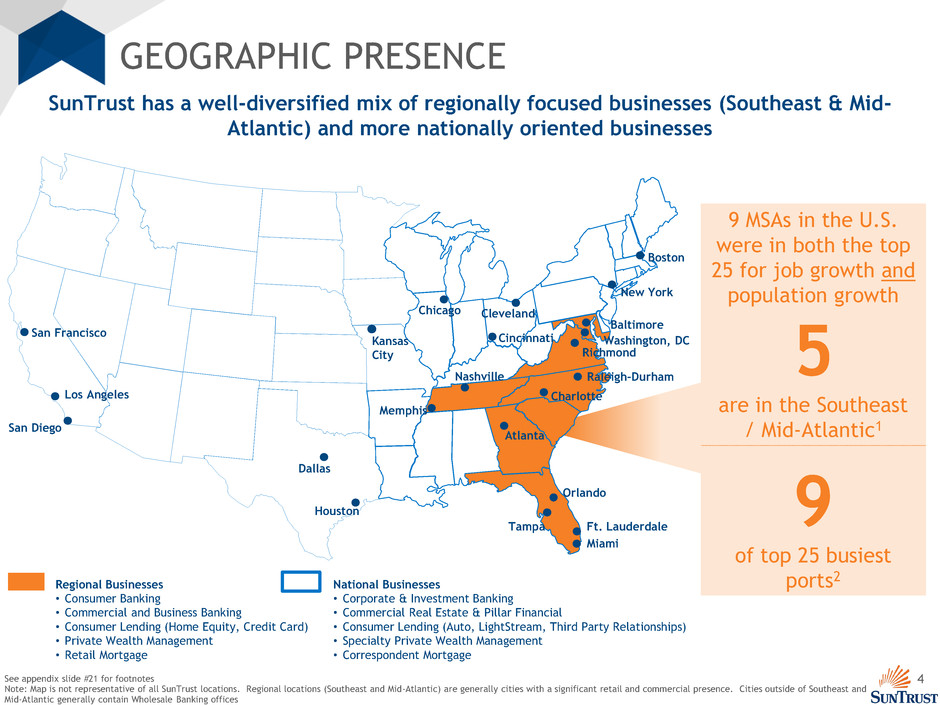
Regional Businesses
• Consumer Banking
• Commercial and Business Banking
• Consumer Lending (Home Equity, Credit Card)
• Private Wealth Management
• Retail Mortgage
National Businesses
• Corporate & Investment Banking
• Commercial Real Estate & Pillar Financial
• Consumer Lending (Auto, LightStream, Third Party Relationships)
• Specialty Private Wealth Management
• Correspondent Mortgage
SunTrust has a well-diversified mix of regionally focused businesses (Southeast & Mid-
Atlantic) and more nationally oriented businesses
See appendix slide #21 for footnotes
Note: Map is not representative of all SunTrust locations. Regional locations (Southeast and Mid-Atlantic) are generally cities with a significant retail and commercial presence. Cities outside of Southeast and
Mid-Atlantic generally contain Wholesale Banking offices
Los Angeles
San Francisco
Dallas
Houston
Atlanta
Orlando
Miami
Tampa
Chicago
Nashville
Memphis
Charlotte
Richmond
Baltimore
New York
Boston
Ft. Lauderdale
Raleigh-Durham
Washington, DC
San Diego
Kansas
City
Cleveland
Cincinnati
9 MSAs in the U.S.
were in both the top
25 for job growth and
population growth
5
are in the Southeast
/ Mid-Atlantic1
9
of top 25 busiest
ports2
5
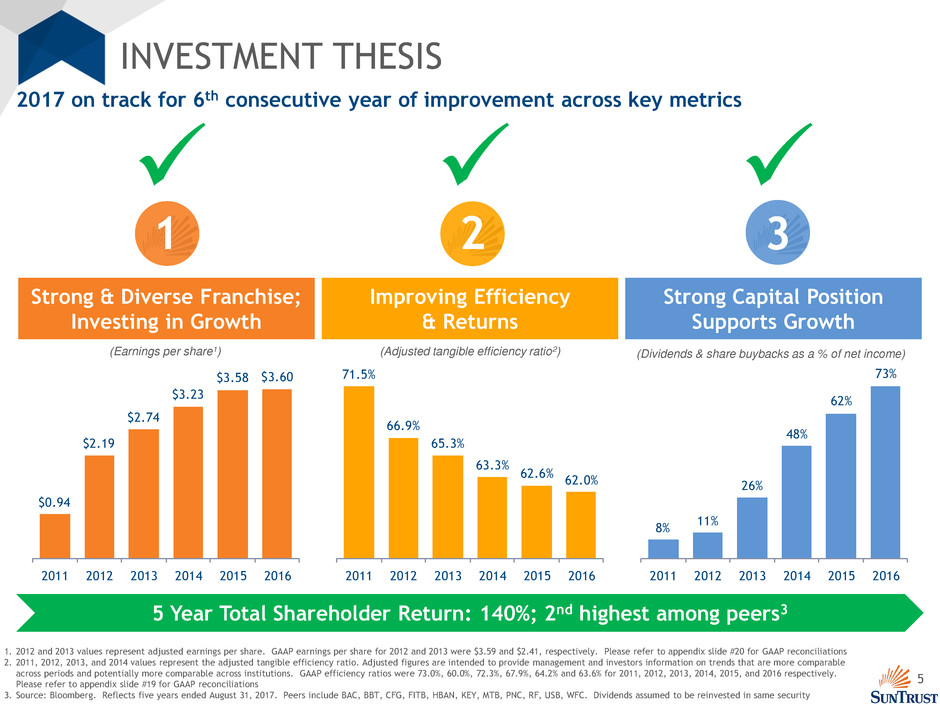
8%
11%
26%
48%
62%
73%
2011 2012 2013 2014 2015 2016
INVESTMENT THESIS
2017 on track for 6th consecutive year of improvement across key metrics
Strong & Diverse Franchise;
Investing in Growth
Improving Efficiency
& Returns
Strong Capital Position
Supports Growth
(Dividends & share buybacks as a % of net income)
1 3 2
$0.94
$2.19
$2.74
$3.23
$3.58 $3.60
2011 2012 2013 2014 2015 2016
71.5%
66.9%
65.3%
63.3%
62.6%
62.0%
2011 2012 2013 2014 2015 2016
(Adjusted tangible efficiency ratio2) (Earnings per share1)
1. 2012 and 2013 values represent adjusted earnings per share. GAAP earnings per share for 2012 and 2013 were $3.59 and $2.41, respectively. Please refer to appendix slide #20 for GAAP reconciliations
2. 2011, 2012, 2013, and 2014 values represent the adjusted tangible efficiency ratio. Adjusted figures are intended to provide management and investors information on trends that are more comparable
across periods and potentially more comparable across institutions. GAAP efficiency ratios were 73.0%, 60.0%, 72.3%, 67.9%, 64.2% and 63.6% for 2011, 2012, 2013, 2014, 2015, and 2016 respectively.
Please refer to appendix slide #19 for GAAP reconciliations
3. Source: Bloomberg. Reflects five years ended August 31, 2017. Peers include BAC, BBT, CFG, FITB, HBAN, KEY, MTB, PNC, RF, USB, WFC. Dividends assumed to be reinvested in same security
5 Year Total Shareholder Return: 140%; 2nd highest among peers3
STRONG & DIVERSE
FRANCHISE
Investing in Growth
1
7
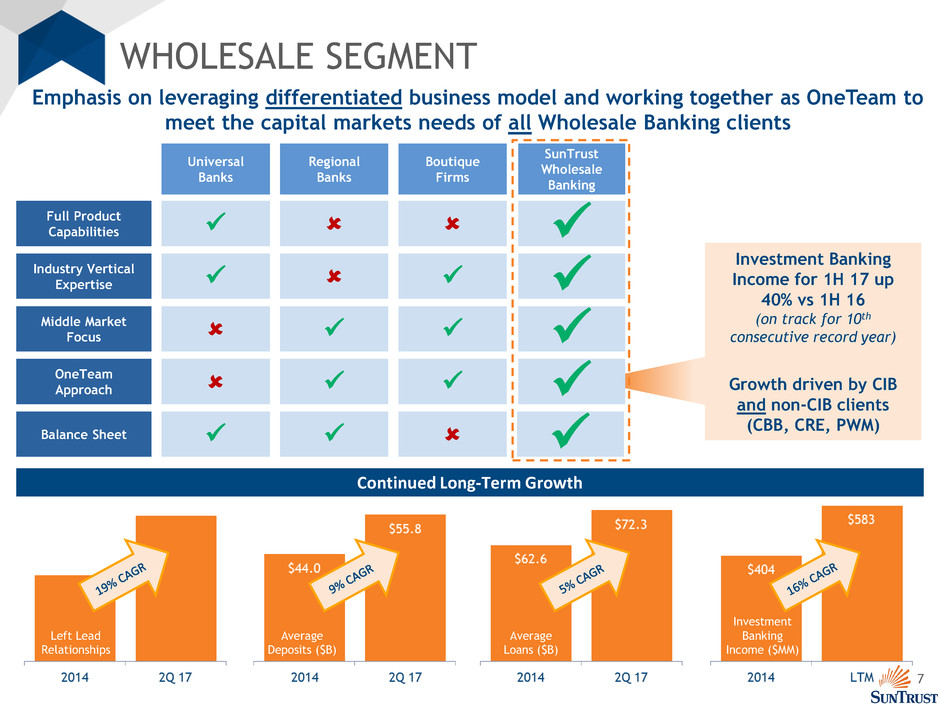
WHOLESALE SEGMENT
Full Product
Capabilities
Industry Vertical
Expertise
Middle Market
Focus
OneTeam
Approach
Balance Sheet
Universal
Banks
Regional
Banks
Boutique
Firms
SunTrust
Wholesale
Banking
Investment Banking
Income for 1H 17 up
40% vs 1H 16
(on track for 10th
consecutive record year)
Growth driven by CIB
and non-CIB clients
(CBB, CRE, PWM)
Continued Long-Term Growth
Left Lead
Relationships
Average
Loans ($B)
Average
Deposits ($B)
Investment
Banking
Income ($MM)
Emphasis on leveraging differentiated business model and working together as OneTeam to
meet the capital markets needs of all Wholesale Banking clients
8
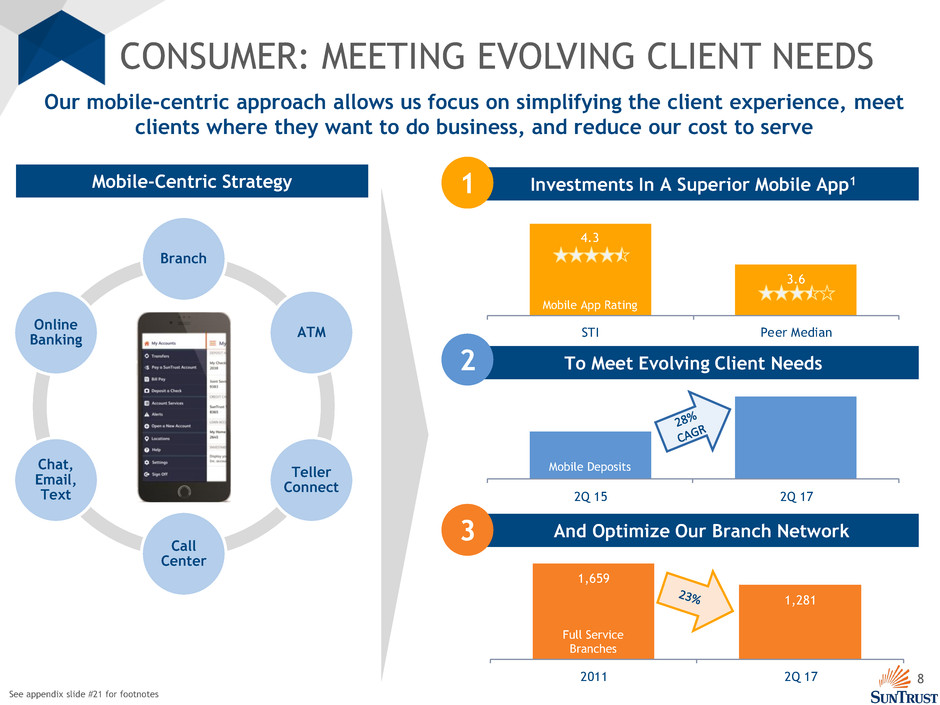
CONSUMER: MEETING EVOLVING CLIENT NEEDS
Branch
ATM
Teller
Connect
Call
Center
Chat,
Email,
Text
Online
Banking
Our mobile-centric approach allows us focus on simplifying the client experience, meet
clients where they want to do business, and reduce our cost to serve
Mobile-Centric Strategy
See appendix slide #21 for footnotes
Investments In A Superior Mobile App1 1 4.3
3.6
STI Peer Median
Mobile App Rating
And Optimize Our Branch Network 3 1,659
1,281
2011 2Q 17
Full Service
Branches
To Meet Evolving Client Needs 2
2Q 15 2Q 17
Mobile Deposits
9
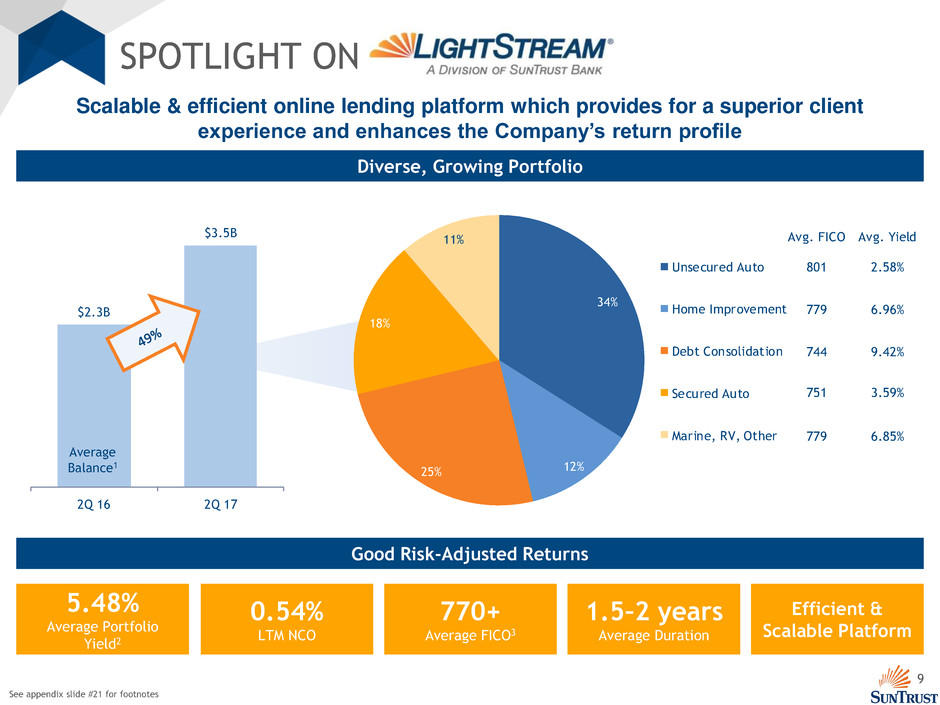
Unsecured Auto
Home Improvement
Debt Consolidation
Secured Auto
Marine, RV, Other
SPOTLIGHT ON
See appendix slide #21 for footnotes
$2.3B
$3.5B
2Q 16 2Q 17
Diverse, Growing Portfolio
Average
Balance1
Scalable & efficient online lending platform which provides for a superior client
experience and enhances the Company’s return profile
34%
12%25%
18%
11%
Good Risk-Adjusted Returns
5.48%
Average Portfolio
Yield2
0.54%
LTM NCO
770+
Average FICO3
1.5–2 years
Average Duration
Efficient &
Scalable Platform
Avg. FICO Avg. Yield
801 2.58%
779 6.96%
744 9.42%
751 3.59%
779 6.85%
10
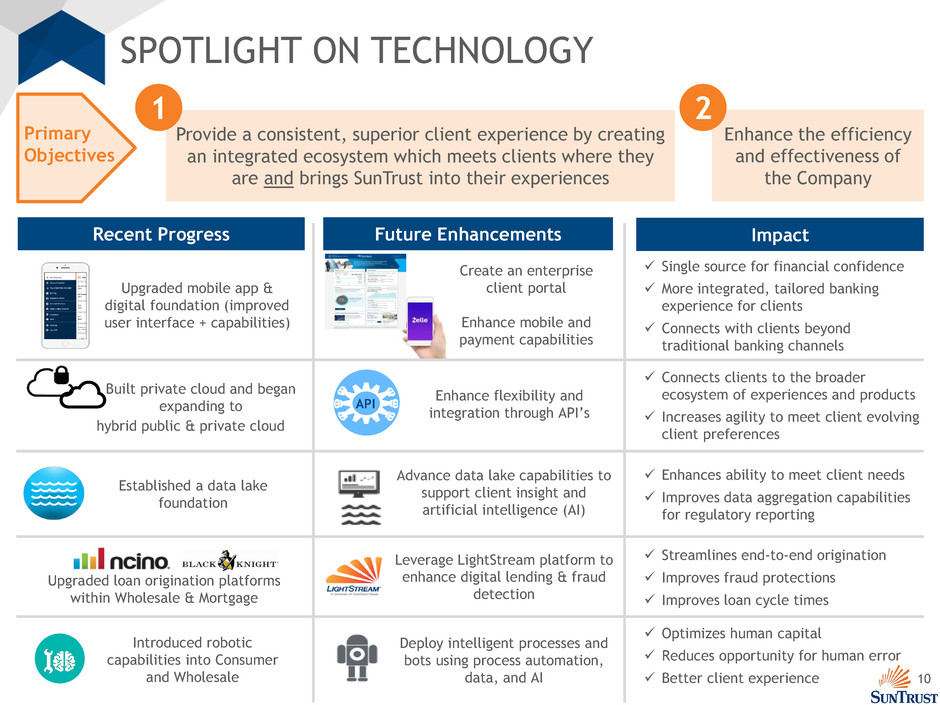
Established a data lake
foundation
Recent Progress
Upgraded mobile app &
digital foundation (improved
user interface + capabilities)
Upgraded loan origination platforms
within Wholesale & Mortgage
Built private cloud and began
expanding to
hybrid public & private cloud
Introduced robotic
capabilities into Consumer
and Wholesale
Advance data lake capabilities to
support client insight and
artificial intelligence (AI)
Future Enhancements
Create an enterprise
client portal
Enhance mobile and
payment capabilities
Leverage LightStream platform to
enhance digital lending & fraud
detection
Enhance flexibility and
integration through API‟s
Deploy intelligent processes and
bots using process automation,
data, and AI
API
SPOTLIGHT ON TECHNOLOGY
Provide a consistent, superior client experience by creating
an integrated ecosystem which meets clients where they
are and brings SunTrust into their experiences
1
Enhance the efficiency
and effectiveness of
the Company
2
Enhances ability to meet client needs
Improves data aggregation capabilities
for regulatory reporting
Impact
Single source for financial confidence
More integrated, tailored banking
experience for clients
Connects with clients beyond
traditional banking channels
Streamlines end-to-end origination
Improves fraud protections
Improves loan cycle times
Optimizes human capital
Reduces opportunity for human error
Better client experience
Connects clients to the broader
ecosystem of experiences and products
Increases agility to meet client evolving
client preferences
Primary
Objectives
IMPROVING
EFFICIENCY &
RETURNS
2
12
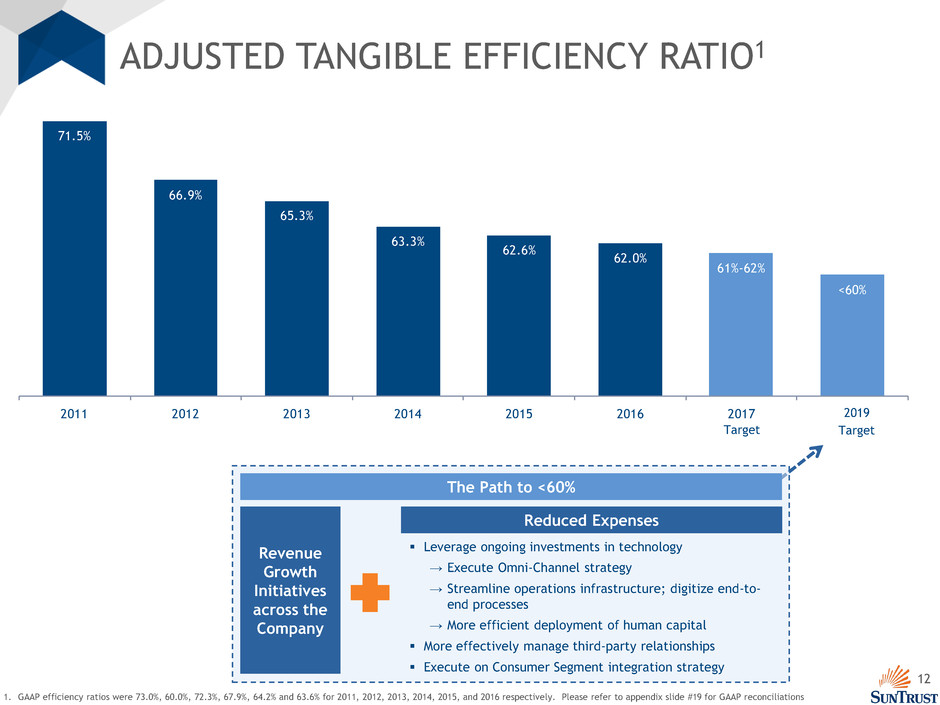
ADJUSTED TANGIBLE EFFICIENCY RATIO1
Revenue
Growth
Initiatives
across the
Company
Leverage ongoing investments in technology
→ Execute Omni-Channel strategy
→ Streamline operations infrastructure; digitize end-to-
end processes
→ More efficient deployment of human capital
More effectively manage third-party relationships
Execute on Consumer Segment integration strategy
The Path to <60%
Reduced Expenses
71.5%
66.9%
65.3%
63.3%
62.6%
62.0%
61%-62%
<60%
2011 2012 2013 2014 2015 2016 2017
2019
Target
1. GAAP efficiency ratios were 73.0%, 60.0%, 72.3%, 67.9%, 64.2% and 63.6% for 2011, 2012, 2013, 2014, 2015, and 2016 respectively. Please refer to appendix slide #19 for GAAP reconciliations
Target
13
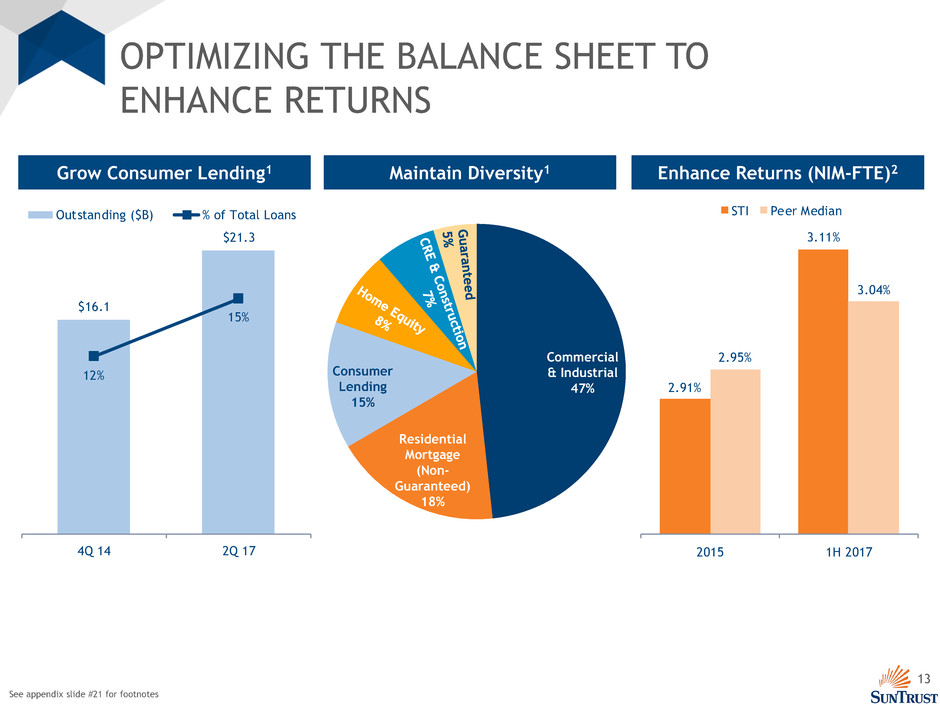
$16.1
$21.3
12%
15%
4Q 14 2Q 17
Outstanding ($B) % of Total Loans
OPTIMIZING THE BALANCE SHEET TO
ENHANCE RETURNS
See appendix slide #21 for footnotes
Commercial
& Industrial
47%
Residential
Mortgage
(Non-
Guaranteed)
18%
Consumer
Lending
15%
Grow Consumer Lending1 Enhance Returns (NIM-FTE)2 Maintain Diversity1
2.91%
3.11%
2.95%
3.04%
2015 1H 2017
STI Peer Median
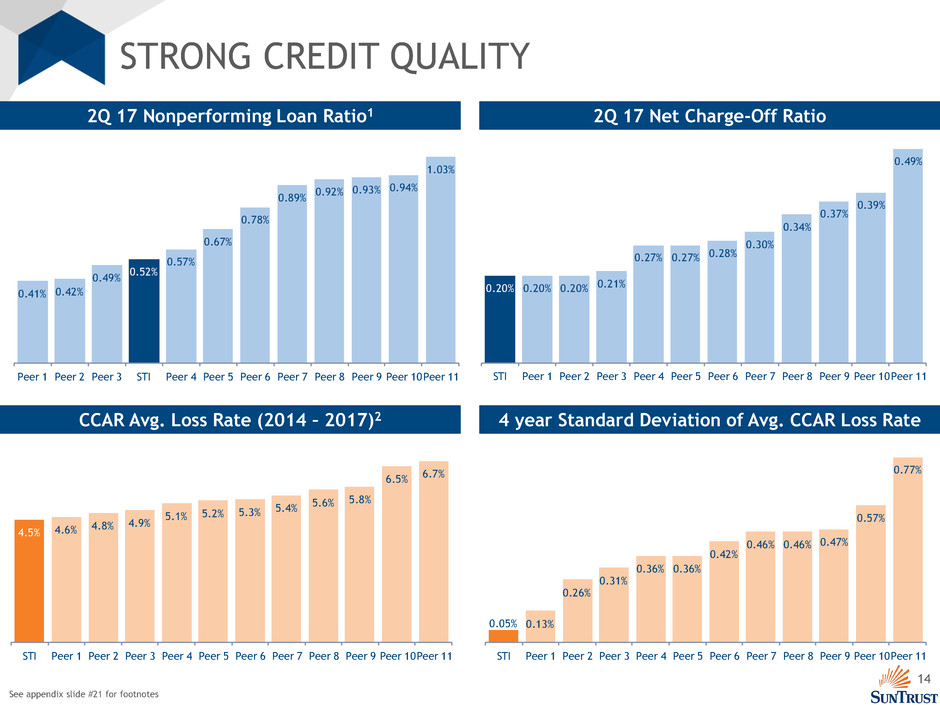
14
0.05% 0.13%
0.26%
0.31%
0.36% 0.36%
0.42%
0.46% 0.46% 0.47%
0.57%
0.77%
STI Peer 1 Peer 2 Peer 3 Peer 4 Peer 5 Peer 6 Peer 7 Peer 8 Peer 9 Peer 10Peer 11
STRONG CREDIT QUALITY
See appendix slide #21 for footnotes
2Q 17 Nonperforming Loan Ratio1 2Q 17 Net Charge-Off Ratio
0.41% 0.42%
0.49%
0.52%
0.57%
0.67%
0.78%
0.89%
0.92% 0.93% 0.94%
1.03%
Peer 1 Peer 2 Peer 3 STI Peer 4 Peer 5 Peer 6 Peer 7 Peer 8 Peer 9 Peer 10Peer 11
0.20% 0.20% 0.20% 0.21%
0.27% 0.27% 0.28%
0.30%
0.34%
0.37%
0.39%
0.49%
STI Peer 1 Peer 2 Peer 3 Peer 4 Peer 5 Peer 6 Peer 7 Peer 8 Peer 9 Peer 10Peer 11
CCAR Avg. Loss Rate (2014 – 2017)2 4 year Standard Deviation of Avg. CCAR Loss Rate
4.5% 4.6%
4.8% 4.9%
5.1% 5.2% 5.3%
5.4%
5.6% 5.8%
6.5%
6.7%
STI Peer 1 Peer 2 Peer 3 Peer 4 Peer 5 Peer 6 Peer 7 Peer 8 Peer 9 Peer 10Peer 11
3
STRONG CAPITAL
POSITION
SUPPORTS GROWTH
16
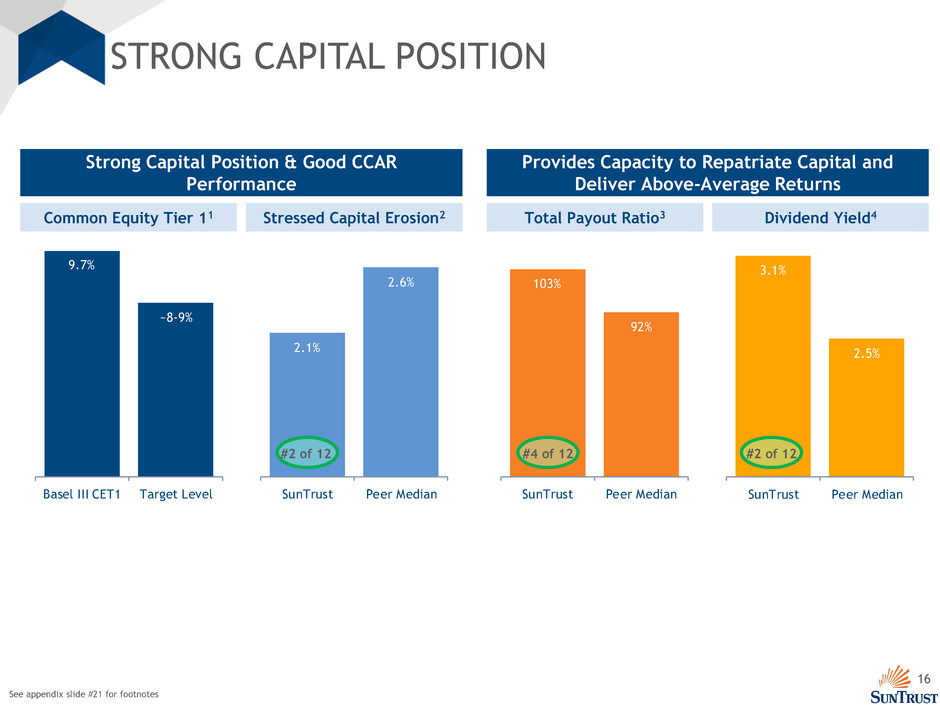
STRONG CAPITAL POSITION
103%
92%
SunTrust Peer Median
3.1%
2.5%
SunTrust Peer Median
Total Payout Ratio3 Dividend Yield4
#4 of 12 #2 of 12
Provides Capacity to Repatriate Capital and
Deliver Above-Average Returns
Common Equity Tier 11 Stressed Capital Erosion2
2.1%
2.6%
SunTrust Peer Median
#2 of 12
Strong Capital Position & Good CCAR
Performance
9.7%
~8-9%
Basel III CET1 Target Level
See appendix slide #21 for footnotes
17
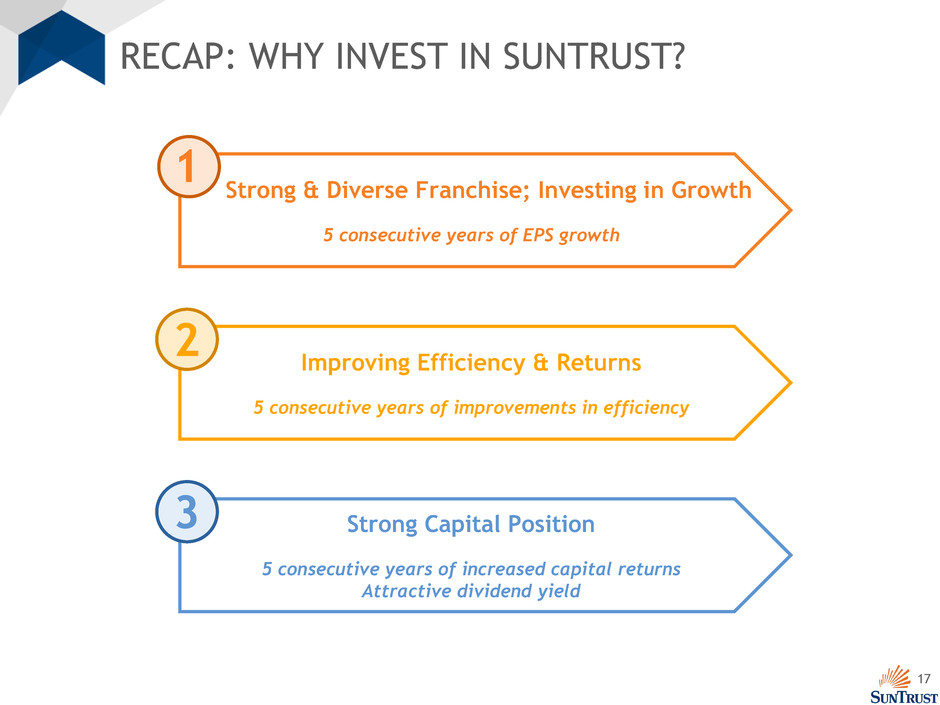
RECAP: WHY INVEST IN SUNTRUST?
Strong & Diverse Franchise; Investing in Growth
5 consecutive years of EPS growth
1
Improving Efficiency & Returns
5 consecutive years of improvements in efficiency
2
Strong Capital Position
5 consecutive years of increased capital returns
Attractive dividend yield
3

APPENDIX
19
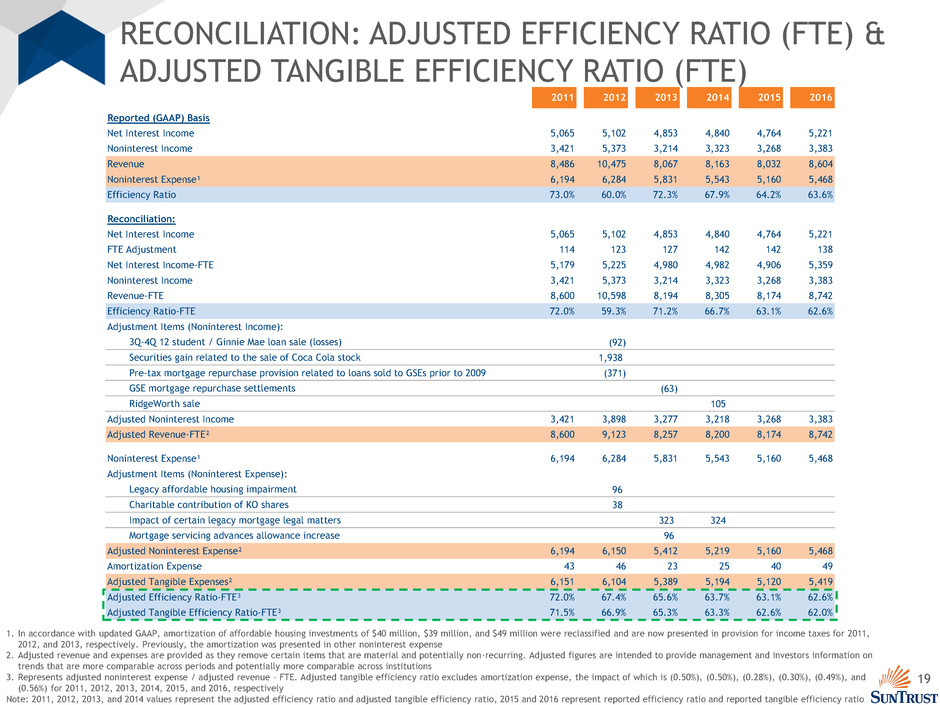
RECONCILIATION: ADJUSTED EFFICIENCY RATIO (FTE) &
ADJUSTED TANGIBLE EFFICIENCY RATIO (FTE)
1. In accordance with updated GAAP, amortization of affordable housing investments of $40 million, $39 million, and $49 million were reclassified and are now presented in provision for income taxes for 2011,
2012, and 2013, respectively. Previously, the amortization was presented in other noninterest expense
2. Adjusted revenue and expenses are provided as they remove certain items that are material and potentially non-recurring. Adjusted figures are intended to provide management and investors information on
trends that are more comparable across periods and potentially more comparable across institutions
3. Represents adjusted noninterest expense / adjusted revenue – FTE. Adjusted tangible efficiency ratio excludes amortization expense, the impact of which is (0.50%), (0.50%), (0.28%), (0.30%), (0.49%), and
(0.56%) for 2011, 2012, 2013, 2014, 2015, and 2016, respectively
Note: 2011, 2012, 2013, and 2014 values represent the adjusted efficiency ratio and adjusted tangible efficiency ratio, 2015 and 2016 represent reported efficiency ratio and reported tangible efficiency ratio
2011 2012 2013 2014 2015 2016
Reported (GAAP) Basis
Net Interest Income 5,065 5,102 4,853 4,840 4,764 5,221
Noninterest Income 3,421 5,373 3,214 3,323 3,268 3,383
Revenue 8,486 10,475 8,067 8,163 8,032 8,604
Noninterest Expense¹ 6,194 6,284 5,831 5,543 5,160 5,468
Efficiency Ratio 73.0% 60.0% 72.3% 67.9% 64.2% 63.6%
Reconciliation:
Net Interest Income 5,065 5,102 4,853 4,840 4,764 5,221
FTE Adjustment 114 123 127 142 142 138
Net Interest Income-FTE 5,179 5,225 4,980 4,982 4,906 5,359
Noninterest Income 3,421 5,373 3,214 3,323 3,268 3,383
Revenue-FTE 8,600 10,598 8,194 8,305 8,174 8,742
Efficiency Ratio-FTE 72.0% 59.3% 71.2% 66.7% 63.1% 62.6%
Adjustment Items (Noninterest Income):
3Q-4Q 12 student / Ginnie Mae loan sale (losses) (92)
Securities gain related to the sale of Coca Cola stock 1,938
Pre-tax mortgage repurchase provision related to loans sold to GSEs prior to 2009 (371)
GSE mortgage repurchase settlements (63)
RidgeWorth sale 105
Adjusted Noninterest Income 3,421 3,898 3,277 3,218 3,268 3,383
Adjusted Revenue-FTE² 8,600 9,123 8,257 8,200 8,174 8,742
Noninterest Expense¹ 6,194 6,284 5,831 5,543 5,160 5,468
Adjustment Items (Noninterest Expense):
Legacy affordable housing impairment 96
Charitable contribution of KO shares 38
Impact of certain legacy mortgage legal matters 323 324
Mortgage servicing advances allowance increase 96
Adjusted Noninterest Expense² 6,194 6,150 5,412 5,219 5,160 5,468
Amortization Expense 43 46 23 25 40 49
Adjusted Tangible Expenses² 6,151 6,104 5,389 5,194 5,120 5,419
Adjusted Efficiency Ratio-FTE³ 72.0% 67.4% 65.6% 63.7% 63.1% 62.6%
Adjusted Tangible Efficiency Ratio-FTE³ 71.5% 66.9% 65.3% 63.3% 62.6% 62.0%
20
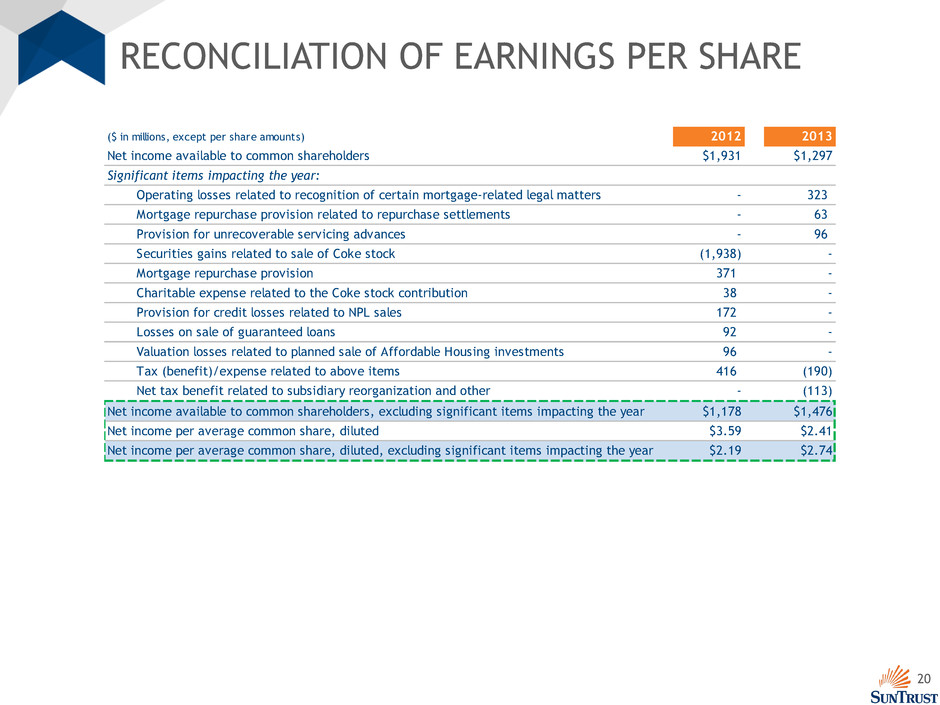
RECONCILIATION OF EARNINGS PER SHARE
($ in millions, except per share amounts) 2012 2013
Net income available to common shareholders $1,931 $1,297
Significant items impacting the year:
Operating losses related to recognition of certain mortgage-related legal matters - 323
Mortgage repurchase provision related to repurchase settlements - 63
Provision for unrecoverable servicing advances - 96
Securities gains related to sale of Coke stock (1,938) -
Mortgage repurchase provision 371 -
Charitable expense related to the Coke stock contribution 38 -
Provision for credit losses related to NPL sales 172 -
Losses on sale of guaranteed loans 92 -
Valuation losses related to planned sale of Affordable Housing investments 96 -
Tax (benefit)/expense related to above items 416 (190)
Net tax benefit related to subsidiary reorganization and other - (113)
Net income available to common shareholders, excluding significant items impacting the year $1,178 $1,476
Net income per average common share, diluted $3.59 $2.41
Net income per average common share, diluted, excluding significant items impacting the year $2.19 $2.74

21
FOOTNOTES
Slide #3:
1. Assets, loans, and deposits as of June 30, 2017
2. Rank is amongst U.S. bank holding companies and excludes non-traditional banks. Asset and loan rankings are sourced via bank holding company regulatory filings (Y-9C) and are as of June 30, 2017. Deposit
rankings are sourced via FDIC deposit market share data, and are as of June 30, 2016, pro-forma for completed and pending mergers and acquisitions
3. Represents percent growth from 1H 16 to 1H 17
4. As of September 7, 2017
5. Return on average common shareholders‟ equity was 8.3% for the 12 months ended June 30, 2017. The effect of excluding intangible assets, excluding MSRs, was 3.1%
6. Source: SNL Financial, as of June 30, 2016, based on top 10 MSAs (by deposits) for each institution, pro-forma for completed and pending mergers and acquisitions. Numerator is company‟s total deposits in its top
10 MSAs and denominator is total deposits in those 10 MSAs
Slide #4:
1. Source: Census Bureau and Bureau of Labor Statistics. Represents the MSAs with the highest population growth percentages from FY 2010 to 2016 and with the fastest job growth from June 2009 to July 2017
2. Source: Bureau of Transportation Statistics. Represents water ports with the most containerized cargo tonage
Slide #8:
1. Source: iOS and Android app store. Represents the average between iOS and Android ratings
Slide #13:
1. Data as of June 30, 2017. Consumer Lending includes consumer direct loans (other than student guaranteed), consumer indirect loans and consumer credit cards. Guaranteed includes guaranteed student loans
and guaranteed residential mortgages. Construction includes both commercial and residential construction. Note: totals may not foot due to rounding
2. Source: SNL Financial
All Slides:
Note: „LTM‟ refers to the 12 months ended June 30, 2017. Peer group includes BAC, BBT, CFG, FITB, HBAN, KEY, MTB, PNC, RF, USB, WFC
Slide #14:
1. Represents nonaccrual loans divided by total loans (excluding loans held for sale). Source: SNL Financial as of June 30, 2017
2. Source: Federal Reserve (http://www.federalreserve.gov/bankinforeg/dfa-stress-tests.htm). Represents Federal Reserve‟s estimate of loan losses over 9 quarters (as a % of average total loans) in a severely
adverse economic scenario
Slide #9:
1. LightStream portfolio average balances for 2Q 16 and 2Q 17
2. For the three months ended June 30, 2017. Rates range from 2.19% to 17.49% depending on loan purpose, amount, term and credit profile
3. Represents FICO at the time of origination
Slide #16
1. Basel III fully phased-in CET1 was estimated to be 9.5% as of June 30, 2017. However, on August 22, 2017, the US Regulatory Agencies issued a notice of proposed rulemaking applicable to banking organizations
not subject to the Advanced Approaches rules (including SunTrust) that would extend the current capital / risk weighting treatment of MSRs and other capital adjustments indefinitely. Therefore, the method for
calculating adjustments from transitional to fully phased-in may change and could modestly increase SunTrust‟s fully phased-in capital ratios
2. Represents the difference between the starting and minimum Basel III Common Equity Tier 1 Ratios resulting from the Federal Reserve‟s 2017 CCAR severely adverse scenario. Following the release of 2017
DFAST Results, SunTrust investigated the driver of $1.1B in „other losses‟ projected by the FRB. This loss resulted from a conservative interpretation of regulatory reporting requirements, which has since been
adjusted. Going forward this loss is expected to be ~$0.1B. Therefore, $1.0 billion of losses are excluded from the capital erosion in the 2017 DFAST results, which reduces stressed capital erosion to 2.1% from
2.5%
3. Payout Ratio = (Common Stock Dividends and Share Repurchases) / Net Income Available to Common Shareholders. Source: Barclays Research CCAR 2017 Review: $132bn of Capital to Be Returned Over Next 4
Quarters
4. As of September 7, 2017
